Zip Codes with the Lowest Population Density in New Haven, MI
On this page
RELATED REPORTS & OPTIONS
Lowest Population Density
Population
Highest PopulationHighest Population DensityLowest Population DensityMale / Female RatioFemale / Male RatioOldest PopulationOldest Population | MaleOldest Population | FemaleYoungest PopulationYoungest Population | MaleYoungest Population | Female
Families and Households
Female Fertility
Highest Birth Rate | All WomenHighest Birth Rate | Below PovertyHighest Birth Rate | Public IncomeHighest Birth Rate | In Labor ForceLowest Birth Rate | All WomenLowest Birth Rate | Below PovertyLowest Birth Rate | Public IncomeLowest Birth Rate | In Labor Force
Race (Community Size)
Race (Percentage)
Ancestry (Community Size)
AmericanArabBelgianCherokeeChippewaDutchEastern EuropeanEnglishEuropeanFinnishFrenchFrench CanadianGermanGreekIrishItalianLebaneseNorwegianPolishPuerto RicanScottishSwedishUkrainian
Ancestry (Percentage)
AmericanArabBelgianCherokeeChippewaDutchEastern EuropeanEnglishEuropeanFinnishFrenchFrench CanadianGermanGreekIrishItalianLebaneseNorwegianPolishPuerto RicanScottishSwedishUkrainian
Immigrant Origin (Total)
Immigrant Origin (Percentage)
Income
Highest Per Capita IncomeHighest Earnings | MaleHighest Earnings | FemaleHighest Wage/Income Gap ($)Highest Wage/Income Gap (%)Highest Inequality / Gini IndexLowest Per Capita IncomeLowest Earnings | MaleLowest Earnings | FemaleLowest Wage/Income Gap ($)Lowest Wage/Income Gap (%)Lowest Inequality / Gini Index
Income (Families)
Income (Households)
Highest Household IncomeLowest Household IncomeHousehold Income | $0-10kHousehold Income | $200k+Household Income | $100k+
Poverty
Highest PovertyHighest Poverty | MaleHighest Poverty | FemaleHighest Poverty | Female 18-24Highest Poverty | Seniors 65+Lowest PovertyLowest Poverty | MaleLowest Poverty | FemaleLowest Poverty | Seniors 65+
Unemployment
Highest UnemploymentHighest Unemployment | MaleHighest Unemployment | Youth < 25Lowest UnemploymentLowest Unemployment | MaleLowest Unemployment | Youth < 25
Employment Occupations
Architecture & EngineeringArts, Media & EntertainmentBusiness & FinancialCleaning & MaintenanceCommunity & Social Service Computer, Engineering & ScienceConstruction & ExtractionEducation Instruction & LibraryFood Preparation & ServingHealth Diagnosing & TreatingHealth TechnologistsHealthcare SupportInstallation, Maintenance & RepairManagementOffice & AdministrationProductionSales & RelatedTransportation
Employment Industries
Accommodation & Food ServicesAdministrative & Support ServicesArts, Entertainment & RecreationConstructionEducational ServicesFinance & InsuranceHealth Care & Social AssistanceInformation & TechnologyManufacturingProfessional & Scientific ServicesPublic AdministrationReal Estate, Rental & LeasingRetail TradeTransportation & WarehousingWholesale Trade
Employer Class
Private Company EmployeesSelf-Employed / IncorporatedSelf-Employed / Not IncorporatedNot-for-profit OrganizationsLocal Government EmployeesFederal Government Employees
Commute Time
Longest CommuteLongest Commute | MaleLongest Commute | FemaleShortest CommuteShortest Commute | MaleShortest Commute | Female
Commute Means
School Enrollment
Education by Degree Field
Computers and MathematicsBio, Nature & AgriculturalPhysical and Health SciencesPsychologyEngineeringScience and EngineeringBusinessEducationLiberal Arts and HistoryCommunications
Occupancy
Finances
Highest Median Housing CostsHighest Property PricesHighest Owner Housing CostsHighest Renter Housing CostsHighest Housing Costs / IncomeLowest Median Housing CostsLowest Property PricesLowest Owner Housing CostsLowest Renter Housing CostsLowest Housing Costs / Income
Physical Characteristics
New Haven
States
AlabamaAlaskaArizonaArkansasCaliforniaColoradoConnecticutDelawareDistrict Of ColumbiaFloridaGeorgiaHawaiiIdahoIllinoisIndianaIowaKansasKentuckyLouisianaMaineMarylandMassachusettsMichiganMinnesotaMississippiMissouriMontanaNebraskaNevadaNew HampshireNew JerseyNew MexicoNew YorkNorth CarolinaNorth DakotaOhioOklahomaOregonPennsylvaniaPuerto RicoRhode IslandSouth CarolinaSouth DakotaTennesseeTexasUtahVermontVirginiaWashingtonWest VirginiaWisconsinWyoming
Michigan Cities
Ann ArborBattle CreekBay CityBerrien SpringsBloomfield HillsBrightonBurtonCantonClarkstonClinton TownshipDearbornDearborn HeightsDetroitEast LansingFarmingtonFlintGrand RapidsGrosse PointeHighlandHollandHowellJacksonKalamazooKincheloeLake OrionLansingLivoniaMacombMidlandMilfordMonroeMount PleasantMuskegonNew BaltimoreNew HavenNorthvilleNoviOxfordPontiacPortageRedfordRochesterRoyal OakSaginawSaint Clair ShoresSouthfieldSterling HeightsTraverse CityTroyUticaWarrenWashingtonWaterfordWest BloomfieldWestlandWhite LakeWyomingYpsilanti
Compare Zip Codes
Comparison Subject
Compare StatesCompare CitiesCompare Zip Codes
Map of Zip Codes with the Lowest Population Density in New Haven
532.6
76.7
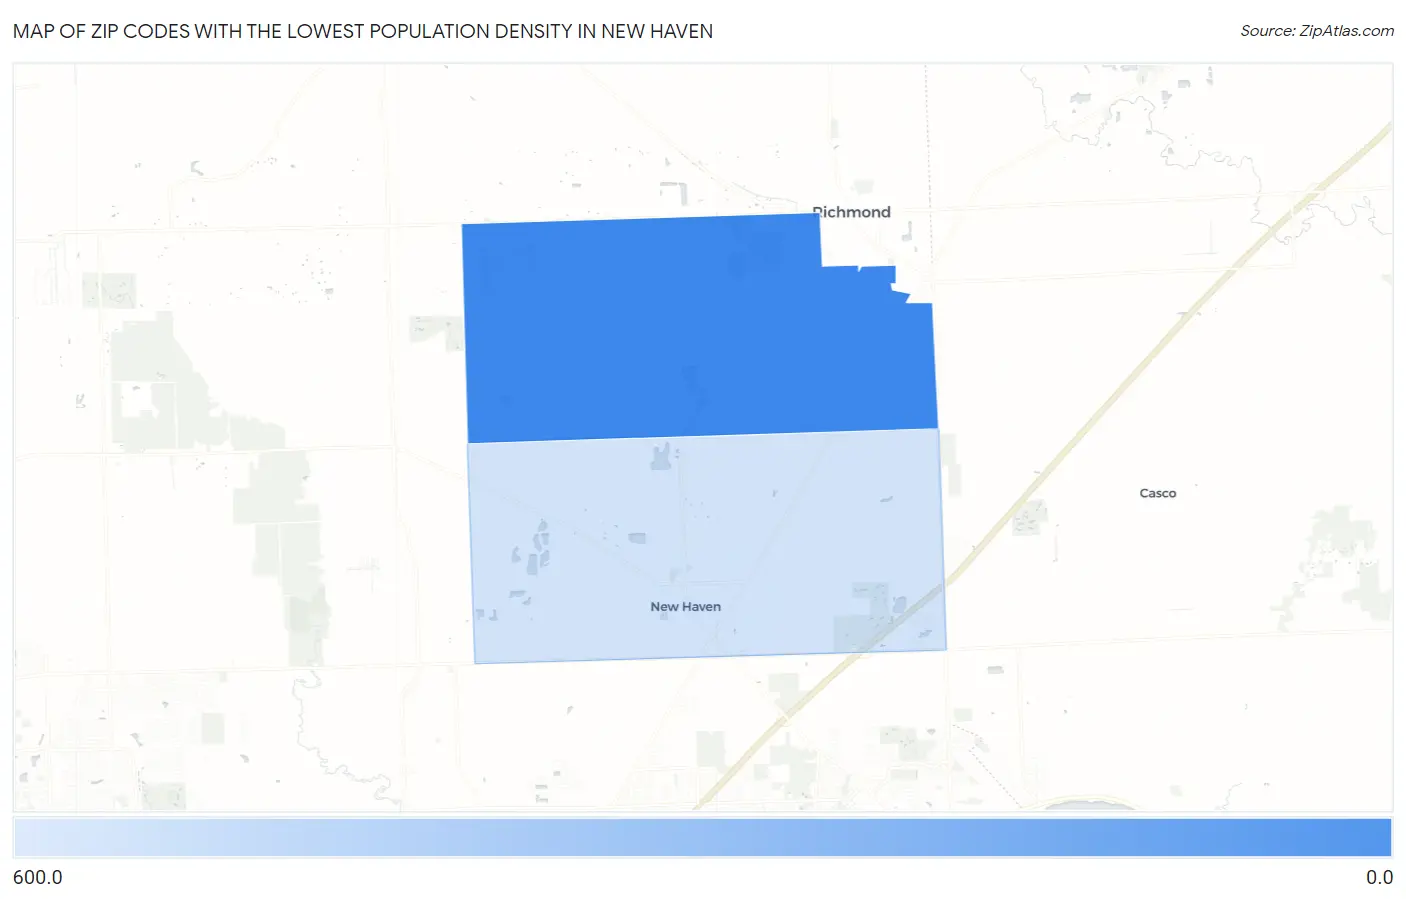
Zip Codes with the Lowest Population Density in New Haven, MI
| Zip Code | People / Sq Mi | vs State | vs National | |
| 1. | 48050 | 76.7 | 177.9(-101)#410 | 0.0(+76.7)#16,345 |
| 2. | 48048 | 532.6 | 177.9(+355)#721 | 0.0(+533)#24,099 |
1
Common Questions
What are the Top Zip Codes with the Lowest Population Density in New Haven, MI?
Top Zip Codes with the Lowest Population Density in New Haven, MI are:
What zip code has the Lowest Population Density in New Haven, MI?
48050 has the Lowest Population Density in New Haven, MI with 76.7.
What is the Population Density in New Haven, MI?
Population Density in New Haven is 2,455.2.
What is the Population Density in Michigan?
Population Density in Michigan is 177.9.