Zip Codes with the Highest Percentage of Households With Three or more Vehicles in Glendale, AZ

RELATED REPORTS & OPTIONS

Households with 3 or more Cars
Population
Families and Households
Female Fertility
Female Fertility (Unmarried)
Race (Community Size)
Race (Percentage)
Ancestry (Community Size)
AfghanAfricanAlaska NativeAlbanianAmericanApacheArabArgentineanArmenianAssyrian / Chaldean / SyriacAustralianAustrianBahamianBasqueBelgianBhutaneseBlackfeetBrazilianBritishBulgarianBurmeseCanadianCentral AmericanCentral American IndianCherokeeChickasawChileanChippewaChoctawColombianCosta RicanCreeCreekCroatianCubanCzechCzechoslovakianDanishDominicanDutchEastern EuropeanEcuadorianEgyptianEnglishEuropeanFilipinoFinnishFrenchFrench CanadianGermanGreekGuatemalanHonduranHopiHungarianIcelanderIndian (Asian)IndonesianInupiatIranianIraqiIrishIsraeliItalianJamaicanJapaneseJordanianKenyanKiowaKoreanLaotianLebaneseLithuanianLuxembourgerMalaysianMalteseMexicanMexican American IndianMoroccanNative HawaiianNavajoNicaraguanNigerianNorthern EuropeanNorwegianOttawaPakistaniPalestinianPanamanianPennsylvania GermanPeruvianPimaPolishPortuguesePotawatomiPuebloPuerto RicanRomanianRussianSalvadoranSamoanScandinavianScotch-IrishScottishSerbianSiouxSlavicSlovakSloveneSomaliSouth AfricanSouth AmericanSpaniardSpanishSri LankanSubsaharan AfricanSudaneseSwedishSwissSyrianThaiTohono O'OdhamTrinidadian and TobagonianTurkishUkrainianVenezuelanVietnameseWelshYaquiYugoslavian
Ancestry (Percentage)
AfghanAfricanAlaska NativeAlbanianAmericanApacheArabArgentineanArmenianAssyrian / Chaldean / SyriacAustralianAustrianBahamianBasqueBelgianBhutaneseBlackfeetBrazilianBritishBulgarianBurmeseCanadianCentral AmericanCentral American IndianCherokeeChickasawChileanChippewaChoctawColombianCosta RicanCreeCreekCroatianCubanCzechCzechoslovakianDanishDominicanDutchEastern EuropeanEcuadorianEgyptianEnglishEuropeanFilipinoFinnishFrenchFrench CanadianGermanGreekGuatemalanHonduranHopiHungarianIcelanderIndian (Asian)IndonesianInupiatIranianIraqiIrishIsraeliItalianJamaicanJapaneseJordanianKenyanKiowaKoreanLaotianLebaneseLithuanianLuxembourgerMalaysianMalteseMexicanMexican American IndianMoroccanNative HawaiianNavajoNicaraguanNigerianNorthern EuropeanNorwegianOttawaPakistaniPalestinianPanamanianPennsylvania GermanPeruvianPimaPolishPortuguesePotawatomiPuebloPuerto RicanRomanianRussianSalvadoranSamoanScandinavianScotch-IrishScottishSerbianSiouxSlavicSlovakSloveneSomaliSouth AfricanSouth AmericanSpaniardSpanishSri LankanSubsaharan AfricanSudaneseSwedishSwissSyrianThaiTohono O'OdhamTrinidadian and TobagonianTurkishUkrainianVenezuelanVietnameseWelshYaquiYugoslavian
Immigrant Origin (Total)
AfghanistanAfricaAlbaniaArgentinaAsiaAustraliaBangladeshBarbadosBosnia and HerzegovinaBrazilBulgariaBurma / MyanmarCambodiaCanadaCaribbeanCentral AmericaChileChinaColombiaCongoCosta RicaCroatiaCubaDenmarkDominican RepublicEastern AfricaEastern AsiaEastern EuropeEgyptEl SalvadorEnglandEuropeFranceGermanyGreeceGuatemalaGuyanaHondurasHong KongHungaryIndiaIndonesiaIranIraqIrelandIsraelItalyJamaicaJapanJordanKenyaKoreaKuwaitLaosLatin AmericaLiberiaMexicoMiddle AfricaMoroccoNepalNetherlandsNicaraguaNigeriaNorthern AfricaNorthern EuropeOceaniaPanamaPeruPhilippinesPolandPortugalRomaniaRussiaScotlandSerbiaSierra LeoneSomaliaSouth AfricaSouth AmericaSouth Central AsiaSouth Eastern AsiaSouthern EuropeSyriaTaiwanThailandTrinidad and TobagoUgandaUkraineUzbekistanVenezuelaVietnamWestern AfricaWestern AsiaWestern EuropeZaire
Immigrant Origin (Percentage)
AfghanistanAfricaAlbaniaArgentinaAsiaAustraliaBangladeshBarbadosBosnia and HerzegovinaBrazilBulgariaBurma / MyanmarCambodiaCanadaCaribbeanCentral AmericaChileChinaColombiaCongoCosta RicaCroatiaCubaDenmarkDominican RepublicEastern AfricaEastern AsiaEastern EuropeEgyptEl SalvadorEnglandEuropeFranceGermanyGreeceGuatemalaGuyanaHondurasHong KongHungaryIndiaIndonesiaIranIraqIrelandIsraelItalyJamaicaJapanJordanKenyaKoreaKuwaitLaosLatin AmericaLiberiaMexicoMiddle AfricaMoroccoNepalNetherlandsNicaraguaNigeriaNorthern AfricaNorthern EuropeOceaniaPanamaPeruPhilippinesPolandPortugalRomaniaRussiaScotlandSerbiaSierra LeoneSomaliaSouth AfricaSouth AmericaSouth Central AsiaSouth Eastern AsiaSouthern EuropeSyriaTaiwanThailandTrinidad and TobagoUgandaUkraineUzbekistanVenezuelaVietnamWestern AfricaWestern AsiaWestern EuropeZaire
Income
Income (Families)
Income (Households)
Poverty
Poverty (Families)
Unemployment
Employment Occupations
Employment Industries
Employer Class
Commute Time
Commute Means
School Enrollment
Education by Degree Field
Occupancy
Finances
Physical Characteristics
Glendale
Compare Zip Codes
Comparison Subject

Map of Zip Codes with the Highest Percentage of Households With Three or more Vehicles in Glendale

25.9%
38.6%
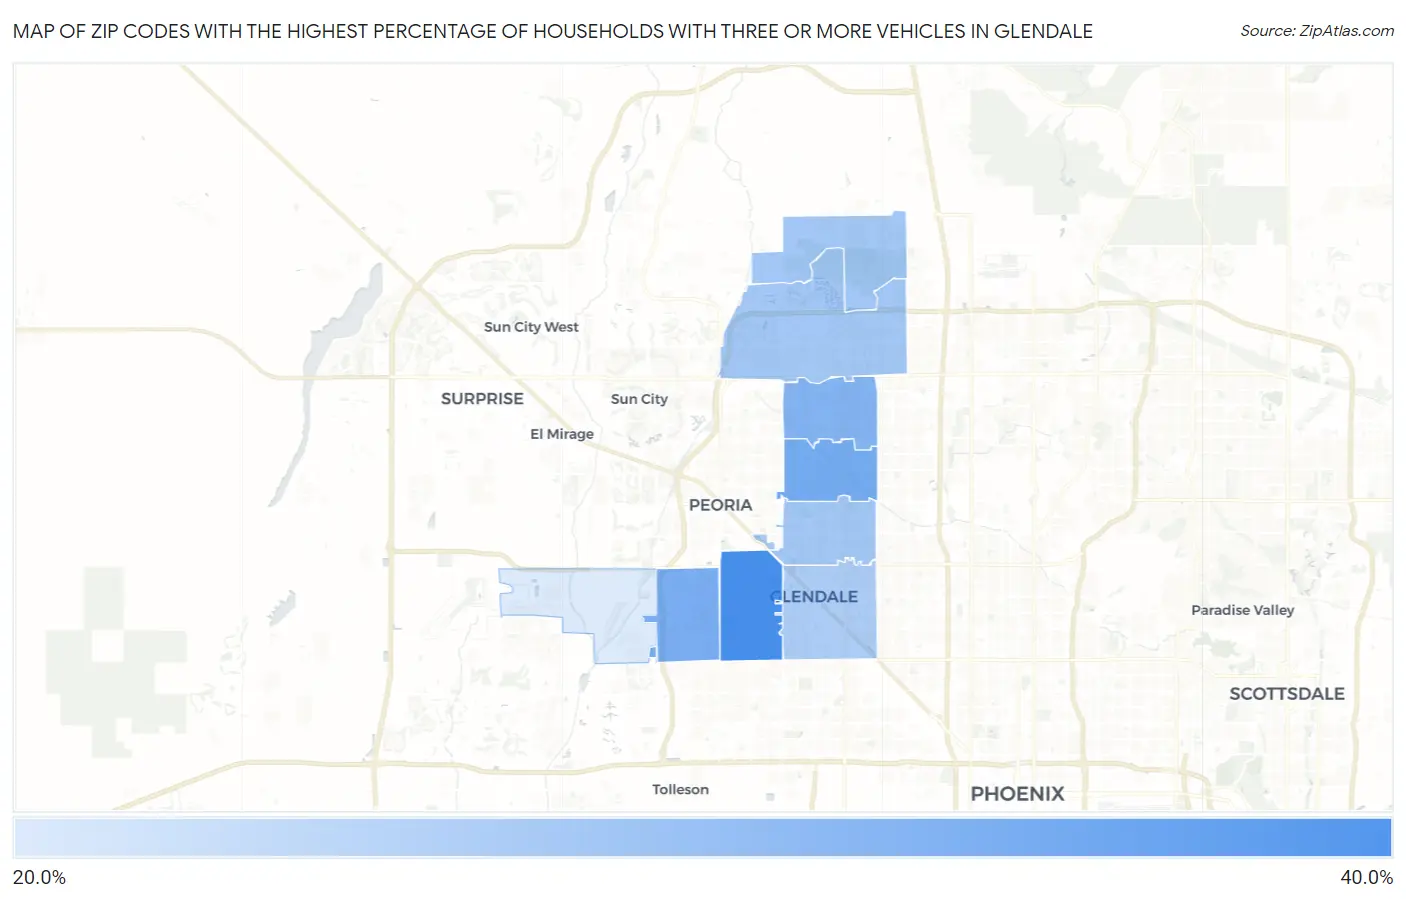
Zip Codes with the Highest Percentage of Households With Three or more Vehicles in Glendale Map

Zip Codes with the Highest Percentage of Households With Three or more Vehicles in Glendale, AZ

Zip Code Housholds With 3+ Cars vs State vs National
1. 85303 38.6% 27.6% (+11.0)#77 29.0% (+9.60)#9,618
2. 85304 34.6% 27.6% (+7.00)#112 29.0% (+5.60)#13,164
3. 85305 34.1% 27.6% (+6.50)#117 29.0% (+5.10)#13,687
4. 85306 33.3% 27.6% (+5.70)#126 29.0% (+4.30)#14,503
5. 85308 30.7% 27.6% (+3.10)#163 29.0% (+1.70)#17,252
6. 85302 30.6% 27.6% (+3.00)#165 29.0% (+1.60)#17,343
7. 85310 30.6% 27.6% (+3.00)#166 29.0% (+1.60)#17,363
8. 85301 29.9% 27.6% (+2.30)#178 29.0% (+0.900)#18,051
9. 85307 25.9% 27.6% (-1.70)#241 29.0% (-3.10)#22,066

Common Questions

What are the Top 5 Zip Codes with the Highest Percentage of Households With Three or more Vehicles in Glendale, AZ?
Top 5 Zip Codes with the Highest Percentage of Households With Three or more Vehicles in Glendale, AZ are:
#1
38.6%
#2
34.6%
#3
34.1%
#4
33.3%
#5
30.7%
What zip code has the Highest Percentage of Households With Three or more Vehicles in Glendale, AZ?
85303 has the Highest Percentage of Households With Three or more Vehicles in Glendale, AZ with 38.6%.
What is the Percentage of Households With Three or more Vehicles in Glendale, AZ?
Percentage of Households With Three or more Vehicles in Glendale is 32.5%.
What is the Percentage of Households With Three or more Vehicles in Arizona?
Percentage of Households With Three or more Vehicles in Arizona is 27.6%.
What is the Percentage of Households With Three or more Vehicles in the United States?
Percentage of Households With Three or more Vehicles in the United States is 29.0%.