Zip Codes with the Highest Percentage of Households With One or more Vehicles in Russellville, AL
RELATED REPORTS & OPTIONS
Households with 1 or more Cars
Russellville
Compare Zip Codes
Map of Zip Codes with the Highest Percentage of Households With One or more Vehicles in Russellville
89.2%
89.5%
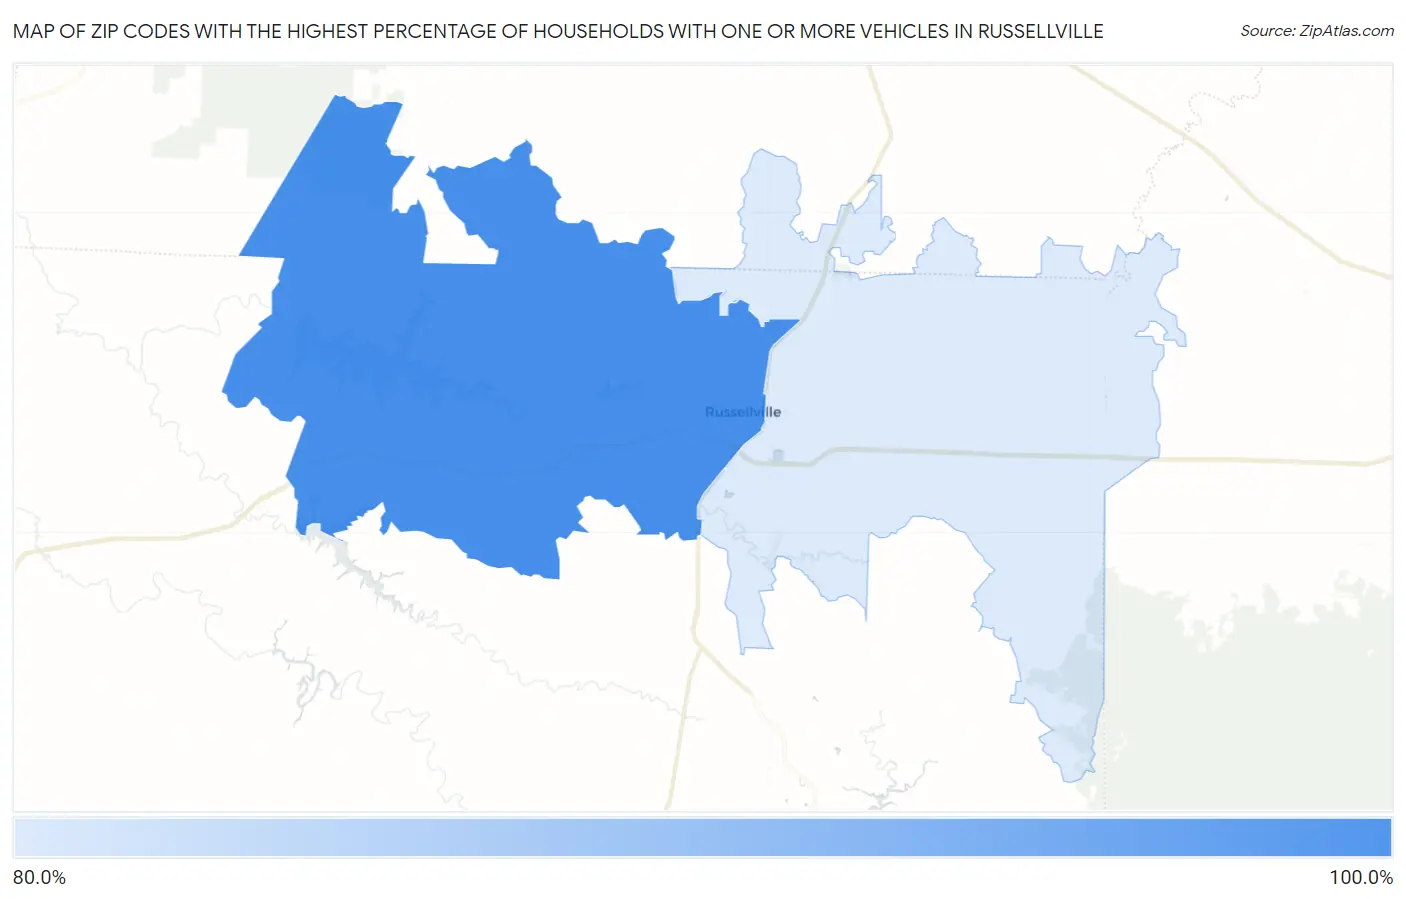
Zip Codes with the Highest Percentage of Households With One or more Vehicles in Russellville, AL
| Zip Code | Housholds With 1+ Cars | vs State | vs National | |
| 1. | 35653 | 89.5% | 94.5%(-5.00)#528 | 91.7%(-2.20)#28,334 |
| 2. | 35654 | 89.2% | 94.5%(-5.30)#536 | 91.7%(-2.50)#28,556 |
1
Common Questions
What are the Top Zip Codes with the Highest Percentage of Households With One or more Vehicles in Russellville, AL?
Top Zip Codes with the Highest Percentage of Households With One or more Vehicles in Russellville, AL are:
What zip code has the Highest Percentage of Households With One or more Vehicles in Russellville, AL?
35653 has the Highest Percentage of Households With One or more Vehicles in Russellville, AL with 89.5%.
What is the Percentage of Households With One or more Vehicles in Russellville, AL?
Percentage of Households With One or more Vehicles in Russellville is 87.4%.
What is the Percentage of Households With One or more Vehicles in Alabama?
Percentage of Households With One or more Vehicles in Alabama is 94.5%.
What is the Percentage of Households With One or more Vehicles in the United States?
Percentage of Households With One or more Vehicles in the United States is 91.7%.