Union, WA Map & Demographics
Union Map
Union Overview
$34,745
PER CAPITA INCOME
$75,294
AVG FAMILY INCOME
$73,456
AVG HOUSEHOLD INCOME
0.36
INEQUALITY / GINI INDEX
406
TOTAL POPULATION
171
MALE POPULATION
235
FEMALE POPULATION
72.77
MALES / 100 FEMALES
137.43
FEMALES / 100 MALES
64.7
MEDIAN AGE
2.5
AVG FAMILY SIZE
2.1
AVG HOUSEHOLD SIZE
114
LABOR FORCE [ PEOPLE ]
29.3%
PERCENT IN LABOR FORCE
Union Zip Codes
Union Area Codes
Income in Union
Income Overview in Union
Per Capita Income in Union is $34,745, while median incomes of families and households are $75,294 and $73,456 respectively.
| Characteristic | Number | Measure |
| Per Capita Income | 406 | $34,745 |
| Median Family Income | 128 | $75,294 |
| Mean Family Income | 128 | $76,621 |
| Median Household Income | 189 | $73,456 |
| Mean Household Income | 189 | $71,174 |
| Income Deficit | 128 | $0 |
| Wage / Income Gap (%) | 406 | 0.00% |
| Wage / Income Gap ($) | 406 | 100.00¢ per $1 |
| Gini / Inequality Index | 406 | 0.36 |
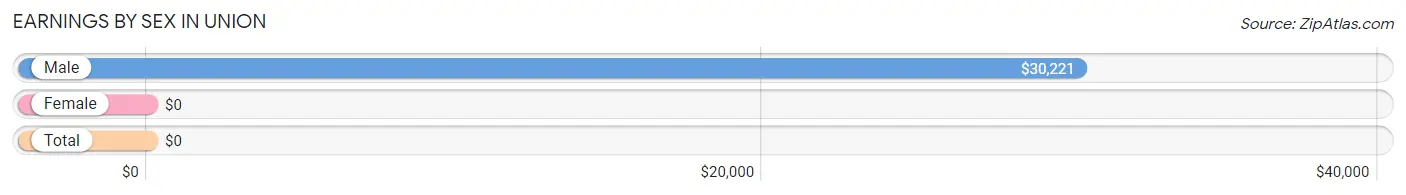
Earnings by Sex in Union
| Sex | Number | Average Earnings |
| Male | 65 (43.0%) | $30,221 |
| Female | 86 (57.0%) | $0 |
| Total | 151 (100.0%) | $0 |
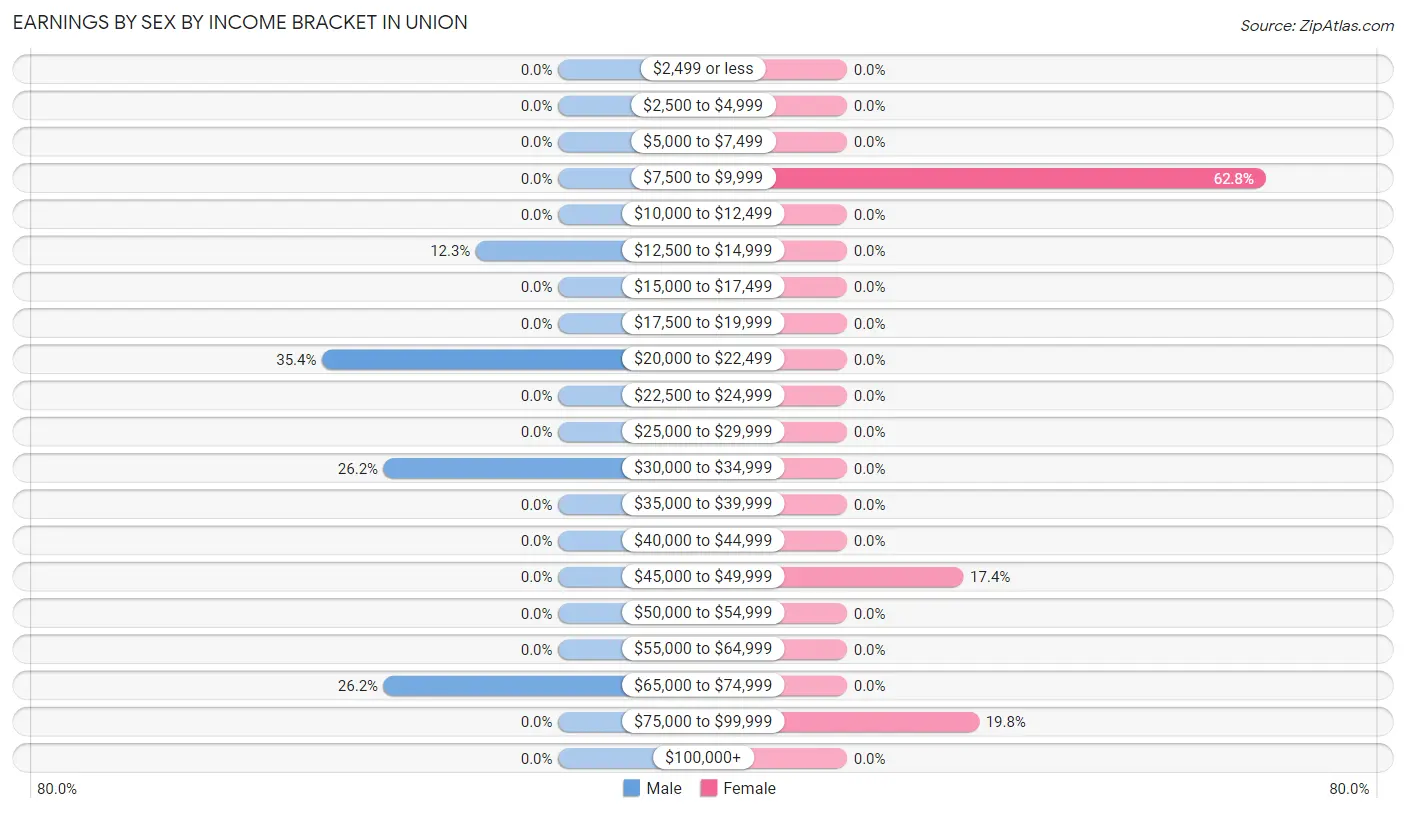
Earnings by Sex by Income Bracket in Union
The most common earnings brackets in Union are $20,000 to $22,499 for men (23 | 35.4%) and $7,500 to $9,999 for women (54 | 62.8%).
| Income | Male | Female |
| $2,499 or less | 0 (0.0%) | 0 (0.0%) |
| $2,500 to $4,999 | 0 (0.0%) | 0 (0.0%) |
| $5,000 to $7,499 | 0 (0.0%) | 0 (0.0%) |
| $7,500 to $9,999 | 0 (0.0%) | 54 (62.8%) |
| $10,000 to $12,499 | 0 (0.0%) | 0 (0.0%) |
| $12,500 to $14,999 | 8 (12.3%) | 0 (0.0%) |
| $15,000 to $17,499 | 0 (0.0%) | 0 (0.0%) |
| $17,500 to $19,999 | 0 (0.0%) | 0 (0.0%) |
| $20,000 to $22,499 | 23 (35.4%) | 0 (0.0%) |
| $22,500 to $24,999 | 0 (0.0%) | 0 (0.0%) |
| $25,000 to $29,999 | 0 (0.0%) | 0 (0.0%) |
| $30,000 to $34,999 | 17 (26.2%) | 0 (0.0%) |
| $35,000 to $39,999 | 0 (0.0%) | 0 (0.0%) |
| $40,000 to $44,999 | 0 (0.0%) | 0 (0.0%) |
| $45,000 to $49,999 | 0 (0.0%) | 15 (17.4%) |
| $50,000 to $54,999 | 0 (0.0%) | 0 (0.0%) |
| $55,000 to $64,999 | 0 (0.0%) | 0 (0.0%) |
| $65,000 to $74,999 | 17 (26.2%) | 0 (0.0%) |
| $75,000 to $99,999 | 0 (0.0%) | 17 (19.8%) |
| $100,000+ | 0 (0.0%) | 0 (0.0%) |
| Total | 65 (100.0%) | 86 (100.0%) |
Earnings by Sex by Educational Attainment in Union
| Educational Attainment | Male Income | Female Income |
| Less than High School | - | - |
| High School Diploma | - | - |
| College or Associate's Degree | - | - |
| Bachelor's Degree | - | - |
| Graduate Degree | - | - |
| Total | $30,221 | $0 |
Family Income in Union
Family Income Brackets in Union
According to the Union family income data, there are 34 families falling into the $50,000 to $74,999 income range, which is the most common income bracket and makes up 26.6% of all families.
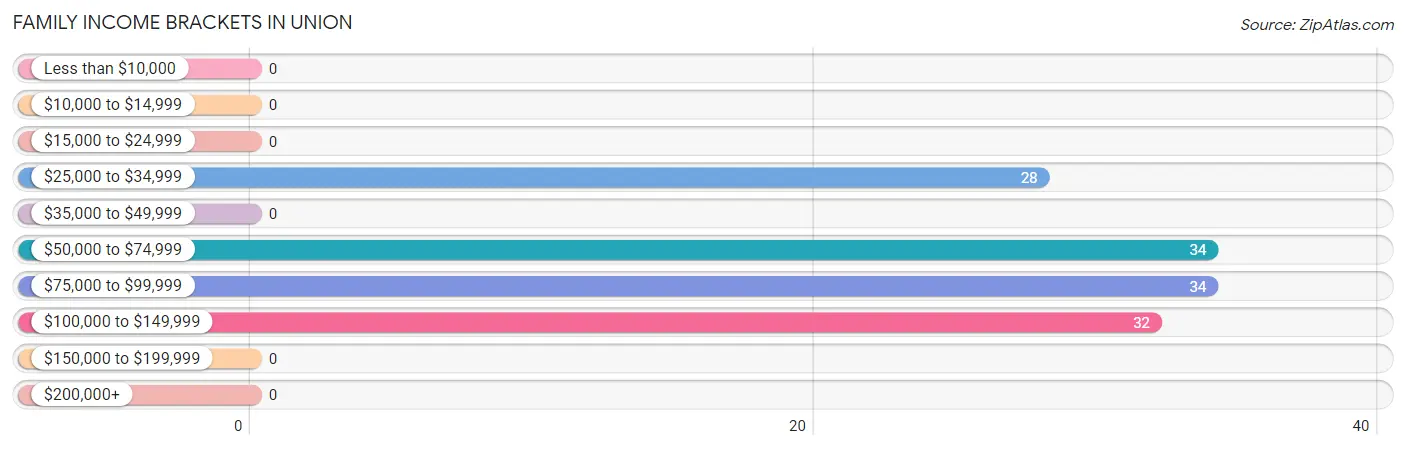
| Income Bracket | # Families | % Families |
| Less than $10,000 | 0 | 0.0% |
| $10,000 to $14,999 | 0 | 0.0% |
| $15,000 to $24,999 | 0 | 0.0% |
| $25,000 to $34,999 | 28 | 21.9% |
| $35,000 to $49,999 | 0 | 0.0% |
| $50,000 to $74,999 | 34 | 26.6% |
| $75,000 to $99,999 | 34 | 26.6% |
| $100,000 to $149,999 | 32 | 25.0% |
| $150,000 to $199,999 | 0 | 0.0% |
| $200,000+ | 0 | 0.0% |
Family Income by Famaliy Size in Union
2-person families (111 | 86.7%) account for the highest median family income in Union with $76,544 per family, while 2-person families (111 | 86.7%) have the highest median income of $38,272 per family member.
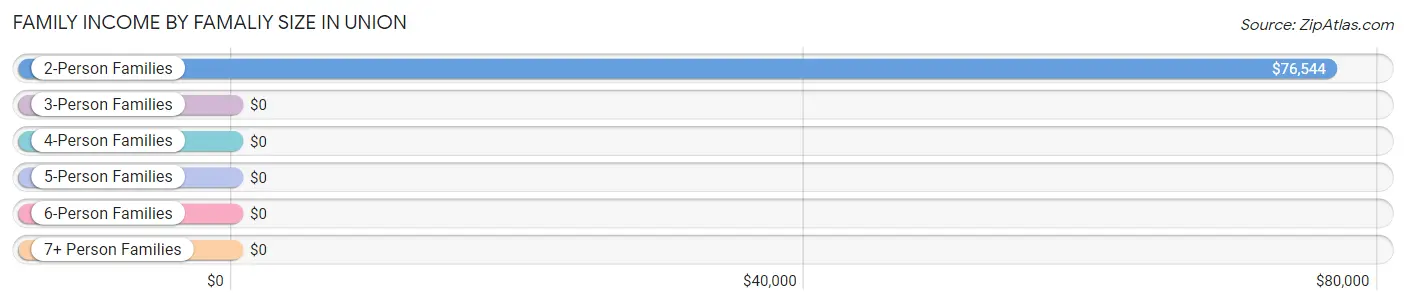
| Income Bracket | # Families | Median Income |
| 2-Person Families | 111 (86.7%) | $76,544 |
| 3-Person Families | 0 (0.0%) | $0 |
| 4-Person Families | 17 (13.3%) | $0 |
| 5-Person Families | 0 (0.0%) | $0 |
| 6-Person Families | 0 (0.0%) | $0 |
| 7+ Person Families | 0 (0.0%) | $0 |
| Total | 128 (100.0%) | $75,294 |
Family Income by Number of Earners in Union
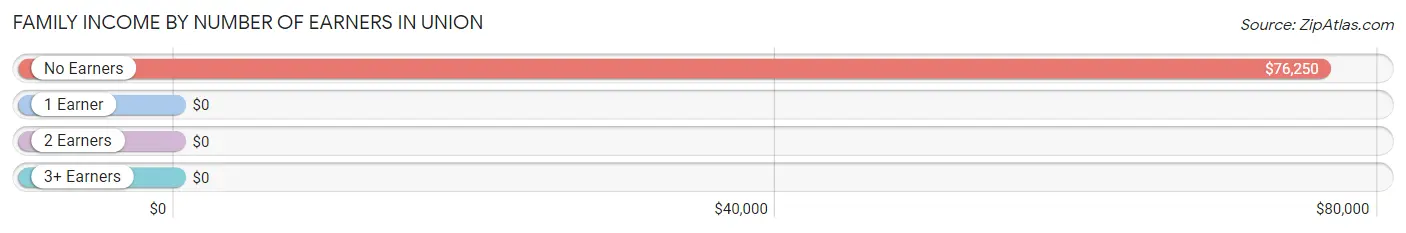
| Number of Earners | # Families | Median Income |
| No Earners | 51 (39.8%) | $76,250 |
| 1 Earner | 34 (26.6%) | $0 |
| 2 Earners | 43 (33.6%) | $0 |
| 3+ Earners | 0 (0.0%) | $0 |
| Total | 128 (100.0%) | $75,294 |
Household Income in Union
Household Income Brackets in Union
With 34 households falling in the category, the $50,000 to $74,999 income range is the most frequent in Union, accounting for 18.0% of all households.
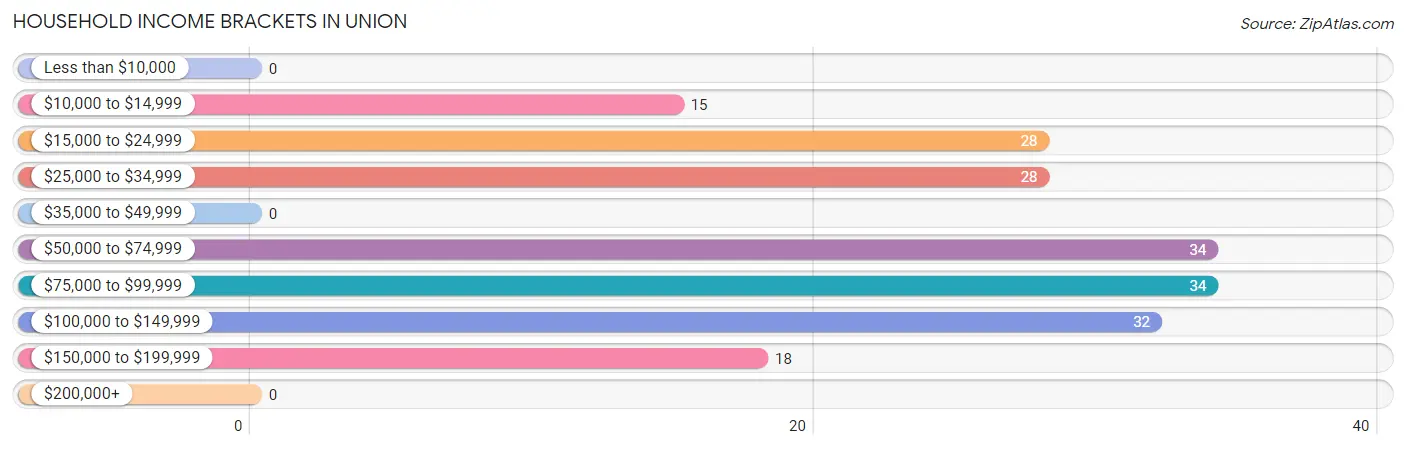
| Income Bracket | # Households | % Households |
| Less than $10,000 | 0 | 0.0% |
| $10,000 to $14,999 | 15 | 7.9% |
| $15,000 to $24,999 | 28 | 14.8% |
| $25,000 to $34,999 | 28 | 14.8% |
| $35,000 to $49,999 | 0 | 0.0% |
| $50,000 to $74,999 | 34 | 18.0% |
| $75,000 to $99,999 | 34 | 18.0% |
| $100,000 to $149,999 | 32 | 16.9% |
| $150,000 to $199,999 | 18 | 9.5% |
| $200,000+ | 0 | 0.0% |
Household Income by Householder Age in Union
The median household income in Union is $73,456, with the highest median household income of $76,765 found in the 65+ years age bracket for the primary householder. A total of 144 households (76.2%) fall into this category.
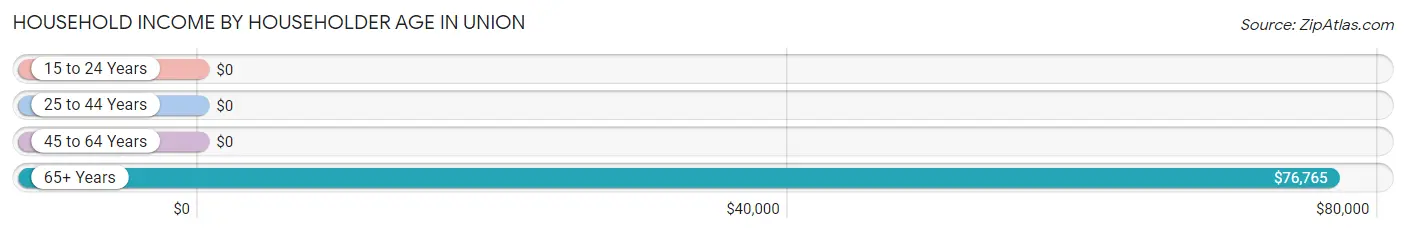
| Income Bracket | # Households | Median Income |
| 15 to 24 Years | 0 (0.0%) | $0 |
| 25 to 44 Years | 0 (0.0%) | $0 |
| 45 to 64 Years | 45 (23.8%) | $0 |
| 65+ Years | 144 (76.2%) | $76,765 |
| Total | 189 (100.0%) | $73,456 |
Poverty in Union
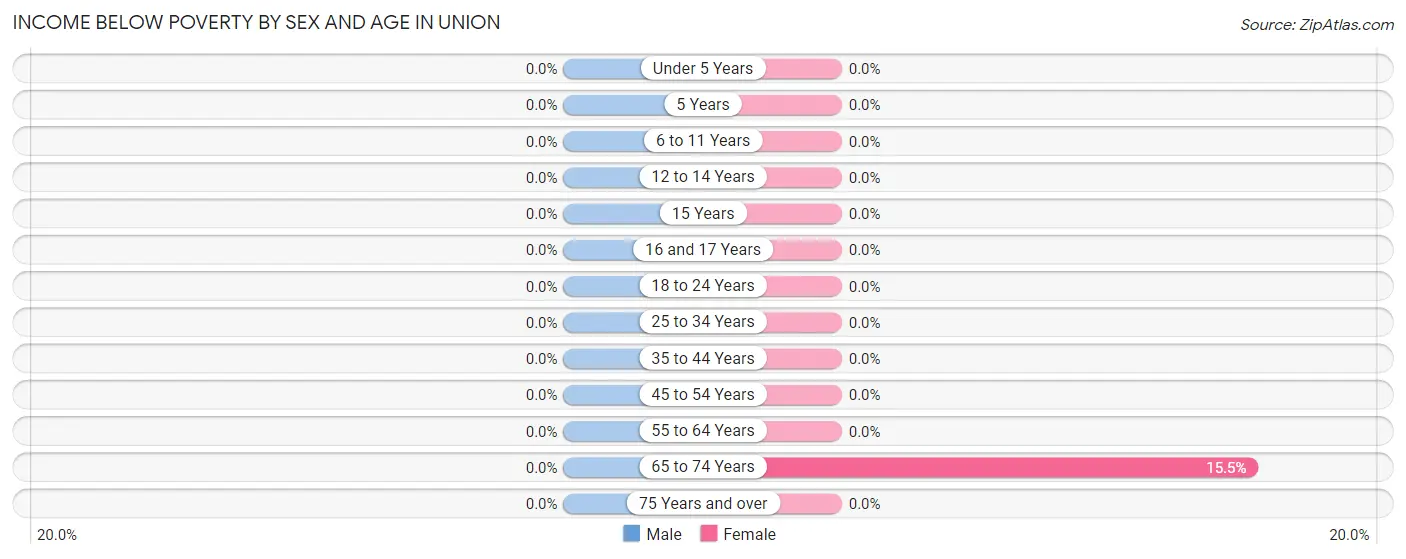
Income Below Poverty by Sex and Age in Union
| Age Bracket | Male | Female |
| Under 5 Years | 0 (0.0%) | 0 (0.0%) |
| 5 Years | 0 (0.0%) | 0 (0.0%) |
| 6 to 11 Years | 0 (0.0%) | 0 (0.0%) |
| 12 to 14 Years | 0 (0.0%) | 0 (0.0%) |
| 15 Years | 0 (0.0%) | 0 (0.0%) |
| 16 and 17 Years | 0 (0.0%) | 0 (0.0%) |
| 18 to 24 Years | 0 (0.0%) | 0 (0.0%) |
| 25 to 34 Years | 0 (0.0%) | 0 (0.0%) |
| 35 to 44 Years | 0 (0.0%) | 0 (0.0%) |
| 45 to 54 Years | 0 (0.0%) | 0 (0.0%) |
| 55 to 64 Years | 0 (0.0%) | 0 (0.0%) |
| 65 to 74 Years | 0 (0.0%) | 15 (15.5%) |
| 75 Years and over | 0 (0.0%) | 0 (0.0%) |
| Total | 0 (0.0%) | 15 (6.4%) |
Income Above Poverty by Sex and Age in Union
According to the poverty statistics in Union, males aged 16 and 17 years and females aged 12 to 14 years are the age groups that are most secure financially, with 100.0% of males and 100.0% of females in these age groups living above the poverty line.
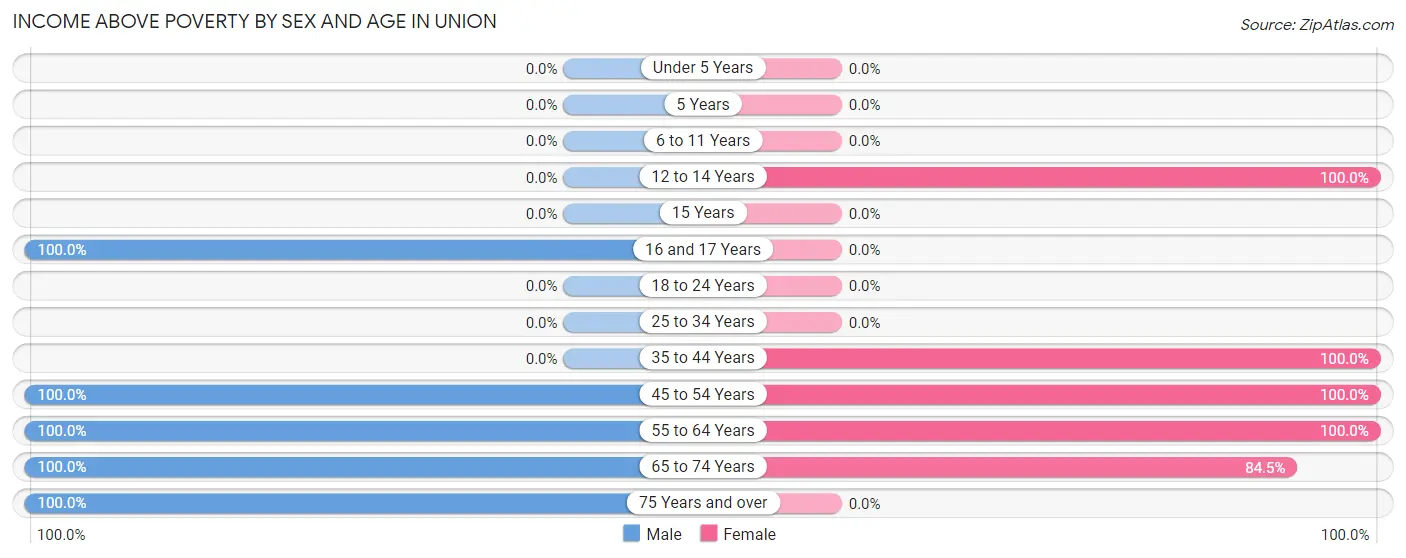
| Age Bracket | Male | Female |
| Under 5 Years | 0 (0.0%) | 0 (0.0%) |
| 5 Years | 0 (0.0%) | 0 (0.0%) |
| 6 to 11 Years | 0 (0.0%) | 0 (0.0%) |
| 12 to 14 Years | 0 (0.0%) | 17 (100.0%) |
| 15 Years | 0 (0.0%) | 0 (0.0%) |
| 16 and 17 Years | 18 (100.0%) | 0 (0.0%) |
| 18 to 24 Years | 0 (0.0%) | 0 (0.0%) |
| 25 to 34 Years | 0 (0.0%) | 0 (0.0%) |
| 35 to 44 Years | 0 (0.0%) | 15 (100.0%) |
| 45 to 54 Years | 25 (100.0%) | 34 (100.0%) |
| 55 to 64 Years | 45 (100.0%) | 72 (100.0%) |
| 65 to 74 Years | 69 (100.0%) | 82 (84.5%) |
| 75 Years and over | 14 (100.0%) | 0 (0.0%) |
| Total | 171 (100.0%) | 220 (93.6%) |
Income Below Poverty Among Married-Couple Families in Union
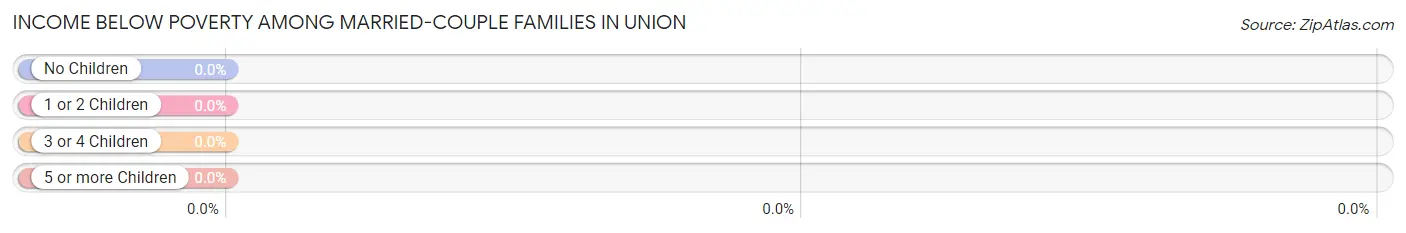
| Children | Above Poverty | Below Poverty |
| No Children | 111 (100.0%) | 0 (0.0%) |
| 1 or 2 Children | 17 (100.0%) | 0 (0.0%) |
| 3 or 4 Children | 0 (0.0%) | 0 (0.0%) |
| 5 or more Children | 0 (0.0%) | 0 (0.0%) |
| Total | 128 (100.0%) | 0 (0.0%) |
Income Below Poverty Among Single-Parent Households in Union
| Children | Single Father | Single Mother |
| No Children | 0 (0.0%) | 0 (0.0%) |
| 1 or 2 Children | 0 (0.0%) | 0 (0.0%) |
| 3 or 4 Children | 0 (0.0%) | 0 (0.0%) |
| 5 or more Children | 0 (0.0%) | 0 (0.0%) |
| Total | 0 (0.0%) | 0 (0.0%) |
Income Below Poverty Among Married-Couple vs Single-Parent Households in Union
| Children | Married-Couple Families | Single-Parent Households |
| No Children | 0 (0.0%) | 0 (0.0%) |
| 1 or 2 Children | 0 (0.0%) | 0 (0.0%) |
| 3 or 4 Children | 0 (0.0%) | 0 (0.0%) |
| 5 or more Children | 0 (0.0%) | 0 (0.0%) |
| Total | 0 (0.0%) | 0 (0.0%) |
Race in Union
The most populous races in Union are White / Caucasian (364 | 89.7%), and Two or more Races (42 | 10.3%).
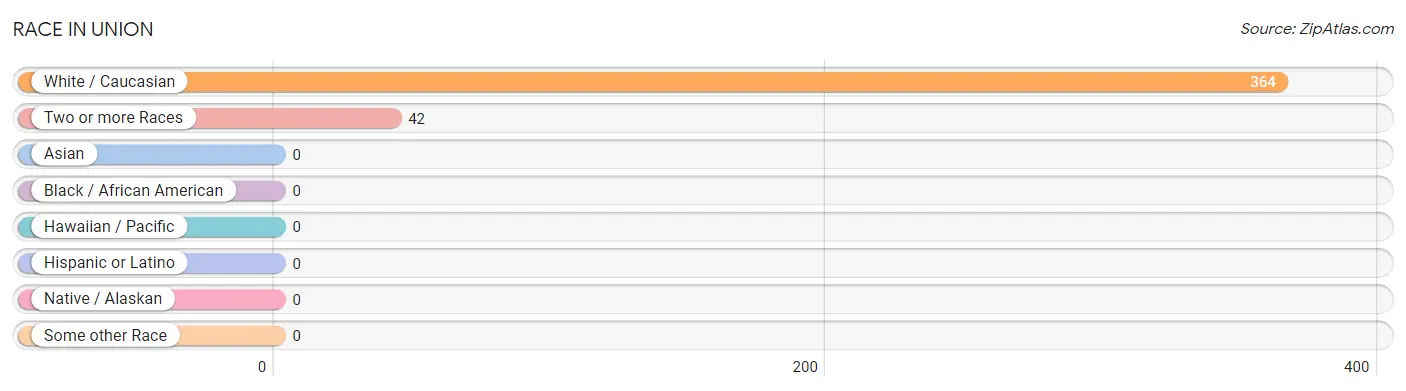
| Race | # Population | % Population |
| Asian | 0 | 0.0% |
| Black / African American | 0 | 0.0% |
| Hawaiian / Pacific | 0 | 0.0% |
| Hispanic or Latino | 0 | 0.0% |
| Native / Alaskan | 0 | 0.0% |
| White / Caucasian | 364 | 89.7% |
| Two or more Races | 42 | 10.3% |
| Some other Race | 0 | 0.0% |
| Total | 406 | 100.0% |
Ancestry in Union
The most populous ancestries reported in Union are German (133 | 32.8%), English (125 | 30.8%), Scottish (79 | 19.5%), Norwegian (31 | 7.6%), and Irish (30 | 7.4%), together accounting for 98.0% of all Union residents.
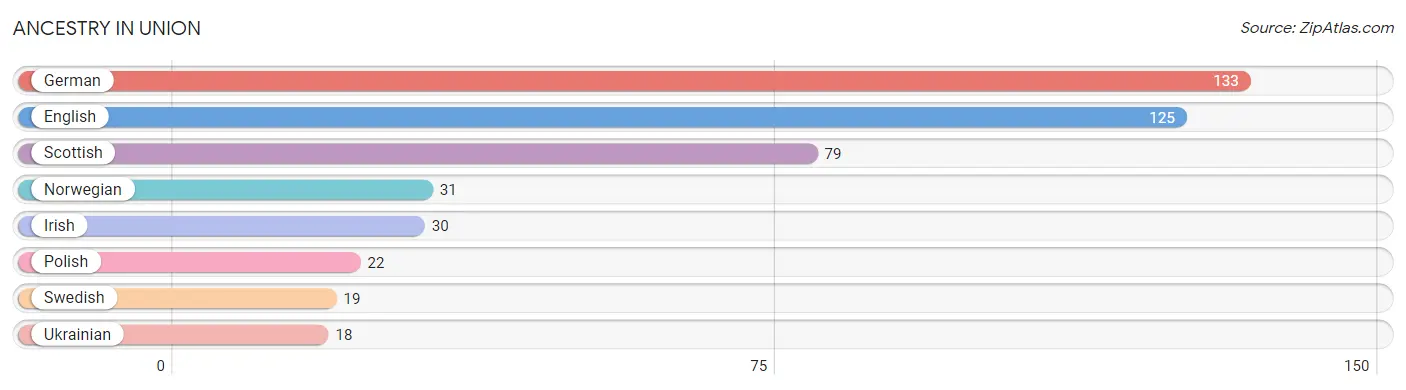
| Ancestry | # Population | % Population |
| English | 125 | 30.8% |
| German | 133 | 32.8% |
| Irish | 30 | 7.4% |
| Norwegian | 31 | 7.6% |
| Polish | 22 | 5.4% |
| Scottish | 79 | 19.5% |
| Swedish | 19 | 4.7% |
| Ukrainian | 18 | 4.4% | View All 8 Rows |
Immigrants in Union

| Immigration Origin | # Population | % Population | View All 0 Rows |
Sex and Age in Union
Sex and Age in Union
The most populous age groups in Union are 60 to 64 Years (45 | 26.3%) for men and 70 to 74 Years (80 | 34.0%) for women.
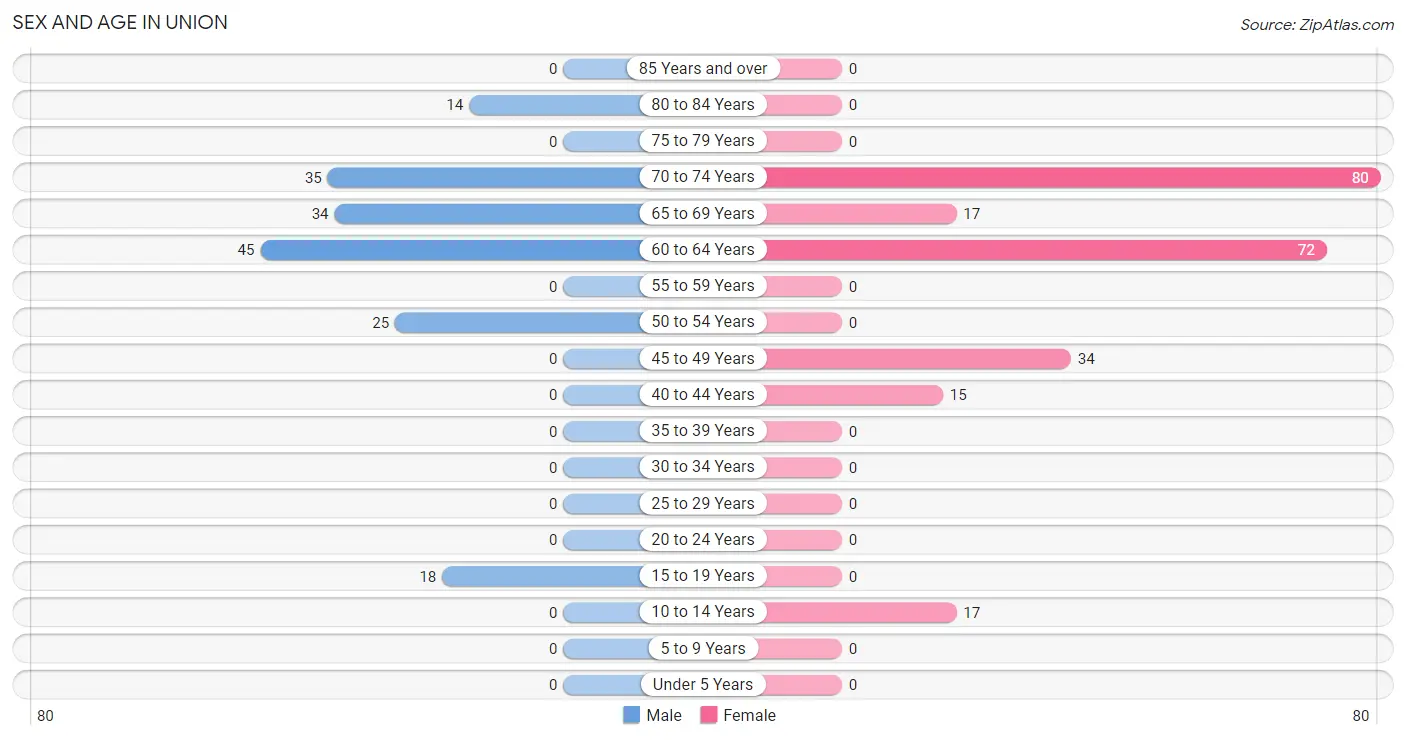
| Age Bracket | Male | Female |
| Under 5 Years | 0 (0.0%) | 0 (0.0%) |
| 5 to 9 Years | 0 (0.0%) | 0 (0.0%) |
| 10 to 14 Years | 0 (0.0%) | 17 (7.2%) |
| 15 to 19 Years | 18 (10.5%) | 0 (0.0%) |
| 20 to 24 Years | 0 (0.0%) | 0 (0.0%) |
| 25 to 29 Years | 0 (0.0%) | 0 (0.0%) |
| 30 to 34 Years | 0 (0.0%) | 0 (0.0%) |
| 35 to 39 Years | 0 (0.0%) | 0 (0.0%) |
| 40 to 44 Years | 0 (0.0%) | 15 (6.4%) |
| 45 to 49 Years | 0 (0.0%) | 34 (14.5%) |
| 50 to 54 Years | 25 (14.6%) | 0 (0.0%) |
| 55 to 59 Years | 0 (0.0%) | 0 (0.0%) |
| 60 to 64 Years | 45 (26.3%) | 72 (30.6%) |
| 65 to 69 Years | 34 (19.9%) | 17 (7.2%) |
| 70 to 74 Years | 35 (20.5%) | 80 (34.0%) |
| 75 to 79 Years | 0 (0.0%) | 0 (0.0%) |
| 80 to 84 Years | 14 (8.2%) | 0 (0.0%) |
| 85 Years and over | 0 (0.0%) | 0 (0.0%) |
| Total | 171 (100.0%) | 235 (100.0%) |
Families and Households in Union
Median Family Size in Union
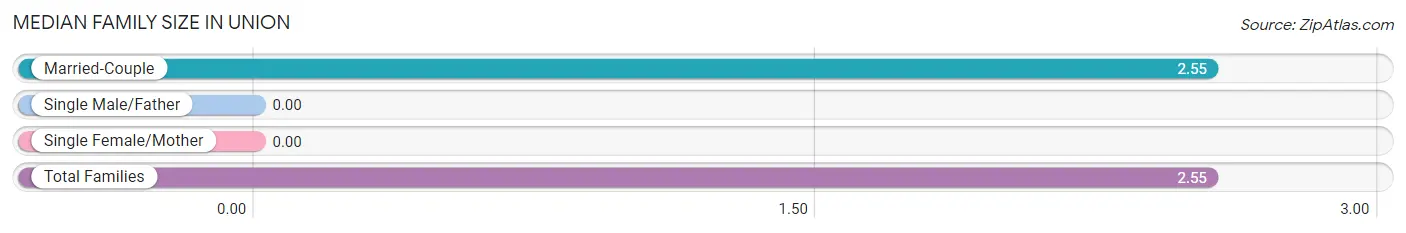
| Family Type | # Families | Family Size |
| Married-Couple | 128 (100.0%) | 2.55 |
| Single Male/Father | 0 (0.0%) | - |
| Single Female/Mother | 0 (0.0%) | - |
| Total Families | 128 (100.0%) | 2.55 |
Median Household Size in Union
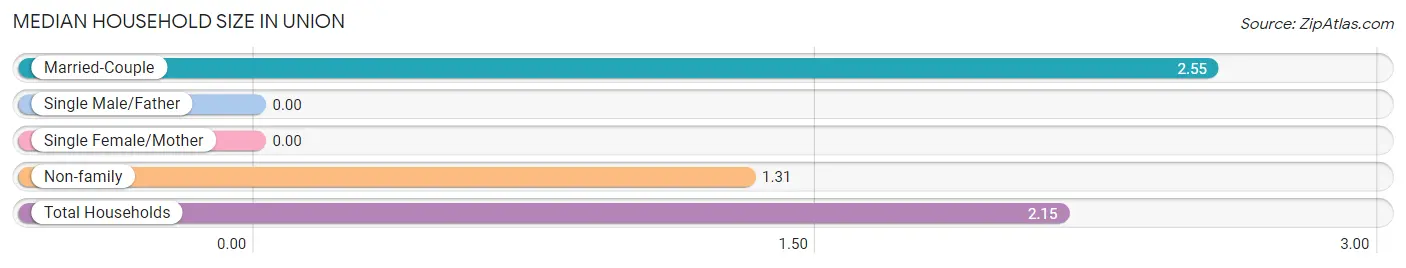
| Household Type | # Households | Household Size |
| Married-Couple | 128 (67.7%) | 2.55 |
| Single Male/Father | 0 (0.0%) | - |
| Single Female/Mother | 0 (0.0%) | - |
| Non-family | 61 (32.3%) | 1.31 |
| Total Households | 189 (100.0%) | 2.15 |
Household Size by Marriage Status in Union
Out of a total of 189 households in Union, 128 (67.7%) are family households, while 61 (32.3%) are nonfamily households. The most numerous type of family households are 2-person households, comprising 111, and the most common type of nonfamily households are 1-person households, comprising 43.
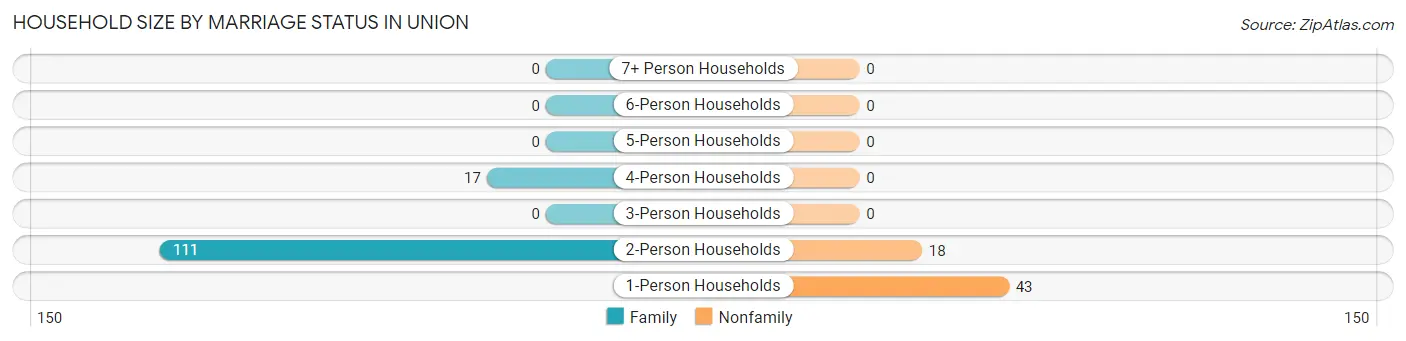
| Household Size | Family Households | Nonfamily Households |
| 1-Person Households | - | 43 (22.8%) |
| 2-Person Households | 111 (58.7%) | 18 (9.5%) |
| 3-Person Households | 0 (0.0%) | 0 (0.0%) |
| 4-Person Households | 17 (9.0%) | 0 (0.0%) |
| 5-Person Households | 0 (0.0%) | 0 (0.0%) |
| 6-Person Households | 0 (0.0%) | 0 (0.0%) |
| 7+ Person Households | 0 (0.0%) | 0 (0.0%) |
| Total | 128 (67.7%) | 61 (32.3%) |
Female Fertility in Union
Fertility by Age in Union
| Age Bracket | Women with Births | Births / 1,000 Women |
| 15 to 19 years | 0 (0.0%) | 0.0 |
| 20 to 34 years | 0 (0.0%) | 0.0 |
| 35 to 50 years | 0 (0.0%) | 0.0 |
| Total | 0 (0.0%) | 0.0 |
Fertility by Age by Marriage Status in Union
| Age Bracket | Married | Unmarried |
| 15 to 19 years | 0 (0.0%) | 0 (0.0%) |
| 20 to 34 years | 0 (0.0%) | 0 (0.0%) |
| 35 to 50 years | 0 (0.0%) | 0 (0.0%) |
| Total | 0 (0.0%) | 0 (0.0%) |
Fertility by Education in Union
| Educational Attainment | Women with Births | Births / 1,000 Women |
| Less than High School | 0 (0.0%) | 0.0 |
| High School Diploma | 0 (0.0%) | 0.0 |
| College or Associate's Degree | 0 (0.0%) | 0.0 |
| Bachelor's Degree | 0 (0.0%) | 0.0 |
| Graduate Degree | 0 (0.0%) | 0.0 |
| Total | 0 (0.0%) | 0.0 |
Fertility by Education by Marriage Status in Union
| Educational Attainment | Married | Unmarried |
| Less than High School | 0 (0.0%) | 0 (0.0%) |
| High School Diploma | 0 (0.0%) | 0 (0.0%) |
| College or Associate's Degree | 0 (0.0%) | 0 (0.0%) |
| Bachelor's Degree | 0 (0.0%) | 0 (0.0%) |
| Graduate Degree | 0 (0.0%) | 0 (0.0%) |
| Total | 0 (0.0%) | 0 (0.0%) |
Employment Characteristics in Union
Employment by Class of Employer in Union
Among the 114 employed individuals in Union, unpaid family workers (34 | 29.8%), self-employed (incorporated) (31 | 27.2%), and private company employees (17 | 14.9%) make up the most common classes of employment.
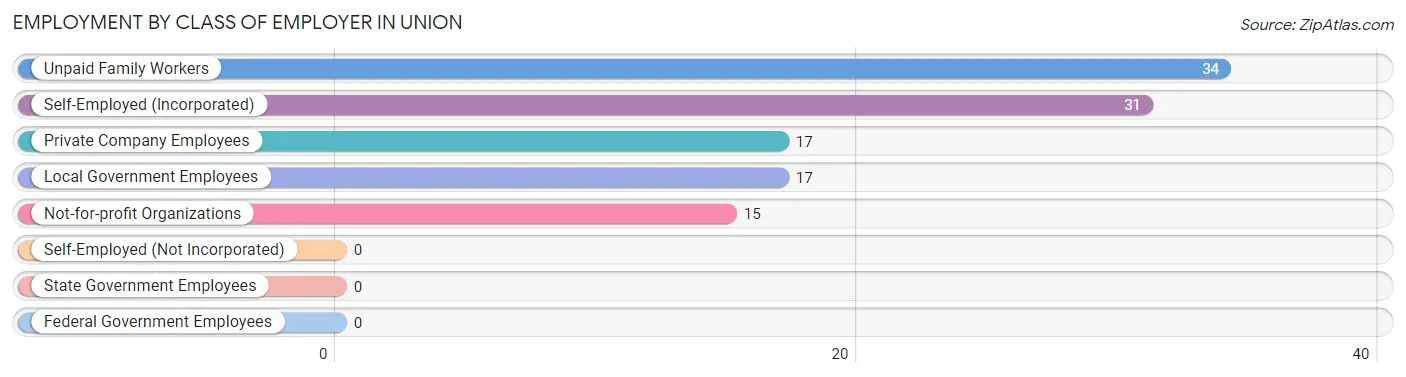
| Employer Class | # Employees | % Employees |
| Private Company Employees | 17 | 14.9% |
| Self-Employed (Incorporated) | 31 | 27.2% |
| Self-Employed (Not Incorporated) | 0 | 0.0% |
| Not-for-profit Organizations | 15 | 13.2% |
| Local Government Employees | 17 | 14.9% |
| State Government Employees | 0 | 0.0% |
| Federal Government Employees | 0 | 0.0% |
| Unpaid Family Workers | 34 | 29.8% |
| Total | 114 | 100.0% |
Employment Status by Age in Union
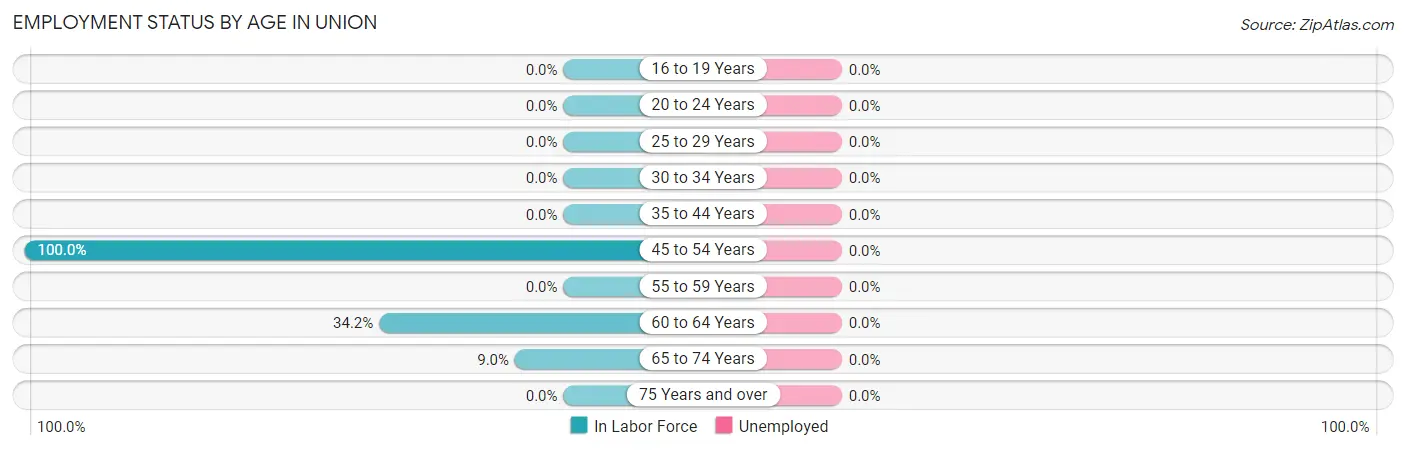
| Age Bracket | In Labor Force | Unemployed |
| 16 to 19 Years | 0 (0.0%) | 0 (0.0%) |
| 20 to 24 Years | 0 (0.0%) | 0 (0.0%) |
| 25 to 29 Years | 0 (0.0%) | 0 (0.0%) |
| 30 to 34 Years | 0 (0.0%) | 0 (0.0%) |
| 35 to 44 Years | 0 (0.0%) | 0 (0.0%) |
| 45 to 54 Years | 59 (100.0%) | 0 (0.0%) |
| 55 to 59 Years | 0 (0.0%) | 0 (0.0%) |
| 60 to 64 Years | 40 (34.2%) | 0 (0.0%) |
| 65 to 74 Years | 15 (9.0%) | 0 (0.0%) |
| 75 Years and over | 0 (0.0%) | 0 (0.0%) |
| Total | 114 (29.3%) | 0 (0.0%) |
Employment Status by Educational Attainment in Union
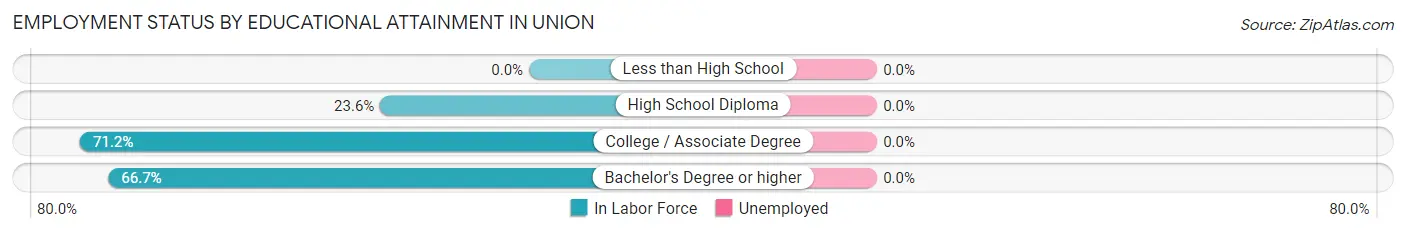
| Educational Attainment | In Labor Force | Unemployed |
| Less than High School | 0 (0.0%) | 0 (0.0%) |
| High School Diploma | 17 (23.6%) | 0 (0.0%) |
| College / Associate Degree | 42 (71.2%) | 0 (0.0%) |
| Bachelor's Degree or higher | 40 (66.7%) | 0 (0.0%) |
| Total | 99 (51.8%) | 0 (0.0%) |
Employment Occupations by Sex in Union
Management, Business, Science and Arts Occupations
The most common Management, Business, Science and Arts occupations in Union are , and Management (40 | 35.1%).
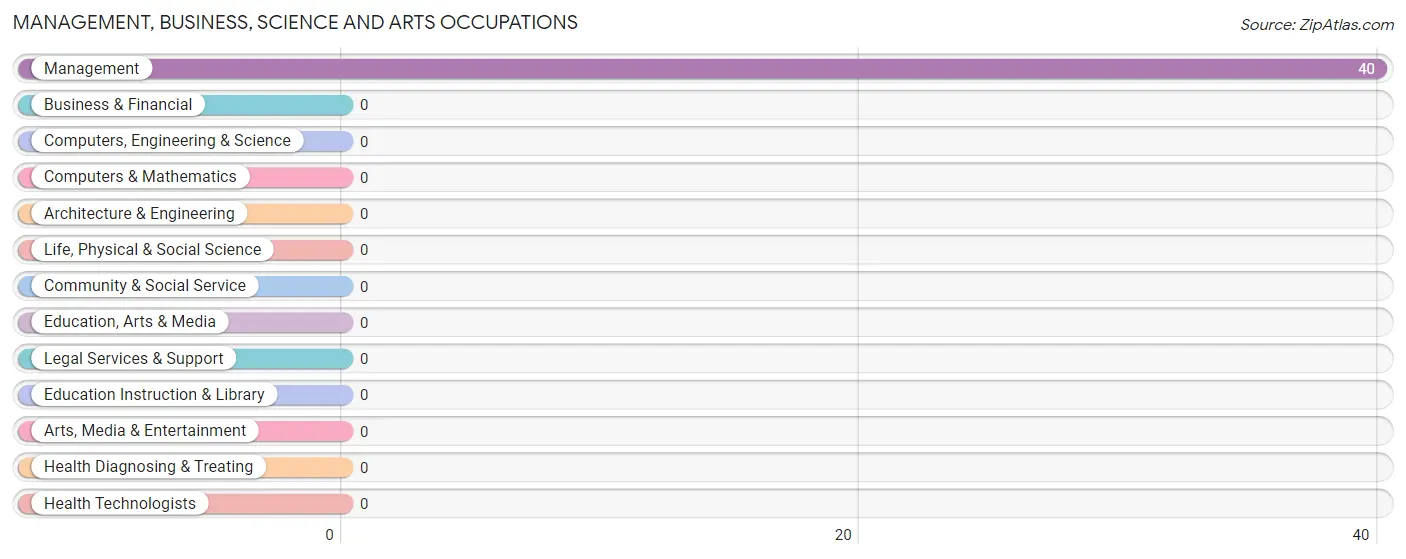
Management, Business, Science and Arts Occupations by Sex
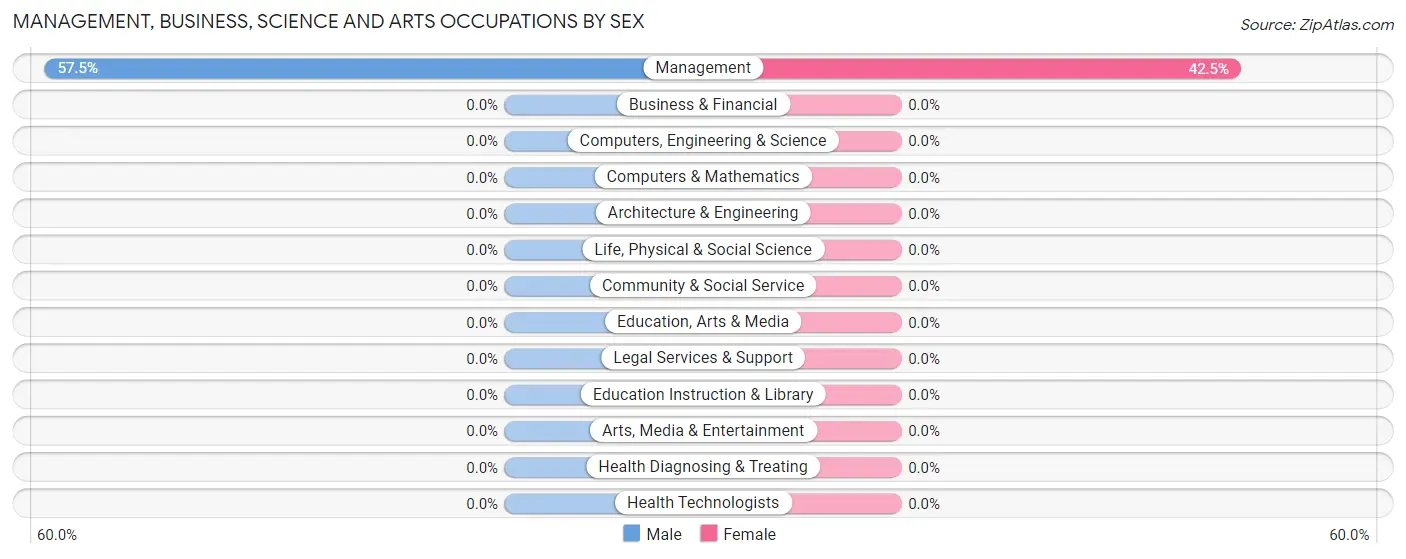
| Occupation | Male | Female |
| Management | 23 (57.5%) | 17 (42.5%) |
| Business & Financial | 0 (0.0%) | 0 (0.0%) |
| Computers, Engineering & Science | 0 (0.0%) | 0 (0.0%) |
| Computers & Mathematics | 0 (0.0%) | 0 (0.0%) |
| Architecture & Engineering | 0 (0.0%) | 0 (0.0%) |
| Life, Physical & Social Science | 0 (0.0%) | 0 (0.0%) |
| Community & Social Service | 0 (0.0%) | 0 (0.0%) |
| Education, Arts & Media | 0 (0.0%) | 0 (0.0%) |
| Legal Services & Support | 0 (0.0%) | 0 (0.0%) |
| Education Instruction & Library | 0 (0.0%) | 0 (0.0%) |
| Arts, Media & Entertainment | 0 (0.0%) | 0 (0.0%) |
| Health Diagnosing & Treating | 0 (0.0%) | 0 (0.0%) |
| Health Technologists | 0 (0.0%) | 0 (0.0%) |
| Total (Category) | 23 (57.5%) | 17 (42.5%) |
| Total (Overall) | 48 (42.1%) | 66 (57.9%) |
Services Occupations
Services Occupations by Sex
| Occupation | Male | Female |
| Healthcare Support | 0 (0.0%) | 0 (0.0%) |
| Security & Protection | 0 (0.0%) | 0 (0.0%) |
| Firefighting & Prevention | 0 (0.0%) | 0 (0.0%) |
| Law Enforcement | 0 (0.0%) | 0 (0.0%) |
| Food Preparation & Serving | 0 (0.0%) | 0 (0.0%) |
| Cleaning & Maintenance | 0 (0.0%) | 0 (0.0%) |
| Personal Care & Service | 0 (0.0%) | 0 (0.0%) |
| Total (Category) | 0 (0.0%) | 0 (0.0%) |
| Total (Overall) | 48 (42.1%) | 66 (57.9%) |
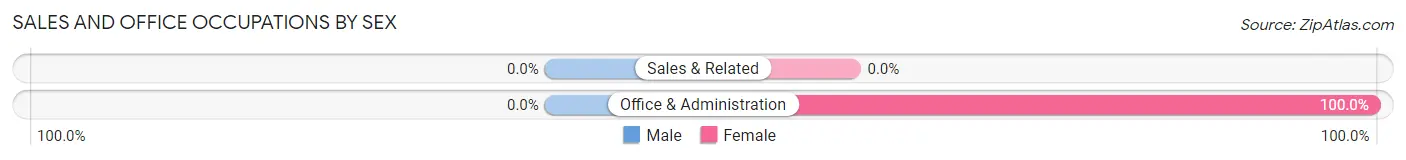
Sales and Office Occupations
The most common Sales and Office occupations in Union are , and Office & Administration (49 | 43.0%).
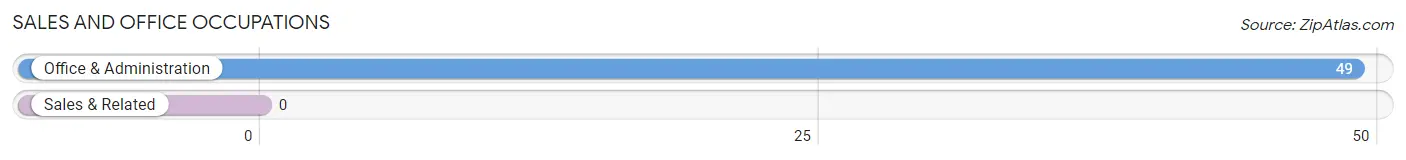
Sales and Office Occupations by Sex
| Occupation | Male | Female |
| Sales & Related | 0 (0.0%) | 0 (0.0%) |
| Office & Administration | 0 (0.0%) | 49 (100.0%) |
| Total (Category) | 0 (0.0%) | 49 (100.0%) |
| Total (Overall) | 48 (42.1%) | 66 (57.9%) |
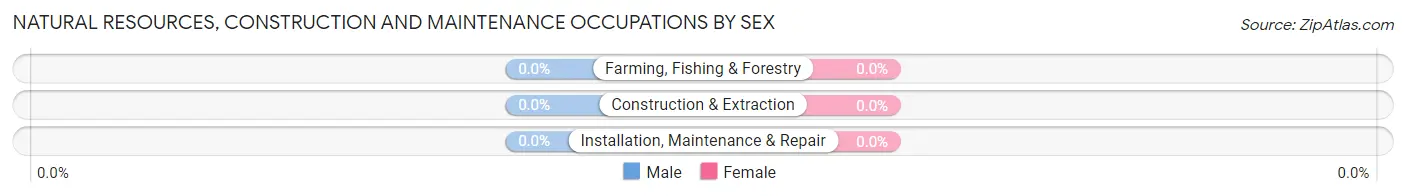
Natural Resources, Construction and Maintenance Occupations
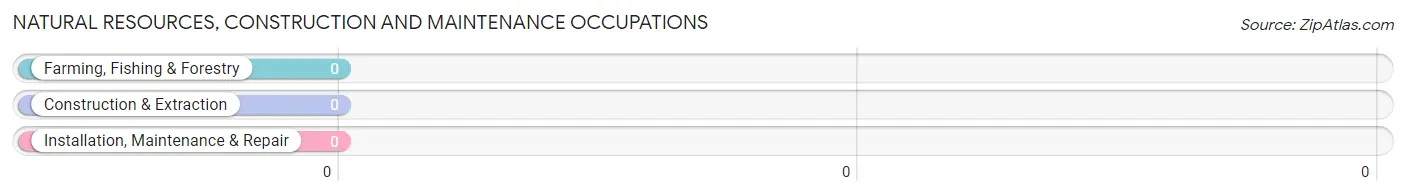
Natural Resources, Construction and Maintenance Occupations by Sex
| Occupation | Male | Female |
| Farming, Fishing & Forestry | 0 (0.0%) | 0 (0.0%) |
| Construction & Extraction | 0 (0.0%) | 0 (0.0%) |
| Installation, Maintenance & Repair | 0 (0.0%) | 0 (0.0%) |
| Total (Category) | 0 (0.0%) | 0 (0.0%) |
| Total (Overall) | 48 (42.1%) | 66 (57.9%) |
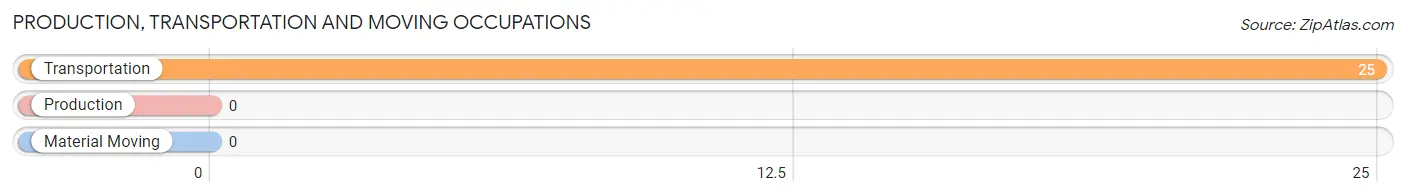
Production, Transportation and Moving Occupations
The most common Production, Transportation and Moving occupations in Union are , and Transportation (25 | 21.9%).
Production, Transportation and Moving Occupations by Sex
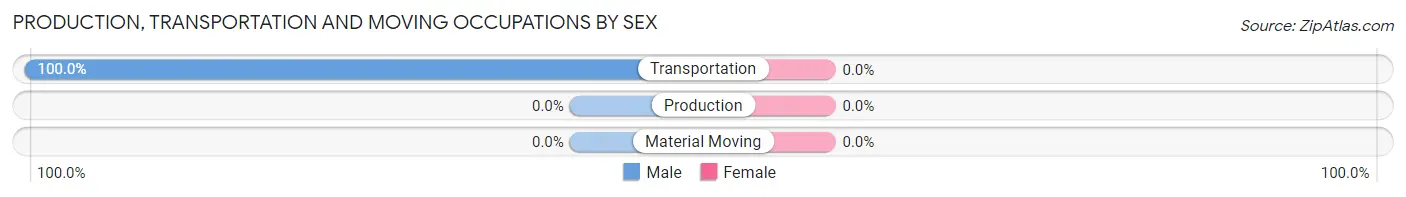
| Occupation | Male | Female |
| Production | 0 (0.0%) | 0 (0.0%) |
| Transportation | 25 (100.0%) | 0 (0.0%) |
| Material Moving | 0 (0.0%) | 0 (0.0%) |
| Total (Category) | 25 (100.0%) | 0 (0.0%) |
| Total (Overall) | 48 (42.1%) | 66 (57.9%) |
Employment Industries by Sex in Union
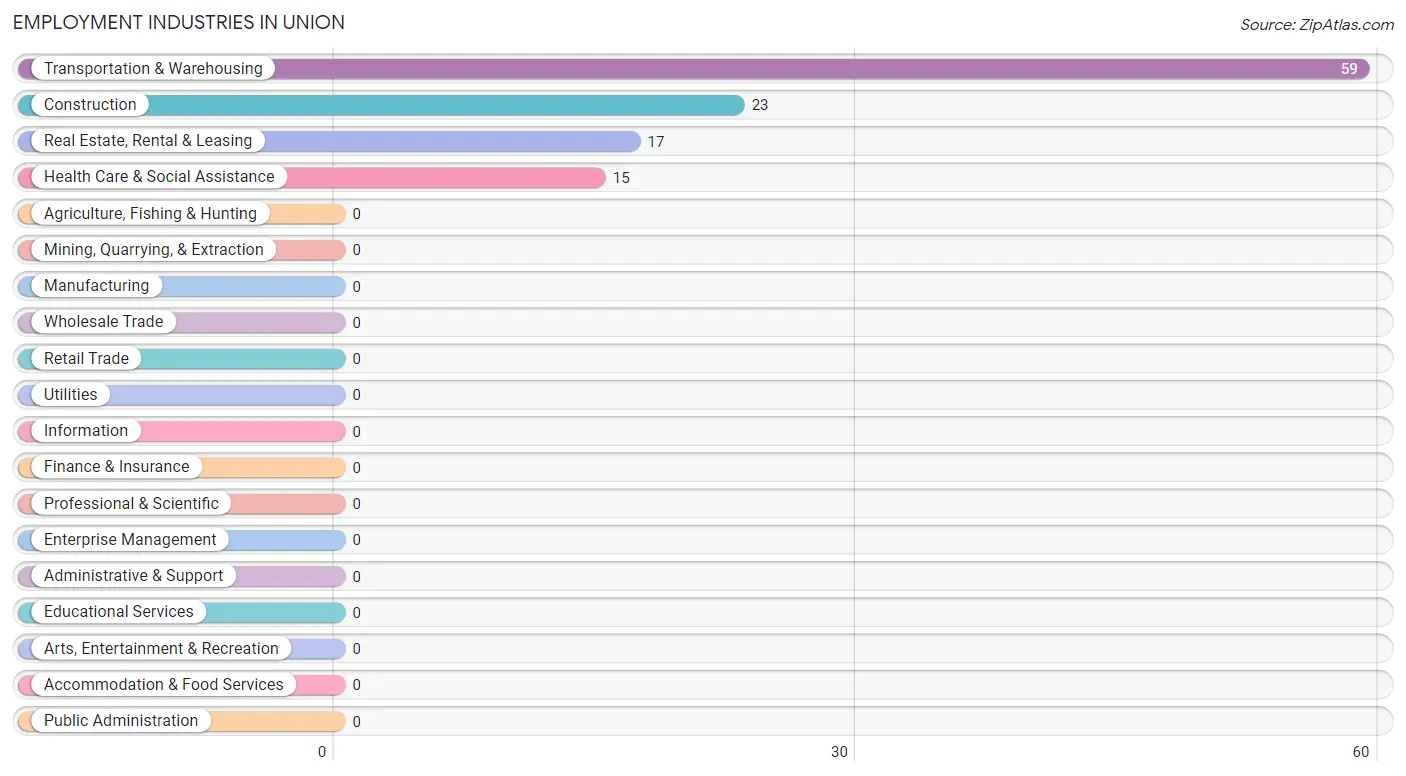
Employment Industries in Union
The major employment industries in Union include Transportation & Warehousing (59 | 51.7%), Construction (23 | 20.2%), Real Estate, Rental & Leasing (17 | 14.9%), and Health Care & Social Assistance (15 | 13.2%).
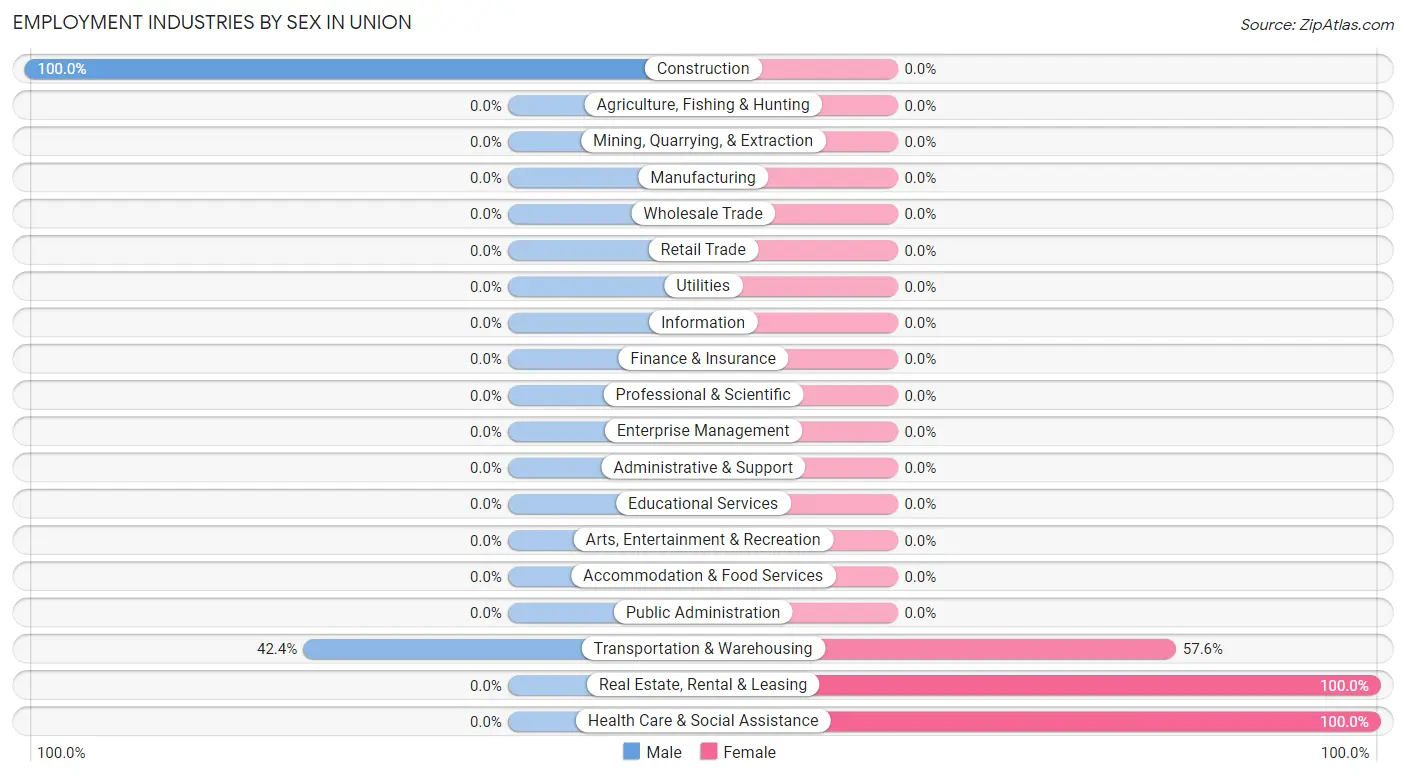
Employment Industries by Sex in Union
The Union industries that see more men than women are Construction (100.0%), and Transportation & Warehousing (42.4%), whereas the industries that tend to have a higher number of women are Real Estate, Rental & Leasing (100.0%), Health Care & Social Assistance (100.0%), and Transportation & Warehousing (57.6%).
| Industry | Male | Female |
| Agriculture, Fishing & Hunting | 0 (0.0%) | 0 (0.0%) |
| Mining, Quarrying, & Extraction | 0 (0.0%) | 0 (0.0%) |
| Construction | 23 (100.0%) | 0 (0.0%) |
| Manufacturing | 0 (0.0%) | 0 (0.0%) |
| Wholesale Trade | 0 (0.0%) | 0 (0.0%) |
| Retail Trade | 0 (0.0%) | 0 (0.0%) |
| Transportation & Warehousing | 25 (42.4%) | 34 (57.6%) |
| Utilities | 0 (0.0%) | 0 (0.0%) |
| Information | 0 (0.0%) | 0 (0.0%) |
| Finance & Insurance | 0 (0.0%) | 0 (0.0%) |
| Real Estate, Rental & Leasing | 0 (0.0%) | 17 (100.0%) |
| Professional & Scientific | 0 (0.0%) | 0 (0.0%) |
| Enterprise Management | 0 (0.0%) | 0 (0.0%) |
| Administrative & Support | 0 (0.0%) | 0 (0.0%) |
| Educational Services | 0 (0.0%) | 0 (0.0%) |
| Health Care & Social Assistance | 0 (0.0%) | 15 (100.0%) |
| Arts, Entertainment & Recreation | 0 (0.0%) | 0 (0.0%) |
| Accommodation & Food Services | 0 (0.0%) | 0 (0.0%) |
| Public Administration | 0 (0.0%) | 0 (0.0%) |
| Total | 48 (42.1%) | 66 (57.9%) |
Education in Union
School Enrollment in Union
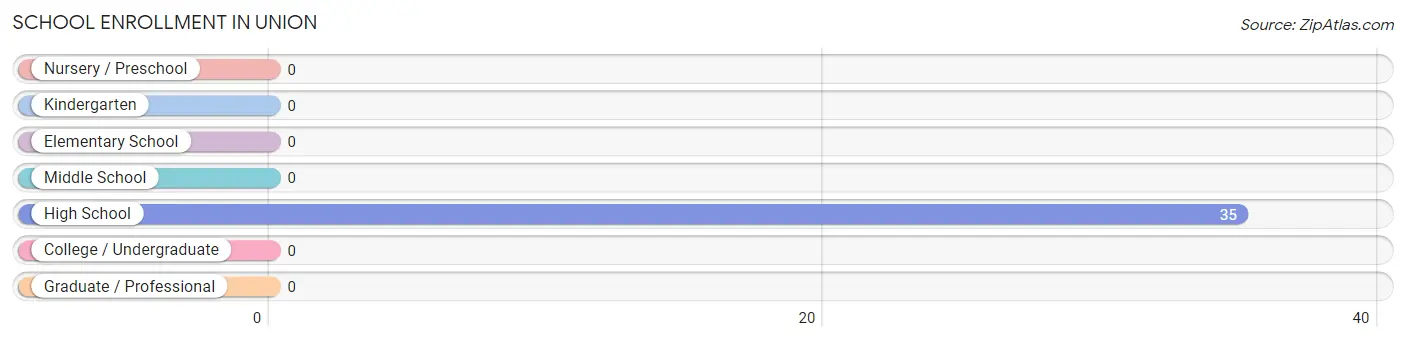
| School Level | # Students | % Students |
| Nursery / Preschool | 0 | 0.0% |
| Kindergarten | 0 | 0.0% |
| Elementary School | 0 | 0.0% |
| Middle School | 0 | 0.0% |
| High School | 35 | 100.0% |
| College / Undergraduate | 0 | 0.0% |
| Graduate / Professional | 0 | 0.0% |
| Total | 35 | 100.0% |
School Enrollment by Age by Funding Source in Union
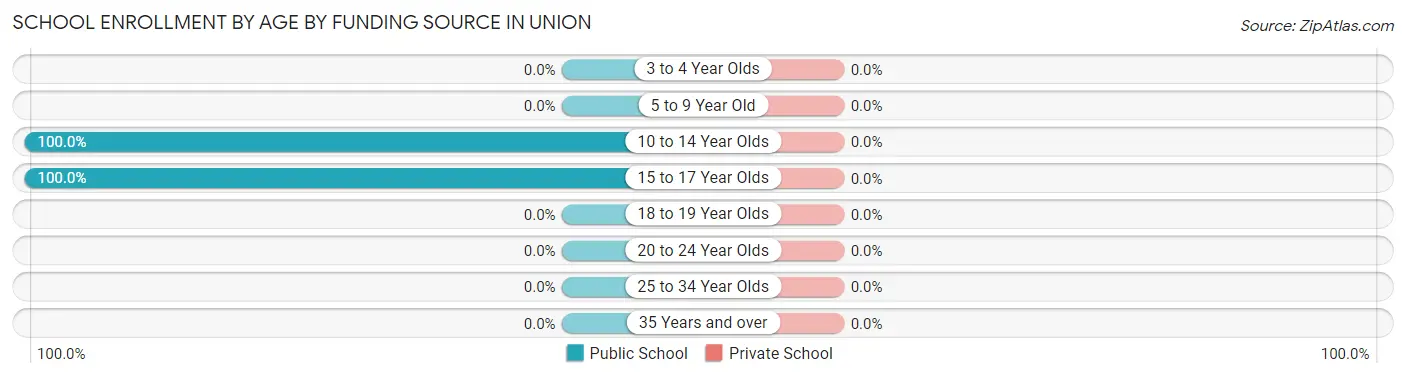
| Age Bracket | Public School | Private School |
| 3 to 4 Year Olds | 0 (0.0%) | 0 (0.0%) |
| 5 to 9 Year Old | 0 (0.0%) | 0 (0.0%) |
| 10 to 14 Year Olds | 17 (100.0%) | 0 (0.0%) |
| 15 to 17 Year Olds | 18 (100.0%) | 0 (0.0%) |
| 18 to 19 Year Olds | 0 (0.0%) | 0 (0.0%) |
| 20 to 24 Year Olds | 0 (0.0%) | 0 (0.0%) |
| 25 to 34 Year Olds | 0 (0.0%) | 0 (0.0%) |
| 35 Years and over | 0 (0.0%) | 0 (0.0%) |
| Total | 35 (100.0%) | 0 (0.0%) |
Educational Attainment by Field of Study in Union
Social sciences (43 | 38.7%), visual & performing arts (34 | 30.6%), arts & humanities (20 | 18.0%), and engineering (14 | 12.6%) are the most common fields of study among 111 individuals in Union who have obtained a bachelor's degree or higher.
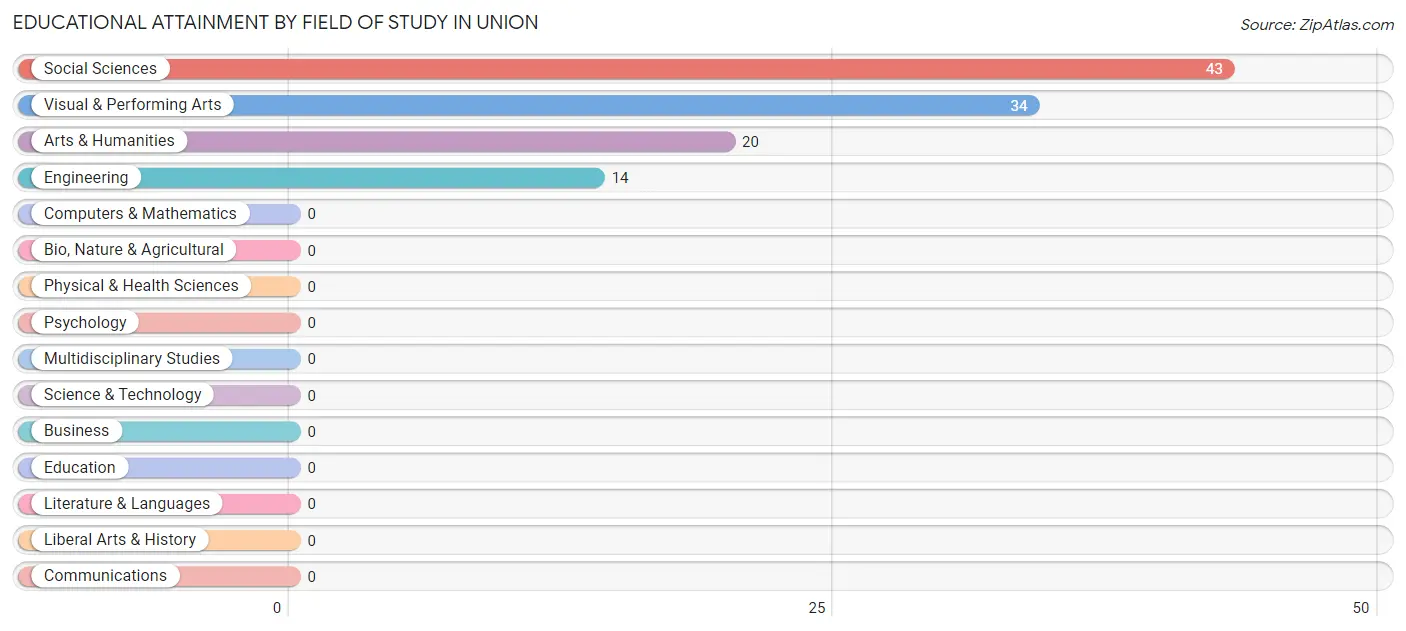
| Field of Study | # Graduates | % Graduates |
| Computers & Mathematics | 0 | 0.0% |
| Bio, Nature & Agricultural | 0 | 0.0% |
| Physical & Health Sciences | 0 | 0.0% |
| Psychology | 0 | 0.0% |
| Social Sciences | 43 | 38.7% |
| Engineering | 14 | 12.6% |
| Multidisciplinary Studies | 0 | 0.0% |
| Science & Technology | 0 | 0.0% |
| Business | 0 | 0.0% |
| Education | 0 | 0.0% |
| Literature & Languages | 0 | 0.0% |
| Liberal Arts & History | 0 | 0.0% |
| Visual & Performing Arts | 34 | 30.6% |
| Communications | 0 | 0.0% |
| Arts & Humanities | 20 | 18.0% |
| Total | 111 | 100.0% |
Transportation & Commute in Union
Vehicle Availability by Sex in Union
The most prevalent vehicle ownership categories in Union are males with 1 vehicle (25, accounting for 52.1%) and females with 1 vehicle (34, making up 37.9%).
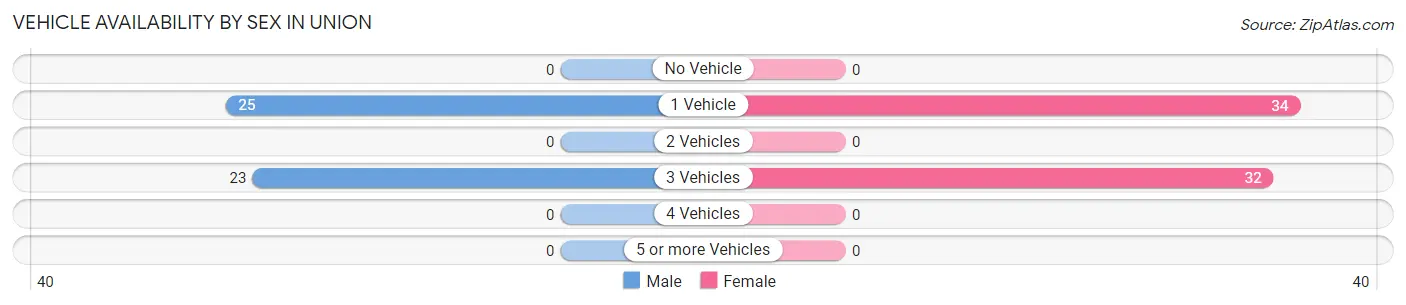
| Vehicles Available | Male | Female |
| No Vehicle | 0 (0.0%) | 0 (0.0%) |
| 1 Vehicle | 25 (52.1%) | 34 (51.5%) |
| 2 Vehicles | 0 (0.0%) | 0 (0.0%) |
| 3 Vehicles | 23 (47.9%) | 32 (48.5%) |
| 4 Vehicles | 0 (0.0%) | 0 (0.0%) |
| 5 or more Vehicles | 0 (0.0%) | 0 (0.0%) |
| Total | 48 (100.0%) | 66 (100.0%) |
Commute Time in Union
The most frequently occuring commute durations in Union are 45 to 59 minutes (25 commuters, 62.5%), 90 or more minutes (15 commuters, 37.5%), and less than 5 minutes (0 commuters, 0.0%).
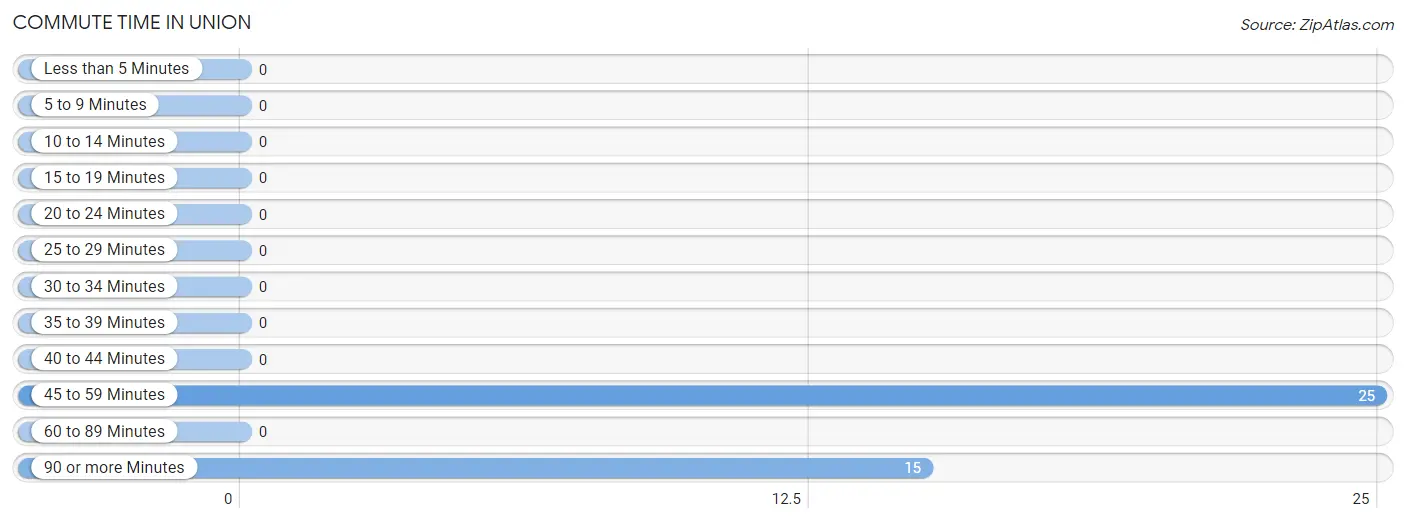
| Commute Time | # Commuters | % Commuters |
| Less than 5 Minutes | 0 | 0.0% |
| 5 to 9 Minutes | 0 | 0.0% |
| 10 to 14 Minutes | 0 | 0.0% |
| 15 to 19 Minutes | 0 | 0.0% |
| 20 to 24 Minutes | 0 | 0.0% |
| 25 to 29 Minutes | 0 | 0.0% |
| 30 to 34 Minutes | 0 | 0.0% |
| 35 to 39 Minutes | 0 | 0.0% |
| 40 to 44 Minutes | 0 | 0.0% |
| 45 to 59 Minutes | 25 | 62.5% |
| 60 to 89 Minutes | 0 | 0.0% |
| 90 or more Minutes | 15 | 37.5% |
Commute Time by Sex in Union
The most common commute times in Union are 45 to 59 minutes (25 commuters, 100.0%) for males and 90 or more minutes (15 commuters, 100.0%) for females.
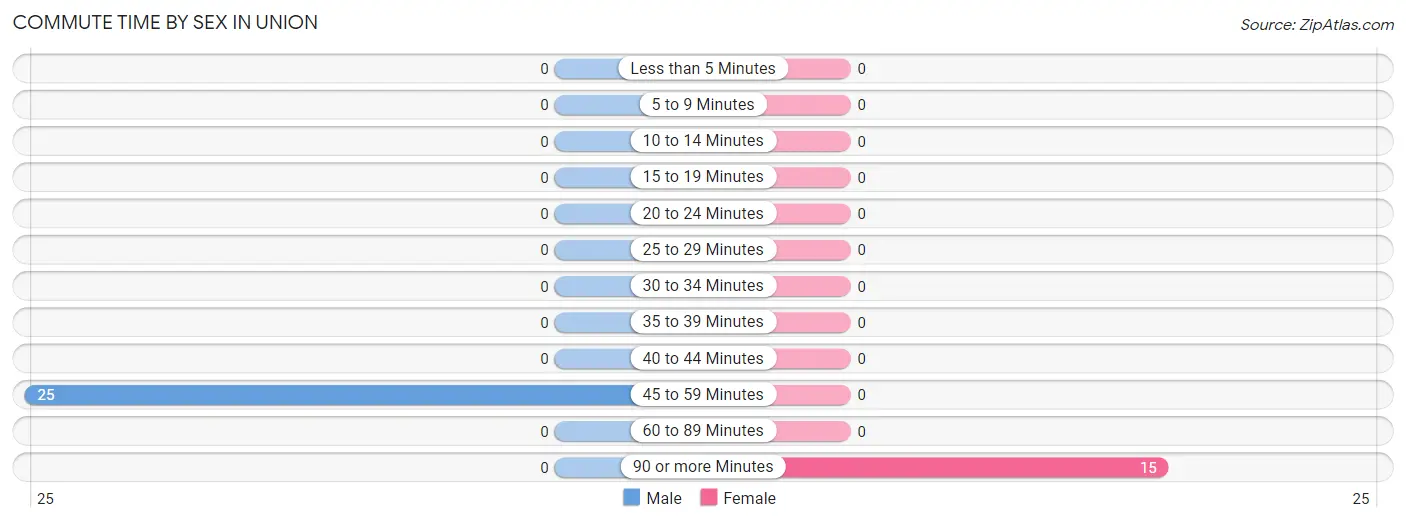
| Commute Time | Male | Female |
| Less than 5 Minutes | 0 (0.0%) | 0 (0.0%) |
| 5 to 9 Minutes | 0 (0.0%) | 0 (0.0%) |
| 10 to 14 Minutes | 0 (0.0%) | 0 (0.0%) |
| 15 to 19 Minutes | 0 (0.0%) | 0 (0.0%) |
| 20 to 24 Minutes | 0 (0.0%) | 0 (0.0%) |
| 25 to 29 Minutes | 0 (0.0%) | 0 (0.0%) |
| 30 to 34 Minutes | 0 (0.0%) | 0 (0.0%) |
| 35 to 39 Minutes | 0 (0.0%) | 0 (0.0%) |
| 40 to 44 Minutes | 0 (0.0%) | 0 (0.0%) |
| 45 to 59 Minutes | 25 (100.0%) | 0 (0.0%) |
| 60 to 89 Minutes | 0 (0.0%) | 0 (0.0%) |
| 90 or more Minutes | 0 (0.0%) | 15 (100.0%) |
Time of Departure to Work by Sex in Union
The most frequent times of departure to work in Union are 5:00 AM to 5:29 AM (25, 100.0%) for males and 12:00 AM to 4:59 AM (15, 100.0%) for females.
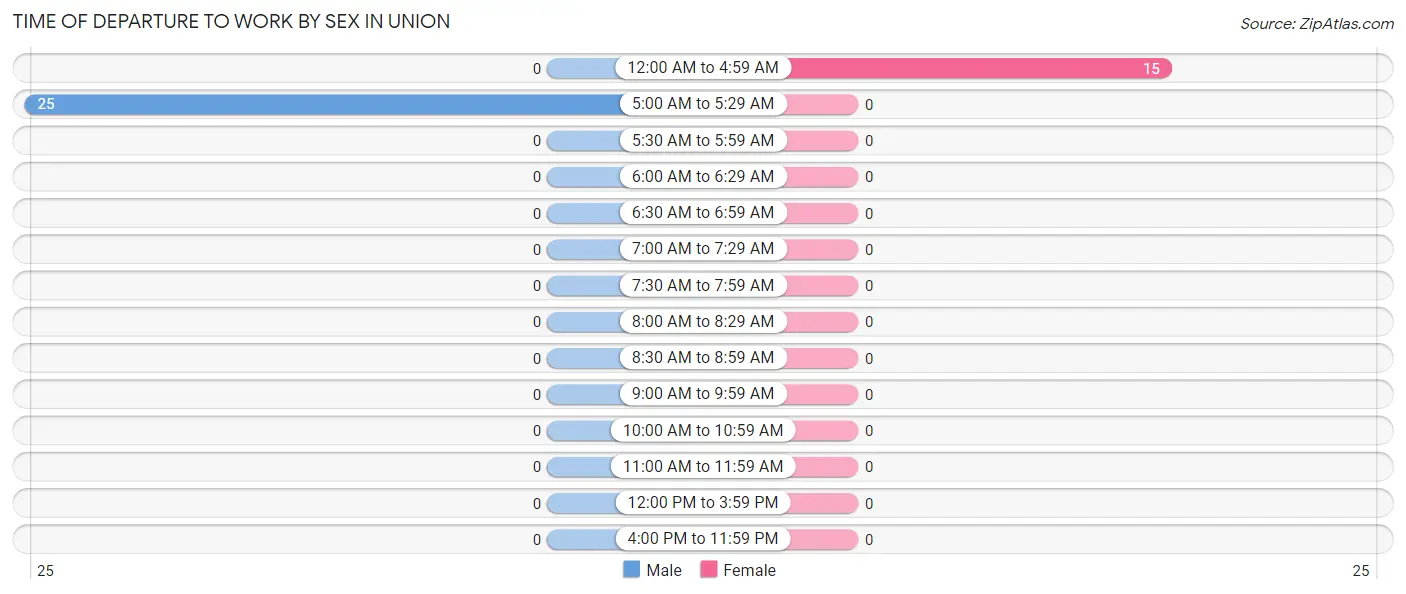
| Time of Departure | Male | Female |
| 12:00 AM to 4:59 AM | 0 (0.0%) | 15 (100.0%) |
| 5:00 AM to 5:29 AM | 25 (100.0%) | 0 (0.0%) |
| 5:30 AM to 5:59 AM | 0 (0.0%) | 0 (0.0%) |
| 6:00 AM to 6:29 AM | 0 (0.0%) | 0 (0.0%) |
| 6:30 AM to 6:59 AM | 0 (0.0%) | 0 (0.0%) |
| 7:00 AM to 7:29 AM | 0 (0.0%) | 0 (0.0%) |
| 7:30 AM to 7:59 AM | 0 (0.0%) | 0 (0.0%) |
| 8:00 AM to 8:29 AM | 0 (0.0%) | 0 (0.0%) |
| 8:30 AM to 8:59 AM | 0 (0.0%) | 0 (0.0%) |
| 9:00 AM to 9:59 AM | 0 (0.0%) | 0 (0.0%) |
| 10:00 AM to 10:59 AM | 0 (0.0%) | 0 (0.0%) |
| 11:00 AM to 11:59 AM | 0 (0.0%) | 0 (0.0%) |
| 12:00 PM to 3:59 PM | 0 (0.0%) | 0 (0.0%) |
| 4:00 PM to 11:59 PM | 0 (0.0%) | 0 (0.0%) |
| Total | 25 (100.0%) | 15 (100.0%) |
Housing Occupancy in Union
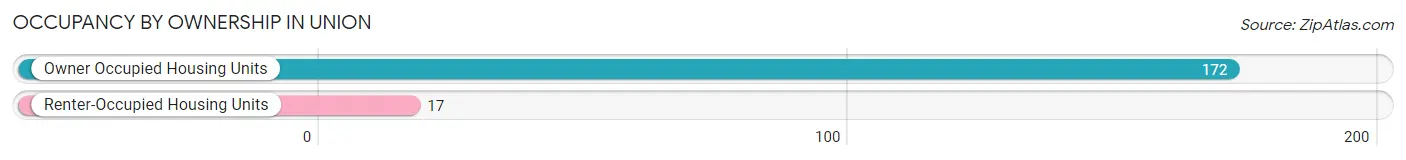
Occupancy by Ownership in Union
Of the total 189 dwellings in Union, owner-occupied units account for 172 (91.0%), while renter-occupied units make up 17 (9.0%).
| Occupancy | # Housing Units | % Housing Units |
| Owner Occupied Housing Units | 172 | 91.0% |
| Renter-Occupied Housing Units | 17 | 9.0% |
| Total Occupied Housing Units | 189 | 100.0% |
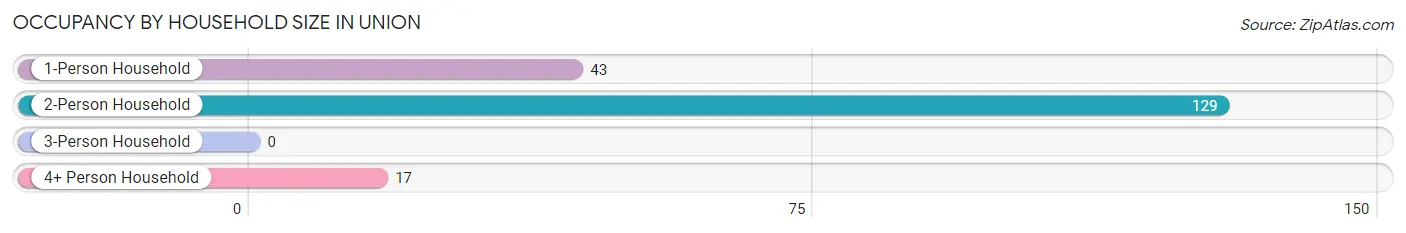
Occupancy by Household Size in Union
| Household Size | # Housing Units | % Housing Units |
| 1-Person Household | 43 | 22.8% |
| 2-Person Household | 129 | 68.2% |
| 3-Person Household | 0 | 0.0% |
| 4+ Person Household | 17 | 9.0% |
| Total Housing Units | 189 | 100.0% |
Occupancy by Ownership by Household Size in Union
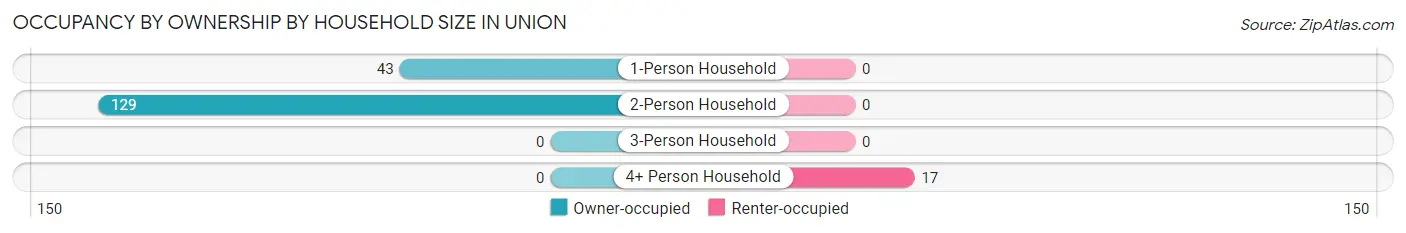
| Household Size | Owner-occupied | Renter-occupied |
| 1-Person Household | 43 (100.0%) | 0 (0.0%) |
| 2-Person Household | 129 (100.0%) | 0 (0.0%) |
| 3-Person Household | 0 (0.0%) | 0 (0.0%) |
| 4+ Person Household | 0 (0.0%) | 17 (100.0%) |
| Total Housing Units | 172 (91.0%) | 17 (9.0%) |
Occupancy by Educational Attainment in Union
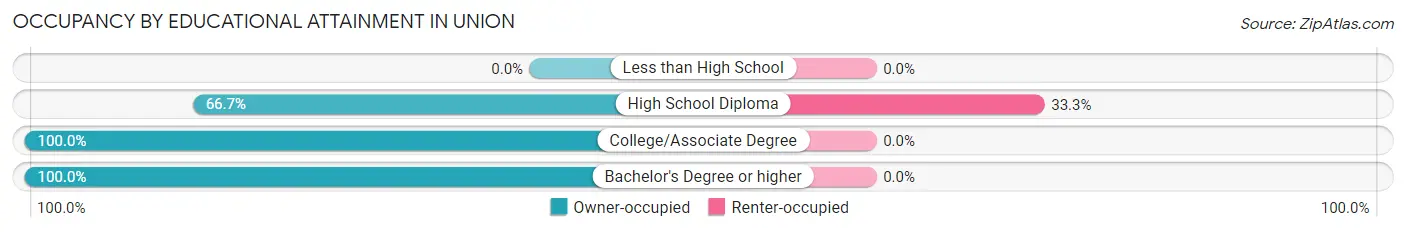
| Household Size | Owner-occupied | Renter-occupied |
| Less than High School | 0 (0.0%) | 0 (0.0%) |
| High School Diploma | 34 (66.7%) | 17 (33.3%) |
| College/Associate Degree | 87 (100.0%) | 0 (0.0%) |
| Bachelor's Degree or higher | 51 (100.0%) | 0 (0.0%) |
Occupancy by Age of Householder in Union
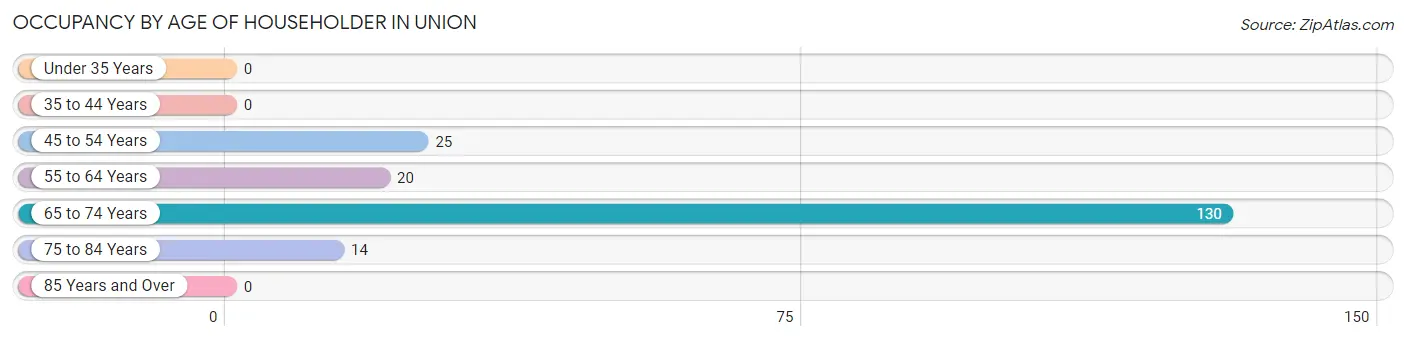
| Age Bracket | # Households | % Households |
| Under 35 Years | 0 | 0.0% |
| 35 to 44 Years | 0 | 0.0% |
| 45 to 54 Years | 25 | 13.2% |
| 55 to 64 Years | 20 | 10.6% |
| 65 to 74 Years | 130 | 68.8% |
| 75 to 84 Years | 14 | 7.4% |
| 85 Years and Over | 0 | 0.0% |
| Total | 189 | 100.0% |
Housing Finances in Union
Median Income by Occupancy in Union
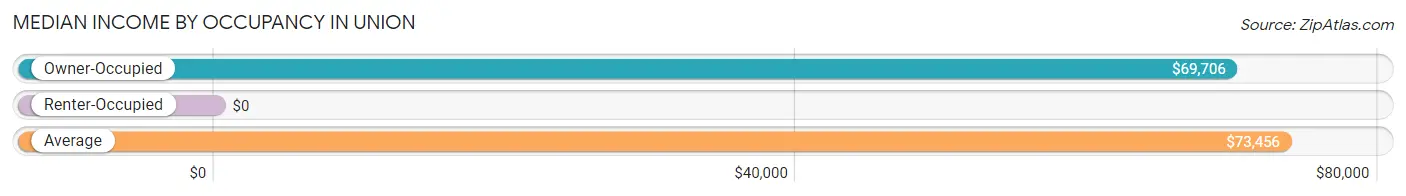
| Occupancy Type | # Households | Median Income |
| Owner-Occupied | 172 (91.0%) | $69,706 |
| Renter-Occupied | 17 (9.0%) | $0 |
| Average | 189 (100.0%) | $73,456 |
Occupancy by Householder Income Bracket in Union
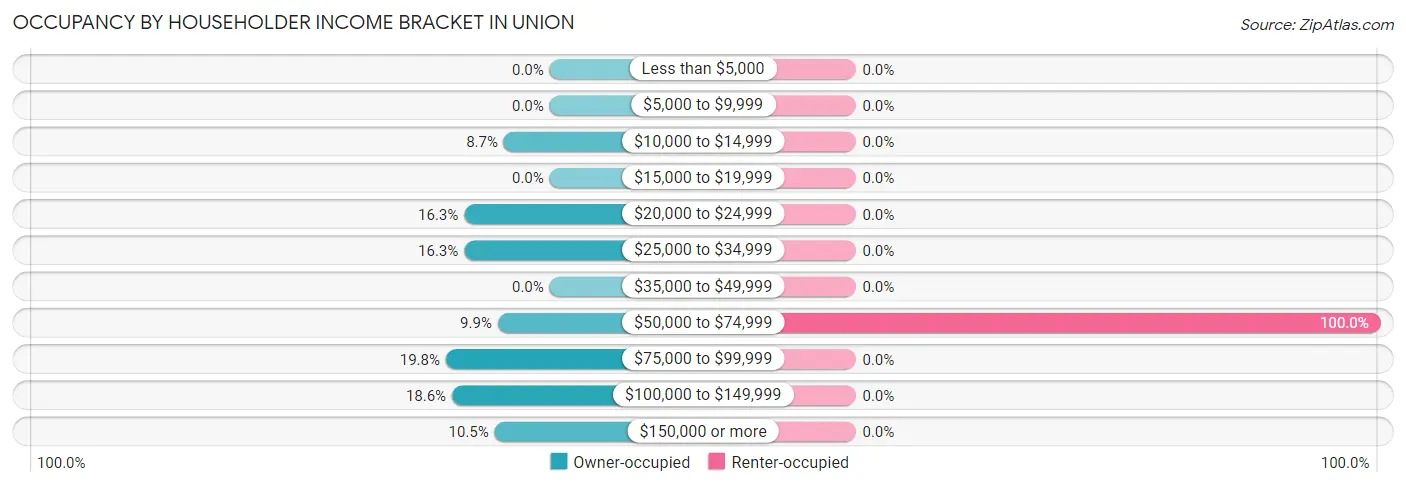
| Income Bracket | Owner-occupied | Renter-occupied |
| Less than $5,000 | 0 (0.0%) | 0 (0.0%) |
| $5,000 to $9,999 | 0 (0.0%) | 0 (0.0%) |
| $10,000 to $14,999 | 15 (8.7%) | 0 (0.0%) |
| $15,000 to $19,999 | 0 (0.0%) | 0 (0.0%) |
| $20,000 to $24,999 | 28 (16.3%) | 0 (0.0%) |
| $25,000 to $34,999 | 28 (16.3%) | 0 (0.0%) |
| $35,000 to $49,999 | 0 (0.0%) | 0 (0.0%) |
| $50,000 to $74,999 | 17 (9.9%) | 17 (100.0%) |
| $75,000 to $99,999 | 34 (19.8%) | 0 (0.0%) |
| $100,000 to $149,999 | 32 (18.6%) | 0 (0.0%) |
| $150,000 or more | 18 (10.5%) | 0 (0.0%) |
| Total | 172 (100.0%) | 17 (100.0%) |
Monthly Housing Cost Tiers in Union

| Monthly Cost | Owner-occupied | Renter-occupied |
| Less than $300 | 0 (0.0%) | 0 (0.0%) |
| $300 to $499 | 17 (9.9%) | 0 (0.0%) |
| $500 to $799 | 0 (0.0%) | 0 (0.0%) |
| $800 to $999 | 91 (52.9%) | 0 (0.0%) |
| $1,000 to $1,499 | 15 (8.7%) | 17 (100.0%) |
| $1,500 to $1,999 | 32 (18.6%) | 0 (0.0%) |
| $2,000 to $2,499 | 17 (9.9%) | 0 (0.0%) |
| $2,500 to $2,999 | 0 (0.0%) | 0 (0.0%) |
| $3,000 or more | 0 (0.0%) | 0 (0.0%) |
| Total | 172 (100.0%) | 17 (100.0%) |
Physical Housing Characteristics in Union
Housing Structures in Union
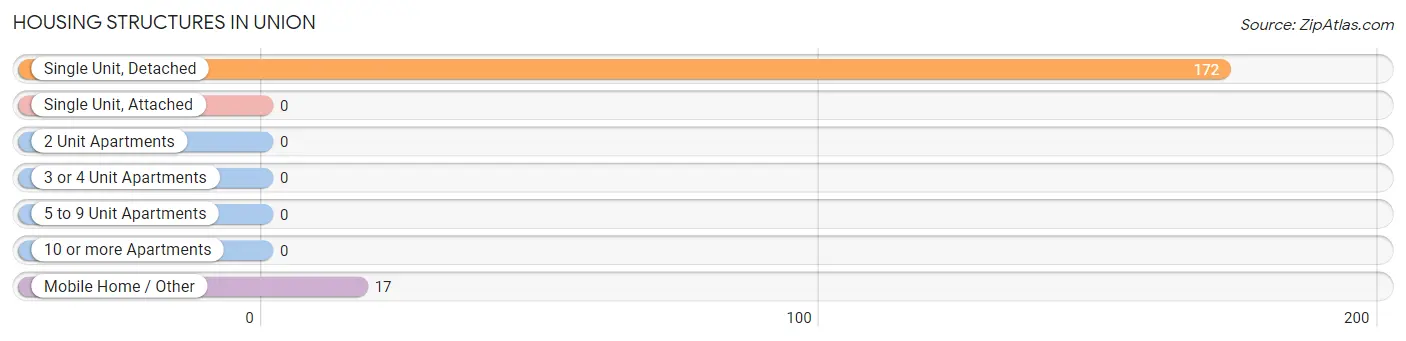
| Structure Type | # Housing Units | % Housing Units |
| Single Unit, Detached | 172 | 91.0% |
| Single Unit, Attached | 0 | 0.0% |
| 2 Unit Apartments | 0 | 0.0% |
| 3 or 4 Unit Apartments | 0 | 0.0% |
| 5 to 9 Unit Apartments | 0 | 0.0% |
| 10 or more Apartments | 0 | 0.0% |
| Mobile Home / Other | 17 | 9.0% |
| Total | 189 | 100.0% |
Housing Structures by Occupancy in Union
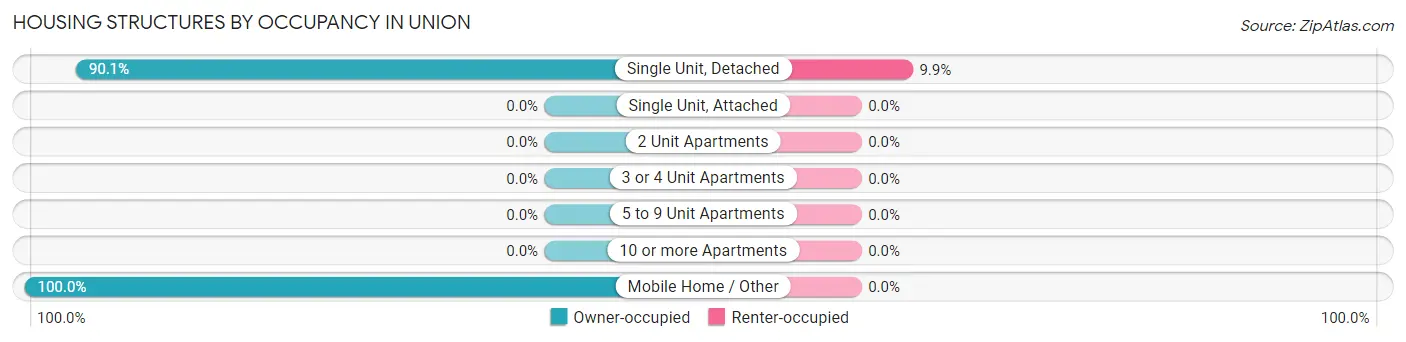
| Structure Type | Owner-occupied | Renter-occupied |
| Single Unit, Detached | 155 (90.1%) | 17 (9.9%) |
| Single Unit, Attached | 0 (0.0%) | 0 (0.0%) |
| 2 Unit Apartments | 0 (0.0%) | 0 (0.0%) |
| 3 or 4 Unit Apartments | 0 (0.0%) | 0 (0.0%) |
| 5 to 9 Unit Apartments | 0 (0.0%) | 0 (0.0%) |
| 10 or more Apartments | 0 (0.0%) | 0 (0.0%) |
| Mobile Home / Other | 17 (100.0%) | 0 (0.0%) |
| Total | 172 (91.0%) | 17 (9.0%) |
Housing Structures by Number of Rooms in Union
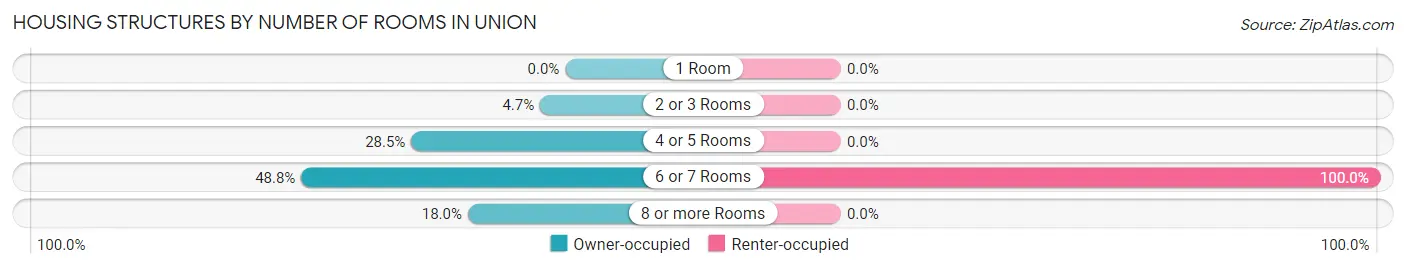
| Number of Rooms | Owner-occupied | Renter-occupied |
| 1 Room | 0 (0.0%) | 0 (0.0%) |
| 2 or 3 Rooms | 8 (4.6%) | 0 (0.0%) |
| 4 or 5 Rooms | 49 (28.5%) | 0 (0.0%) |
| 6 or 7 Rooms | 84 (48.8%) | 17 (100.0%) |
| 8 or more Rooms | 31 (18.0%) | 0 (0.0%) |
| Total | 172 (100.0%) | 17 (100.0%) |
Housing Structure by Heating Type in Union
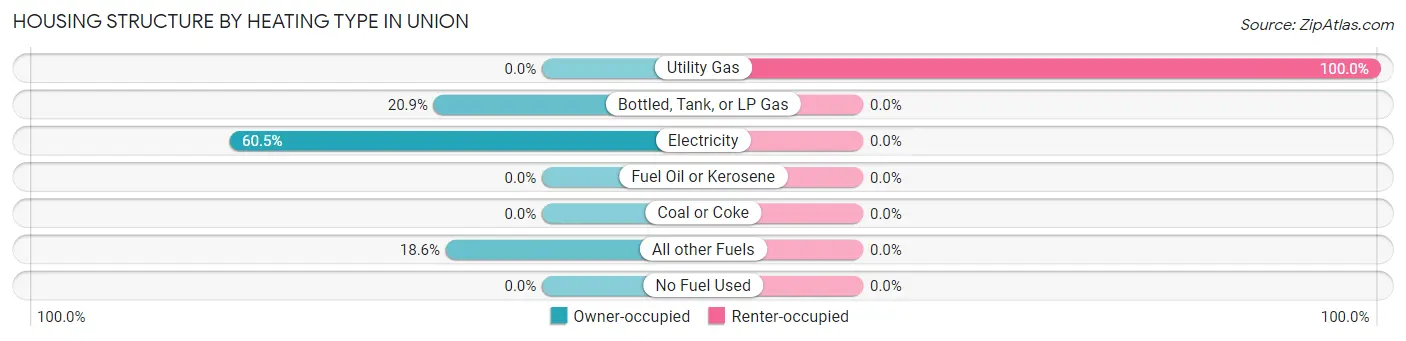
| Heating Type | Owner-occupied | Renter-occupied |
| Utility Gas | 0 (0.0%) | 17 (100.0%) |
| Bottled, Tank, or LP Gas | 36 (20.9%) | 0 (0.0%) |
| Electricity | 104 (60.5%) | 0 (0.0%) |
| Fuel Oil or Kerosene | 0 (0.0%) | 0 (0.0%) |
| Coal or Coke | 0 (0.0%) | 0 (0.0%) |
| All other Fuels | 32 (18.6%) | 0 (0.0%) |
| No Fuel Used | 0 (0.0%) | 0 (0.0%) |
| Total | 172 (100.0%) | 17 (100.0%) |
Household Vehicle Usage in Union
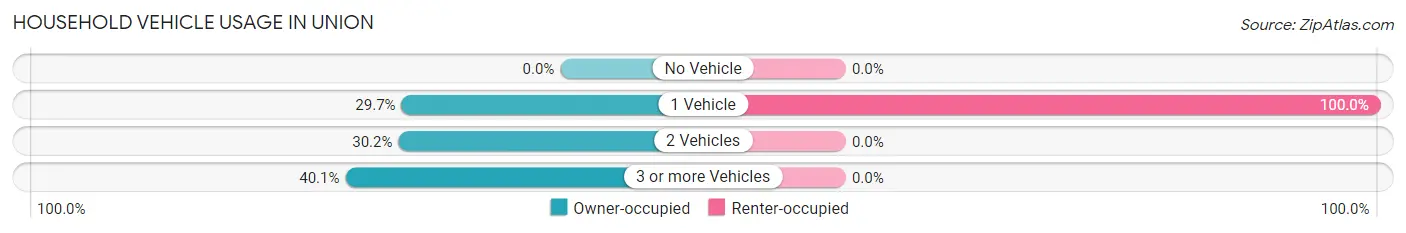
| Vehicles per Household | Owner-occupied | Renter-occupied |
| No Vehicle | 0 (0.0%) | 0 (0.0%) |
| 1 Vehicle | 51 (29.6%) | 17 (100.0%) |
| 2 Vehicles | 52 (30.2%) | 0 (0.0%) |
| 3 or more Vehicles | 69 (40.1%) | 0 (0.0%) |
| Total | 172 (100.0%) | 17 (100.0%) |
Real Estate & Mortgages in Union
Real Estate and Mortgage Overview in Union
| Characteristic | Without Mortgage | With Mortgage |
| Housing Units | 83 | 89 |
| Median Property Value | $714,800 | $0 |
| Median Household Income | - | - |
| Monthly Housing Costs | $860 | $0 |
| Real Estate Taxes | $4,675 | $0 |
Property Value by Mortgage Status in Union
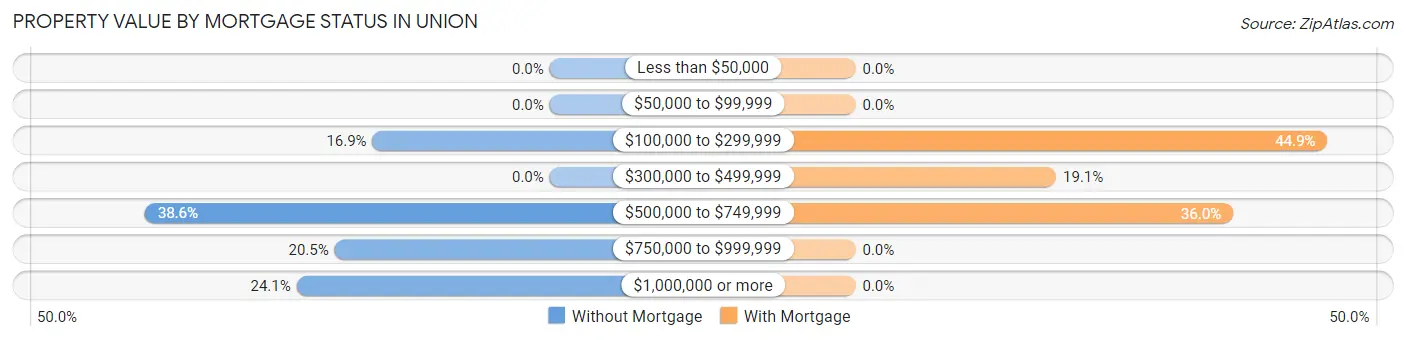
| Property Value | Without Mortgage | With Mortgage |
| Less than $50,000 | 0 (0.0%) | 0 (0.0%) |
| $50,000 to $99,999 | 0 (0.0%) | 0 (0.0%) |
| $100,000 to $299,999 | 14 (16.9%) | 40 (44.9%) |
| $300,000 to $499,999 | 0 (0.0%) | 17 (19.1%) |
| $500,000 to $749,999 | 32 (38.6%) | 32 (36.0%) |
| $750,000 to $999,999 | 17 (20.5%) | 0 (0.0%) |
| $1,000,000 or more | 20 (24.1%) | 0 (0.0%) |
| Total | 83 (100.0%) | 89 (100.0%) |
Household Income by Mortgage Status in Union
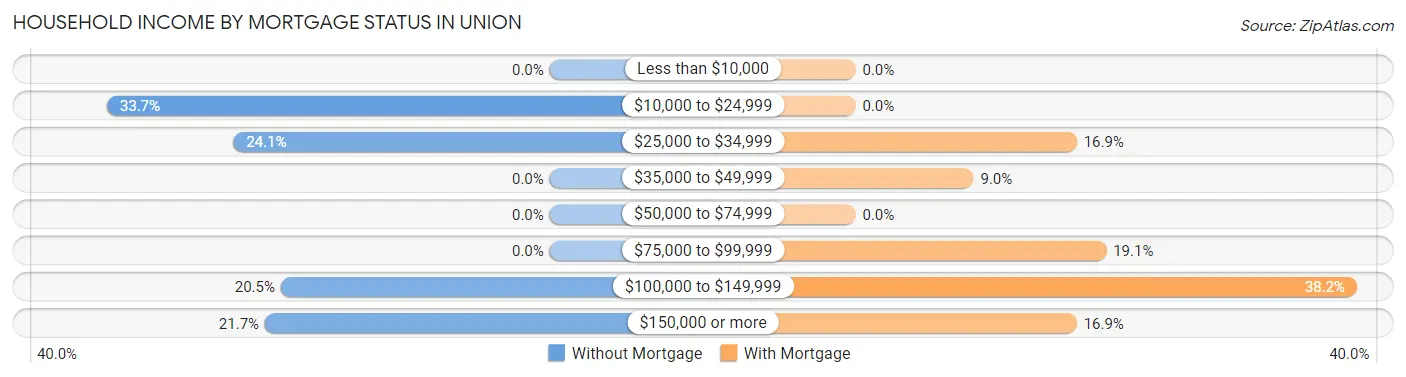
| Household Income | Without Mortgage | With Mortgage |
| Less than $10,000 | 0 (0.0%) | 0 (0.0%) |
| $10,000 to $24,999 | 28 (33.7%) | 0 (0.0%) |
| $25,000 to $34,999 | 20 (24.1%) | 15 (16.9%) |
| $35,000 to $49,999 | 0 (0.0%) | 8 (9.0%) |
| $50,000 to $74,999 | 0 (0.0%) | 0 (0.0%) |
| $75,000 to $99,999 | 0 (0.0%) | 17 (19.1%) |
| $100,000 to $149,999 | 17 (20.5%) | 34 (38.2%) |
| $150,000 or more | 18 (21.7%) | 15 (16.9%) |
| Total | 83 (100.0%) | 89 (100.0%) |
Property Value to Household Income Ratio in Union
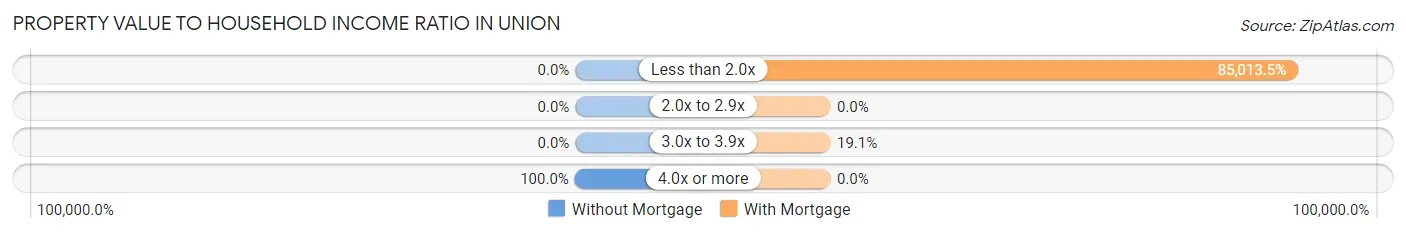
| Value-to-Income Ratio | Without Mortgage | With Mortgage |
| Less than 2.0x | 0 (0.0%) | 75,662 (85,013.5%) |
| 2.0x to 2.9x | 0 (0.0%) | 0 (0.0%) |
| 3.0x to 3.9x | 0 (0.0%) | 17 (19.1%) |
| 4.0x or more | 83 (100.0%) | 0 (0.0%) |
| Total | 83 (100.0%) | 89 (100.0%) |
Real Estate Taxes by Mortgage Status in Union
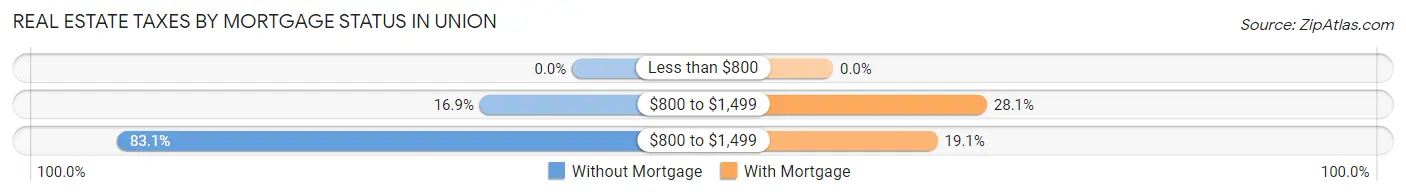
| Property Taxes | Without Mortgage | With Mortgage |
| Less than $800 | 0 (0.0%) | 0 (0.0%) |
| $800 to $1,499 | 14 (16.9%) | 25 (28.1%) |
| $800 to $1,499 | 69 (83.1%) | 17 (19.1%) |
| Total | 83 (100.0%) | 89 (100.0%) |
Health & Disability in Union
Health Insurance Coverage by Age in Union
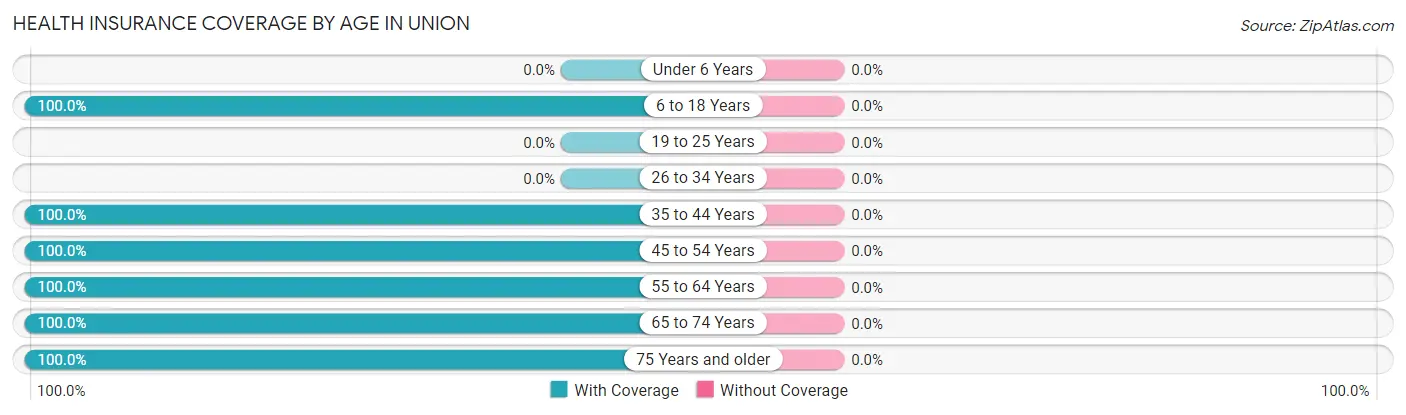
| Age Bracket | With Coverage | Without Coverage |
| Under 6 Years | 0 (0.0%) | 0 (0.0%) |
| 6 to 18 Years | 35 (100.0%) | 0 (0.0%) |
| 19 to 25 Years | 0 (0.0%) | 0 (0.0%) |
| 26 to 34 Years | 0 (0.0%) | 0 (0.0%) |
| 35 to 44 Years | 15 (100.0%) | 0 (0.0%) |
| 45 to 54 Years | 59 (100.0%) | 0 (0.0%) |
| 55 to 64 Years | 117 (100.0%) | 0 (0.0%) |
| 65 to 74 Years | 166 (100.0%) | 0 (0.0%) |
| 75 Years and older | 14 (100.0%) | 0 (0.0%) |
| Total | 406 (100.0%) | 0 (0.0%) |
Health Insurance Coverage by Citizenship Status in Union
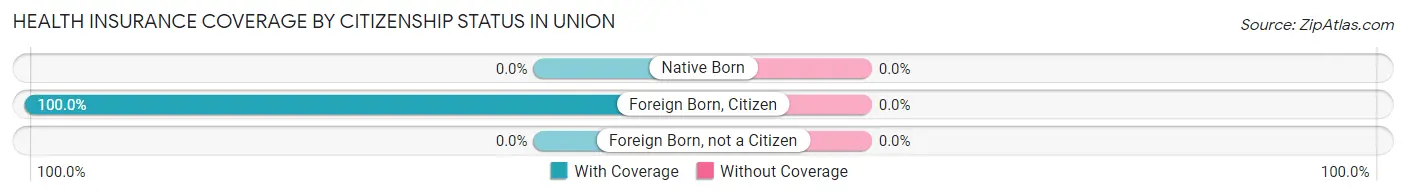
| Citizenship Status | With Coverage | Without Coverage |
| Native Born | 0 (0.0%) | 0 (0.0%) |
| Foreign Born, Citizen | 35 (100.0%) | 0 (0.0%) |
| Foreign Born, not a Citizen | 0 (0.0%) | 0 (0.0%) |
Health Insurance Coverage by Household Income in Union
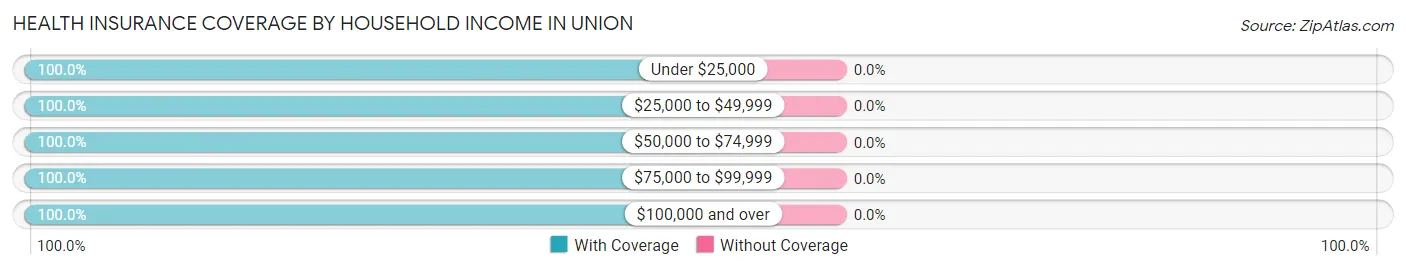
| Household Income | With Coverage | Without Coverage |
| Under $25,000 | 43 (100.0%) | 0 (0.0%) |
| $25,000 to $49,999 | 85 (100.0%) | 0 (0.0%) |
| $50,000 to $74,999 | 106 (100.0%) | 0 (0.0%) |
| $75,000 to $99,999 | 69 (100.0%) | 0 (0.0%) |
| $100,000 and over | 103 (100.0%) | 0 (0.0%) |
Public vs Private Health Insurance Coverage by Age in Union
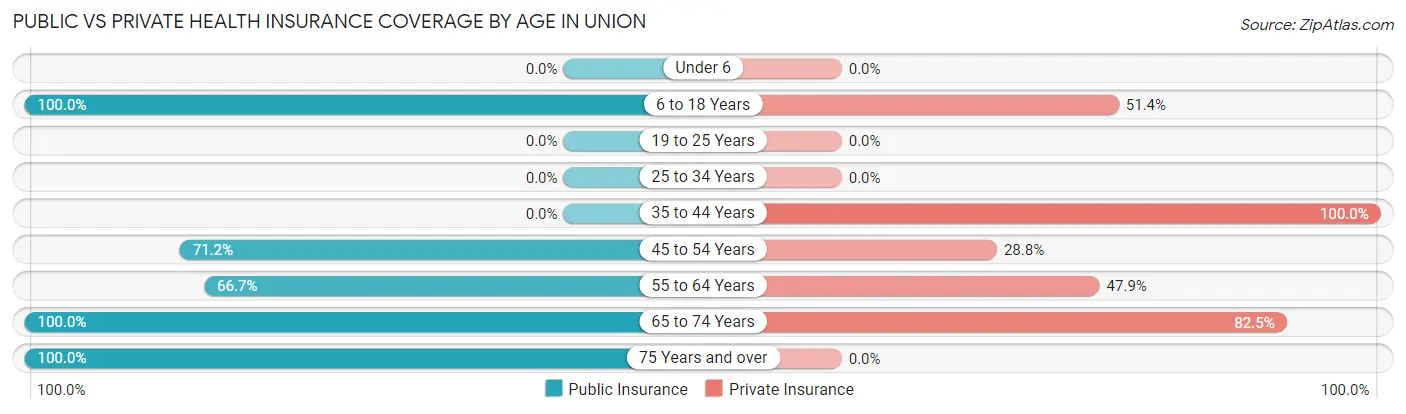
| Age Bracket | Public Insurance | Private Insurance |
| Under 6 | 0 (0.0%) | 0 (0.0%) |
| 6 to 18 Years | 35 (100.0%) | 18 (51.4%) |
| 19 to 25 Years | 0 (0.0%) | 0 (0.0%) |
| 25 to 34 Years | 0 (0.0%) | 0 (0.0%) |
| 35 to 44 Years | 0 (0.0%) | 15 (100.0%) |
| 45 to 54 Years | 42 (71.2%) | 17 (28.8%) |
| 55 to 64 Years | 78 (66.7%) | 56 (47.9%) |
| 65 to 74 Years | 166 (100.0%) | 137 (82.5%) |
| 75 Years and over | 14 (100.0%) | 0 (0.0%) |
| Total | 335 (82.5%) | 243 (59.9%) |
Disability Status by Sex by Age in Union
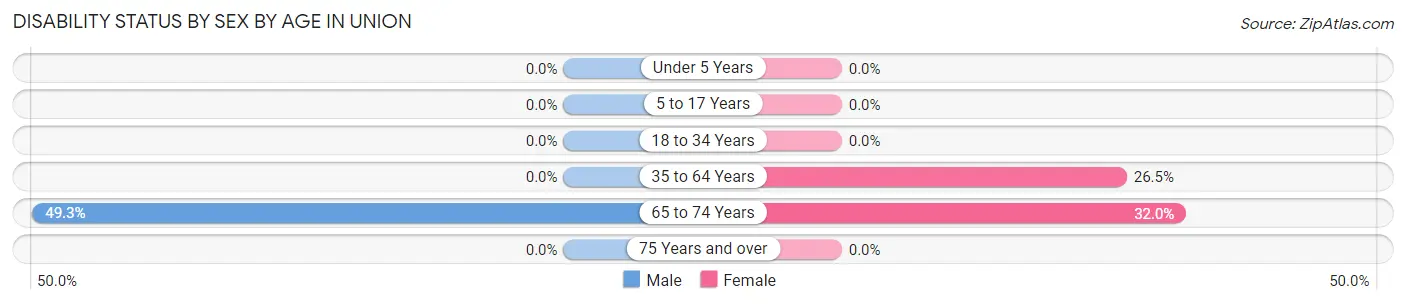
| Age Bracket | Male | Female |
| Under 5 Years | 0 (0.0%) | 0 (0.0%) |
| 5 to 17 Years | 0 (0.0%) | 0 (0.0%) |
| 18 to 34 Years | 0 (0.0%) | 0 (0.0%) |
| 35 to 64 Years | 0 (0.0%) | 32 (26.5%) |
| 65 to 74 Years | 34 (49.3%) | 31 (32.0%) |
| 75 Years and over | 0 (0.0%) | 0 (0.0%) |
Disability Class by Sex by Age in Union
Disability Class: Hearing Difficulty
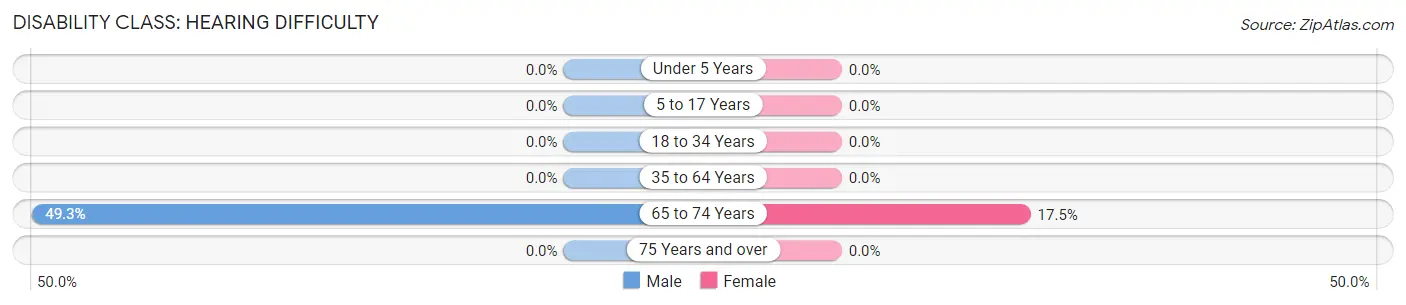
| Age Bracket | Male | Female |
| Under 5 Years | 0 (0.0%) | 0 (0.0%) |
| 5 to 17 Years | 0 (0.0%) | 0 (0.0%) |
| 18 to 34 Years | 0 (0.0%) | 0 (0.0%) |
| 35 to 64 Years | 0 (0.0%) | 0 (0.0%) |
| 65 to 74 Years | 34 (49.3%) | 17 (17.5%) |
| 75 Years and over | 0 (0.0%) | 0 (0.0%) |
Disability Class: Vision Difficulty
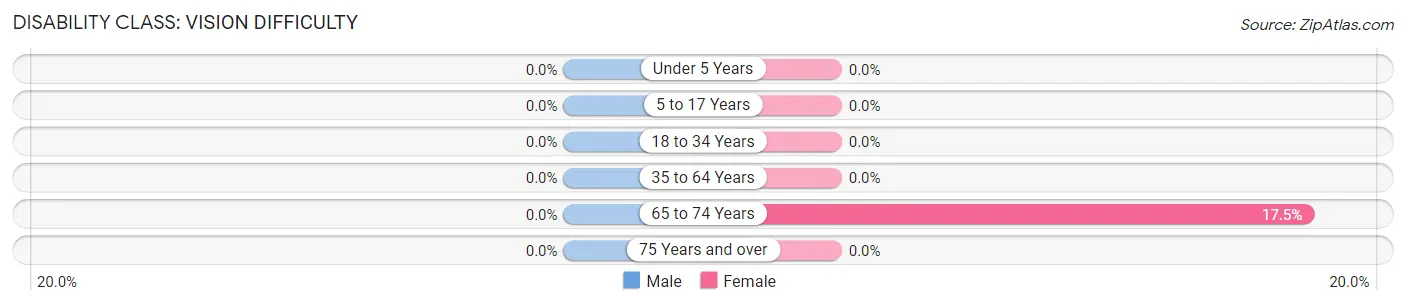
| Age Bracket | Male | Female |
| Under 5 Years | 0 (0.0%) | 0 (0.0%) |
| 5 to 17 Years | 0 (0.0%) | 0 (0.0%) |
| 18 to 34 Years | 0 (0.0%) | 0 (0.0%) |
| 35 to 64 Years | 0 (0.0%) | 0 (0.0%) |
| 65 to 74 Years | 0 (0.0%) | 17 (17.5%) |
| 75 Years and over | 0 (0.0%) | 0 (0.0%) |
Disability Class: Cognitive Difficulty
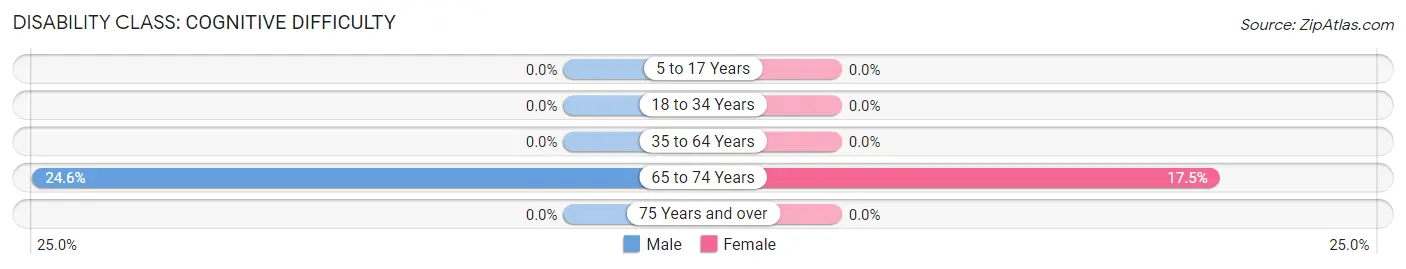
| Age Bracket | Male | Female |
| 5 to 17 Years | 0 (0.0%) | 0 (0.0%) |
| 18 to 34 Years | 0 (0.0%) | 0 (0.0%) |
| 35 to 64 Years | 0 (0.0%) | 0 (0.0%) |
| 65 to 74 Years | 17 (24.6%) | 17 (17.5%) |
| 75 Years and over | 0 (0.0%) | 0 (0.0%) |
Disability Class: Ambulatory Difficulty
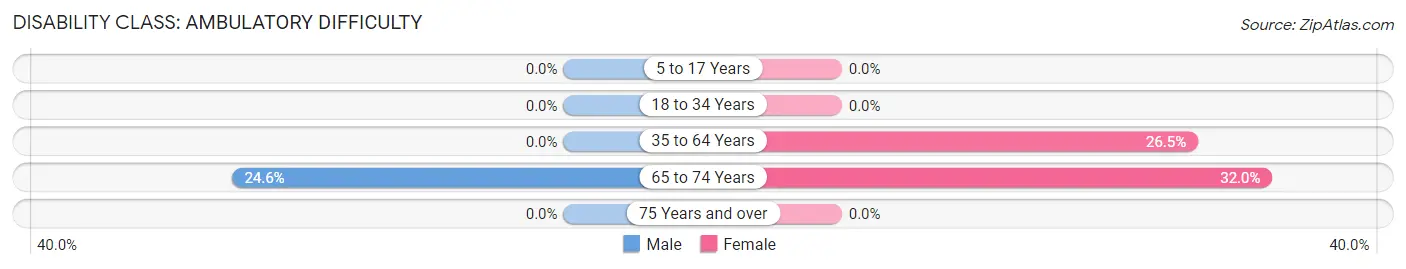
| Age Bracket | Male | Female |
| 5 to 17 Years | 0 (0.0%) | 0 (0.0%) |
| 18 to 34 Years | 0 (0.0%) | 0 (0.0%) |
| 35 to 64 Years | 0 (0.0%) | 32 (26.5%) |
| 65 to 74 Years | 17 (24.6%) | 31 (32.0%) |
| 75 Years and over | 0 (0.0%) | 0 (0.0%) |
Disability Class: Self-Care Difficulty

| Age Bracket | Male | Female |
| 5 to 17 Years | 0 (0.0%) | 0 (0.0%) |
| 18 to 34 Years | 0 (0.0%) | 0 (0.0%) |
| 35 to 64 Years | 0 (0.0%) | 0 (0.0%) |
| 65 to 74 Years | 17 (24.6%) | 17 (17.5%) |
| 75 Years and over | 0 (0.0%) | 0 (0.0%) |
Technology Access in Union
Computing Device Access in Union
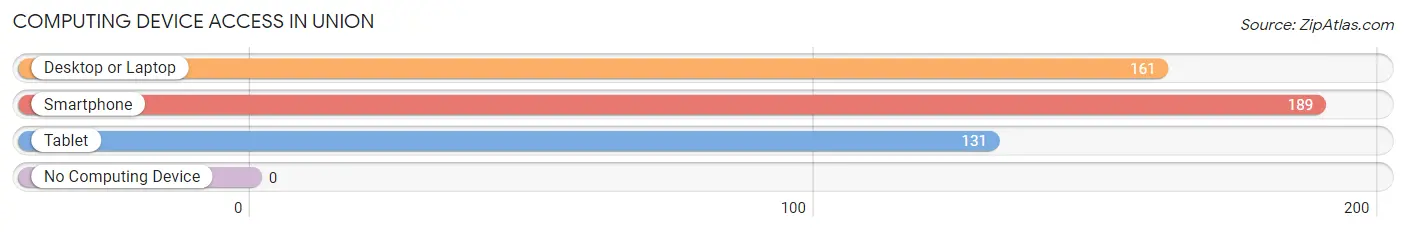
| Device Type | # Households | % Households |
| Desktop or Laptop | 161 | 85.2% |
| Smartphone | 189 | 100.0% |
| Tablet | 131 | 69.3% |
| No Computing Device | 0 | 0.0% |
| Total | 189 | 100.0% |
Internet Access in Union
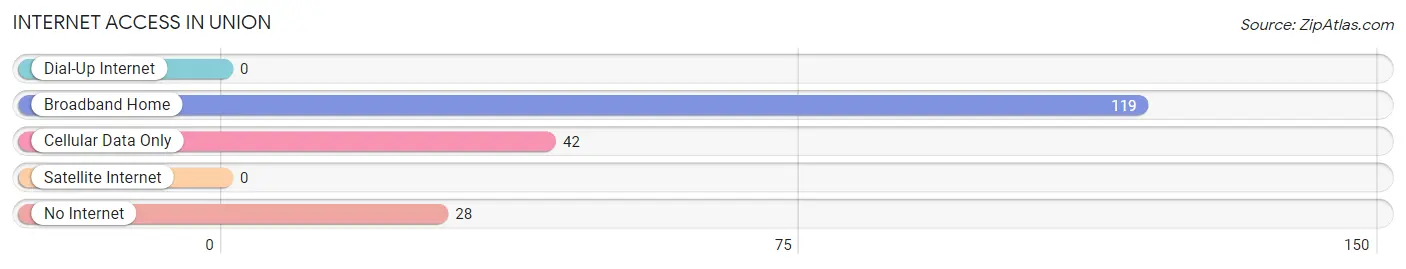
| Internet Type | # Households | % Households |
| Dial-Up Internet | 0 | 0.0% |
| Broadband Home | 119 | 63.0% |
| Cellular Data Only | 42 | 22.2% |
| Satellite Internet | 0 | 0.0% |
| No Internet | 28 | 14.8% |
| Total | 189 | 100.0% |
Union Summary
Union is a small town located in the northwest corner of Washington State, in the county of Skagit. It is situated on the banks of the Skagit River, and is surrounded by the Cascade Mountains. The town has a population of approximately 1,500 people, and is known for its rural charm and small-town atmosphere.
History
Union was first settled in the late 1800s by a group of settlers from the Midwest. The town was originally called Unionville, and was named after the Union Pacific Railroad, which ran through the area. The town was incorporated in 1891, and the first post office was established in 1892.
In the early 1900s, Union was a thriving logging and farming community. The town was home to several sawmills, and the surrounding area was heavily logged. The town also had a thriving dairy industry, and was home to several cheese factories.
In the 1950s, Union began to experience a decline in population as people moved away to larger cities. The town was also affected by the decline of the logging industry, and the closure of the sawmills.
Geography
Union is located in the northwest corner of Washington State, in the county of Skagit. The town is situated on the banks of the Skagit River, and is surrounded by the Cascade Mountains. The town is located approximately 30 miles north of Seattle, and is accessible by car via Interstate 5.
The town is located in a temperate rainforest climate, and receives an average of 40 inches of rain per year. The area is known for its lush green forests, and is home to a variety of wildlife, including deer, elk, and black bears.
Economy
Union’s economy is largely based on tourism and agriculture. The town is home to several small businesses, including restaurants, shops, and galleries. The town is also home to several wineries, and is a popular destination for wine tasting.
The town is also home to several farms, and is known for its production of dairy products, fruits, and vegetables. The town is also home to several nurseries, and is a popular destination for gardeners.
Demographics
As of the 2010 census, Union had a population of 1,500 people. The town is predominantly white, with a small Hispanic population. The median household income is $45,000, and the median age is 44.
Union is a small town with a close-knit community. The town is known for its rural charm and small-town atmosphere, and is a popular destination for tourists and outdoor enthusiasts.
Common Questions
What is Per Capita Income in Union?
Per Capita income in Union is $34,745.
What is the Median Family Income in Union?
Median Family Income in Union is $75,294.
What is the Median Household income in Union?
Median Household Income in Union is $73,456.
What is Inequality or Gini Index in Union?
Inequality or Gini Index in Union is 0.36.
What is the Total Population of Union?
Total Population of Union is 406.
What is the Total Male Population of Union?
Total Male Population of Union is 171.
What is the Total Female Population of Union?
Total Female Population of Union is 235.
What is the Ratio of Males per 100 Females in Union?
There are 72.77 Males per 100 Females in Union.
What is the Ratio of Females per 100 Males in Union?
There are 137.43 Females per 100 Males in Union.
What is the Median Population Age in Union?
Median Population Age in Union is 64.7 Years.
What is the Average Family Size in Union
Average Family Size in Union is 2.5 People.
What is the Average Household Size in Union
Average Household Size in Union is 2.1 People.
How Large is the Labor Force in Union?
There are 114 People in the Labor Forcein in Union.
What is the Percentage of People in the Labor Force in Union?
29.3% of People are in the Labor Force in Union.