Shadow Lake, WA Map & Demographics
Shadow Lake Map
Shadow Lake Overview
$53,340
PER CAPITA INCOME
$168,750
AVG FAMILY INCOME
$104,286
AVG HOUSEHOLD INCOME
9.3%
WAGE / INCOME GAP [ % ]
90.7¢/ $1
WAGE / INCOME GAP [ $ ]
0.44
INEQUALITY / GINI INDEX
2,115
TOTAL POPULATION
1,176
MALE POPULATION
939
FEMALE POPULATION
125.24
MALES / 100 FEMALES
79.85
FEMALES / 100 MALES
51.2
MEDIAN AGE
3.2
AVG FAMILY SIZE
2.6
AVG HOUSEHOLD SIZE
1,214
LABOR FORCE [ PEOPLE ]
66.0%
PERCENT IN LABOR FORCE
7.2%
UNEMPLOYMENT RATE
Income in Shadow Lake
Income Overview in Shadow Lake
Per Capita Income in Shadow Lake is $53,340, while median incomes of families and households are $168,750 and $104,286 respectively.
| Characteristic | Number | Measure |
| Per Capita Income | 2,115 | $53,340 |
| Median Family Income | 567 | $168,750 |
| Mean Family Income | 567 | $172,776 |
| Median Household Income | 800 | $104,286 |
| Mean Household Income | 800 | $140,498 |
| Income Deficit | 567 | $0 |
| Wage / Income Gap (%) | 2,115 | 9.28% |
| Wage / Income Gap ($) | 2,115 | 90.72¢ per $1 |
| Gini / Inequality Index | 2,115 | 0.44 |
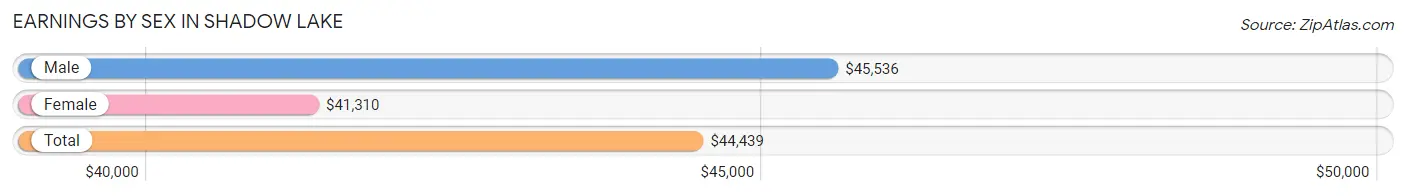
Earnings by Sex in Shadow Lake
Average Earnings in Shadow Lake are $44,439, $45,536 for men and $41,310 for women, a difference of 9.3%.
| Sex | Number | Average Earnings |
| Male | 776 (60.4%) | $45,536 |
| Female | 508 (39.6%) | $41,310 |
| Total | 1,284 (100.0%) | $44,439 |
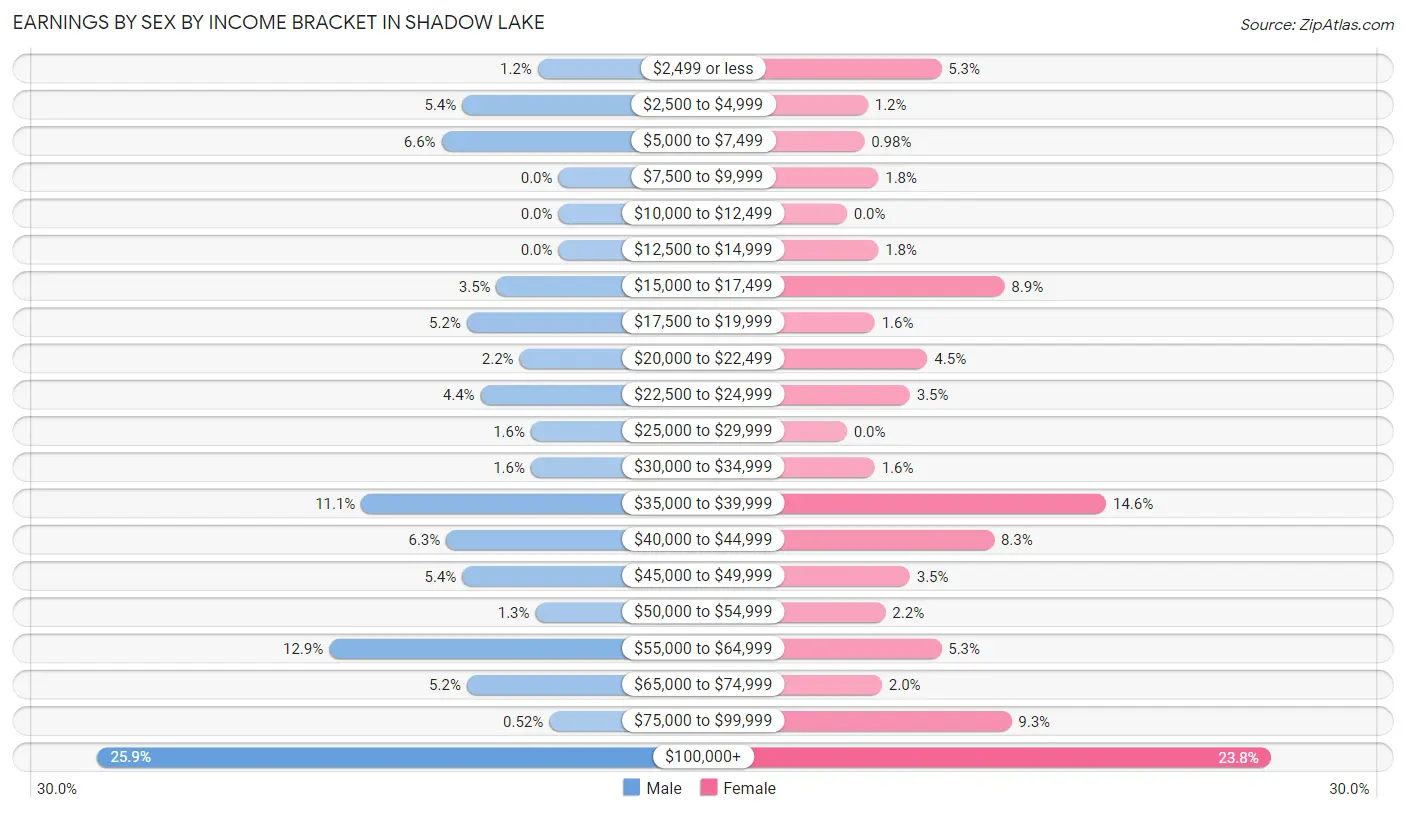
Earnings by Sex by Income Bracket in Shadow Lake
The most common earnings brackets in Shadow Lake are $100,000+ for men (201 | 25.9%) and $100,000+ for women (121 | 23.8%).
| Income | Male | Female |
| $2,499 or less | 9 (1.2%) | 27 (5.3%) |
| $2,500 to $4,999 | 42 (5.4%) | 6 (1.2%) |
| $5,000 to $7,499 | 51 (6.6%) | 5 (1.0%) |
| $7,500 to $9,999 | 0 (0.0%) | 9 (1.8%) |
| $10,000 to $12,499 | 0 (0.0%) | 0 (0.0%) |
| $12,500 to $14,999 | 0 (0.0%) | 9 (1.8%) |
| $15,000 to $17,499 | 27 (3.5%) | 45 (8.9%) |
| $17,500 to $19,999 | 40 (5.1%) | 8 (1.6%) |
| $20,000 to $22,499 | 17 (2.2%) | 23 (4.5%) |
| $22,500 to $24,999 | 34 (4.4%) | 18 (3.5%) |
| $25,000 to $29,999 | 12 (1.5%) | 0 (0.0%) |
| $30,000 to $34,999 | 12 (1.5%) | 8 (1.6%) |
| $35,000 to $39,999 | 86 (11.1%) | 74 (14.6%) |
| $40,000 to $44,999 | 49 (6.3%) | 42 (8.3%) |
| $45,000 to $49,999 | 42 (5.4%) | 18 (3.5%) |
| $50,000 to $54,999 | 10 (1.3%) | 11 (2.2%) |
| $55,000 to $64,999 | 100 (12.9%) | 27 (5.3%) |
| $65,000 to $74,999 | 40 (5.1%) | 10 (2.0%) |
| $75,000 to $99,999 | 4 (0.5%) | 47 (9.2%) |
| $100,000+ | 201 (25.9%) | 121 (23.8%) |
| Total | 776 (100.0%) | 508 (100.0%) |
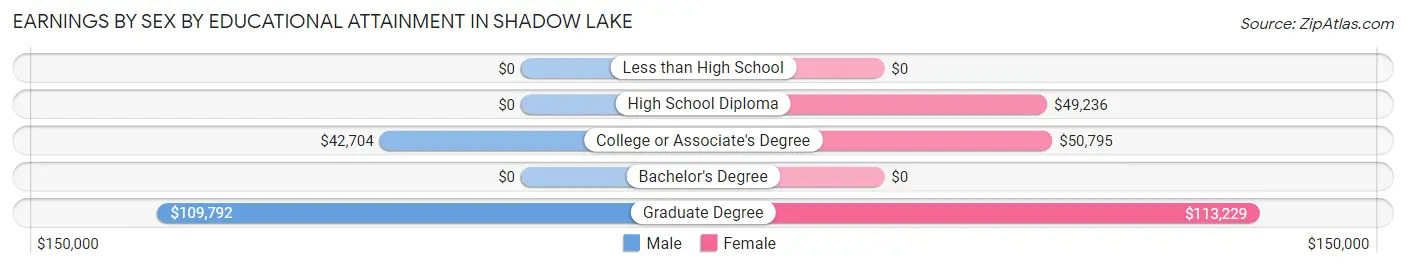
Earnings by Sex by Educational Attainment in Shadow Lake
Average earnings in Shadow Lake are $47,143 for men and $49,236 for women, a difference of 4.3%. Men with an educational attainment of graduate degree enjoy the highest average annual earnings of $109,792, while those with college or associate's degree education earn the least with $42,704. Women with an educational attainment of graduate degree earn the most with the average annual earnings of $113,229, while those with high school diploma education have the smallest earnings of $49,236.
| Educational Attainment | Male Income | Female Income |
| Less than High School | - | - |
| High School Diploma | - | - |
| College or Associate's Degree | $42,704 | $50,795 |
| Bachelor's Degree | - | - |
| Graduate Degree | $109,792 | $113,229 |
| Total | $47,143 | $49,236 |
Family Income in Shadow Lake
Family Income Brackets in Shadow Lake
According to the Shadow Lake family income data, there are 209 families falling into the $200,000+ income range, which is the most common income bracket and makes up 36.9% of all families.
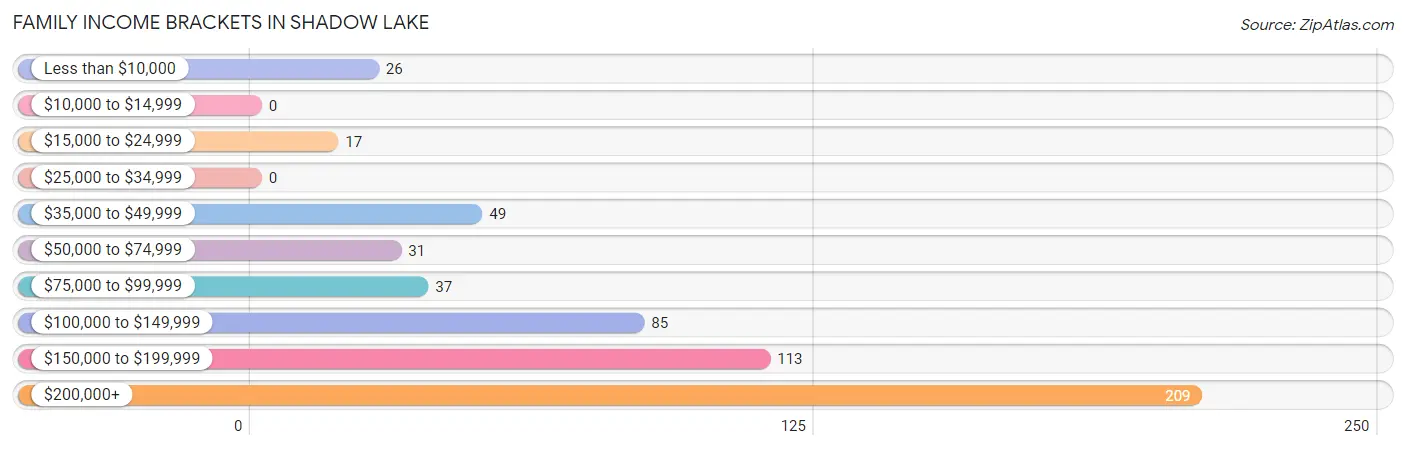
| Income Bracket | # Families | % Families |
| Less than $10,000 | 26 | 4.6% |
| $10,000 to $14,999 | 0 | 0.0% |
| $15,000 to $24,999 | 17 | 3.0% |
| $25,000 to $34,999 | 0 | 0.0% |
| $35,000 to $49,999 | 49 | 8.6% |
| $50,000 to $74,999 | 31 | 5.5% |
| $75,000 to $99,999 | 37 | 6.5% |
| $100,000 to $149,999 | 85 | 15.0% |
| $150,000 to $199,999 | 113 | 19.9% |
| $200,000+ | 209 | 36.9% |
Family Income by Famaliy Size in Shadow Lake
4-person families (127 | 22.4%) account for the highest median family income in Shadow Lake with $245,457 per family, while 4-person families (127 | 22.4%) have the highest median income of $61,364 per family member.
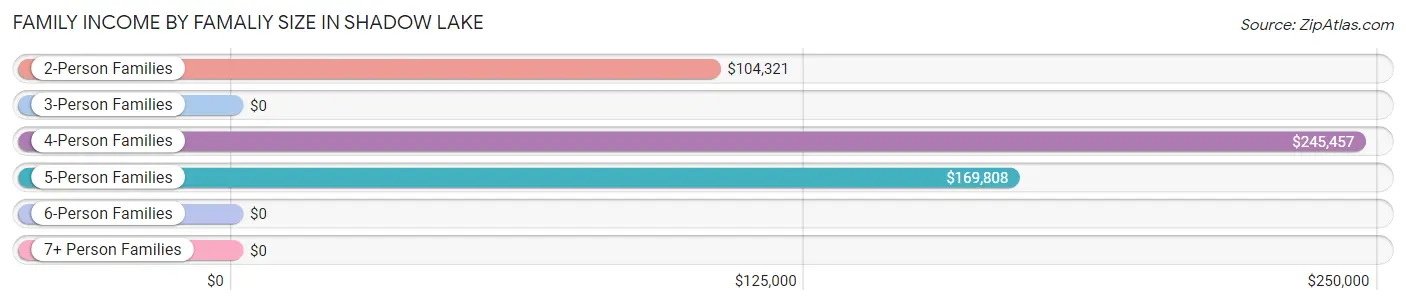
| Income Bracket | # Families | Median Income |
| 2-Person Families | 227 (40.0%) | $104,321 |
| 3-Person Families | 125 (22.1%) | $0 |
| 4-Person Families | 127 (22.4%) | $245,457 |
| 5-Person Families | 88 (15.5%) | $169,808 |
| 6-Person Families | 0 (0.0%) | $0 |
| 7+ Person Families | 0 (0.0%) | $0 |
| Total | 567 (100.0%) | $168,750 |
Family Income by Number of Earners in Shadow Lake
The median family income in Shadow Lake is $168,750, with families comprising 2 earners (154) having the highest median family income of $248,889, while families with 1 earner (210) have the lowest median family income of $69,583, accounting for 27.2% and 37.0% of families, respectively.
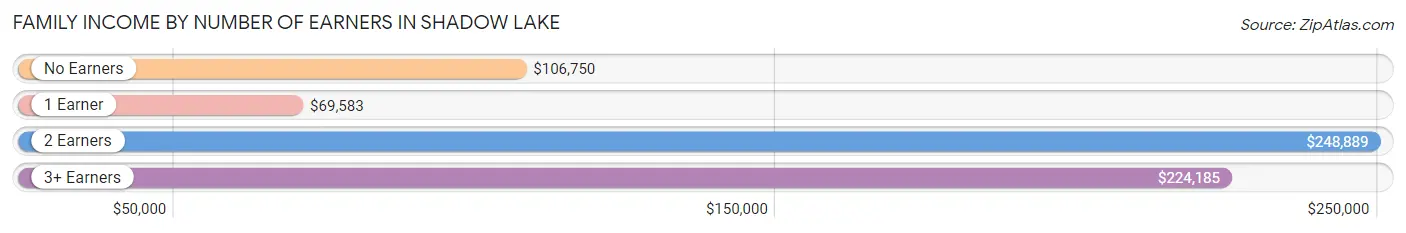
| Number of Earners | # Families | Median Income |
| No Earners | 48 (8.5%) | $106,750 |
| 1 Earner | 210 (37.0%) | $69,583 |
| 2 Earners | 154 (27.2%) | $248,889 |
| 3+ Earners | 155 (27.3%) | $224,185 |
| Total | 567 (100.0%) | $168,750 |
Household Income in Shadow Lake
Household Income Brackets in Shadow Lake
With 209 households falling in the category, the $200,000+ income range is the most frequent in Shadow Lake, accounting for 26.1% of all households.
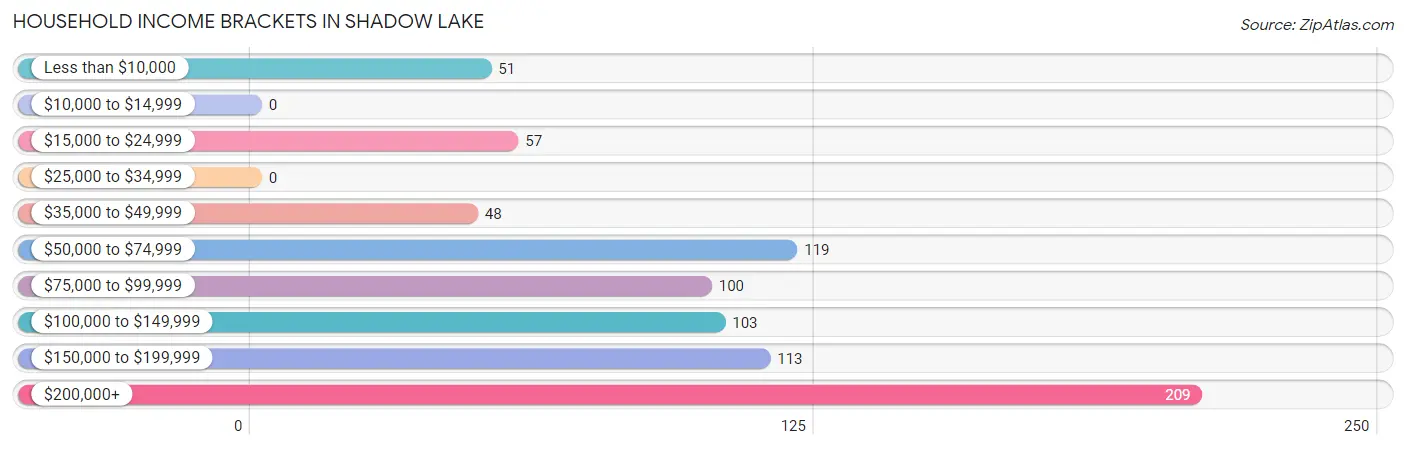
| Income Bracket | # Households | % Households |
| Less than $10,000 | 51 | 6.4% |
| $10,000 to $14,999 | 0 | 0.0% |
| $15,000 to $24,999 | 57 | 7.1% |
| $25,000 to $34,999 | 0 | 0.0% |
| $35,000 to $49,999 | 48 | 6.0% |
| $50,000 to $74,999 | 119 | 14.9% |
| $75,000 to $99,999 | 100 | 12.5% |
| $100,000 to $149,999 | 103 | 12.9% |
| $150,000 to $199,999 | 113 | 14.1% |
| $200,000+ | 209 | 26.1% |
Household Income by Householder Age in Shadow Lake
The median household income in Shadow Lake is $104,286, with the highest median household income of $167,917 found in the 45 to 64 years age bracket for the primary householder. A total of 413 households (51.6%) fall into this category.
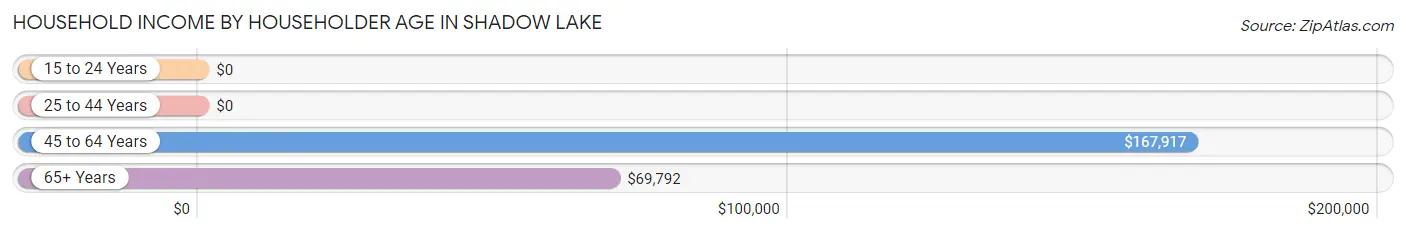
| Income Bracket | # Households | Median Income |
| 15 to 24 Years | 0 (0.0%) | $0 |
| 25 to 44 Years | 126 (15.8%) | $0 |
| 45 to 64 Years | 413 (51.6%) | $167,917 |
| 65+ Years | 261 (32.6%) | $69,792 |
| Total | 800 (100.0%) | $104,286 |
Poverty in Shadow Lake
Income Below Poverty by Sex and Age in Shadow Lake
With 4.9% poverty level for males and 5.5% for females among the residents of Shadow Lake, 75 year old and over males and 65 to 74 year old females are the most vulnerable to poverty, with 22 males (44.0%) and 29 females (15.9%) in their respective age groups living below the poverty level.
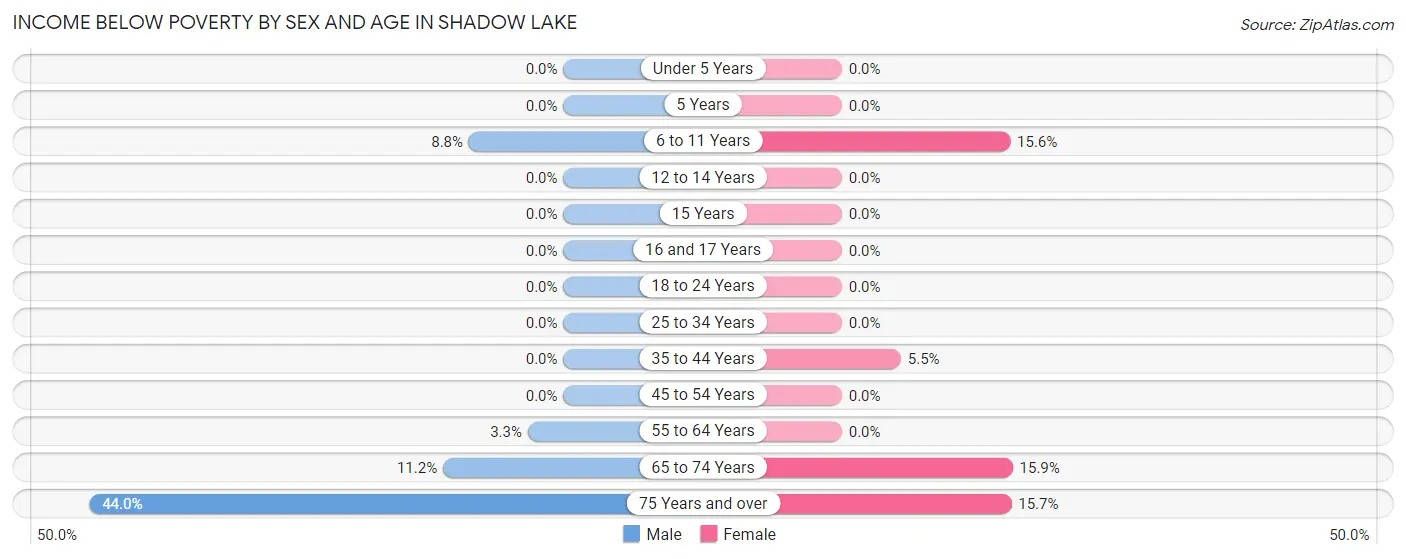
| Age Bracket | Male | Female |
| Under 5 Years | 0 (0.0%) | 0 (0.0%) |
| 5 Years | 0 (0.0%) | 0 (0.0%) |
| 6 to 11 Years | 5 (8.8%) | 5 (15.6%) |
| 12 to 14 Years | 0 (0.0%) | 0 (0.0%) |
| 15 Years | 0 (0.0%) | 0 (0.0%) |
| 16 and 17 Years | 0 (0.0%) | 0 (0.0%) |
| 18 to 24 Years | 0 (0.0%) | 0 (0.0%) |
| 25 to 34 Years | 0 (0.0%) | 0 (0.0%) |
| 35 to 44 Years | 0 (0.0%) | 4 (5.5%) |
| 45 to 54 Years | 0 (0.0%) | 0 (0.0%) |
| 55 to 64 Years | 10 (3.3%) | 0 (0.0%) |
| 65 to 74 Years | 20 (11.2%) | 29 (15.9%) |
| 75 Years and over | 22 (44.0%) | 14 (15.7%) |
| Total | 57 (4.9%) | 52 (5.5%) |
Income Above Poverty by Sex and Age in Shadow Lake
According to the poverty statistics in Shadow Lake, males aged under 5 years and females aged under 5 years are the age groups that are most secure financially, with 100.0% of males and 100.0% of females in these age groups living above the poverty line.
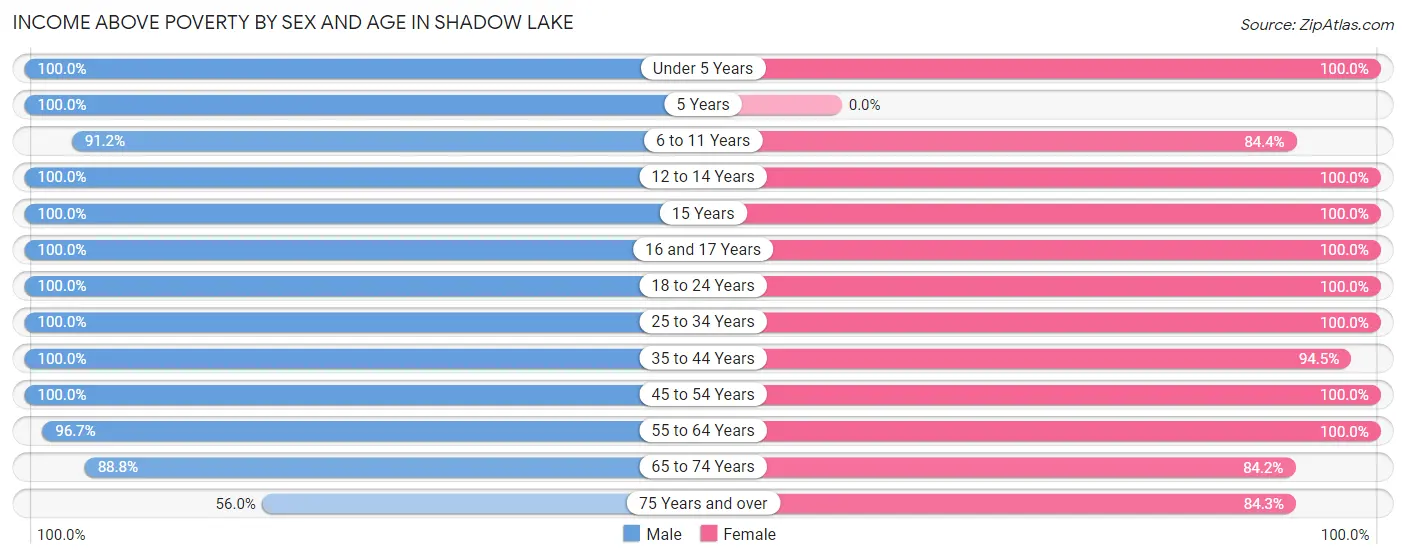
| Age Bracket | Male | Female |
| Under 5 Years | 21 (100.0%) | 25 (100.0%) |
| 5 Years | 11 (100.0%) | 0 (0.0%) |
| 6 to 11 Years | 52 (91.2%) | 27 (84.4%) |
| 12 to 14 Years | 26 (100.0%) | 56 (100.0%) |
| 15 Years | 29 (100.0%) | 18 (100.0%) |
| 16 and 17 Years | 18 (100.0%) | 5 (100.0%) |
| 18 to 24 Years | 99 (100.0%) | 60 (100.0%) |
| 25 to 34 Years | 172 (100.0%) | 64 (100.0%) |
| 35 to 44 Years | 97 (100.0%) | 69 (94.5%) |
| 45 to 54 Years | 114 (100.0%) | 209 (100.0%) |
| 55 to 64 Years | 293 (96.7%) | 125 (100.0%) |
| 65 to 74 Years | 159 (88.8%) | 154 (84.2%) |
| 75 Years and over | 28 (56.0%) | 75 (84.3%) |
| Total | 1,119 (95.2%) | 887 (94.5%) |
Income Below Poverty Among Married-Couple Families in Shadow Lake
The poverty statistics for married-couple families in Shadow Lake show that 4.6% or 22 of the total 479 families live below the poverty line. Families with no children have the highest poverty rate of 6.4%, comprising of 22 families. On the other hand, families with 1 or 2 children have the lowest poverty rate of 0.0%, which includes 0 families.
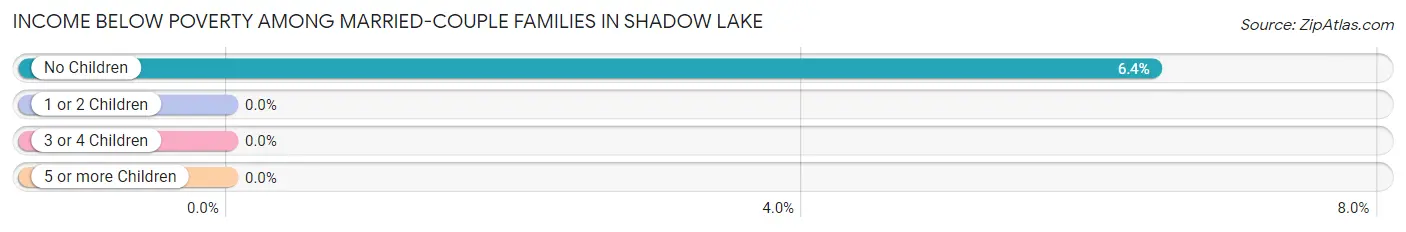
| Children | Above Poverty | Below Poverty |
| No Children | 320 (93.6%) | 22 (6.4%) |
| 1 or 2 Children | 123 (100.0%) | 0 (0.0%) |
| 3 or 4 Children | 14 (100.0%) | 0 (0.0%) |
| 5 or more Children | 0 (0.0%) | 0 (0.0%) |
| Total | 457 (95.4%) | 22 (4.6%) |
Income Below Poverty Among Single-Parent Households in Shadow Lake
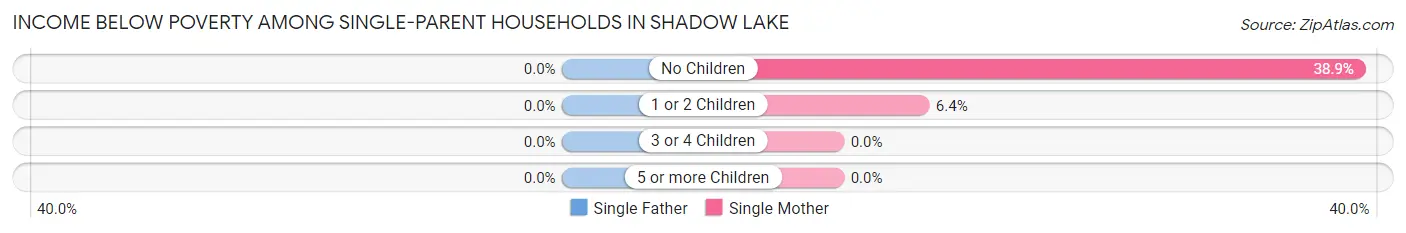
| Children | Single Father | Single Mother |
| No Children | 0 (0.0%) | 7 (38.9%) |
| 1 or 2 Children | 0 (0.0%) | 4 (6.4%) |
| 3 or 4 Children | 0 (0.0%) | 0 (0.0%) |
| 5 or more Children | 0 (0.0%) | 0 (0.0%) |
| Total | 0 (0.0%) | 11 (13.6%) |
Income Below Poverty Among Married-Couple vs Single-Parent Households in Shadow Lake
The poverty data for Shadow Lake shows that 22 of the married-couple family households (4.6%) and 11 of the single-parent households (12.5%) are living below the poverty level. Within the married-couple family households, those with no children have the highest poverty rate, with 22 households (6.4%) falling below the poverty line. Among the single-parent households, those with no children have the highest poverty rate, with 7 household (28.0%) living below poverty.
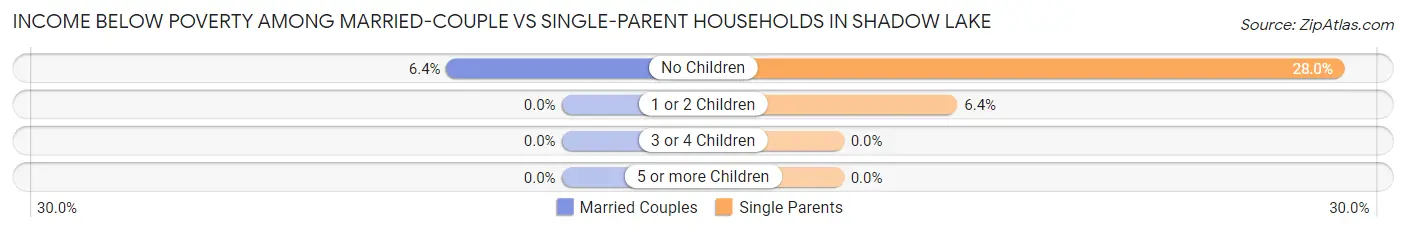
| Children | Married-Couple Families | Single-Parent Households |
| No Children | 22 (6.4%) | 7 (28.0%) |
| 1 or 2 Children | 0 (0.0%) | 4 (6.4%) |
| 3 or 4 Children | 0 (0.0%) | 0 (0.0%) |
| 5 or more Children | 0 (0.0%) | 0 (0.0%) |
| Total | 22 (4.6%) | 11 (12.5%) |
Race in Shadow Lake
The most populous races in Shadow Lake are White / Caucasian (1,672 | 79.0%), Hispanic or Latino (129 | 6.1%), and Hawaiian / Pacific (128 | 6.0%).
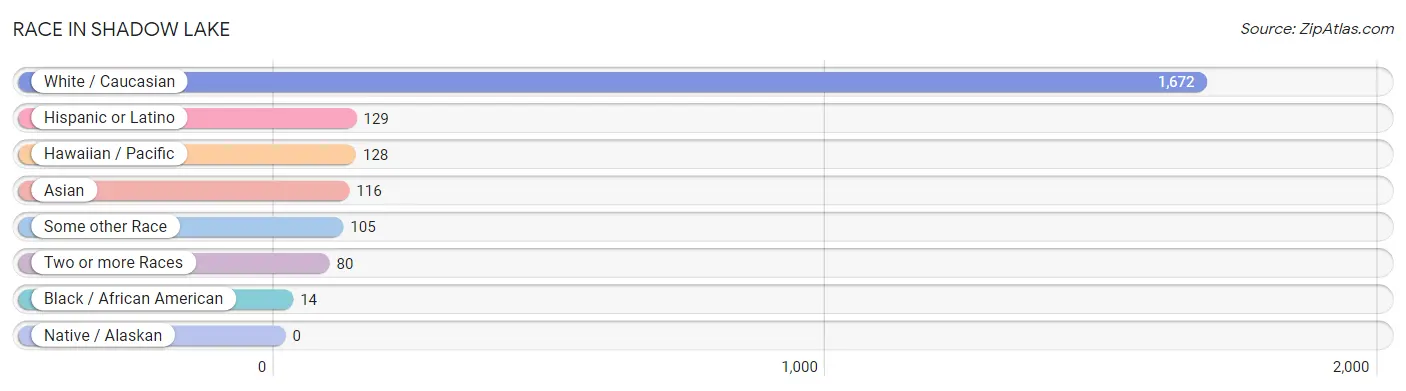
| Race | # Population | % Population |
| Asian | 116 | 5.5% |
| Black / African American | 14 | 0.7% |
| Hawaiian / Pacific | 128 | 6.0% |
| Hispanic or Latino | 129 | 6.1% |
| Native / Alaskan | 0 | 0.0% |
| White / Caucasian | 1,672 | 79.0% |
| Two or more Races | 80 | 3.8% |
| Some other Race | 105 | 5.0% |
| Total | 2,115 | 100.0% |
Ancestry in Shadow Lake
The most populous ancestries reported in Shadow Lake are German (439 | 20.8%), English (389 | 18.4%), Dutch (151 | 7.1%), Guamanian / Chamorro (128 | 6.0%), and Irish (114 | 5.4%), together accounting for 57.7% of all Shadow Lake residents.
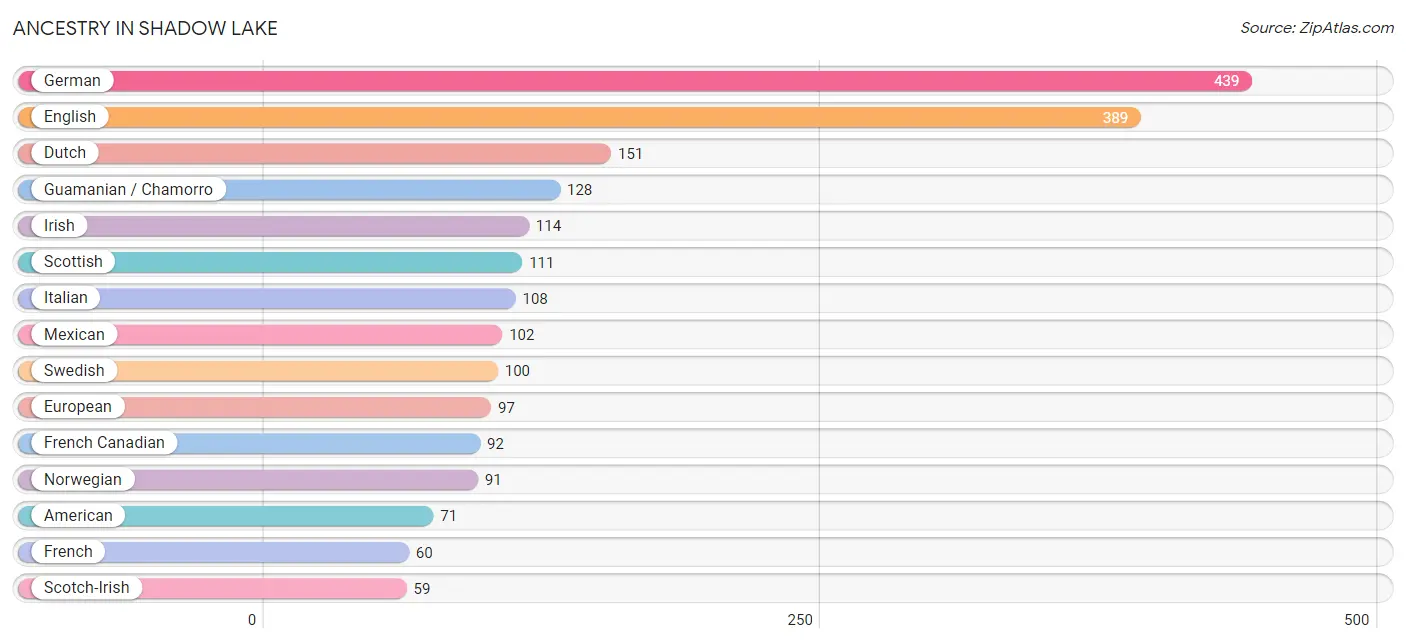
| Ancestry | # Population | % Population |
| Aleut | 13 | 0.6% |
| American | 71 | 3.4% |
| Arab | 18 | 0.9% |
| Austrian | 27 | 1.3% |
| Bhutanese | 48 | 2.3% |
| Burmese | 42 | 2.0% |
| Canadian | 8 | 0.4% |
| Danish | 14 | 0.7% |
| Dutch | 151 | 7.1% |
| English | 389 | 18.4% |
| European | 97 | 4.6% |
| Finnish | 9 | 0.4% |
| French | 60 | 2.8% |
| French Canadian | 92 | 4.3% |
| German | 439 | 20.8% |
| Greek | 15 | 0.7% |
| Guamanian / Chamorro | 128 | 6.0% |
| Hungarian | 18 | 0.9% |
| Indian (Asian) | 10 | 0.5% |
| Irish | 114 | 5.4% |
| Italian | 108 | 5.1% |
| Jordanian | 9 | 0.4% |
| Korean | 52 | 2.5% |
| Lithuanian | 12 | 0.6% |
| Mexican | 102 | 4.8% |
| Northern European | 7 | 0.3% |
| Norwegian | 91 | 4.3% |
| Pakistani | 8 | 0.4% |
| Pennsylvania German | 11 | 0.5% |
| Polish | 10 | 0.5% |
| Portuguese | 10 | 0.5% |
| Romanian | 14 | 0.7% |
| Scandinavian | 20 | 0.9% |
| Scotch-Irish | 59 | 2.8% |
| Scottish | 111 | 5.2% |
| Spanish | 27 | 1.3% |
| Swedish | 100 | 4.7% |
| Swiss | 14 | 0.7% |
| Welsh | 43 | 2.0% | View All 39 Rows |
Immigrants in Shadow Lake
The most numerous immigrant groups reported in Shadow Lake came from Asia (85 | 4.0%), South Eastern Asia (51 | 2.4%), Philippines (43 | 2.0%), Canada (42 | 2.0%), and Belgium (39 | 1.8%), together accounting for 12.3% of all Shadow Lake residents.
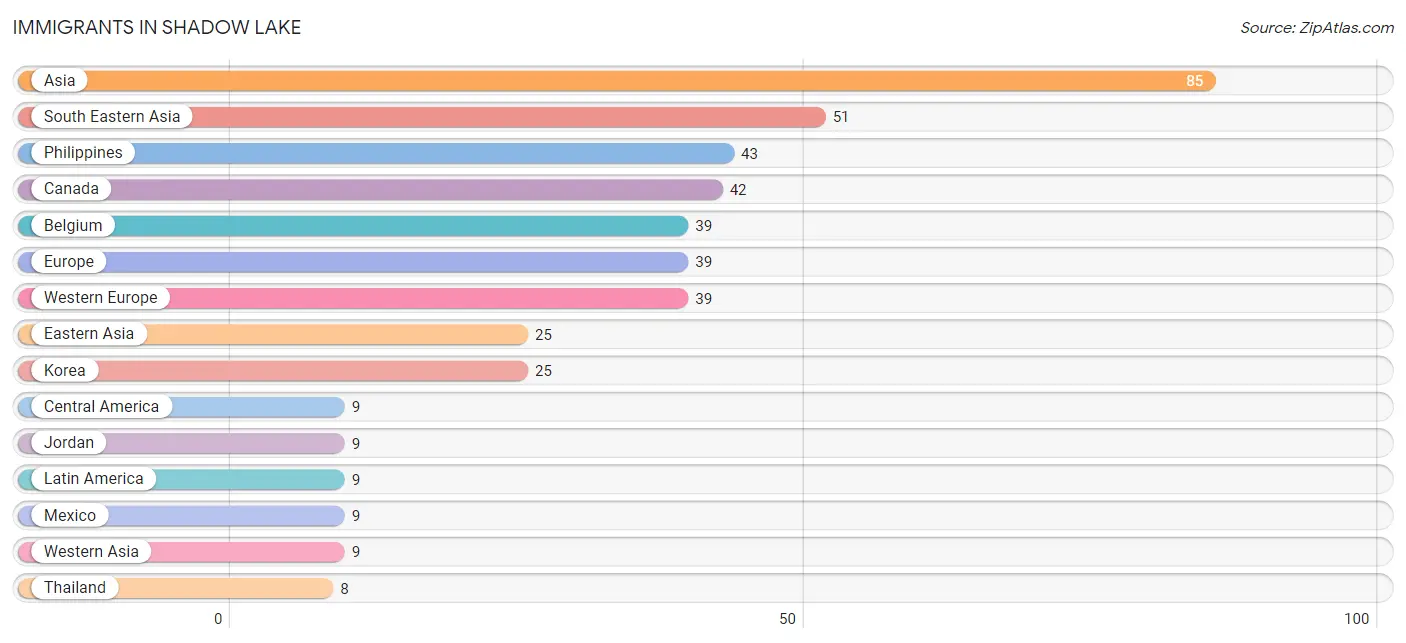
| Immigration Origin | # Population | % Population |
| Asia | 85 | 4.0% |
| Belgium | 39 | 1.8% |
| Canada | 42 | 2.0% |
| Central America | 9 | 0.4% |
| Eastern Asia | 25 | 1.2% |
| Europe | 39 | 1.8% |
| Jordan | 9 | 0.4% |
| Korea | 25 | 1.2% |
| Latin America | 9 | 0.4% |
| Mexico | 9 | 0.4% |
| Philippines | 43 | 2.0% |
| South Eastern Asia | 51 | 2.4% |
| Thailand | 8 | 0.4% |
| Western Asia | 9 | 0.4% |
| Western Europe | 39 | 1.8% | View All 15 Rows |
Sex and Age in Shadow Lake
Sex and Age in Shadow Lake
The most populous age groups in Shadow Lake are 60 to 64 Years (155 | 13.2%) for men and 65 to 69 Years (148 | 15.8%) for women.
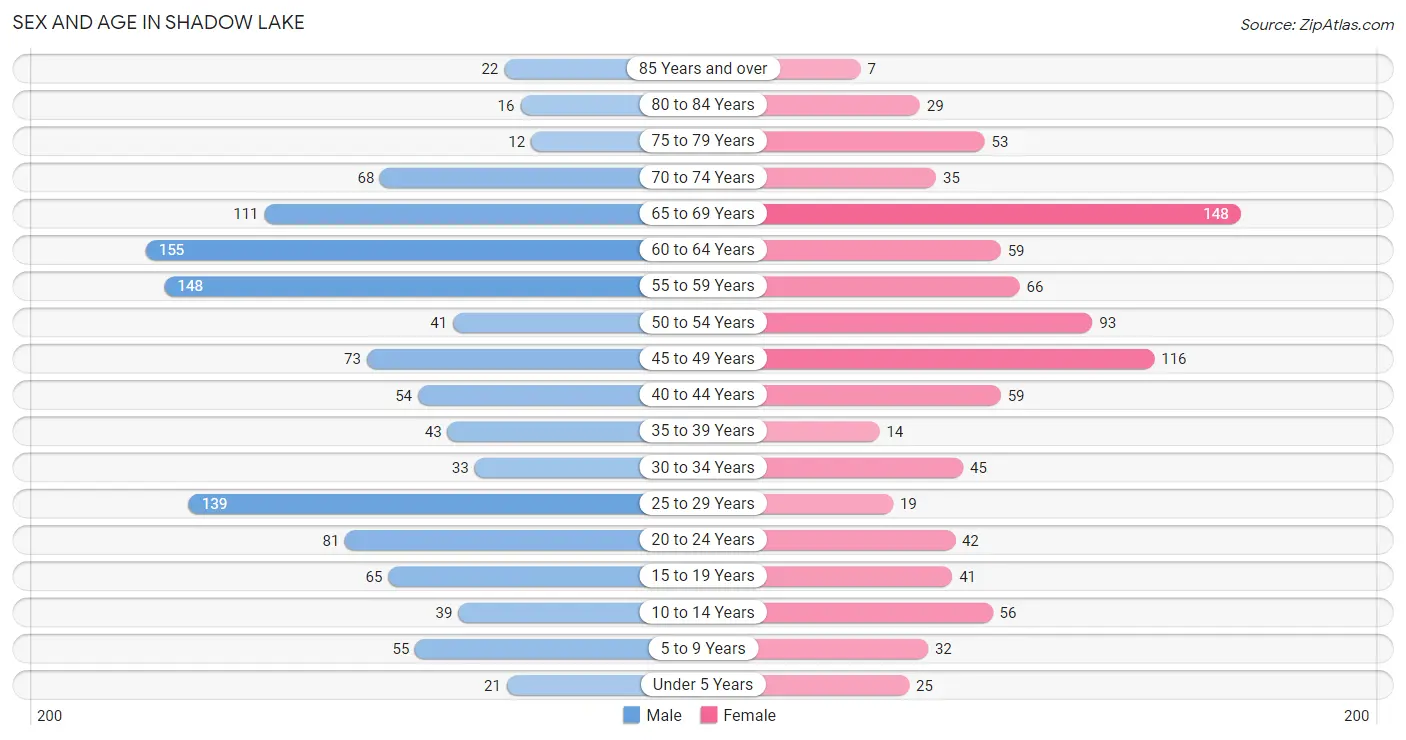
| Age Bracket | Male | Female |
| Under 5 Years | 21 (1.8%) | 25 (2.7%) |
| 5 to 9 Years | 55 (4.7%) | 32 (3.4%) |
| 10 to 14 Years | 39 (3.3%) | 56 (6.0%) |
| 15 to 19 Years | 65 (5.5%) | 41 (4.4%) |
| 20 to 24 Years | 81 (6.9%) | 42 (4.5%) |
| 25 to 29 Years | 139 (11.8%) | 19 (2.0%) |
| 30 to 34 Years | 33 (2.8%) | 45 (4.8%) |
| 35 to 39 Years | 43 (3.7%) | 14 (1.5%) |
| 40 to 44 Years | 54 (4.6%) | 59 (6.3%) |
| 45 to 49 Years | 73 (6.2%) | 116 (12.3%) |
| 50 to 54 Years | 41 (3.5%) | 93 (9.9%) |
| 55 to 59 Years | 148 (12.6%) | 66 (7.0%) |
| 60 to 64 Years | 155 (13.2%) | 59 (6.3%) |
| 65 to 69 Years | 111 (9.4%) | 148 (15.8%) |
| 70 to 74 Years | 68 (5.8%) | 35 (3.7%) |
| 75 to 79 Years | 12 (1.0%) | 53 (5.6%) |
| 80 to 84 Years | 16 (1.4%) | 29 (3.1%) |
| 85 Years and over | 22 (1.9%) | 7 (0.7%) |
| Total | 1,176 (100.0%) | 939 (100.0%) |
Families and Households in Shadow Lake
Median Family Size in Shadow Lake
The median family size in Shadow Lake is 3.16 persons per family, with single female/mother families (81 | 14.3%) accounting for the largest median family size of 3.23 persons per family. On the other hand, single male/father families (7 | 1.2%) represent the smallest median family size with 2.00 persons per family.
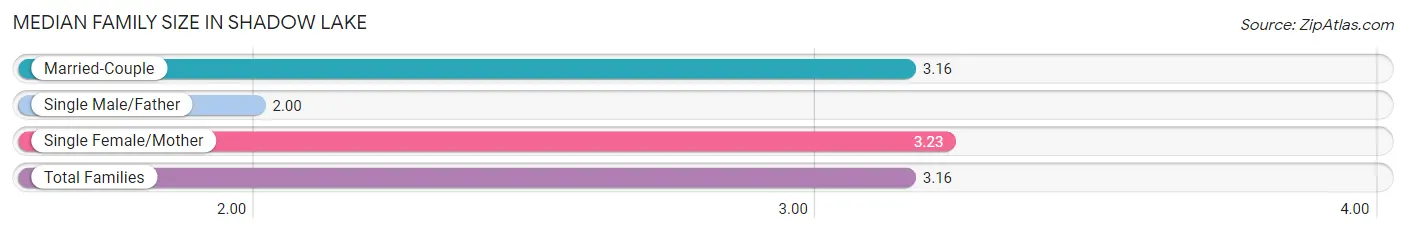
| Family Type | # Families | Family Size |
| Married-Couple | 479 (84.5%) | 3.16 |
| Single Male/Father | 7 (1.2%) | 2.00 |
| Single Female/Mother | 81 (14.3%) | 3.23 |
| Total Families | 567 (100.0%) | 3.16 |
Median Household Size in Shadow Lake
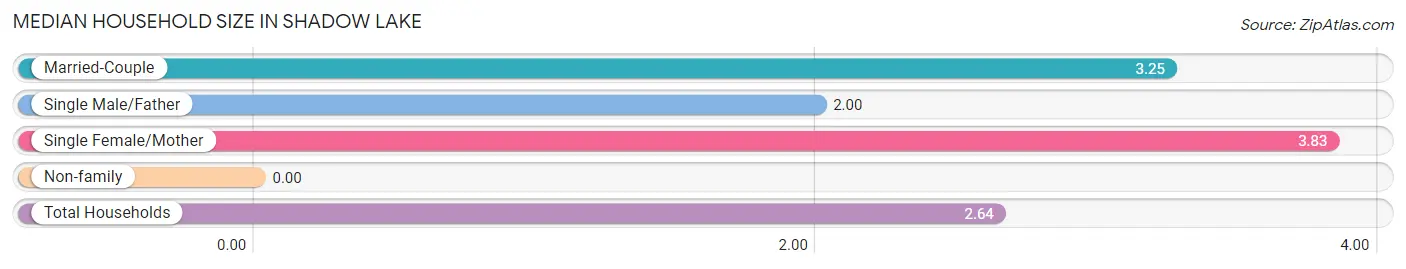
| Household Type | # Households | Household Size |
| Married-Couple | 479 (59.9%) | 3.25 |
| Single Male/Father | 7 (0.9%) | 2.00 |
| Single Female/Mother | 81 (10.1%) | 3.83 |
| Non-family | 233 (29.1%) | - |
| Total Households | 800 (100.0%) | 2.64 |
Household Size by Marriage Status in Shadow Lake
Out of a total of 800 households in Shadow Lake, 567 (70.9%) are family households, while 233 (29.1%) are nonfamily households. The most numerous type of family households are 2-person households, comprising 220, and the most common type of nonfamily households are 1-person households, comprising 233.
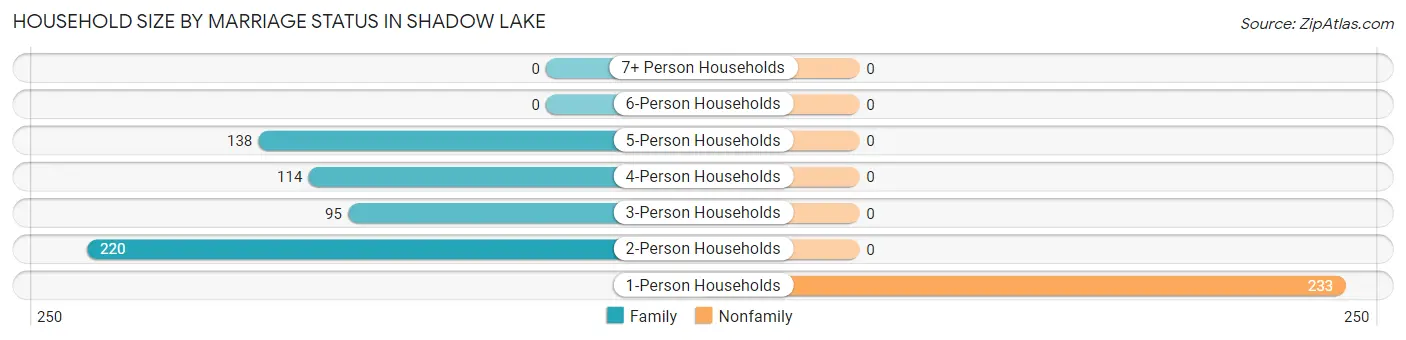
| Household Size | Family Households | Nonfamily Households |
| 1-Person Households | - | 233 (29.1%) |
| 2-Person Households | 220 (27.5%) | 0 (0.0%) |
| 3-Person Households | 95 (11.9%) | 0 (0.0%) |
| 4-Person Households | 114 (14.2%) | 0 (0.0%) |
| 5-Person Households | 138 (17.2%) | 0 (0.0%) |
| 6-Person Households | 0 (0.0%) | 0 (0.0%) |
| 7+ Person Households | 0 (0.0%) | 0 (0.0%) |
| Total | 567 (70.9%) | 233 (29.1%) |
Female Fertility in Shadow Lake
Fertility by Age in Shadow Lake
Average fertility rate in Shadow Lake is 140.0 births per 1,000 women. Women in the age bracket of 20 to 34 years have the highest fertility rate with 302.0 births per 1,000 women. Women in the age bracket of 20 to 34 years acount for 68.1% of all women with births.
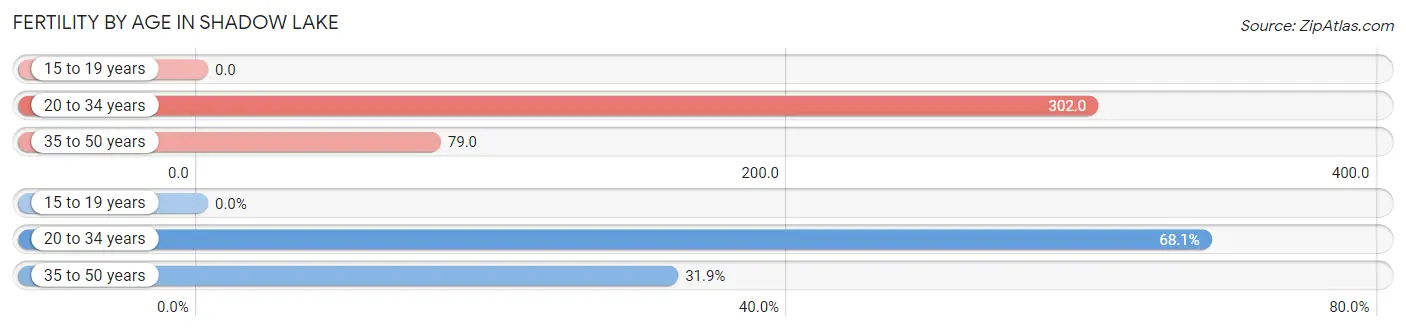
| Age Bracket | Women with Births | Births / 1,000 Women |
| 15 to 19 years | 0 (0.0%) | 0.0 |
| 20 to 34 years | 32 (68.1%) | 302.0 |
| 35 to 50 years | 15 (31.9%) | 79.0 |
| Total | 47 (100.0%) | 140.0 |
Fertility by Age by Marriage Status in Shadow Lake
53.2% of women with births (47) in Shadow Lake are married. The highest percentage of unmarried women with births falls into 20 to 34 years age bracket with 68.8% of them unmarried at the time of birth, while the lowest percentage of unmarried women with births belong to 35 to 50 years age bracket with 0.0% of them unmarried.
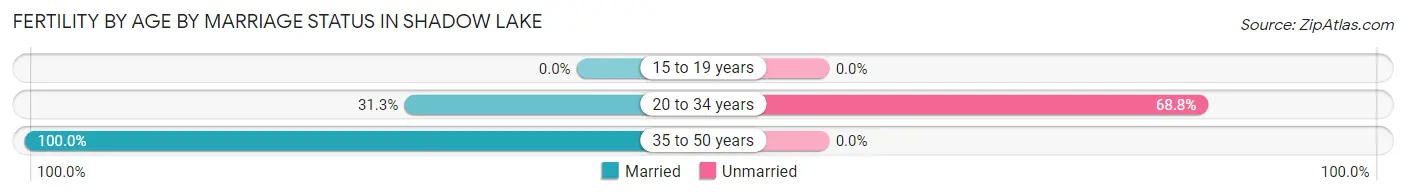
| Age Bracket | Married | Unmarried |
| 15 to 19 years | 0 (0.0%) | 0 (0.0%) |
| 20 to 34 years | 10 (31.2%) | 22 (68.8%) |
| 35 to 50 years | 15 (100.0%) | 0 (0.0%) |
| Total | 25 (53.2%) | 22 (46.8%) |
Fertility by Education in Shadow Lake
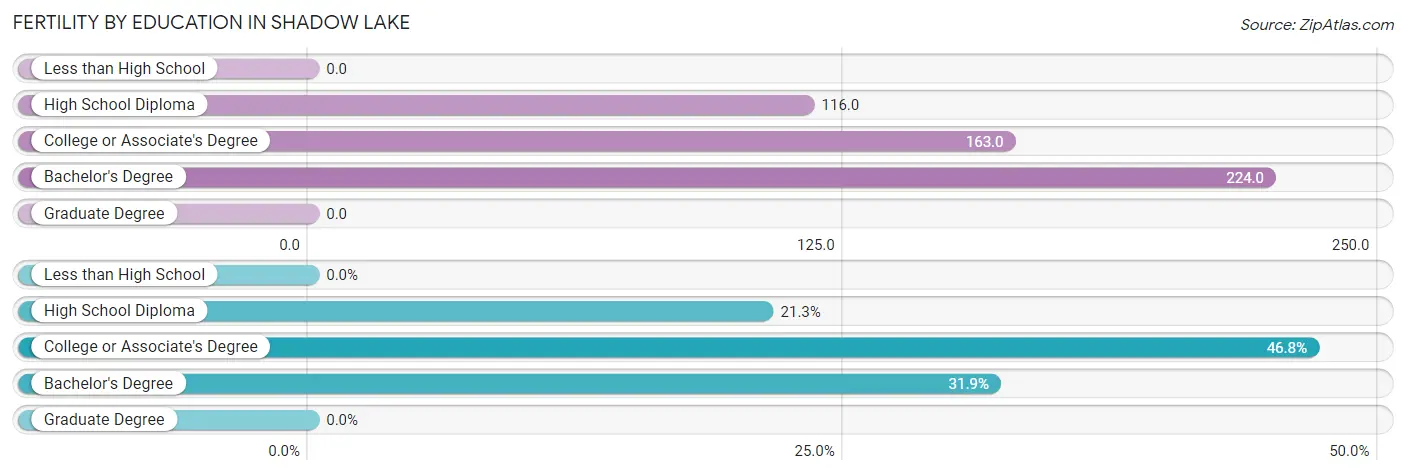
| Educational Attainment | Women with Births | Births / 1,000 Women |
| Less than High School | 0 (0.0%) | 0.0 |
| High School Diploma | 10 (21.3%) | 116.0 |
| College or Associate's Degree | 22 (46.8%) | 163.0 |
| Bachelor's Degree | 15 (31.9%) | 224.0 |
| Graduate Degree | 0 (0.0%) | 0.0 |
| Total | 47 (100.0%) | 140.0 |
Fertility by Education by Marriage Status in Shadow Lake
46.8% of women with births in Shadow Lake are unmarried. Women with the educational attainment of high school diploma are most likely to be married with 100.0% of them married at childbirth, while women with the educational attainment of college or associate's degree are least likely to be married with 100.0% of them unmarried at childbirth.
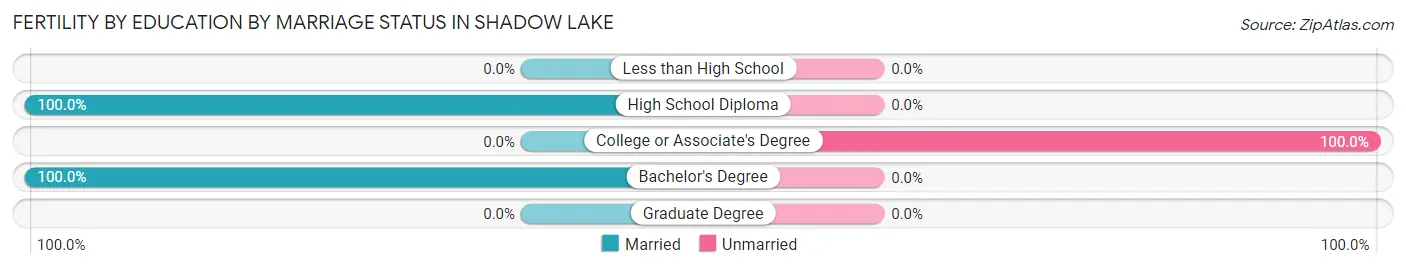
| Educational Attainment | Married | Unmarried |
| Less than High School | 0 (0.0%) | 0 (0.0%) |
| High School Diploma | 10 (100.0%) | 0 (0.0%) |
| College or Associate's Degree | 0 (0.0%) | 22 (100.0%) |
| Bachelor's Degree | 15 (100.0%) | 0 (0.0%) |
| Graduate Degree | 0 (0.0%) | 0 (0.0%) |
| Total | 25 (53.2%) | 22 (46.8%) |
Employment Characteristics in Shadow Lake
Employment by Class of Employer in Shadow Lake
Among the 1,127 employed individuals in Shadow Lake, private company employees (722 | 64.1%), local government employees (130 | 11.5%), and self-employed (not incorporated) (89 | 7.9%) make up the most common classes of employment.
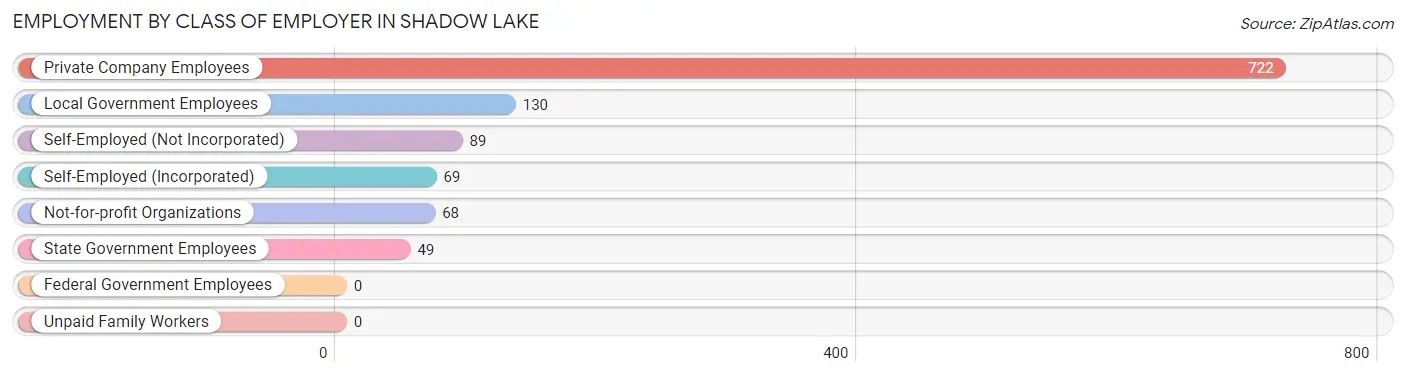
| Employer Class | # Employees | % Employees |
| Private Company Employees | 722 | 64.1% |
| Self-Employed (Incorporated) | 69 | 6.1% |
| Self-Employed (Not Incorporated) | 89 | 7.9% |
| Not-for-profit Organizations | 68 | 6.0% |
| Local Government Employees | 130 | 11.5% |
| State Government Employees | 49 | 4.3% |
| Federal Government Employees | 0 | 0.0% |
| Unpaid Family Workers | 0 | 0.0% |
| Total | 1,127 | 100.0% |
Employment Status by Age in Shadow Lake
According to the labor force statistics for Shadow Lake, out of the total population over 16 years of age (1,840), 66.0% or 1,214 individuals are in the labor force, with 7.2% or 87 of them unemployed. The age group with the highest labor force participation rate is 20 to 24 years, with 100.0% or 123 individuals in the labor force. Within the labor force, the 20 to 24 years age range has the highest percentage of unemployed individuals, with 35.0% or 43 of them being unemployed.
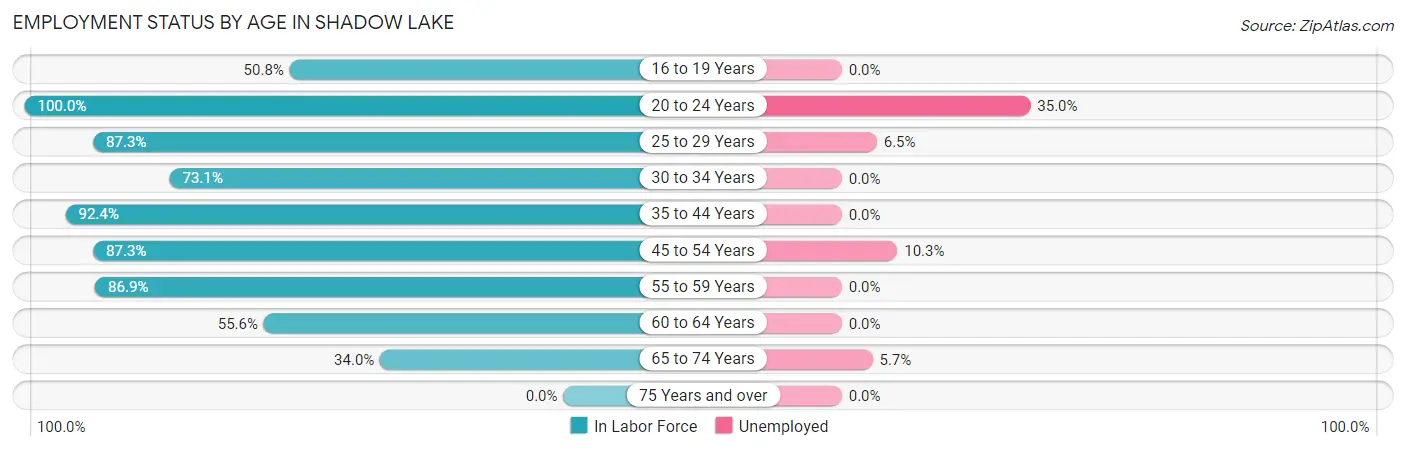
| Age Bracket | In Labor Force | Unemployed |
| 16 to 19 Years | 30 (50.8%) | 0 (0.0%) |
| 20 to 24 Years | 123 (100.0%) | 43 (35.0%) |
| 25 to 29 Years | 138 (87.3%) | 9 (6.5%) |
| 30 to 34 Years | 57 (73.1%) | 0 (0.0%) |
| 35 to 44 Years | 157 (92.4%) | 0 (0.0%) |
| 45 to 54 Years | 282 (87.3%) | 29 (10.3%) |
| 55 to 59 Years | 186 (86.9%) | 0 (0.0%) |
| 60 to 64 Years | 119 (55.6%) | 0 (0.0%) |
| 65 to 74 Years | 123 (34.0%) | 7 (5.7%) |
| 75 Years and over | 0 (0.0%) | 0 (0.0%) |
| Total | 1,214 (66.0%) | 87 (7.2%) |
Employment Status by Educational Attainment in Shadow Lake
According to labor force statistics for Shadow Lake, 81.2% of individuals (939) out of the total population between 25 and 64 years of age (1,157) are in the labor force, with 4.0% or 38 of them being unemployed. The group with the highest labor force participation rate are those with the educational attainment of high school diploma, with 83.7% or 170 individuals in the labor force. Within the labor force, individuals with college / associate degree education have the highest percentage of unemployment, with 7.3% or 29 of them being unemployed.
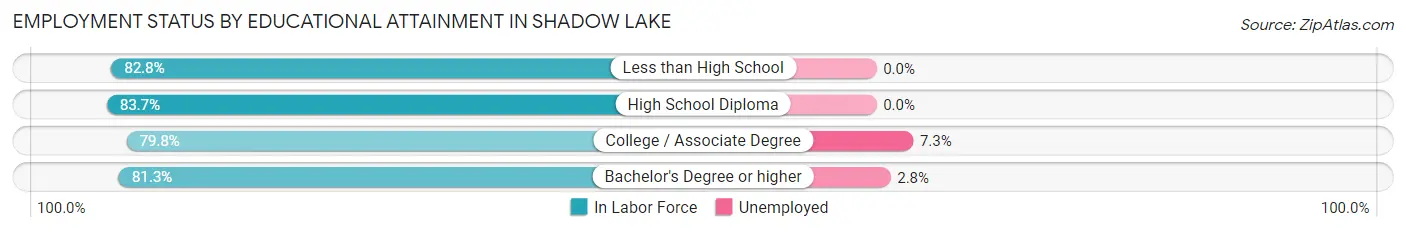
| Educational Attainment | In Labor Force | Unemployed |
| Less than High School | 48 (82.8%) | 0 (0.0%) |
| High School Diploma | 170 (83.7%) | 0 (0.0%) |
| College / Associate Degree | 396 (79.8%) | 36 (7.3%) |
| Bachelor's Degree or higher | 325 (81.3%) | 11 (2.8%) |
| Total | 939 (81.2%) | 46 (4.0%) |
Employment Occupations by Sex in Shadow Lake
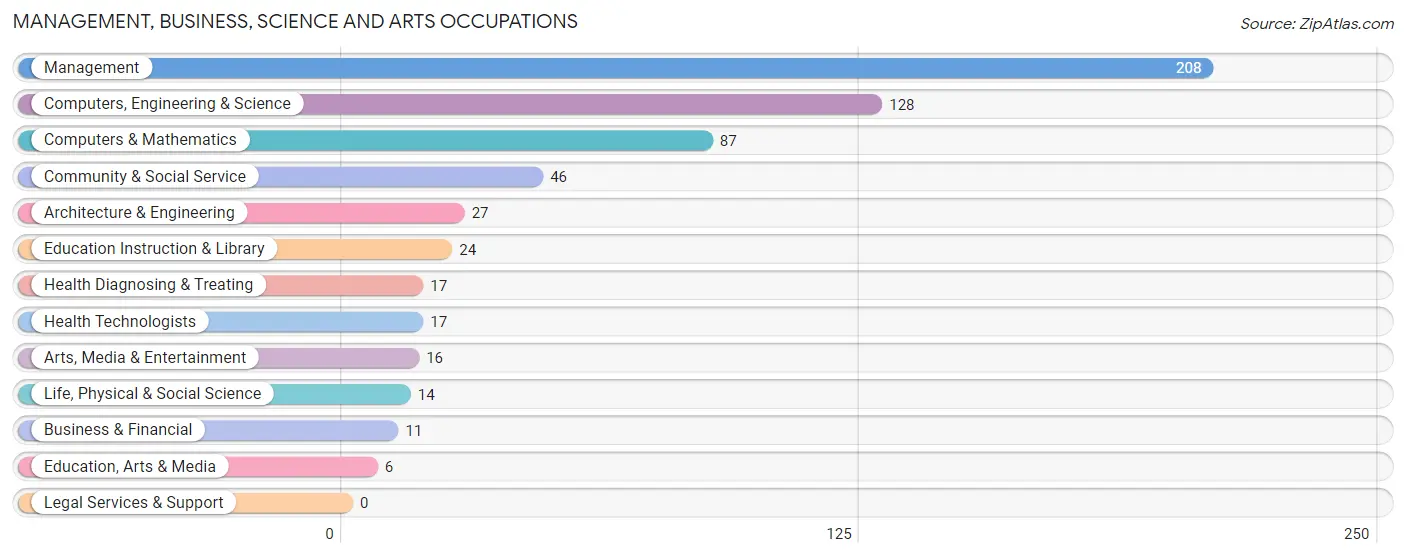
Management, Business, Science and Arts Occupations
The most common Management, Business, Science and Arts occupations in Shadow Lake are Management (208 | 18.5%), Computers, Engineering & Science (128 | 11.4%), Computers & Mathematics (87 | 7.7%), Community & Social Service (46 | 4.1%), and Architecture & Engineering (27 | 2.4%).
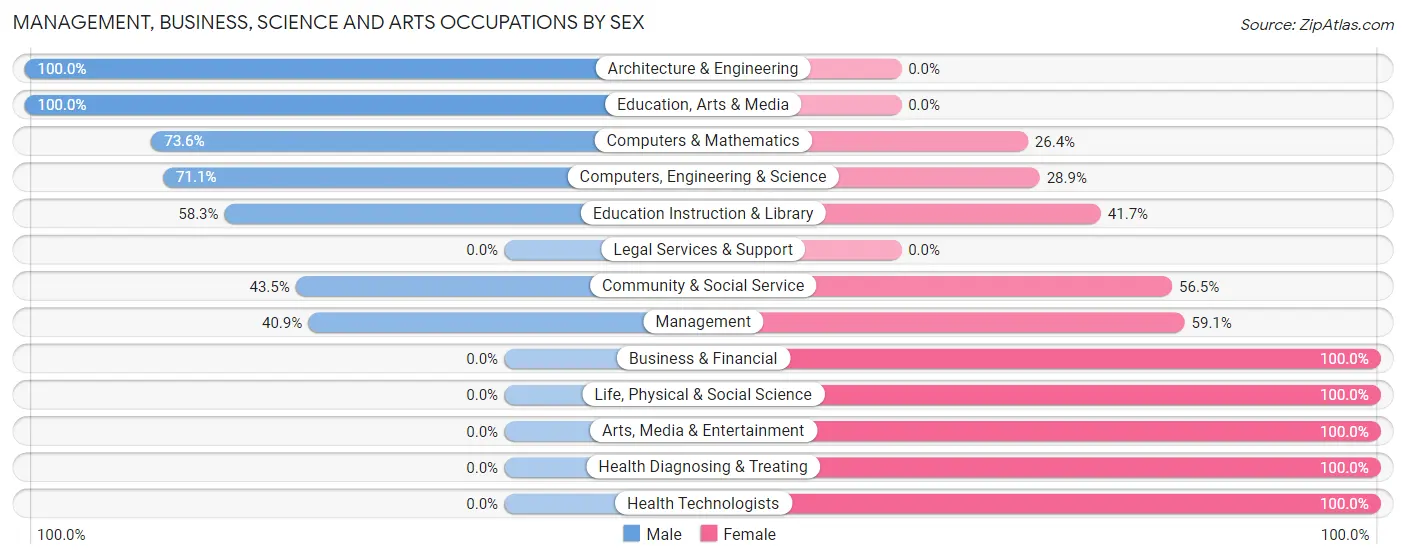
Management, Business, Science and Arts Occupations by Sex
Within the Management, Business, Science and Arts occupations in Shadow Lake, the most male-oriented occupations are Architecture & Engineering (100.0%), Education, Arts & Media (100.0%), and Computers & Mathematics (73.6%), while the most female-oriented occupations are Business & Financial (100.0%), Life, Physical & Social Science (100.0%), and Arts, Media & Entertainment (100.0%).
| Occupation | Male | Female |
| Management | 85 (40.9%) | 123 (59.1%) |
| Business & Financial | 0 (0.0%) | 11 (100.0%) |
| Computers, Engineering & Science | 91 (71.1%) | 37 (28.9%) |
| Computers & Mathematics | 64 (73.6%) | 23 (26.4%) |
| Architecture & Engineering | 27 (100.0%) | 0 (0.0%) |
| Life, Physical & Social Science | 0 (0.0%) | 14 (100.0%) |
| Community & Social Service | 20 (43.5%) | 26 (56.5%) |
| Education, Arts & Media | 6 (100.0%) | 0 (0.0%) |
| Legal Services & Support | 0 (0.0%) | 0 (0.0%) |
| Education Instruction & Library | 14 (58.3%) | 10 (41.7%) |
| Arts, Media & Entertainment | 0 (0.0%) | 16 (100.0%) |
| Health Diagnosing & Treating | 0 (0.0%) | 17 (100.0%) |
| Health Technologists | 0 (0.0%) | 17 (100.0%) |
| Total (Category) | 196 (47.8%) | 214 (52.2%) |
| Total (Overall) | 628 (55.7%) | 499 (44.3%) |
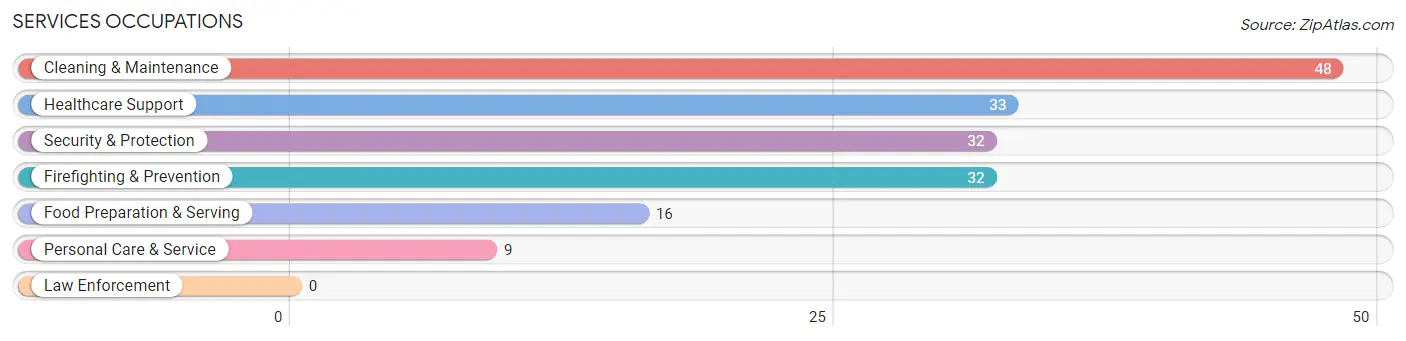
Services Occupations
The most common Services occupations in Shadow Lake are Cleaning & Maintenance (48 | 4.3%), Healthcare Support (33 | 2.9%), Security & Protection (32 | 2.8%), Firefighting & Prevention (32 | 2.8%), and Food Preparation & Serving (16 | 1.4%).
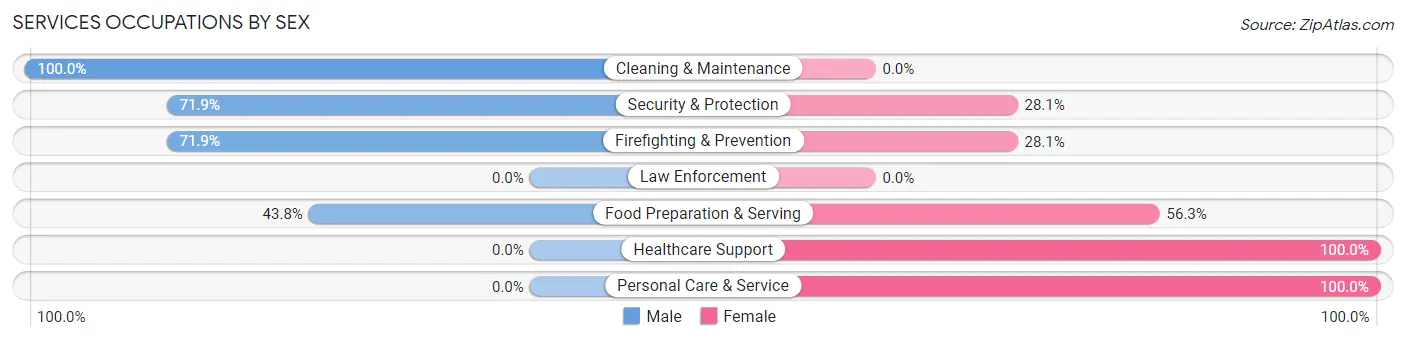
Services Occupations by Sex
Within the Services occupations in Shadow Lake, the most male-oriented occupations are Cleaning & Maintenance (100.0%), Security & Protection (71.9%), and Firefighting & Prevention (71.9%), while the most female-oriented occupations are Healthcare Support (100.0%), Personal Care & Service (100.0%), and Food Preparation & Serving (56.2%).
| Occupation | Male | Female |
| Healthcare Support | 0 (0.0%) | 33 (100.0%) |
| Security & Protection | 23 (71.9%) | 9 (28.1%) |
| Firefighting & Prevention | 23 (71.9%) | 9 (28.1%) |
| Law Enforcement | 0 (0.0%) | 0 (0.0%) |
| Food Preparation & Serving | 7 (43.8%) | 9 (56.2%) |
| Cleaning & Maintenance | 48 (100.0%) | 0 (0.0%) |
| Personal Care & Service | 0 (0.0%) | 9 (100.0%) |
| Total (Category) | 78 (56.5%) | 60 (43.5%) |
| Total (Overall) | 628 (55.7%) | 499 (44.3%) |
Sales and Office Occupations
The most common Sales and Office occupations in Shadow Lake are Office & Administration (135 | 12.0%), and Sales & Related (112 | 9.9%).
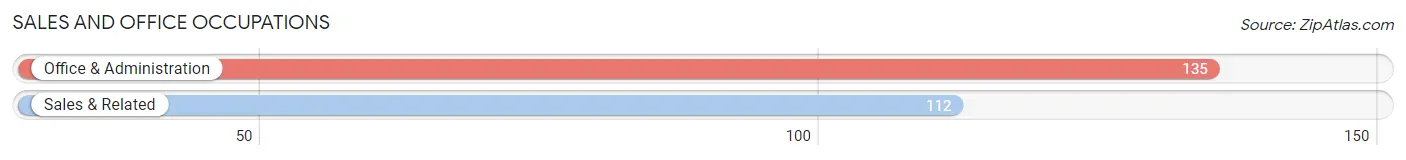
Sales and Office Occupations by Sex
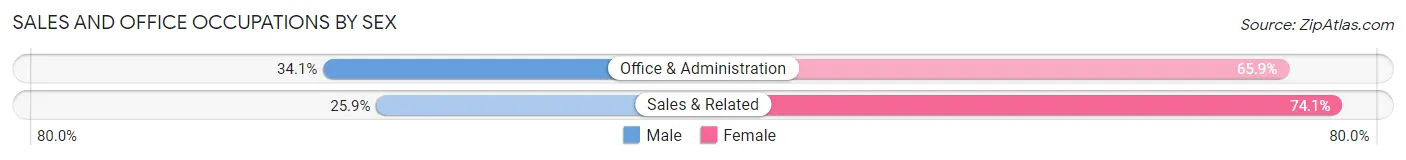
| Occupation | Male | Female |
| Sales & Related | 29 (25.9%) | 83 (74.1%) |
| Office & Administration | 46 (34.1%) | 89 (65.9%) |
| Total (Category) | 75 (30.4%) | 172 (69.6%) |
| Total (Overall) | 628 (55.7%) | 499 (44.3%) |
Natural Resources, Construction and Maintenance Occupations
The most common Natural Resources, Construction and Maintenance occupations in Shadow Lake are Construction & Extraction (112 | 9.9%), and Installation, Maintenance & Repair (39 | 3.5%).
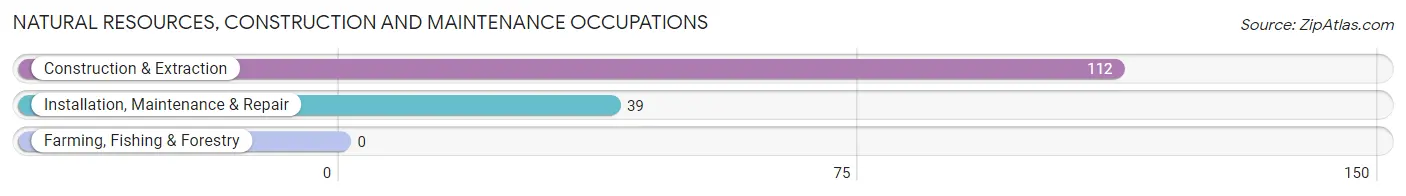
Natural Resources, Construction and Maintenance Occupations by Sex
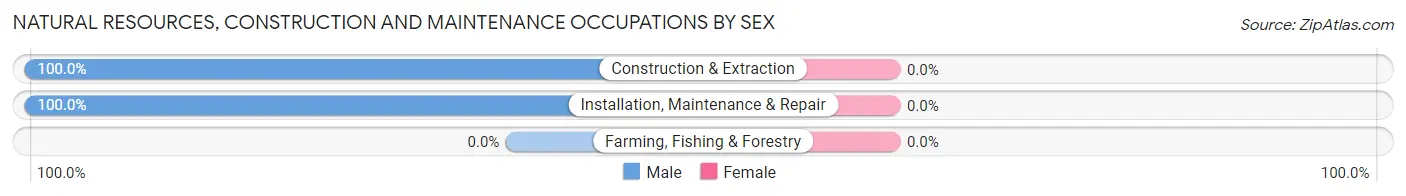
| Occupation | Male | Female |
| Farming, Fishing & Forestry | 0 (0.0%) | 0 (0.0%) |
| Construction & Extraction | 112 (100.0%) | 0 (0.0%) |
| Installation, Maintenance & Repair | 39 (100.0%) | 0 (0.0%) |
| Total (Category) | 151 (100.0%) | 0 (0.0%) |
| Total (Overall) | 628 (55.7%) | 499 (44.3%) |
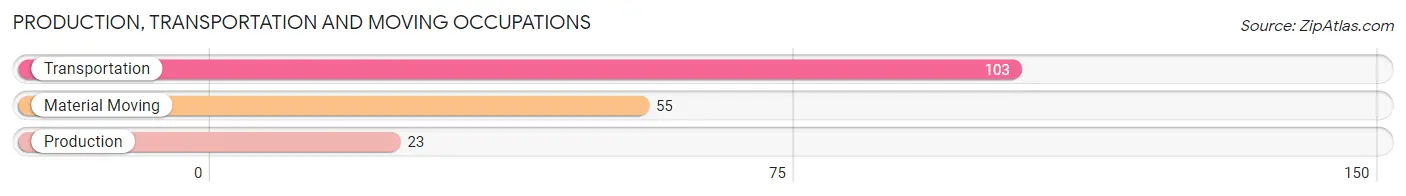
Production, Transportation and Moving Occupations
The most common Production, Transportation and Moving occupations in Shadow Lake are Transportation (103 | 9.1%), Material Moving (55 | 4.9%), and Production (23 | 2.0%).
Production, Transportation and Moving Occupations by Sex
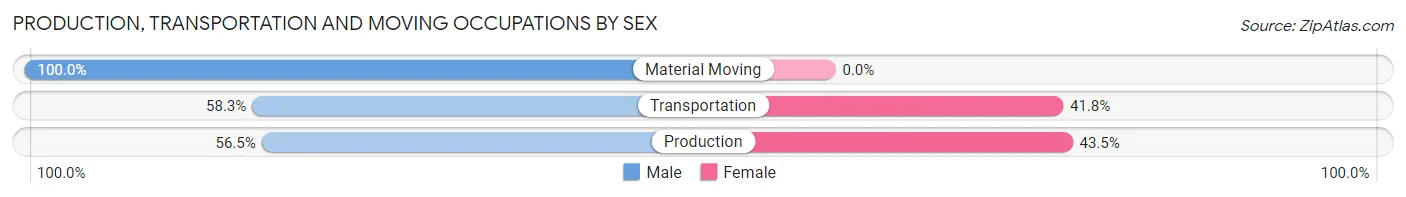
| Occupation | Male | Female |
| Production | 13 (56.5%) | 10 (43.5%) |
| Transportation | 60 (58.3%) | 43 (41.7%) |
| Material Moving | 55 (100.0%) | 0 (0.0%) |
| Total (Category) | 128 (70.7%) | 53 (29.3%) |
| Total (Overall) | 628 (55.7%) | 499 (44.3%) |
Employment Industries by Sex in Shadow Lake
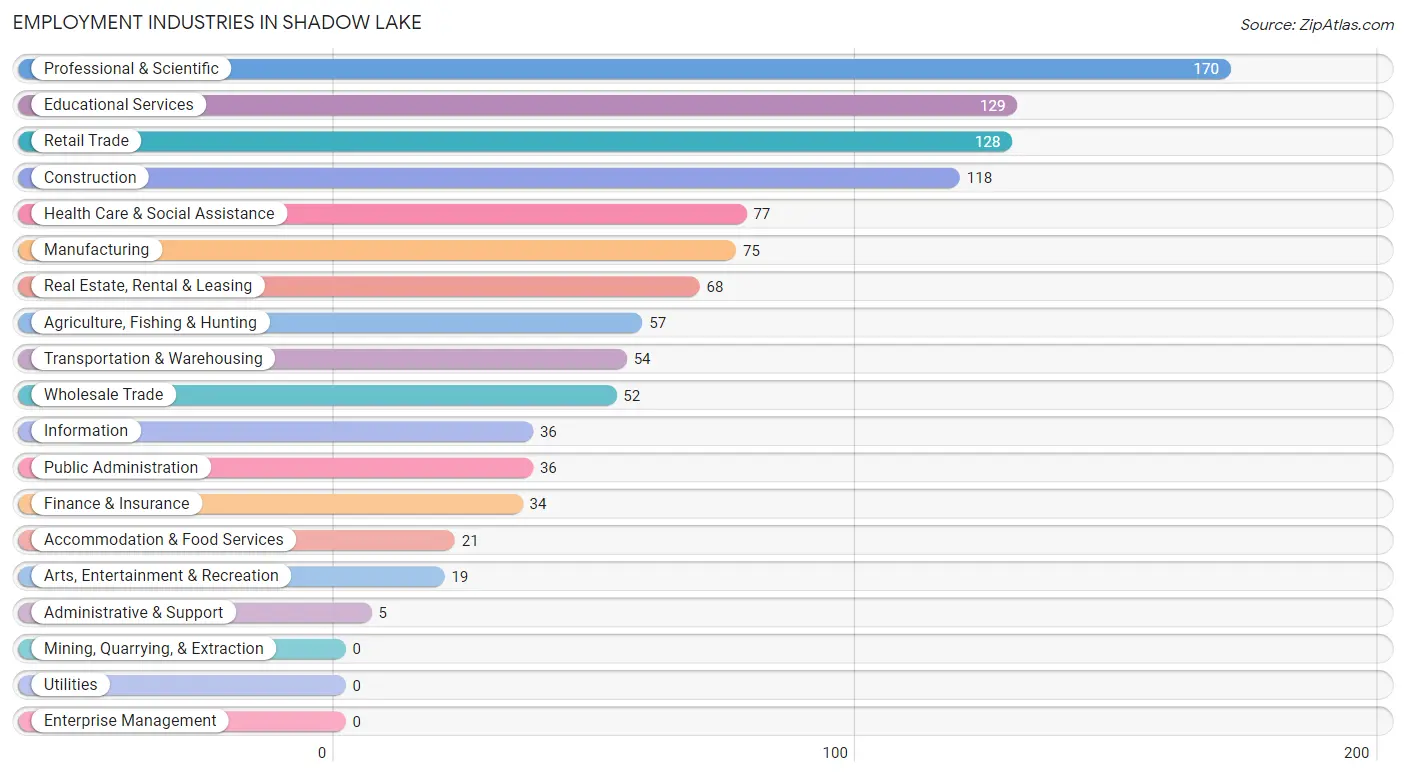
Employment Industries in Shadow Lake
The major employment industries in Shadow Lake include Professional & Scientific (170 | 15.1%), Educational Services (129 | 11.5%), Retail Trade (128 | 11.4%), Construction (118 | 10.5%), and Health Care & Social Assistance (77 | 6.8%).
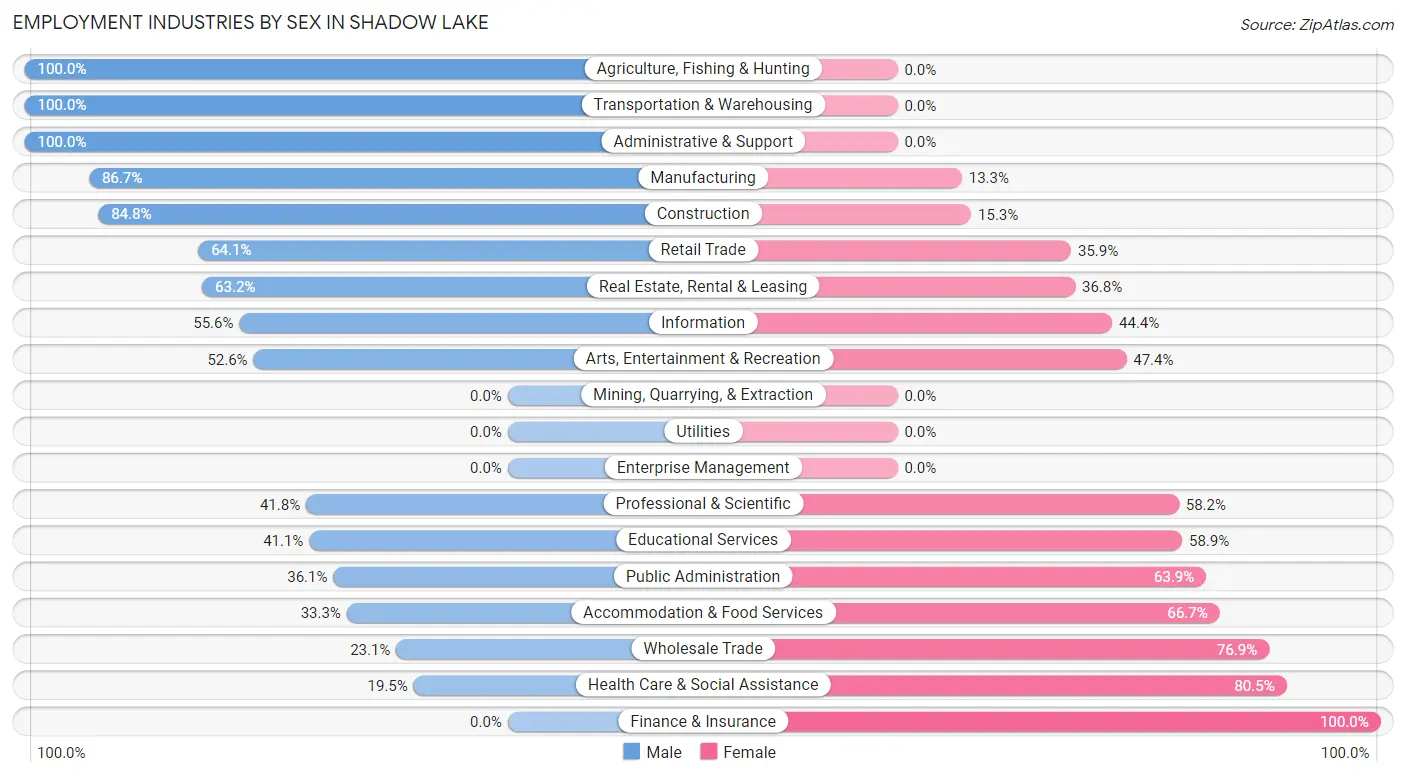
Employment Industries by Sex in Shadow Lake
The Shadow Lake industries that see more men than women are Agriculture, Fishing & Hunting (100.0%), Transportation & Warehousing (100.0%), and Administrative & Support (100.0%), whereas the industries that tend to have a higher number of women are Finance & Insurance (100.0%), Health Care & Social Assistance (80.5%), and Wholesale Trade (76.9%).
| Industry | Male | Female |
| Agriculture, Fishing & Hunting | 57 (100.0%) | 0 (0.0%) |
| Mining, Quarrying, & Extraction | 0 (0.0%) | 0 (0.0%) |
| Construction | 100 (84.8%) | 18 (15.2%) |
| Manufacturing | 65 (86.7%) | 10 (13.3%) |
| Wholesale Trade | 12 (23.1%) | 40 (76.9%) |
| Retail Trade | 82 (64.1%) | 46 (35.9%) |
| Transportation & Warehousing | 54 (100.0%) | 0 (0.0%) |
| Utilities | 0 (0.0%) | 0 (0.0%) |
| Information | 20 (55.6%) | 16 (44.4%) |
| Finance & Insurance | 0 (0.0%) | 34 (100.0%) |
| Real Estate, Rental & Leasing | 43 (63.2%) | 25 (36.8%) |
| Professional & Scientific | 71 (41.8%) | 99 (58.2%) |
| Enterprise Management | 0 (0.0%) | 0 (0.0%) |
| Administrative & Support | 5 (100.0%) | 0 (0.0%) |
| Educational Services | 53 (41.1%) | 76 (58.9%) |
| Health Care & Social Assistance | 15 (19.5%) | 62 (80.5%) |
| Arts, Entertainment & Recreation | 10 (52.6%) | 9 (47.4%) |
| Accommodation & Food Services | 7 (33.3%) | 14 (66.7%) |
| Public Administration | 13 (36.1%) | 23 (63.9%) |
| Total | 628 (55.7%) | 499 (44.3%) |
Education in Shadow Lake
School Enrollment in Shadow Lake
The most common levels of schooling among the 369 students in Shadow Lake are high school (99 | 26.8%), middle school (86 | 23.3%), and college / undergraduate (86 | 23.3%).
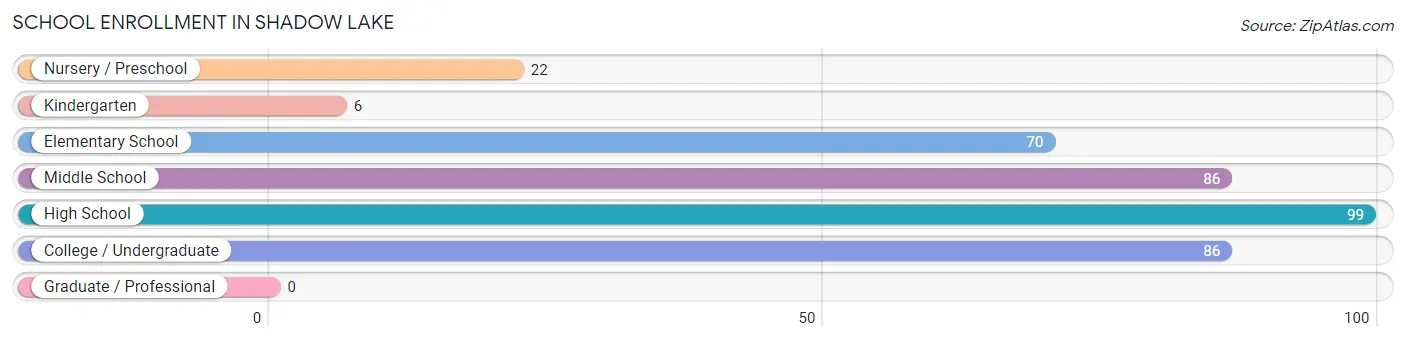
| School Level | # Students | % Students |
| Nursery / Preschool | 22 | 6.0% |
| Kindergarten | 6 | 1.6% |
| Elementary School | 70 | 19.0% |
| Middle School | 86 | 23.3% |
| High School | 99 | 26.8% |
| College / Undergraduate | 86 | 23.3% |
| Graduate / Professional | 0 | 0.0% |
| Total | 369 | 100.0% |
School Enrollment by Age by Funding Source in Shadow Lake
Out of a total of 369 students who are enrolled in schools in Shadow Lake, 58 (15.7%) attend a private institution, while the remaining 311 (84.3%) are enrolled in public schools. The age group of 25 to 34 year olds has the highest likelihood of being enrolled in private schools, with 10 (50.0% in the age bracket) enrolled. Conversely, the age group of 3 to 4 year olds has the lowest likelihood of being enrolled in a private school, with 11 (100.0% in the age bracket) attending a public institution.
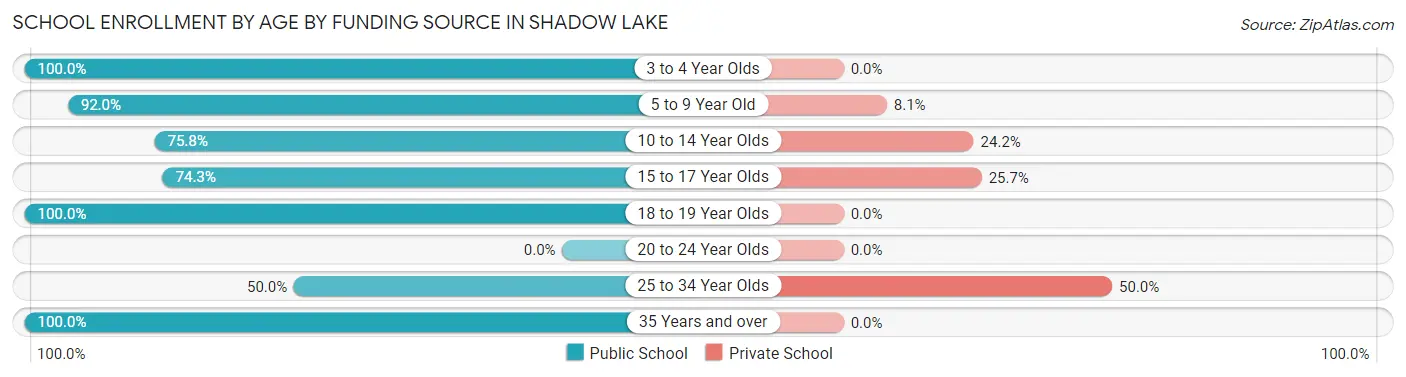
| Age Bracket | Public School | Private School |
| 3 to 4 Year Olds | 11 (100.0%) | 0 (0.0%) |
| 5 to 9 Year Old | 80 (91.9%) | 7 (8.1%) |
| 10 to 14 Year Olds | 72 (75.8%) | 23 (24.2%) |
| 15 to 17 Year Olds | 52 (74.3%) | 18 (25.7%) |
| 18 to 19 Year Olds | 29 (100.0%) | 0 (0.0%) |
| 20 to 24 Year Olds | 0 (0.0%) | 0 (0.0%) |
| 25 to 34 Year Olds | 10 (50.0%) | 10 (50.0%) |
| 35 Years and over | 57 (100.0%) | 0 (0.0%) |
| Total | 311 (84.3%) | 58 (15.7%) |
Educational Attainment by Field of Study in Shadow Lake
Business (121 | 22.7%), engineering (81 | 15.2%), bio, nature & agricultural (75 | 14.1%), psychology (53 | 10.0%), and science & technology (43 | 8.1%) are the most common fields of study among 532 individuals in Shadow Lake who have obtained a bachelor's degree or higher.
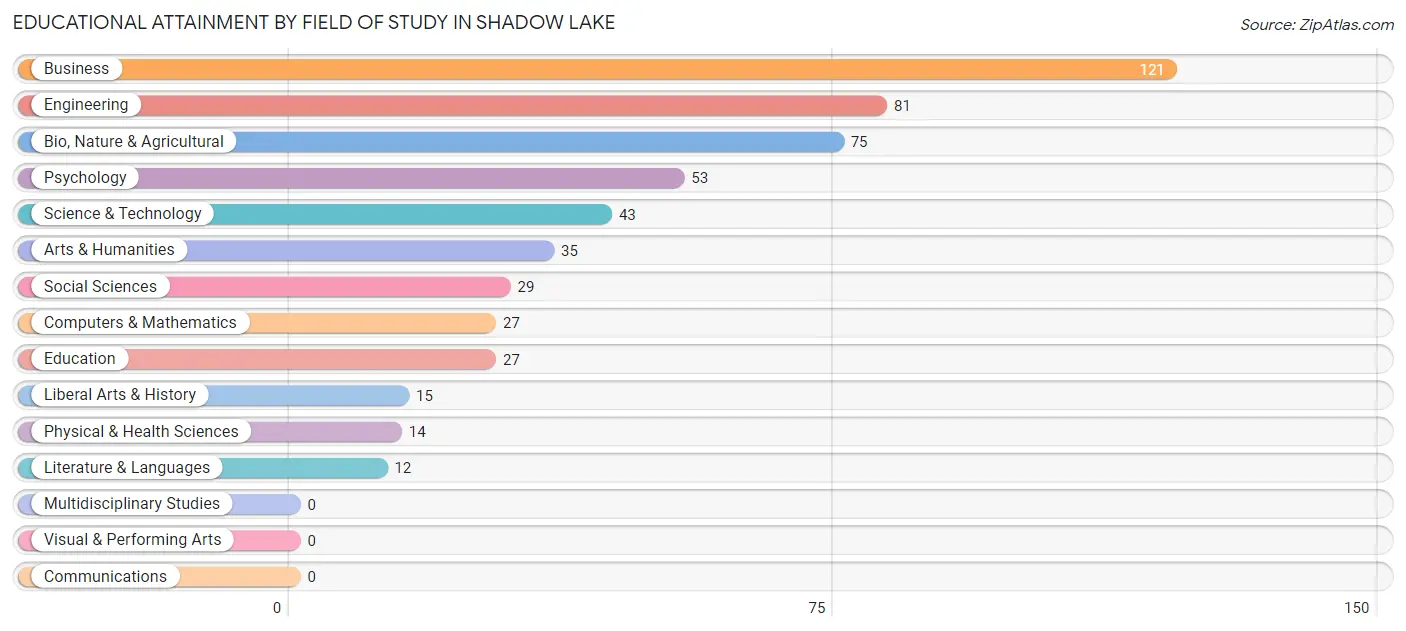
| Field of Study | # Graduates | % Graduates |
| Computers & Mathematics | 27 | 5.1% |
| Bio, Nature & Agricultural | 75 | 14.1% |
| Physical & Health Sciences | 14 | 2.6% |
| Psychology | 53 | 10.0% |
| Social Sciences | 29 | 5.4% |
| Engineering | 81 | 15.2% |
| Multidisciplinary Studies | 0 | 0.0% |
| Science & Technology | 43 | 8.1% |
| Business | 121 | 22.7% |
| Education | 27 | 5.1% |
| Literature & Languages | 12 | 2.3% |
| Liberal Arts & History | 15 | 2.8% |
| Visual & Performing Arts | 0 | 0.0% |
| Communications | 0 | 0.0% |
| Arts & Humanities | 35 | 6.6% |
| Total | 532 | 100.0% |
Transportation & Commute in Shadow Lake
Vehicle Availability by Sex in Shadow Lake
The most prevalent vehicle ownership categories in Shadow Lake are males with 5 or more vehicles (189, accounting for 30.1%) and females with 5 or more vehicles (144, making up 37.9%).
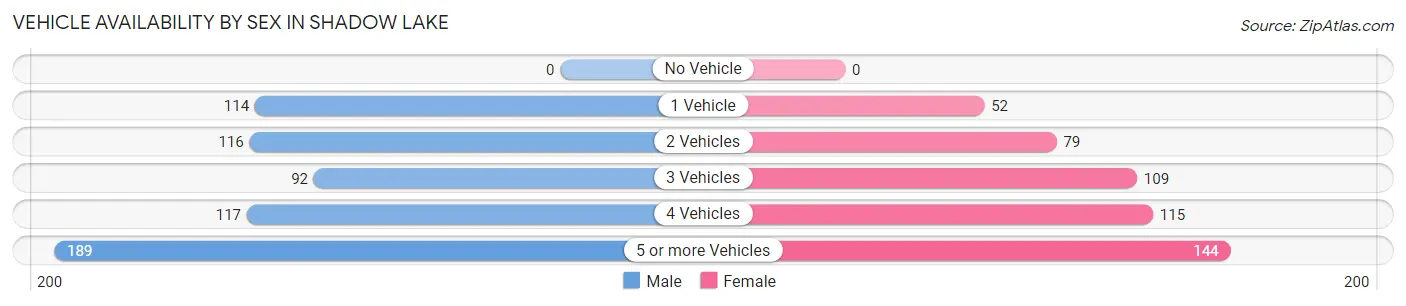
| Vehicles Available | Male | Female |
| No Vehicle | 0 (0.0%) | 0 (0.0%) |
| 1 Vehicle | 114 (18.1%) | 52 (10.4%) |
| 2 Vehicles | 116 (18.5%) | 79 (15.8%) |
| 3 Vehicles | 92 (14.6%) | 109 (21.8%) |
| 4 Vehicles | 117 (18.6%) | 115 (23.1%) |
| 5 or more Vehicles | 189 (30.1%) | 144 (28.9%) |
| Total | 628 (100.0%) | 499 (100.0%) |
Commute Time in Shadow Lake
The most frequently occuring commute durations in Shadow Lake are 60 to 89 minutes (210 commuters, 23.2%), 45 to 59 minutes (200 commuters, 22.1%), and 25 to 29 minutes (134 commuters, 14.8%).
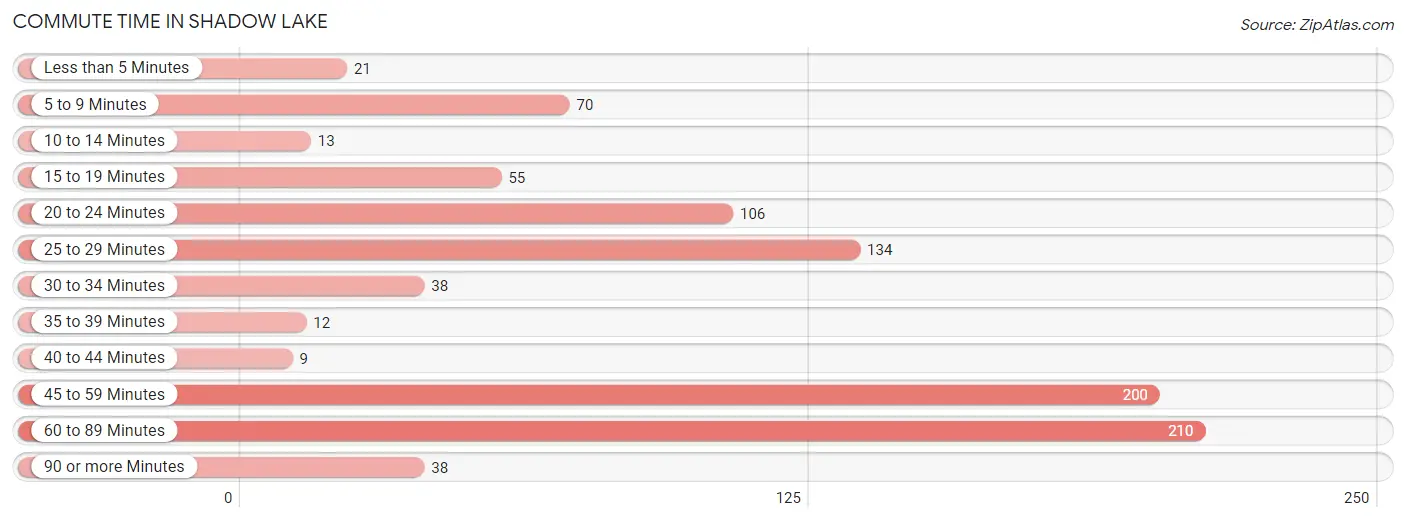
| Commute Time | # Commuters | % Commuters |
| Less than 5 Minutes | 21 | 2.3% |
| 5 to 9 Minutes | 70 | 7.7% |
| 10 to 14 Minutes | 13 | 1.4% |
| 15 to 19 Minutes | 55 | 6.1% |
| 20 to 24 Minutes | 106 | 11.7% |
| 25 to 29 Minutes | 134 | 14.8% |
| 30 to 34 Minutes | 38 | 4.2% |
| 35 to 39 Minutes | 12 | 1.3% |
| 40 to 44 Minutes | 9 | 1.0% |
| 45 to 59 Minutes | 200 | 22.1% |
| 60 to 89 Minutes | 210 | 23.2% |
| 90 or more Minutes | 38 | 4.2% |
Commute Time by Sex in Shadow Lake
The most common commute times in Shadow Lake are 60 to 89 minutes (166 commuters, 32.7%) for males and 25 to 29 minutes (121 commuters, 30.3%) for females.
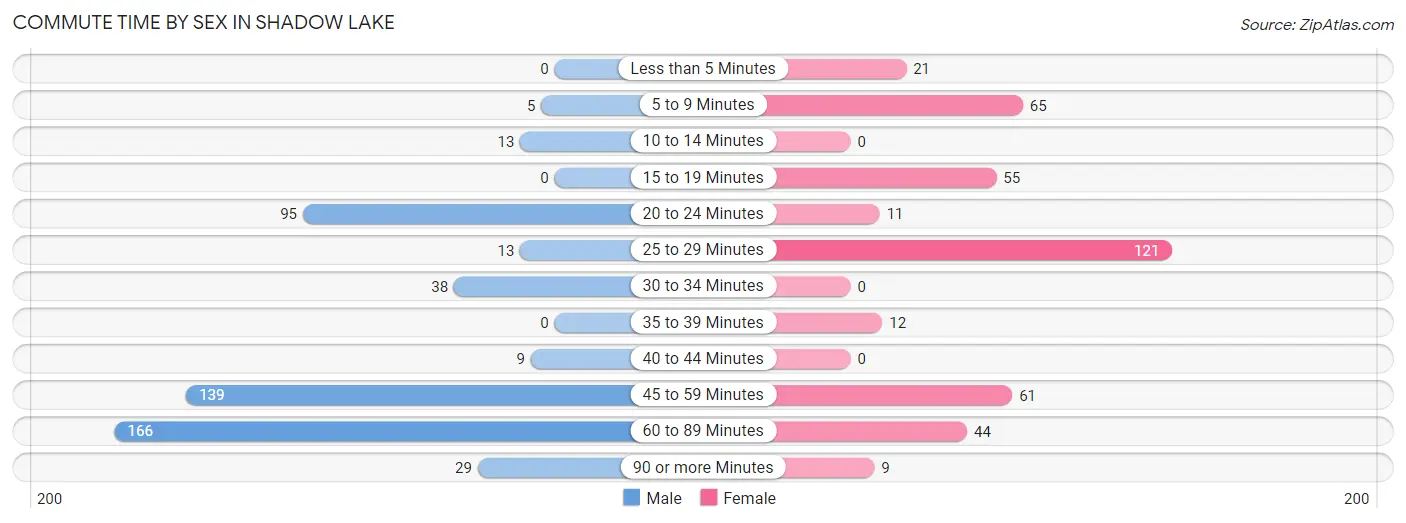
| Commute Time | Male | Female |
| Less than 5 Minutes | 0 (0.0%) | 21 (5.3%) |
| 5 to 9 Minutes | 5 (1.0%) | 65 (16.3%) |
| 10 to 14 Minutes | 13 (2.6%) | 0 (0.0%) |
| 15 to 19 Minutes | 0 (0.0%) | 55 (13.8%) |
| 20 to 24 Minutes | 95 (18.7%) | 11 (2.8%) |
| 25 to 29 Minutes | 13 (2.6%) | 121 (30.3%) |
| 30 to 34 Minutes | 38 (7.5%) | 0 (0.0%) |
| 35 to 39 Minutes | 0 (0.0%) | 12 (3.0%) |
| 40 to 44 Minutes | 9 (1.8%) | 0 (0.0%) |
| 45 to 59 Minutes | 139 (27.4%) | 61 (15.3%) |
| 60 to 89 Minutes | 166 (32.7%) | 44 (11.0%) |
| 90 or more Minutes | 29 (5.7%) | 9 (2.3%) |
Time of Departure to Work by Sex in Shadow Lake
The most frequent times of departure to work in Shadow Lake are 7:00 AM to 7:29 AM (131, 25.8%) for males and 5:00 AM to 5:29 AM (83, 20.8%) for females.
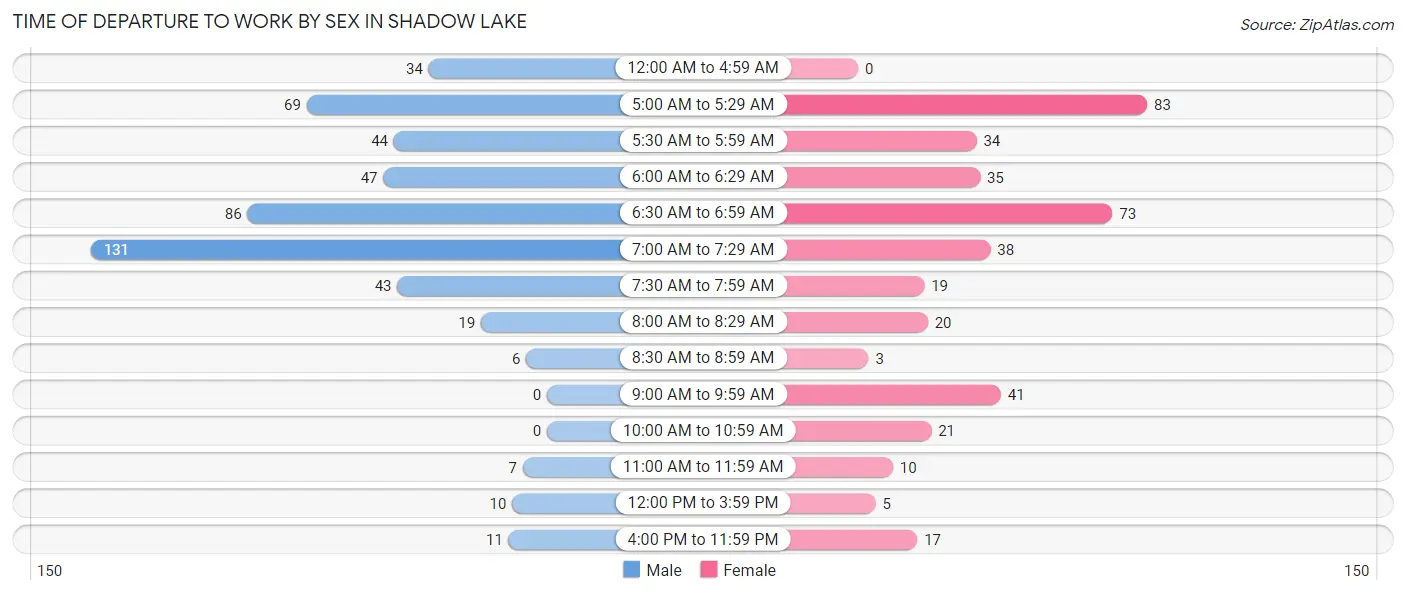
| Time of Departure | Male | Female |
| 12:00 AM to 4:59 AM | 34 (6.7%) | 0 (0.0%) |
| 5:00 AM to 5:29 AM | 69 (13.6%) | 83 (20.8%) |
| 5:30 AM to 5:59 AM | 44 (8.7%) | 34 (8.5%) |
| 6:00 AM to 6:29 AM | 47 (9.3%) | 35 (8.8%) |
| 6:30 AM to 6:59 AM | 86 (17.0%) | 73 (18.3%) |
| 7:00 AM to 7:29 AM | 131 (25.8%) | 38 (9.5%) |
| 7:30 AM to 7:59 AM | 43 (8.5%) | 19 (4.8%) |
| 8:00 AM to 8:29 AM | 19 (3.7%) | 20 (5.0%) |
| 8:30 AM to 8:59 AM | 6 (1.2%) | 3 (0.7%) |
| 9:00 AM to 9:59 AM | 0 (0.0%) | 41 (10.3%) |
| 10:00 AM to 10:59 AM | 0 (0.0%) | 21 (5.3%) |
| 11:00 AM to 11:59 AM | 7 (1.4%) | 10 (2.5%) |
| 12:00 PM to 3:59 PM | 10 (2.0%) | 5 (1.3%) |
| 4:00 PM to 11:59 PM | 11 (2.2%) | 17 (4.3%) |
| Total | 507 (100.0%) | 399 (100.0%) |
Housing Occupancy in Shadow Lake
Occupancy by Ownership in Shadow Lake
Of the total 800 dwellings in Shadow Lake, owner-occupied units account for 721 (90.1%), while renter-occupied units make up 79 (9.9%).
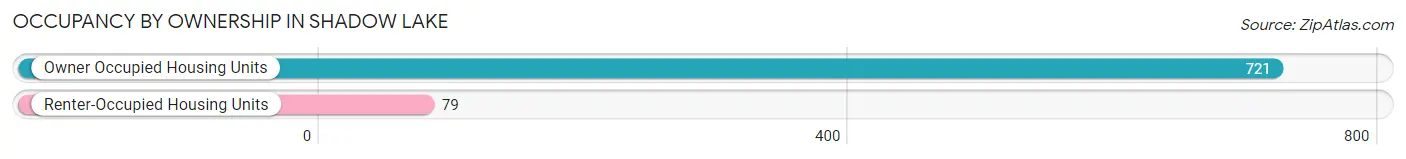
| Occupancy | # Housing Units | % Housing Units |
| Owner Occupied Housing Units | 721 | 90.1% |
| Renter-Occupied Housing Units | 79 | 9.9% |
| Total Occupied Housing Units | 800 | 100.0% |
Occupancy by Household Size in Shadow Lake
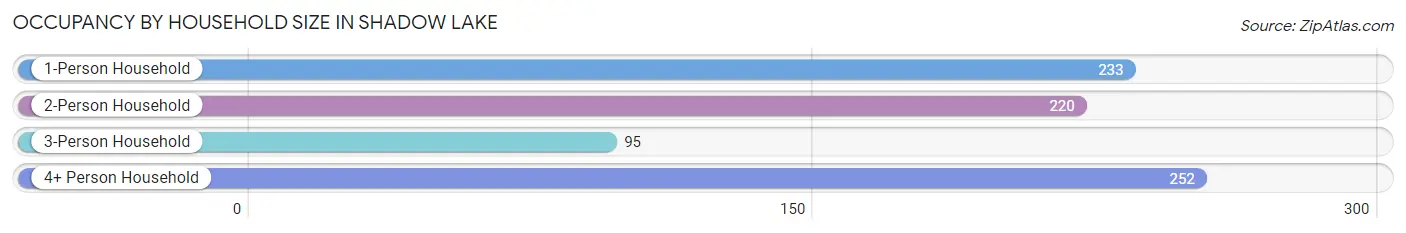
| Household Size | # Housing Units | % Housing Units |
| 1-Person Household | 233 | 29.1% |
| 2-Person Household | 220 | 27.5% |
| 3-Person Household | 95 | 11.9% |
| 4+ Person Household | 252 | 31.5% |
| Total Housing Units | 800 | 100.0% |
Occupancy by Ownership by Household Size in Shadow Lake
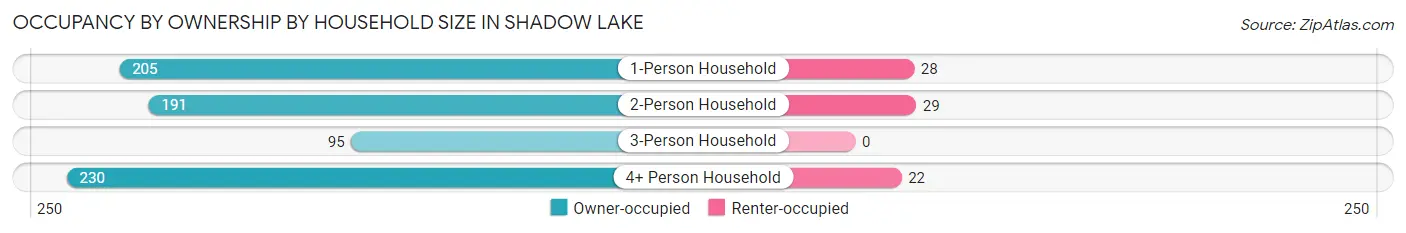
| Household Size | Owner-occupied | Renter-occupied |
| 1-Person Household | 205 (88.0%) | 28 (12.0%) |
| 2-Person Household | 191 (86.8%) | 29 (13.2%) |
| 3-Person Household | 95 (100.0%) | 0 (0.0%) |
| 4+ Person Household | 230 (91.3%) | 22 (8.7%) |
| Total Housing Units | 721 (90.1%) | 79 (9.9%) |
Occupancy by Educational Attainment in Shadow Lake
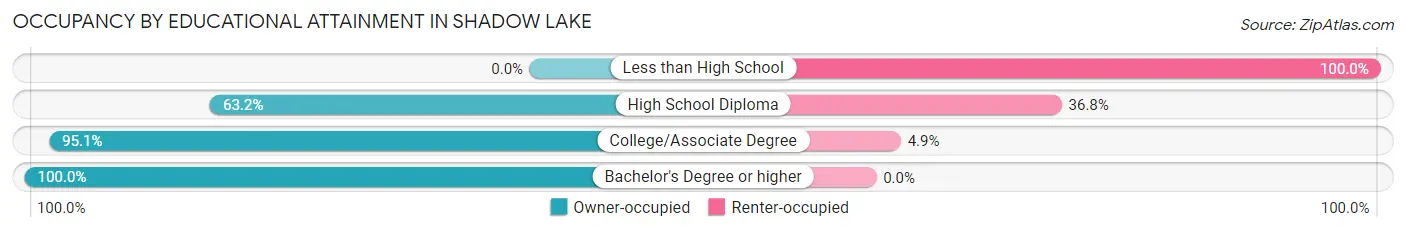
| Household Size | Owner-occupied | Renter-occupied |
| Less than High School | 0 (0.0%) | 6 (100.0%) |
| High School Diploma | 98 (63.2%) | 57 (36.8%) |
| College/Associate Degree | 313 (95.1%) | 16 (4.9%) |
| Bachelor's Degree or higher | 310 (100.0%) | 0 (0.0%) |
Occupancy by Age of Householder in Shadow Lake
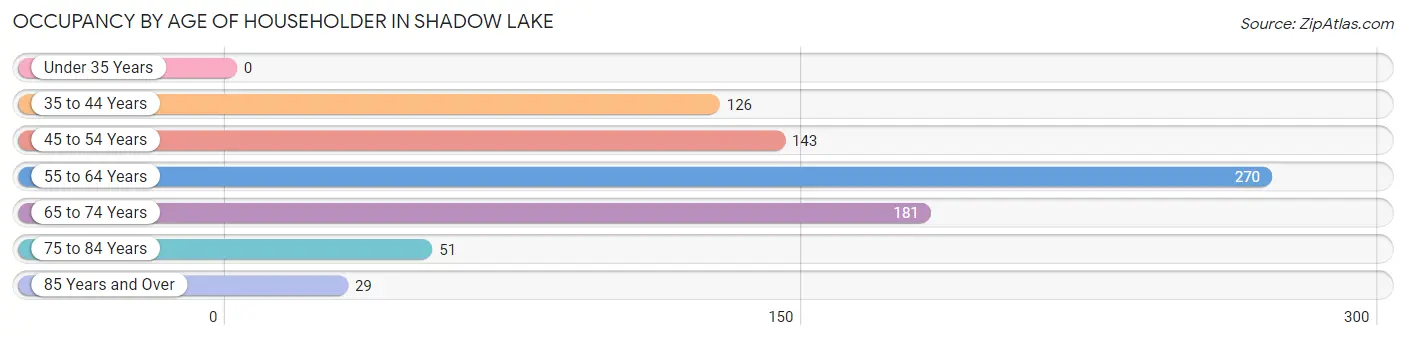
| Age Bracket | # Households | % Households |
| Under 35 Years | 0 | 0.0% |
| 35 to 44 Years | 126 | 15.8% |
| 45 to 54 Years | 143 | 17.9% |
| 55 to 64 Years | 270 | 33.8% |
| 65 to 74 Years | 181 | 22.6% |
| 75 to 84 Years | 51 | 6.4% |
| 85 Years and Over | 29 | 3.6% |
| Total | 800 | 100.0% |
Housing Finances in Shadow Lake
Median Income by Occupancy in Shadow Lake
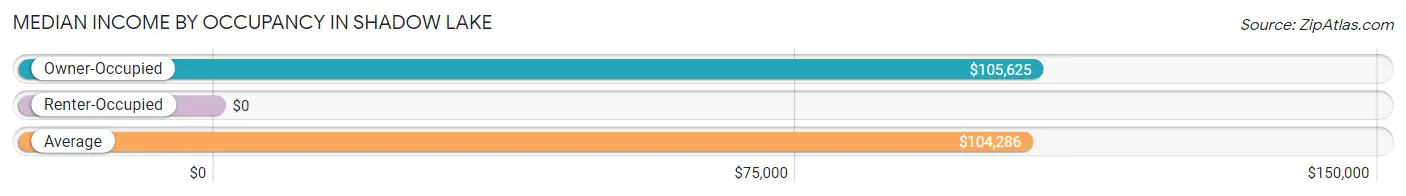
| Occupancy Type | # Households | Median Income |
| Owner-Occupied | 721 (90.1%) | $105,625 |
| Renter-Occupied | 79 (9.9%) | $0 |
| Average | 800 (100.0%) | $104,286 |
Occupancy by Householder Income Bracket in Shadow Lake
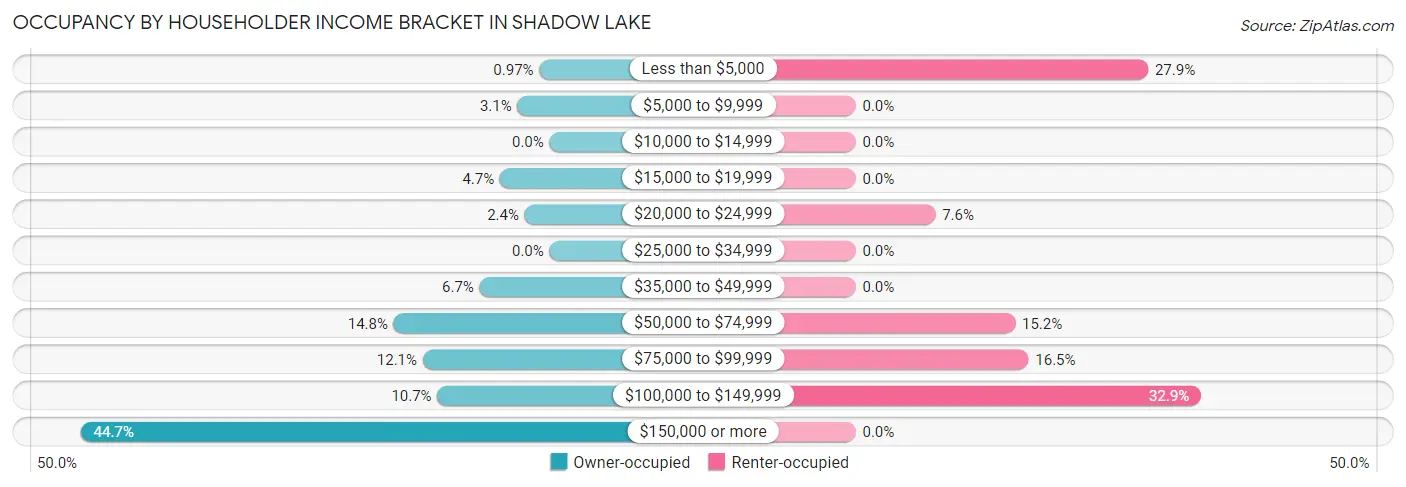
| Income Bracket | Owner-occupied | Renter-occupied |
| Less than $5,000 | 7 (1.0%) | 22 (27.9%) |
| $5,000 to $9,999 | 22 (3.0%) | 0 (0.0%) |
| $10,000 to $14,999 | 0 (0.0%) | 0 (0.0%) |
| $15,000 to $19,999 | 34 (4.7%) | 0 (0.0%) |
| $20,000 to $24,999 | 17 (2.4%) | 6 (7.6%) |
| $25,000 to $34,999 | 0 (0.0%) | 0 (0.0%) |
| $35,000 to $49,999 | 48 (6.7%) | 0 (0.0%) |
| $50,000 to $74,999 | 107 (14.8%) | 12 (15.2%) |
| $75,000 to $99,999 | 87 (12.1%) | 13 (16.5%) |
| $100,000 to $149,999 | 77 (10.7%) | 26 (32.9%) |
| $150,000 or more | 322 (44.7%) | 0 (0.0%) |
| Total | 721 (100.0%) | 79 (100.0%) |
Monthly Housing Cost Tiers in Shadow Lake
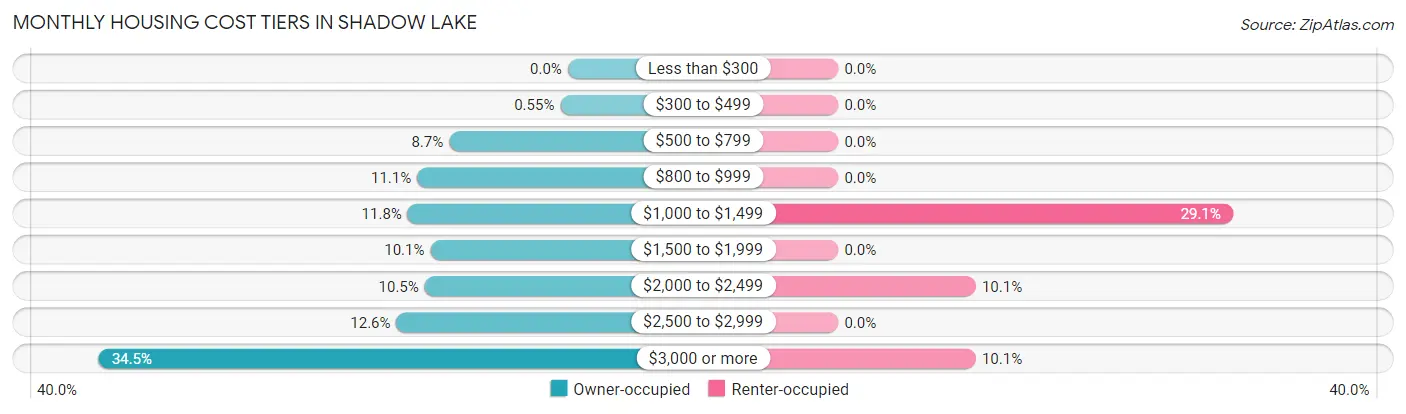
| Monthly Cost | Owner-occupied | Renter-occupied |
| Less than $300 | 0 (0.0%) | 0 (0.0%) |
| $300 to $499 | 4 (0.5%) | 0 (0.0%) |
| $500 to $799 | 63 (8.7%) | 0 (0.0%) |
| $800 to $999 | 80 (11.1%) | 0 (0.0%) |
| $1,000 to $1,499 | 85 (11.8%) | 23 (29.1%) |
| $1,500 to $1,999 | 73 (10.1%) | 0 (0.0%) |
| $2,000 to $2,499 | 76 (10.5%) | 8 (10.1%) |
| $2,500 to $2,999 | 91 (12.6%) | 0 (0.0%) |
| $3,000 or more | 249 (34.5%) | 8 (10.1%) |
| Total | 721 (100.0%) | 79 (100.0%) |
Physical Housing Characteristics in Shadow Lake
Housing Structures in Shadow Lake
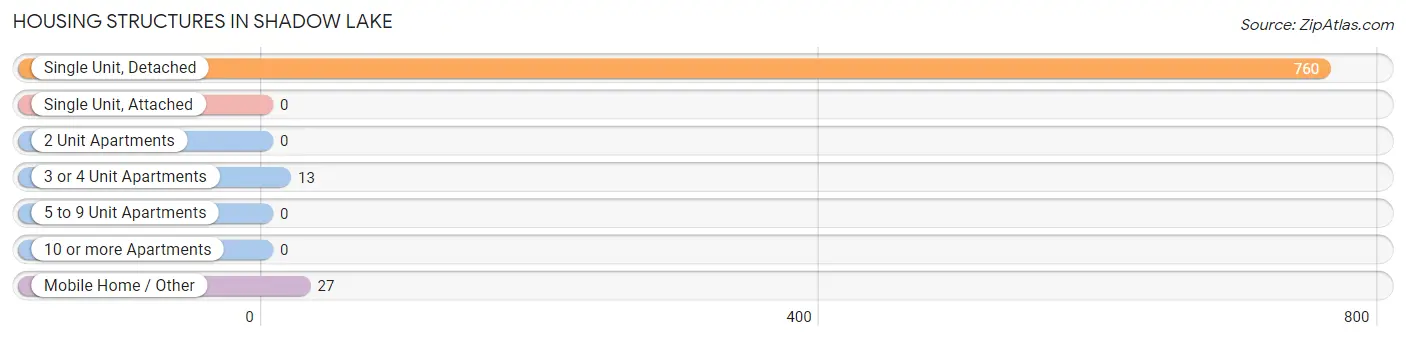
| Structure Type | # Housing Units | % Housing Units |
| Single Unit, Detached | 760 | 95.0% |
| Single Unit, Attached | 0 | 0.0% |
| 2 Unit Apartments | 0 | 0.0% |
| 3 or 4 Unit Apartments | 13 | 1.6% |
| 5 to 9 Unit Apartments | 0 | 0.0% |
| 10 or more Apartments | 0 | 0.0% |
| Mobile Home / Other | 27 | 3.4% |
| Total | 800 | 100.0% |
Housing Structures by Occupancy in Shadow Lake
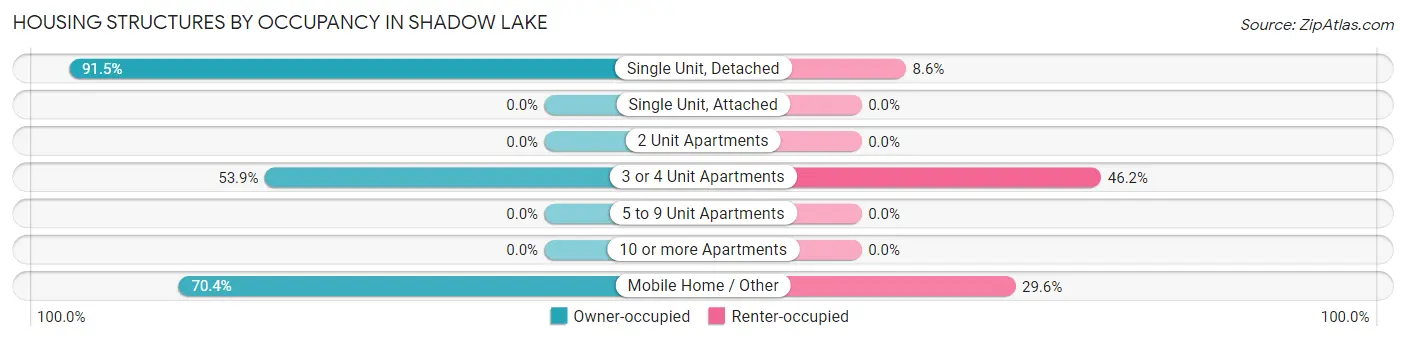
| Structure Type | Owner-occupied | Renter-occupied |
| Single Unit, Detached | 695 (91.4%) | 65 (8.6%) |
| Single Unit, Attached | 0 (0.0%) | 0 (0.0%) |
| 2 Unit Apartments | 0 (0.0%) | 0 (0.0%) |
| 3 or 4 Unit Apartments | 7 (53.8%) | 6 (46.2%) |
| 5 to 9 Unit Apartments | 0 (0.0%) | 0 (0.0%) |
| 10 or more Apartments | 0 (0.0%) | 0 (0.0%) |
| Mobile Home / Other | 19 (70.4%) | 8 (29.6%) |
| Total | 721 (90.1%) | 79 (9.9%) |
Housing Structures by Number of Rooms in Shadow Lake
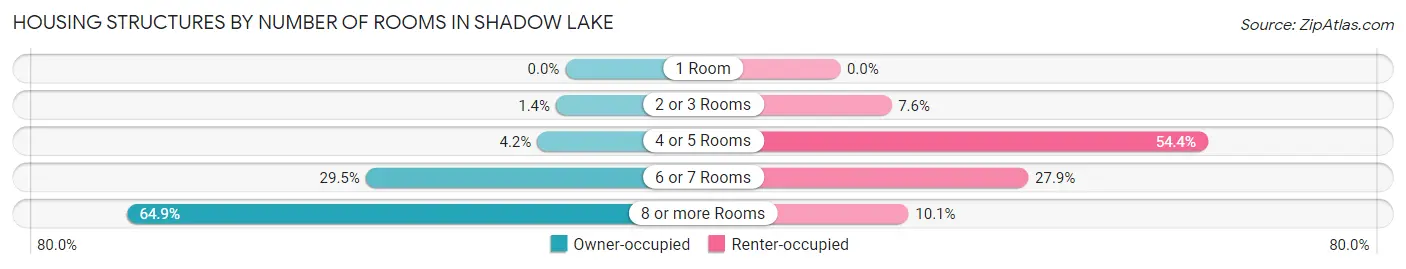
| Number of Rooms | Owner-occupied | Renter-occupied |
| 1 Room | 0 (0.0%) | 0 (0.0%) |
| 2 or 3 Rooms | 10 (1.4%) | 6 (7.6%) |
| 4 or 5 Rooms | 30 (4.2%) | 43 (54.4%) |
| 6 or 7 Rooms | 213 (29.5%) | 22 (27.9%) |
| 8 or more Rooms | 468 (64.9%) | 8 (10.1%) |
| Total | 721 (100.0%) | 79 (100.0%) |
Housing Structure by Heating Type in Shadow Lake
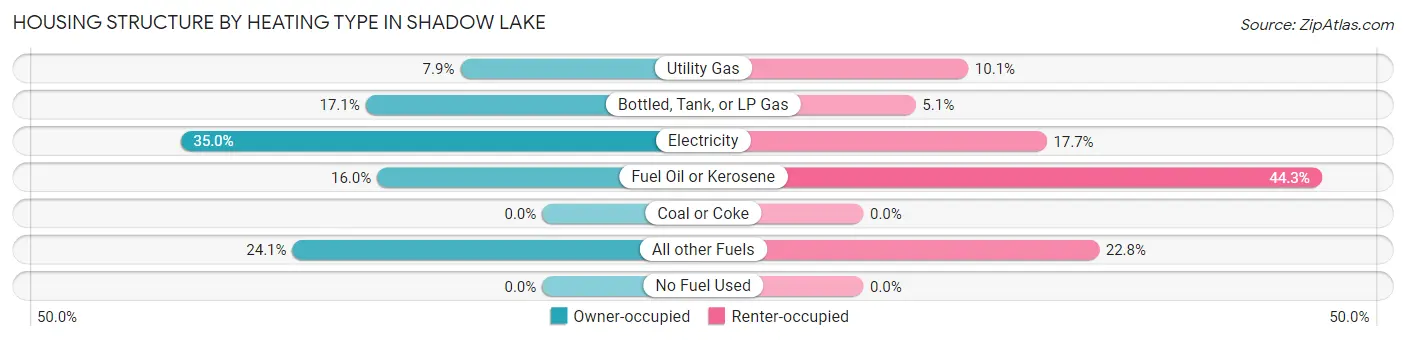
| Heating Type | Owner-occupied | Renter-occupied |
| Utility Gas | 57 (7.9%) | 8 (10.1%) |
| Bottled, Tank, or LP Gas | 123 (17.1%) | 4 (5.1%) |
| Electricity | 252 (34.9%) | 14 (17.7%) |
| Fuel Oil or Kerosene | 115 (16.0%) | 35 (44.3%) |
| Coal or Coke | 0 (0.0%) | 0 (0.0%) |
| All other Fuels | 174 (24.1%) | 18 (22.8%) |
| No Fuel Used | 0 (0.0%) | 0 (0.0%) |
| Total | 721 (100.0%) | 79 (100.0%) |
Household Vehicle Usage in Shadow Lake
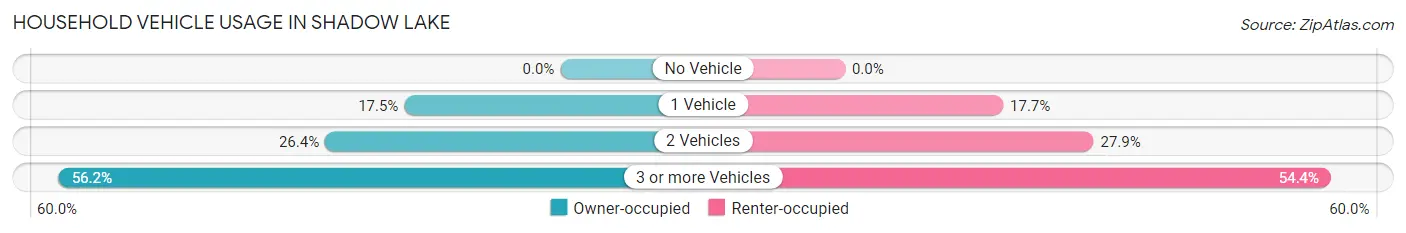
| Vehicles per Household | Owner-occupied | Renter-occupied |
| No Vehicle | 0 (0.0%) | 0 (0.0%) |
| 1 Vehicle | 126 (17.5%) | 14 (17.7%) |
| 2 Vehicles | 190 (26.4%) | 22 (27.9%) |
| 3 or more Vehicles | 405 (56.2%) | 43 (54.4%) |
| Total | 721 (100.0%) | 79 (100.0%) |
Real Estate & Mortgages in Shadow Lake
Real Estate and Mortgage Overview in Shadow Lake
| Characteristic | Without Mortgage | With Mortgage |
| Housing Units | 237 | 484 |
| Median Property Value | $615,200 | $739,900 |
| Median Household Income | $125,114 | $214 |
| Monthly Housing Costs | $957 | $249 |
| Real Estate Taxes | $6,688 | $7 |
Property Value by Mortgage Status in Shadow Lake
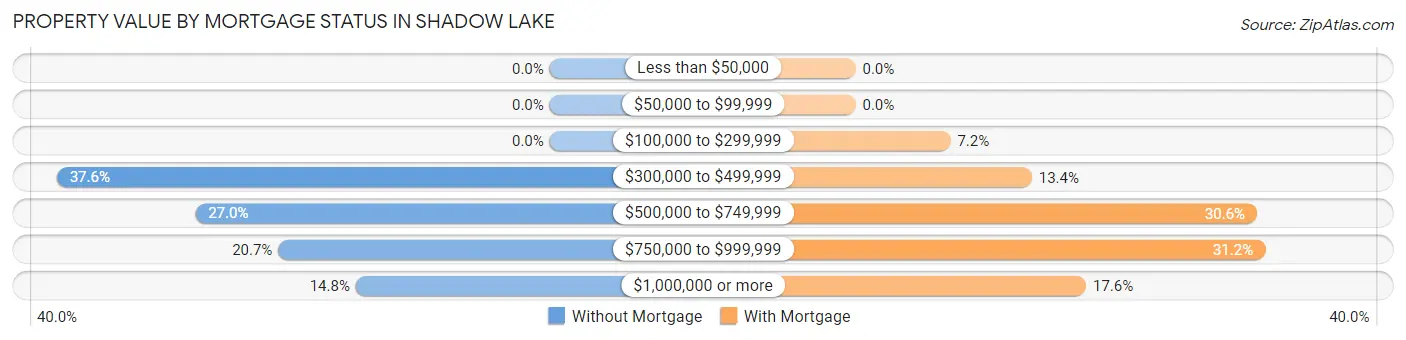
| Property Value | Without Mortgage | With Mortgage |
| Less than $50,000 | 0 (0.0%) | 0 (0.0%) |
| $50,000 to $99,999 | 0 (0.0%) | 0 (0.0%) |
| $100,000 to $299,999 | 0 (0.0%) | 35 (7.2%) |
| $300,000 to $499,999 | 89 (37.6%) | 65 (13.4%) |
| $500,000 to $749,999 | 64 (27.0%) | 148 (30.6%) |
| $750,000 to $999,999 | 49 (20.7%) | 151 (31.2%) |
| $1,000,000 or more | 35 (14.8%) | 85 (17.6%) |
| Total | 237 (100.0%) | 484 (100.0%) |
Household Income by Mortgage Status in Shadow Lake
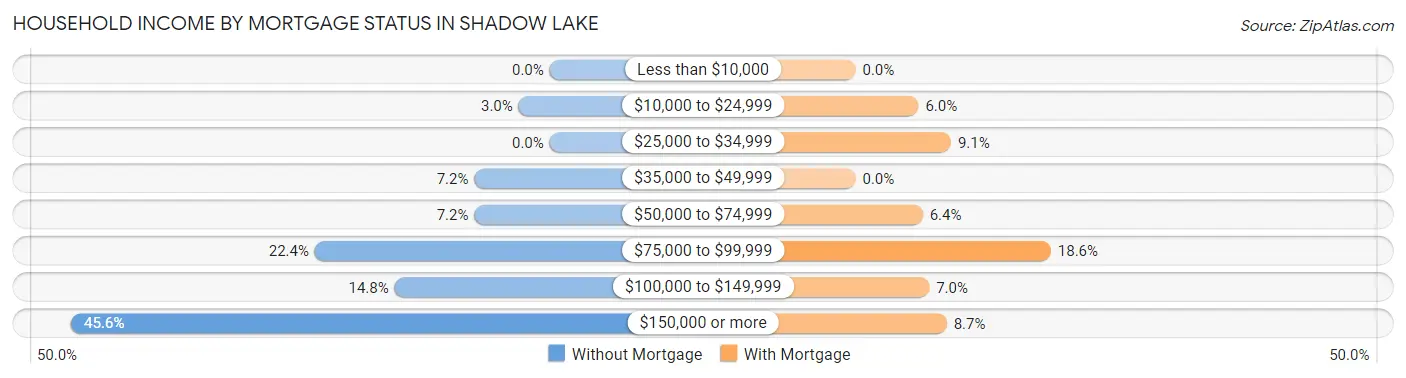
| Household Income | Without Mortgage | With Mortgage |
| Less than $10,000 | 0 (0.0%) | 0 (0.0%) |
| $10,000 to $24,999 | 7 (2.9%) | 29 (6.0%) |
| $25,000 to $34,999 | 0 (0.0%) | 44 (9.1%) |
| $35,000 to $49,999 | 17 (7.2%) | 0 (0.0%) |
| $50,000 to $74,999 | 17 (7.2%) | 31 (6.4%) |
| $75,000 to $99,999 | 53 (22.4%) | 90 (18.6%) |
| $100,000 to $149,999 | 35 (14.8%) | 34 (7.0%) |
| $150,000 or more | 108 (45.6%) | 42 (8.7%) |
| Total | 237 (100.0%) | 484 (100.0%) |
Property Value to Household Income Ratio in Shadow Lake
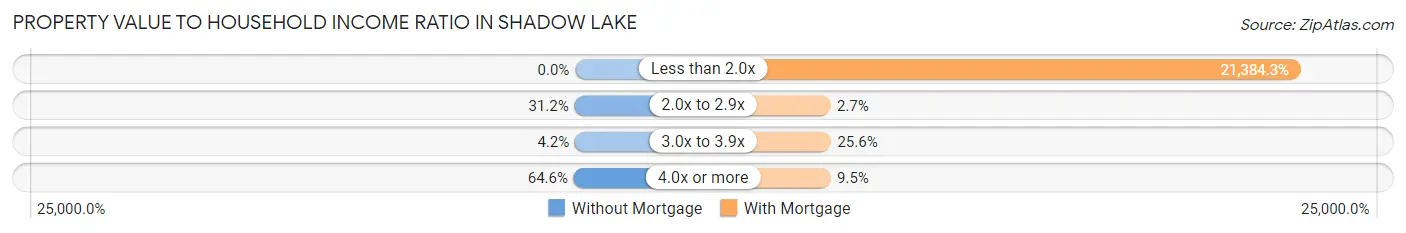
| Value-to-Income Ratio | Without Mortgage | With Mortgage |
| Less than 2.0x | 0 (0.0%) | 103,500 (21,384.3%) |
| 2.0x to 2.9x | 74 (31.2%) | 13 (2.7%) |
| 3.0x to 3.9x | 10 (4.2%) | 124 (25.6%) |
| 4.0x or more | 153 (64.6%) | 46 (9.5%) |
| Total | 237 (100.0%) | 484 (100.0%) |
Real Estate Taxes by Mortgage Status in Shadow Lake
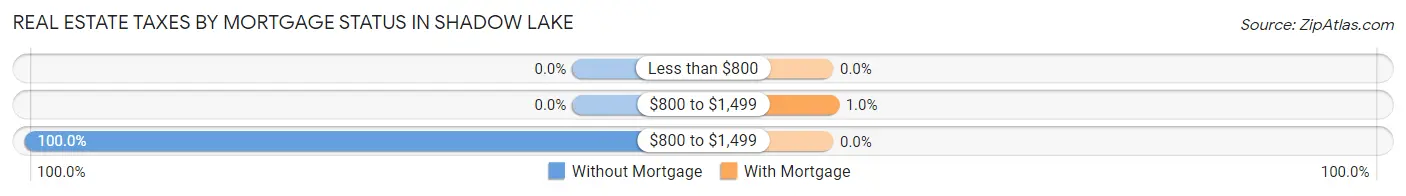
| Property Taxes | Without Mortgage | With Mortgage |
| Less than $800 | 0 (0.0%) | 0 (0.0%) |
| $800 to $1,499 | 0 (0.0%) | 5 (1.0%) |
| $800 to $1,499 | 237 (100.0%) | 0 (0.0%) |
| Total | 237 (100.0%) | 484 (100.0%) |
Health & Disability in Shadow Lake
Health Insurance Coverage by Age in Shadow Lake
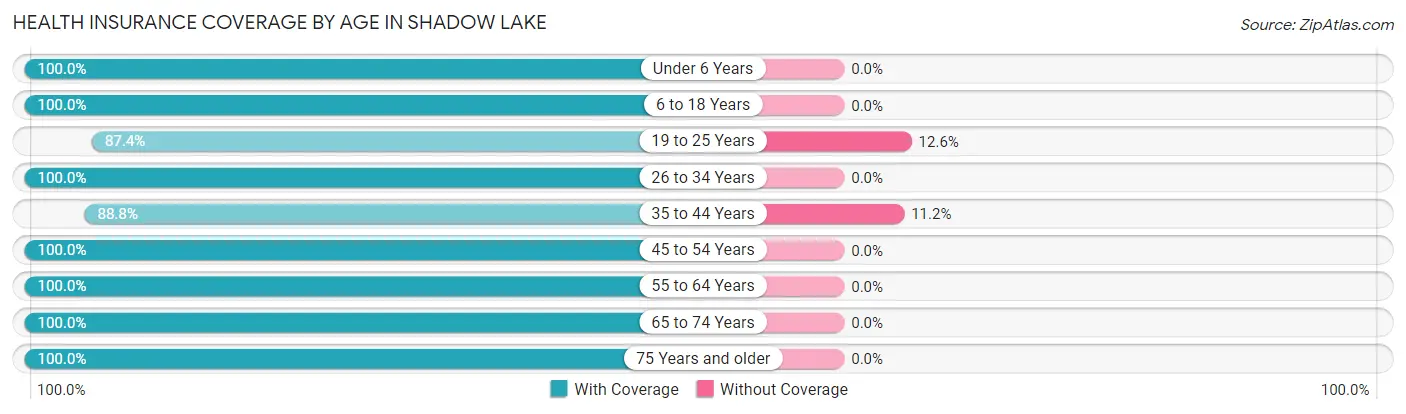
| Age Bracket | With Coverage | Without Coverage |
| Under 6 Years | 57 (100.0%) | 0 (0.0%) |
| 6 to 18 Years | 270 (100.0%) | 0 (0.0%) |
| 19 to 25 Years | 188 (87.4%) | 27 (12.6%) |
| 26 to 34 Years | 151 (100.0%) | 0 (0.0%) |
| 35 to 44 Years | 151 (88.8%) | 19 (11.2%) |
| 45 to 54 Years | 323 (100.0%) | 0 (0.0%) |
| 55 to 64 Years | 428 (100.0%) | 0 (0.0%) |
| 65 to 74 Years | 362 (100.0%) | 0 (0.0%) |
| 75 Years and older | 139 (100.0%) | 0 (0.0%) |
| Total | 2,069 (97.8%) | 46 (2.2%) |
Health Insurance Coverage by Citizenship Status in Shadow Lake
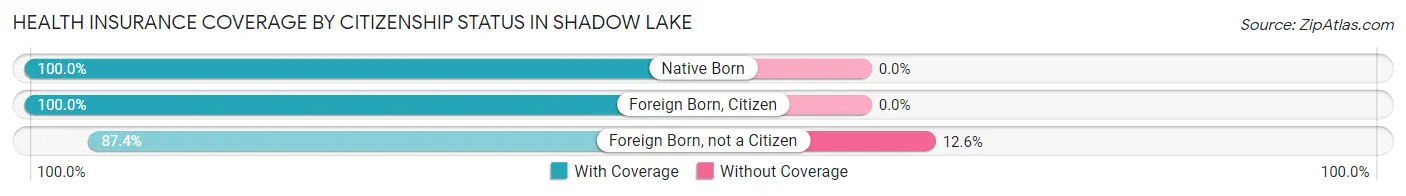
| Citizenship Status | With Coverage | Without Coverage |
| Native Born | 57 (100.0%) | 0 (0.0%) |
| Foreign Born, Citizen | 270 (100.0%) | 0 (0.0%) |
| Foreign Born, not a Citizen | 188 (87.4%) | 27 (12.6%) |
Health Insurance Coverage by Household Income in Shadow Lake
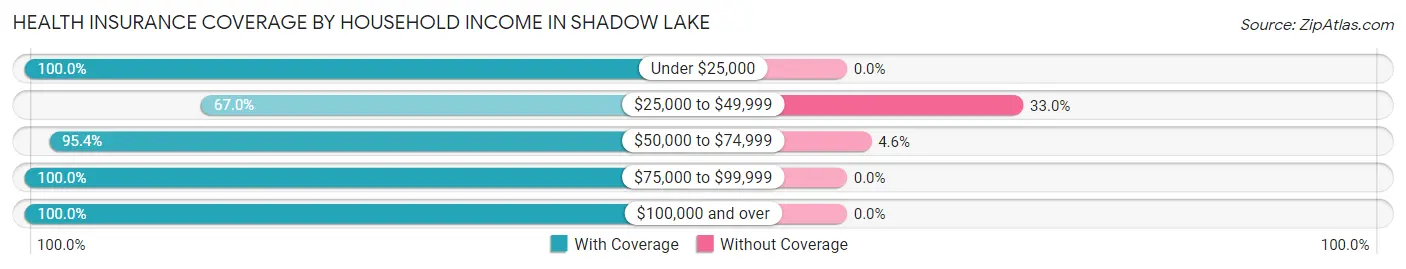
| Household Income | With Coverage | Without Coverage |
| Under $25,000 | 138 (100.0%) | 0 (0.0%) |
| $25,000 to $49,999 | 75 (67.0%) | 37 (33.0%) |
| $50,000 to $74,999 | 188 (95.4%) | 9 (4.6%) |
| $75,000 to $99,999 | 168 (100.0%) | 0 (0.0%) |
| $100,000 and over | 1,500 (100.0%) | 0 (0.0%) |
Public vs Private Health Insurance Coverage by Age in Shadow Lake
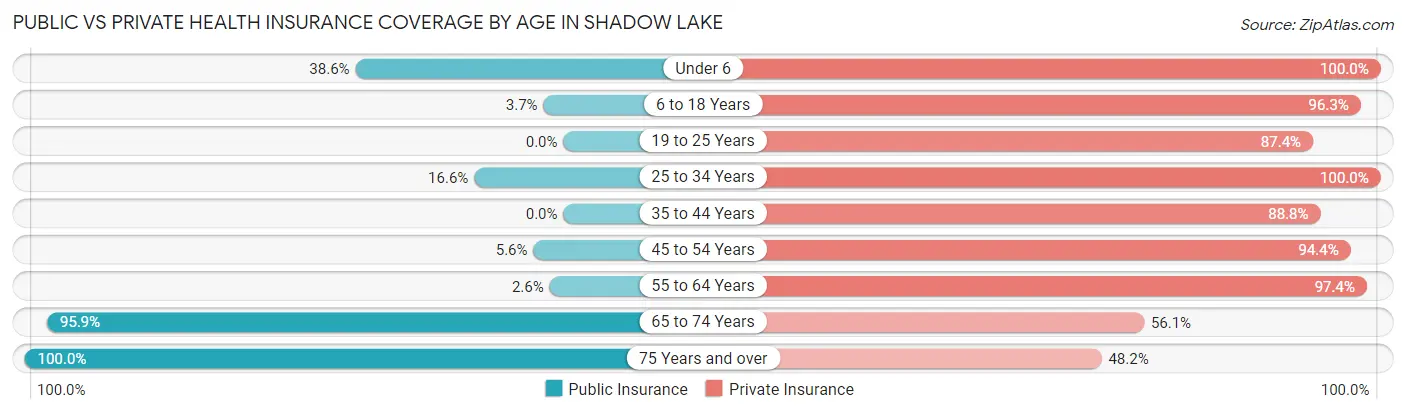
| Age Bracket | Public Insurance | Private Insurance |
| Under 6 | 22 (38.6%) | 57 (100.0%) |
| 6 to 18 Years | 10 (3.7%) | 260 (96.3%) |
| 19 to 25 Years | 0 (0.0%) | 188 (87.4%) |
| 25 to 34 Years | 25 (16.6%) | 151 (100.0%) |
| 35 to 44 Years | 0 (0.0%) | 151 (88.8%) |
| 45 to 54 Years | 18 (5.6%) | 305 (94.4%) |
| 55 to 64 Years | 11 (2.6%) | 417 (97.4%) |
| 65 to 74 Years | 347 (95.9%) | 203 (56.1%) |
| 75 Years and over | 139 (100.0%) | 67 (48.2%) |
| Total | 572 (27.0%) | 1,799 (85.1%) |
Disability Status by Sex by Age in Shadow Lake
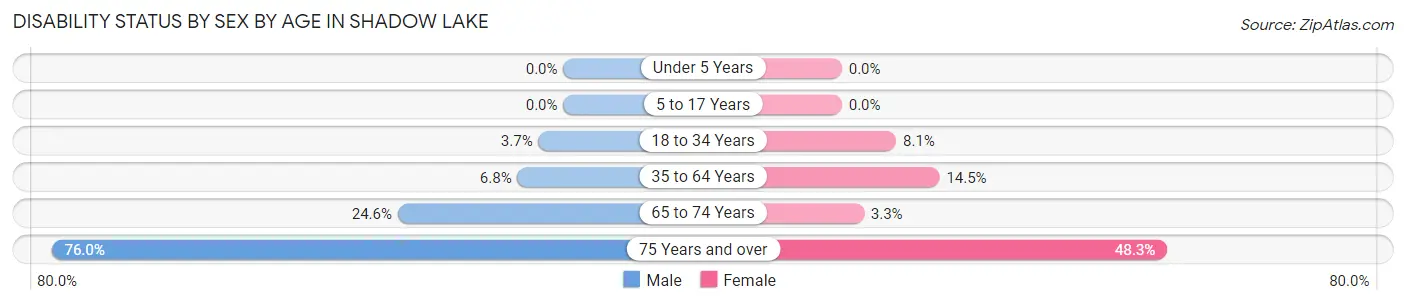
| Age Bracket | Male | Female |
| Under 5 Years | 0 (0.0%) | 0 (0.0%) |
| 5 to 17 Years | 0 (0.0%) | 0 (0.0%) |
| 18 to 34 Years | 10 (3.7%) | 10 (8.1%) |
| 35 to 64 Years | 35 (6.8%) | 59 (14.5%) |
| 65 to 74 Years | 44 (24.6%) | 6 (3.3%) |
| 75 Years and over | 38 (76.0%) | 43 (48.3%) |
Disability Class by Sex by Age in Shadow Lake
Disability Class: Hearing Difficulty
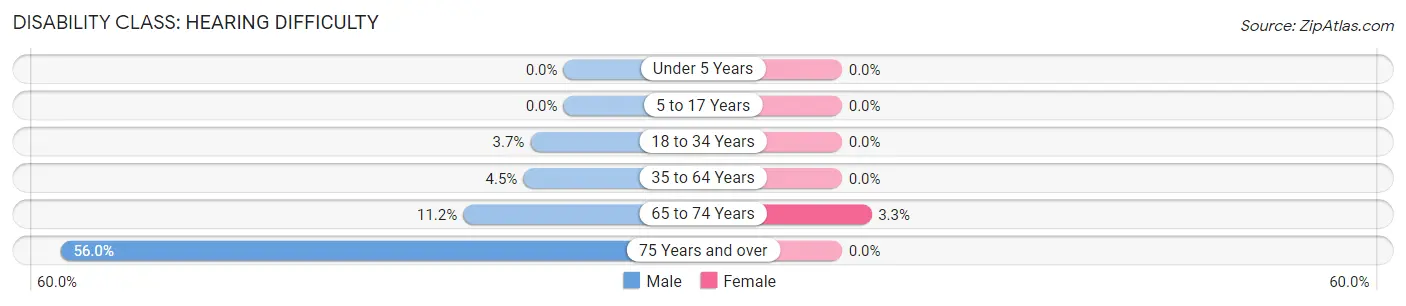
| Age Bracket | Male | Female |
| Under 5 Years | 0 (0.0%) | 0 (0.0%) |
| 5 to 17 Years | 0 (0.0%) | 0 (0.0%) |
| 18 to 34 Years | 10 (3.7%) | 0 (0.0%) |
| 35 to 64 Years | 23 (4.5%) | 0 (0.0%) |
| 65 to 74 Years | 20 (11.2%) | 6 (3.3%) |
| 75 Years and over | 28 (56.0%) | 0 (0.0%) |
Disability Class: Vision Difficulty
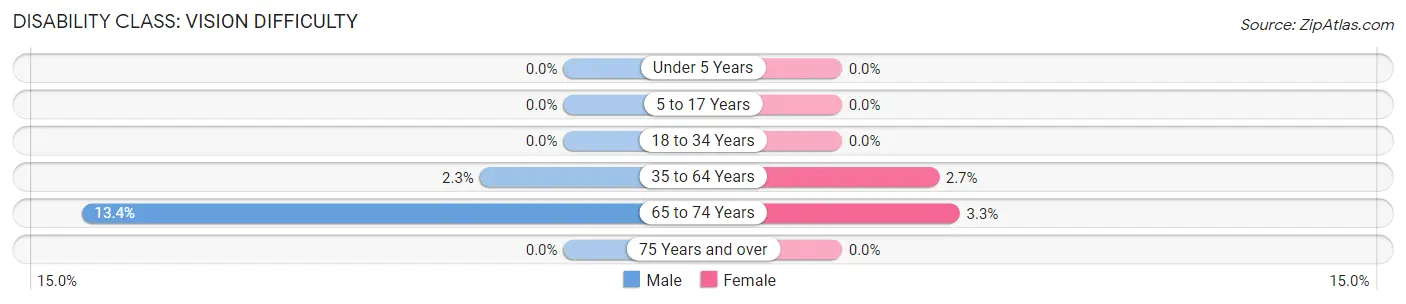
| Age Bracket | Male | Female |
| Under 5 Years | 0 (0.0%) | 0 (0.0%) |
| 5 to 17 Years | 0 (0.0%) | 0 (0.0%) |
| 18 to 34 Years | 0 (0.0%) | 0 (0.0%) |
| 35 to 64 Years | 12 (2.3%) | 11 (2.7%) |
| 65 to 74 Years | 24 (13.4%) | 6 (3.3%) |
| 75 Years and over | 0 (0.0%) | 0 (0.0%) |
Disability Class: Cognitive Difficulty
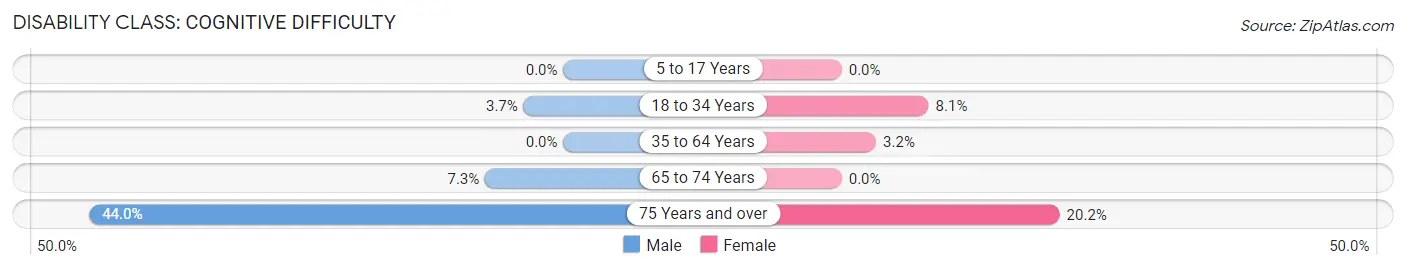
| Age Bracket | Male | Female |
| 5 to 17 Years | 0 (0.0%) | 0 (0.0%) |
| 18 to 34 Years | 10 (3.7%) | 10 (8.1%) |
| 35 to 64 Years | 0 (0.0%) | 13 (3.2%) |
| 65 to 74 Years | 13 (7.3%) | 0 (0.0%) |
| 75 Years and over | 22 (44.0%) | 18 (20.2%) |
Disability Class: Ambulatory Difficulty
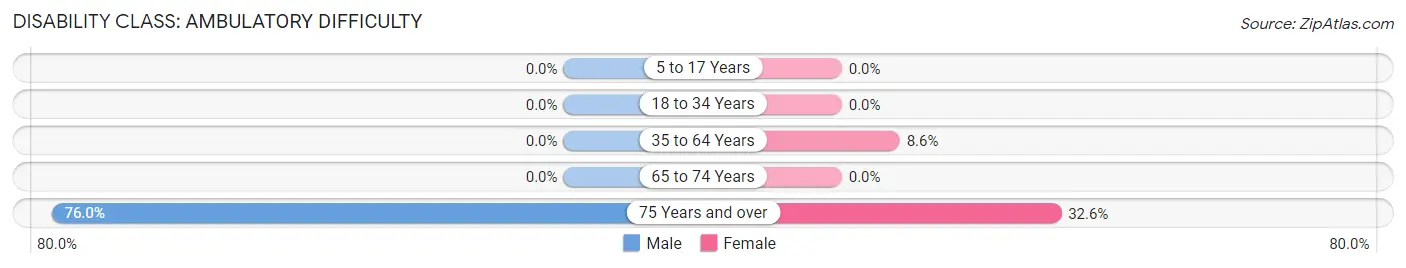
| Age Bracket | Male | Female |
| 5 to 17 Years | 0 (0.0%) | 0 (0.0%) |
| 18 to 34 Years | 0 (0.0%) | 0 (0.0%) |
| 35 to 64 Years | 0 (0.0%) | 35 (8.6%) |
| 65 to 74 Years | 0 (0.0%) | 0 (0.0%) |
| 75 Years and over | 38 (76.0%) | 29 (32.6%) |
Disability Class: Self-Care Difficulty
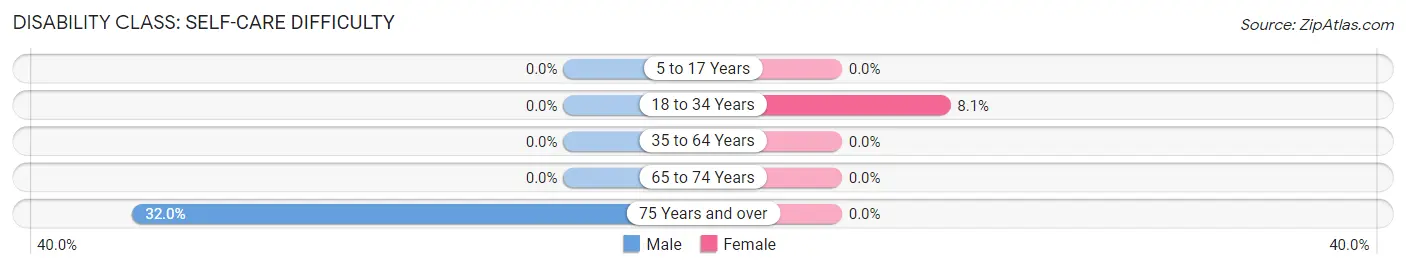
| Age Bracket | Male | Female |
| 5 to 17 Years | 0 (0.0%) | 0 (0.0%) |
| 18 to 34 Years | 0 (0.0%) | 10 (8.1%) |
| 35 to 64 Years | 0 (0.0%) | 0 (0.0%) |
| 65 to 74 Years | 0 (0.0%) | 0 (0.0%) |
| 75 Years and over | 16 (32.0%) | 0 (0.0%) |
Technology Access in Shadow Lake
Computing Device Access in Shadow Lake
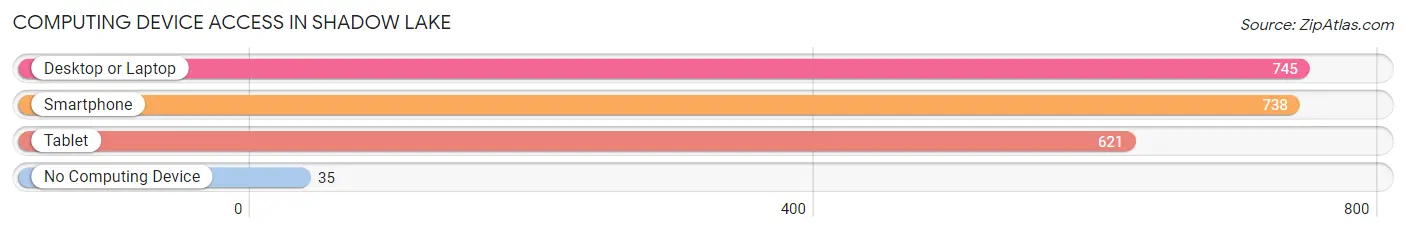
| Device Type | # Households | % Households |
| Desktop or Laptop | 745 | 93.1% |
| Smartphone | 738 | 92.2% |
| Tablet | 621 | 77.6% |
| No Computing Device | 35 | 4.4% |
| Total | 800 | 100.0% |
Internet Access in Shadow Lake
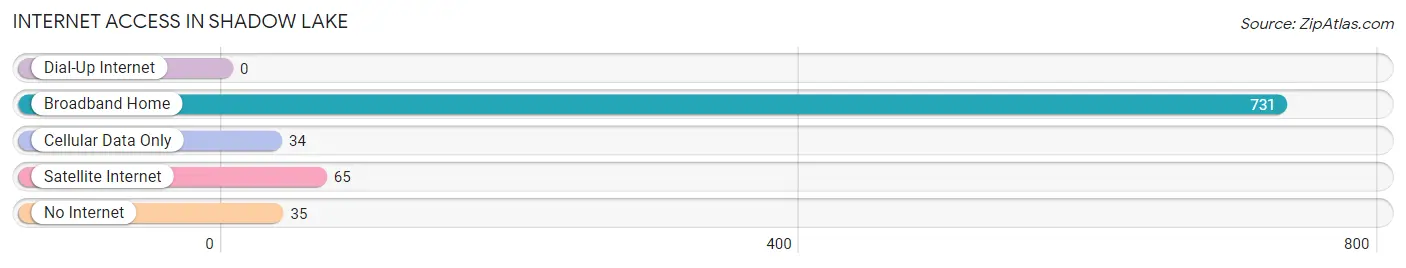
| Internet Type | # Households | % Households |
| Dial-Up Internet | 0 | 0.0% |
| Broadband Home | 731 | 91.4% |
| Cellular Data Only | 34 | 4.3% |
| Satellite Internet | 65 | 8.1% |
| No Internet | 35 | 4.4% |
| Total | 800 | 100.0% |
Shadow Lake Summary
History
Shadow Lake is a small town located in the state of Washington, United States. It is situated in the foothills of the Cascade Mountains, about 25 miles east of Seattle. The town was founded in the late 1800s by a group of settlers who were looking for a place to settle and start a new life. The town was originally called Shadow Lake because of the shadows cast by the surrounding mountains.
The first settlers in Shadow Lake were mostly farmers and loggers. They built small cabins and cleared the land for farming. The town grew slowly but steadily, and by the early 1900s, it had become a thriving community. The town was home to a variety of businesses, including a general store, a blacksmith, a sawmill, and a post office.
In the 1920s, the town began to attract tourists who were drawn to the area’s natural beauty. The town was also home to a number of resorts, which provided visitors with a variety of recreational activities.
In the 1950s, the town began to experience a decline in population as people moved away to larger cities. However, the town was able to maintain its small-town charm and character.
Geography
Shadow Lake is located in the foothills of the Cascade Mountains in Washington State. The town is situated at an elevation of about 1,000 feet above sea level. The town is surrounded by lush forests and rolling hills. The nearby mountains provide a stunning backdrop for the town.
The town is located about 25 miles east of Seattle and is accessible by car or bus. The nearest major airport is Seattle-Tacoma International Airport, which is about an hour away.
The climate in Shadow Lake is mild and temperate. The summers are warm and dry, while the winters are cold and wet. The average temperature in the summer is around 70 degrees Fahrenheit, while the average temperature in the winter is around 40 degrees Fahrenheit.
Economy
The economy of Shadow Lake is largely based on tourism. The town is home to a number of resorts and recreational activities, which attract visitors from all over the world. The town is also home to a number of small businesses, including restaurants, shops, and galleries.
The town is also home to a number of manufacturing companies, which produce a variety of products, including furniture, clothing, and electronics.
Demographics
As of the 2010 census, the population of Shadow Lake was 1,845. The town is predominantly white, with about 90% of the population being Caucasian. The remaining 10% of the population is made up of African Americans, Asians, and Hispanics.
The median household income in Shadow Lake is $50,000, which is slightly higher than the national average. The town has a low unemployment rate of about 4%.
Conclusion
Shadow Lake is a small town located in the foothills of the Cascade Mountains in Washington State. The town was founded in the late 1800s by a group of settlers and has since grown into a thriving community. The town is home to a variety of businesses and is a popular tourist destination. The town has a mild climate and a population of about 1,845 people. The economy of Shadow Lake is largely based on tourism and small businesses.
Common Questions
What is Per Capita Income in Shadow Lake?
Per Capita income in Shadow Lake is $53,340.
What is the Median Family Income in Shadow Lake?
Median Family Income in Shadow Lake is $168,750.
What is the Median Household income in Shadow Lake?
Median Household Income in Shadow Lake is $104,286.
What is Income or Wage Gap in Shadow Lake?
Income or Wage Gap in Shadow Lake is 9.3%.
Women in Shadow Lake earn 90.7 cents for every dollar earned by a man.
What is Inequality or Gini Index in Shadow Lake?
Inequality or Gini Index in Shadow Lake is 0.44.
What is the Total Population of Shadow Lake?
Total Population of Shadow Lake is 2,115.
What is the Total Male Population of Shadow Lake?
Total Male Population of Shadow Lake is 1,176.
What is the Total Female Population of Shadow Lake?
Total Female Population of Shadow Lake is 939.
What is the Ratio of Males per 100 Females in Shadow Lake?
There are 125.24 Males per 100 Females in Shadow Lake.
What is the Ratio of Females per 100 Males in Shadow Lake?
There are 79.85 Females per 100 Males in Shadow Lake.
What is the Median Population Age in Shadow Lake?
Median Population Age in Shadow Lake is 51.2 Years.
What is the Average Family Size in Shadow Lake
Average Family Size in Shadow Lake is 3.2 People.
What is the Average Household Size in Shadow Lake
Average Household Size in Shadow Lake is 2.6 People.
How Large is the Labor Force in Shadow Lake?
There are 1,214 People in the Labor Forcein in Shadow Lake.
What is the Percentage of People in the Labor Force in Shadow Lake?
66.0% of People are in the Labor Force in Shadow Lake.
What is the Unemployment Rate in Shadow Lake?
Unemployment Rate in Shadow Lake is 7.2%.