Seabeck, WA Map & Demographics
Seabeck Map
Seabeck Overview
$64,457
PER CAPITA INCOME
$122,321
AVG FAMILY INCOME
$109,125
AVG HOUSEHOLD INCOME
47.4%
WAGE / INCOME GAP [ % ]
52.6¢/ $1
WAGE / INCOME GAP [ $ ]
0.50
INEQUALITY / GINI INDEX
898
TOTAL POPULATION
487
MALE POPULATION
411
FEMALE POPULATION
118.49
MALES / 100 FEMALES
84.39
FEMALES / 100 MALES
48.5
MEDIAN AGE
2.6
AVG FAMILY SIZE
2.3
AVG HOUSEHOLD SIZE
455
LABOR FORCE [ PEOPLE ]
58.8%
PERCENT IN LABOR FORCE
14.9%
UNEMPLOYMENT RATE
Seabeck Zip Codes
Seabeck Area Codes
Income in Seabeck
Income Overview in Seabeck
Per Capita Income in Seabeck is $64,457, while median incomes of families and households are $122,321 and $109,125 respectively.
| Characteristic | Number | Measure |
| Per Capita Income | 898 | $64,457 |
| Median Family Income | 268 | $122,321 |
| Mean Family Income | 268 | $161,503 |
| Median Household Income | 395 | $109,125 |
| Mean Household Income | 395 | $139,666 |
| Income Deficit | 268 | $0 |
| Wage / Income Gap (%) | 898 | 47.41% |
| Wage / Income Gap ($) | 898 | 52.59¢ per $1 |
| Gini / Inequality Index | 898 | 0.50 |
Earnings by Sex in Seabeck
Average Earnings in Seabeck are $53,802, $85,404 for men and $44,917 for women, a difference of 47.4%.

| Sex | Number | Average Earnings |
| Male | 291 (60.8%) | $85,404 |
| Female | 188 (39.3%) | $44,917 |
| Total | 479 (100.0%) | $53,802 |
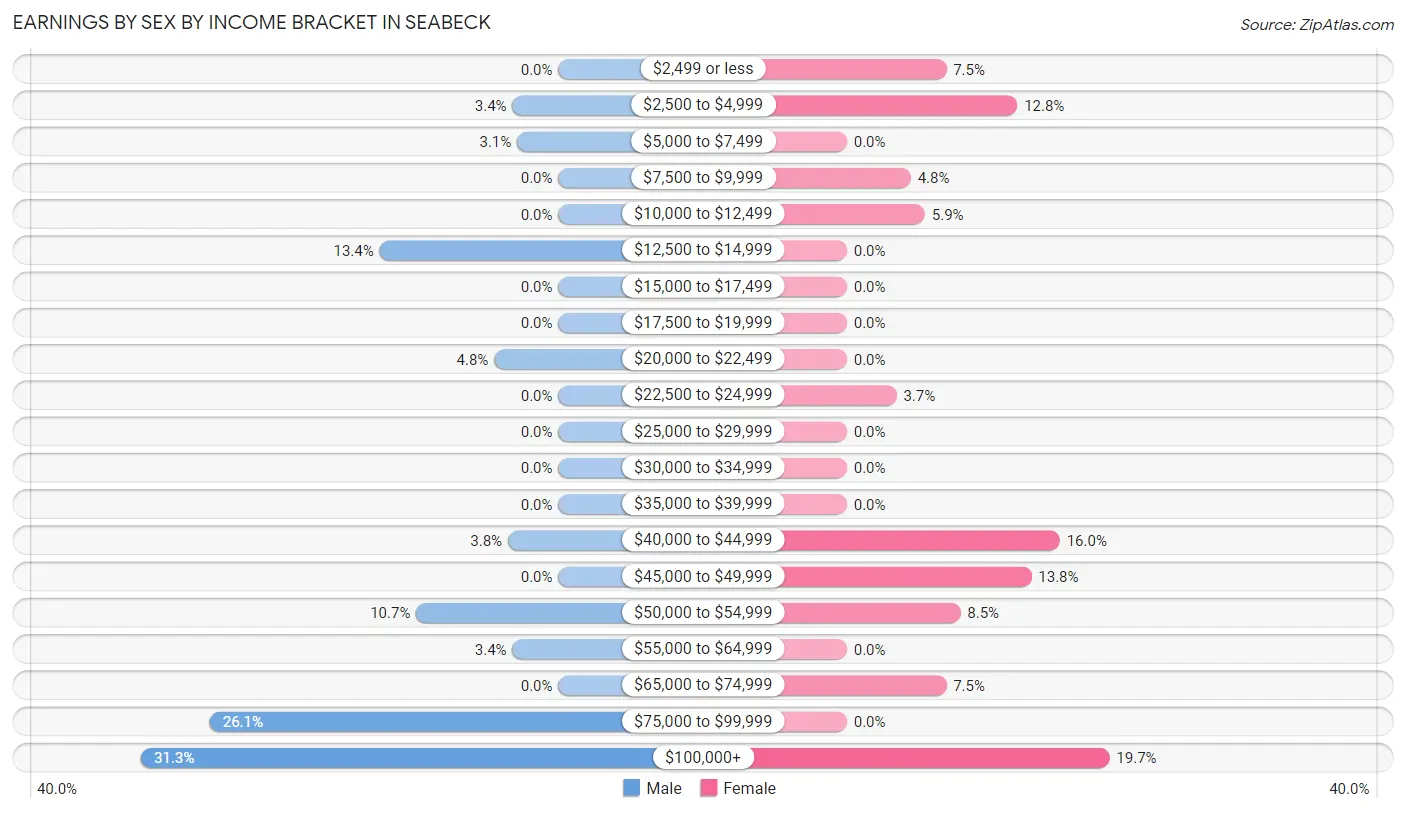
Earnings by Sex by Income Bracket in Seabeck
The most common earnings brackets in Seabeck are $100,000+ for men (91 | 31.3%) and $100,000+ for women (37 | 19.7%).
| Income | Male | Female |
| $2,499 or less | 0 (0.0%) | 14 (7.4%) |
| $2,500 to $4,999 | 10 (3.4%) | 24 (12.8%) |
| $5,000 to $7,499 | 9 (3.1%) | 0 (0.0%) |
| $7,500 to $9,999 | 0 (0.0%) | 9 (4.8%) |
| $10,000 to $12,499 | 0 (0.0%) | 11 (5.9%) |
| $12,500 to $14,999 | 39 (13.4%) | 0 (0.0%) |
| $15,000 to $17,499 | 0 (0.0%) | 0 (0.0%) |
| $17,500 to $19,999 | 0 (0.0%) | 0 (0.0%) |
| $20,000 to $22,499 | 14 (4.8%) | 0 (0.0%) |
| $22,500 to $24,999 | 0 (0.0%) | 7 (3.7%) |
| $25,000 to $29,999 | 0 (0.0%) | 0 (0.0%) |
| $30,000 to $34,999 | 0 (0.0%) | 0 (0.0%) |
| $35,000 to $39,999 | 0 (0.0%) | 0 (0.0%) |
| $40,000 to $44,999 | 11 (3.8%) | 30 (16.0%) |
| $45,000 to $49,999 | 0 (0.0%) | 26 (13.8%) |
| $50,000 to $54,999 | 31 (10.6%) | 16 (8.5%) |
| $55,000 to $64,999 | 10 (3.4%) | 0 (0.0%) |
| $65,000 to $74,999 | 0 (0.0%) | 14 (7.4%) |
| $75,000 to $99,999 | 76 (26.1%) | 0 (0.0%) |
| $100,000+ | 91 (31.3%) | 37 (19.7%) |
| Total | 291 (100.0%) | 188 (100.0%) |
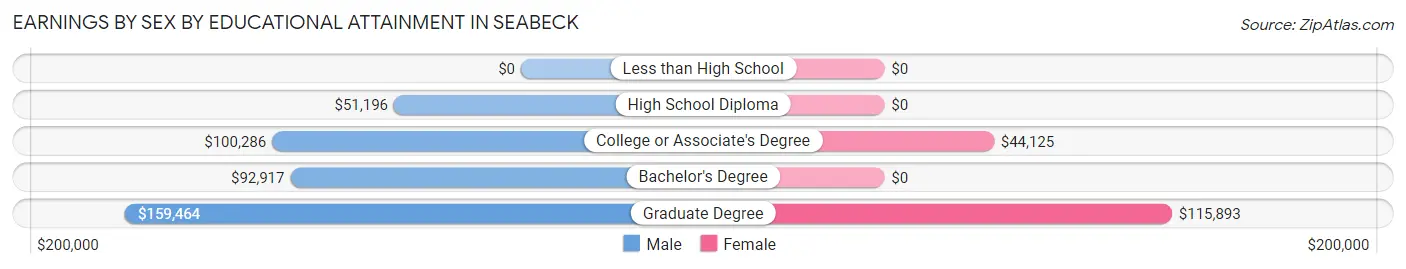
Earnings by Sex by Educational Attainment in Seabeck
Average earnings in Seabeck are $86,544 for men and $46,641 for women, a difference of 46.1%. Men with an educational attainment of graduate degree enjoy the highest average annual earnings of $159,464, while those with high school diploma education earn the least with $51,196. Women with an educational attainment of graduate degree earn the most with the average annual earnings of $115,893, while those with college or associate's degree education have the smallest earnings of $44,125.
| Educational Attainment | Male Income | Female Income |
| Less than High School | - | - |
| High School Diploma | $51,196 | $0 |
| College or Associate's Degree | $100,286 | $44,125 |
| Bachelor's Degree | $92,917 | $0 |
| Graduate Degree | $159,464 | $115,893 |
| Total | $86,544 | $46,641 |
Family Income in Seabeck
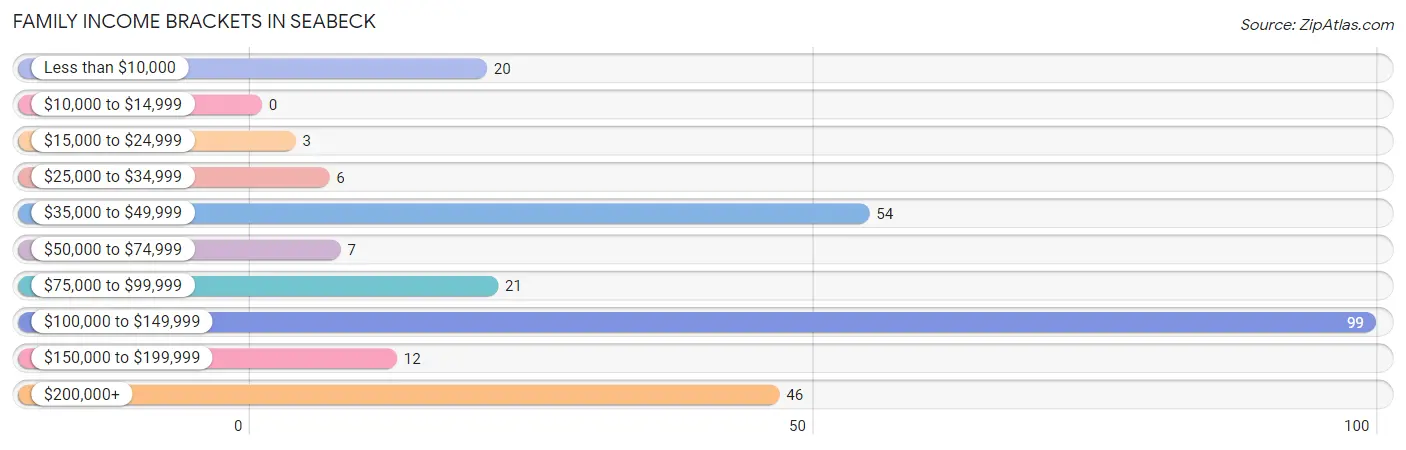
Family Income Brackets in Seabeck
According to the Seabeck family income data, there are 99 families falling into the $100,000 to $149,999 income range, which is the most common income bracket and makes up 36.9% of all families.
| Income Bracket | # Families | % Families |
| Less than $10,000 | 20 | 7.5% |
| $10,000 to $14,999 | 0 | 0.0% |
| $15,000 to $24,999 | 3 | 1.1% |
| $25,000 to $34,999 | 6 | 2.2% |
| $35,000 to $49,999 | 54 | 20.1% |
| $50,000 to $74,999 | 7 | 2.6% |
| $75,000 to $99,999 | 21 | 7.8% |
| $100,000 to $149,999 | 99 | 36.9% |
| $150,000 to $199,999 | 12 | 4.5% |
| $200,000+ | 46 | 17.2% |
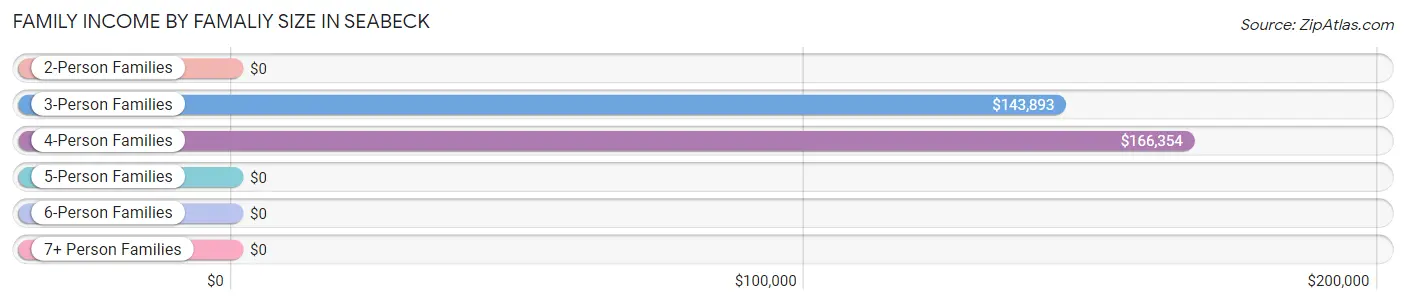
Family Income by Famaliy Size in Seabeck
4-person families (41 | 15.3%) account for the highest median family income in Seabeck with $166,354 per family, while 3-person families (45 | 16.8%) have the highest median income of $47,964 per family member.
| Income Bracket | # Families | Median Income |
| 2-Person Families | 170 (63.4%) | $0 |
| 3-Person Families | 45 (16.8%) | $143,893 |
| 4-Person Families | 41 (15.3%) | $166,354 |
| 5-Person Families | 12 (4.5%) | $0 |
| 6-Person Families | 0 (0.0%) | $0 |
| 7+ Person Families | 0 (0.0%) | $0 |
| Total | 268 (100.0%) | $122,321 |
Family Income by Number of Earners in Seabeck
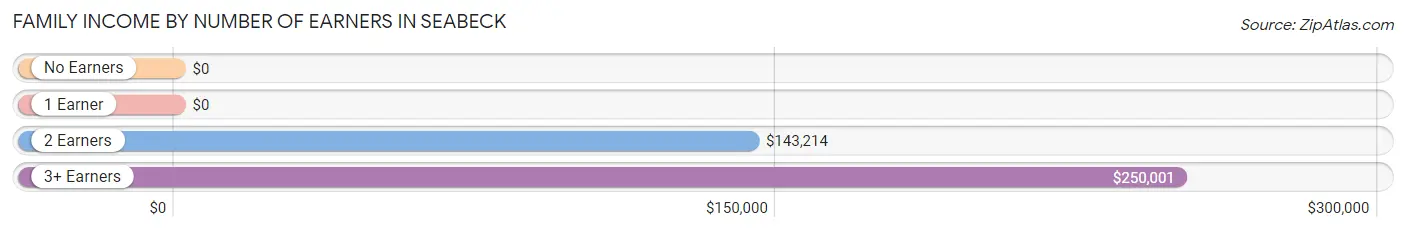
| Number of Earners | # Families | Median Income |
| No Earners | 54 (20.2%) | $0 |
| 1 Earner | 118 (44.0%) | $0 |
| 2 Earners | 62 (23.1%) | $143,214 |
| 3+ Earners | 34 (12.7%) | $250,001 |
| Total | 268 (100.0%) | $122,321 |
Household Income in Seabeck
Household Income Brackets in Seabeck
With 109 households falling in the category, the $100,000 to $149,999 income range is the most frequent in Seabeck, accounting for 27.6% of all households.
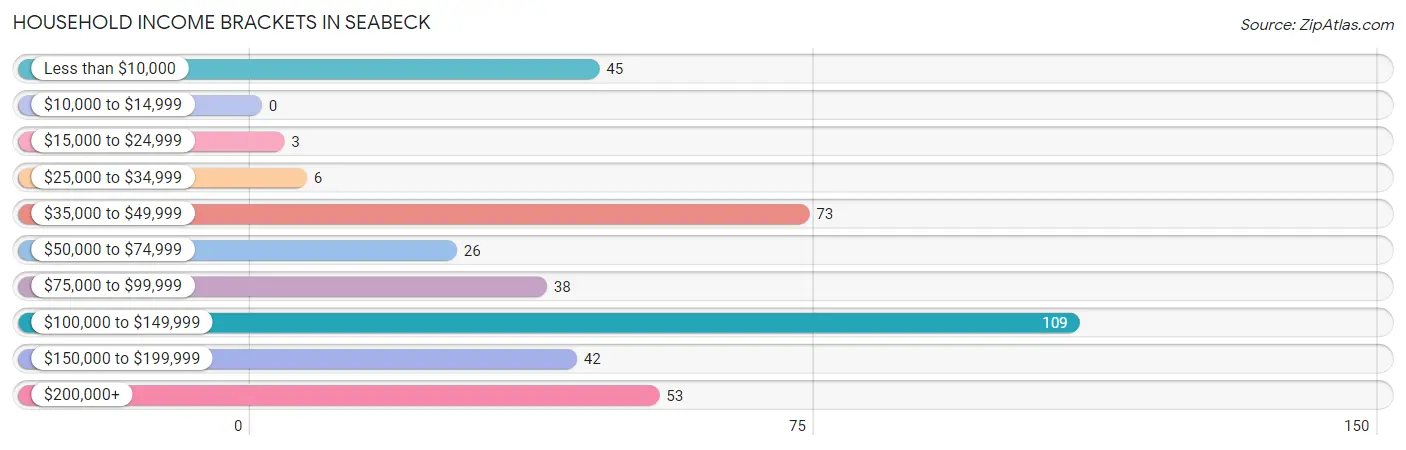
| Income Bracket | # Households | % Households |
| Less than $10,000 | 45 | 11.4% |
| $10,000 to $14,999 | 0 | 0.0% |
| $15,000 to $24,999 | 3 | 0.8% |
| $25,000 to $34,999 | 6 | 1.5% |
| $35,000 to $49,999 | 73 | 18.5% |
| $50,000 to $74,999 | 26 | 6.6% |
| $75,000 to $99,999 | 38 | 9.6% |
| $100,000 to $149,999 | 109 | 27.6% |
| $150,000 to $199,999 | 42 | 10.6% |
| $200,000+ | 53 | 13.4% |
Household Income by Householder Age in Seabeck
The median household income in Seabeck is $109,125, with the highest median household income of $148,015 found in the 45 to 64 years age bracket for the primary householder. A total of 157 households (39.8%) fall into this category.
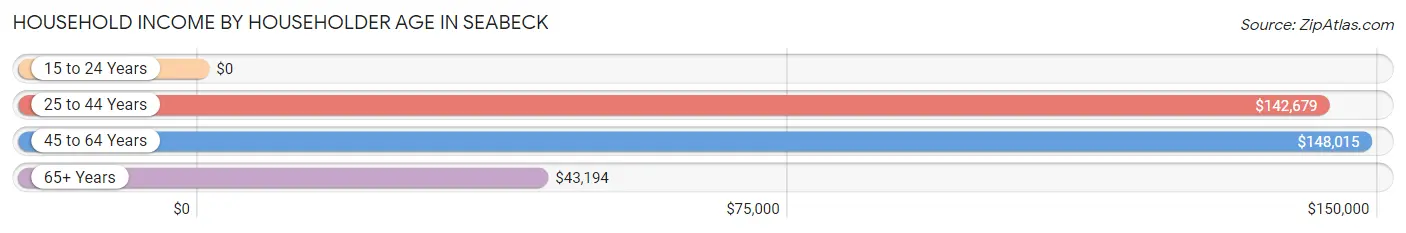
| Income Bracket | # Households | Median Income |
| 15 to 24 Years | 0 (0.0%) | $0 |
| 25 to 44 Years | 125 (31.7%) | $142,679 |
| 45 to 64 Years | 157 (39.8%) | $148,015 |
| 65+ Years | 113 (28.6%) | $43,194 |
| Total | 395 (100.0%) | $109,125 |
Poverty in Seabeck
Income Below Poverty by Sex and Age in Seabeck
With 11.9% poverty level for males and 9.0% for females among the residents of Seabeck, 65 to 74 year old males and 18 to 24 year old females are the most vulnerable to poverty, with 16 males (33.3%) and 7 females (100.0%) in their respective age groups living below the poverty level.
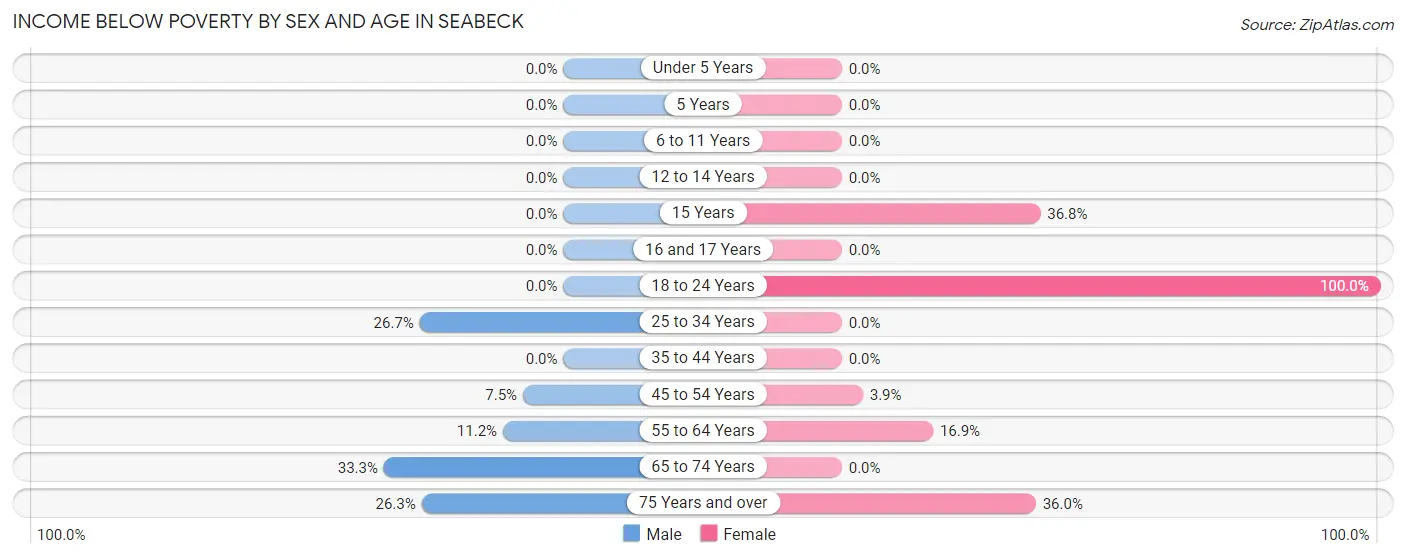
| Age Bracket | Male | Female |
| Under 5 Years | 0 (0.0%) | 0 (0.0%) |
| 5 Years | 0 (0.0%) | 0 (0.0%) |
| 6 to 11 Years | 0 (0.0%) | 0 (0.0%) |
| 12 to 14 Years | 0 (0.0%) | 0 (0.0%) |
| 15 Years | 0 (0.0%) | 7 (36.8%) |
| 16 and 17 Years | 0 (0.0%) | 0 (0.0%) |
| 18 to 24 Years | 0 (0.0%) | 7 (100.0%) |
| 25 to 34 Years | 12 (26.7%) | 0 (0.0%) |
| 35 to 44 Years | 0 (0.0%) | 0 (0.0%) |
| 45 to 54 Years | 9 (7.5%) | 3 (3.9%) |
| 55 to 64 Years | 11 (11.2%) | 11 (16.9%) |
| 65 to 74 Years | 16 (33.3%) | 0 (0.0%) |
| 75 Years and over | 10 (26.3%) | 9 (36.0%) |
| Total | 58 (11.9%) | 37 (9.0%) |
Income Above Poverty by Sex and Age in Seabeck
According to the poverty statistics in Seabeck, males aged under 5 years and females aged under 5 years are the age groups that are most secure financially, with 100.0% of males and 100.0% of females in these age groups living above the poverty line.
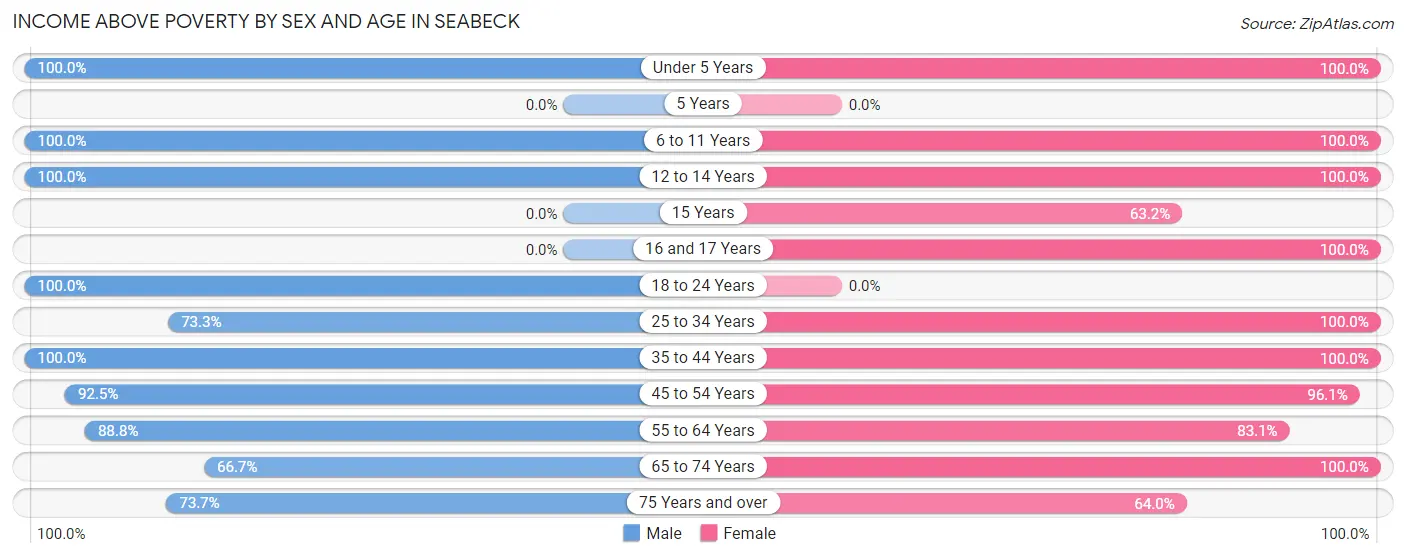
| Age Bracket | Male | Female |
| Under 5 Years | 20 (100.0%) | 15 (100.0%) |
| 5 Years | 0 (0.0%) | 0 (0.0%) |
| 6 to 11 Years | 13 (100.0%) | 14 (100.0%) |
| 12 to 14 Years | 11 (100.0%) | 32 (100.0%) |
| 15 Years | 0 (0.0%) | 12 (63.2%) |
| 16 and 17 Years | 0 (0.0%) | 30 (100.0%) |
| 18 to 24 Years | 43 (100.0%) | 0 (0.0%) |
| 25 to 34 Years | 33 (73.3%) | 46 (100.0%) |
| 35 to 44 Years | 51 (100.0%) | 34 (100.0%) |
| 45 to 54 Years | 111 (92.5%) | 74 (96.1%) |
| 55 to 64 Years | 87 (88.8%) | 54 (83.1%) |
| 65 to 74 Years | 32 (66.7%) | 47 (100.0%) |
| 75 Years and over | 28 (73.7%) | 16 (64.0%) |
| Total | 429 (88.1%) | 374 (91.0%) |
Income Below Poverty Among Married-Couple Families in Seabeck
The poverty statistics for married-couple families in Seabeck show that 10.9% or 20 of the total 184 families live below the poverty line. Families with no children have the highest poverty rate of 15.3%, comprising of 20 families. On the other hand, families with 1 or 2 children have the lowest poverty rate of 0.0%, which includes 0 families.
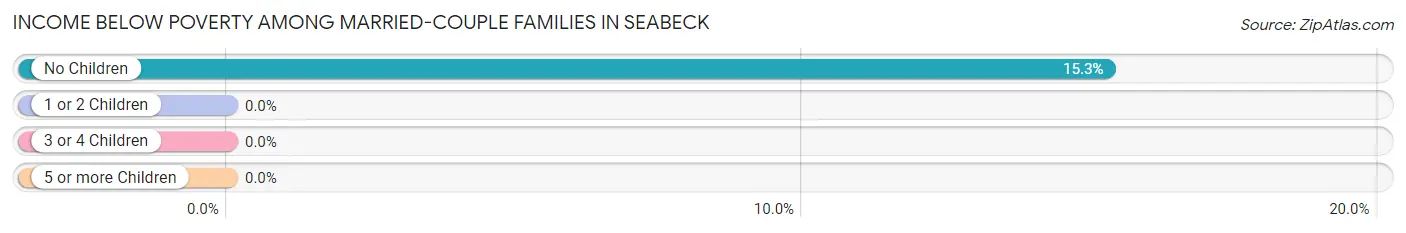
| Children | Above Poverty | Below Poverty |
| No Children | 111 (84.7%) | 20 (15.3%) |
| 1 or 2 Children | 53 (100.0%) | 0 (0.0%) |
| 3 or 4 Children | 0 (0.0%) | 0 (0.0%) |
| 5 or more Children | 0 (0.0%) | 0 (0.0%) |
| Total | 164 (89.1%) | 20 (10.9%) |
Income Below Poverty Among Single-Parent Households in Seabeck
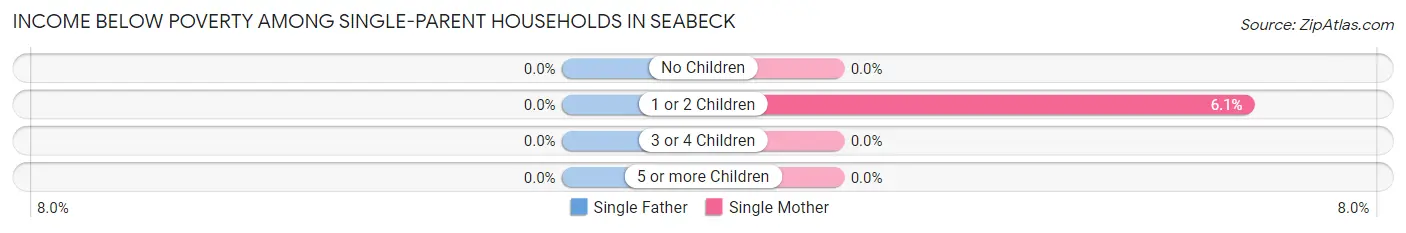
| Children | Single Father | Single Mother |
| No Children | 0 (0.0%) | 0 (0.0%) |
| 1 or 2 Children | 0 (0.0%) | 3 (6.1%) |
| 3 or 4 Children | 0 (0.0%) | 0 (0.0%) |
| 5 or more Children | 0 (0.0%) | 0 (0.0%) |
| Total | 0 (0.0%) | 3 (6.1%) |
Income Below Poverty Among Married-Couple vs Single-Parent Households in Seabeck
The poverty data for Seabeck shows that 20 of the married-couple family households (10.9%) and 3 of the single-parent households (3.6%) are living below the poverty level. Within the married-couple family households, those with no children have the highest poverty rate, with 20 households (15.3%) falling below the poverty line. Among the single-parent households, those with 1 or 2 children have the highest poverty rate, with 3 household (3.6%) living below poverty.
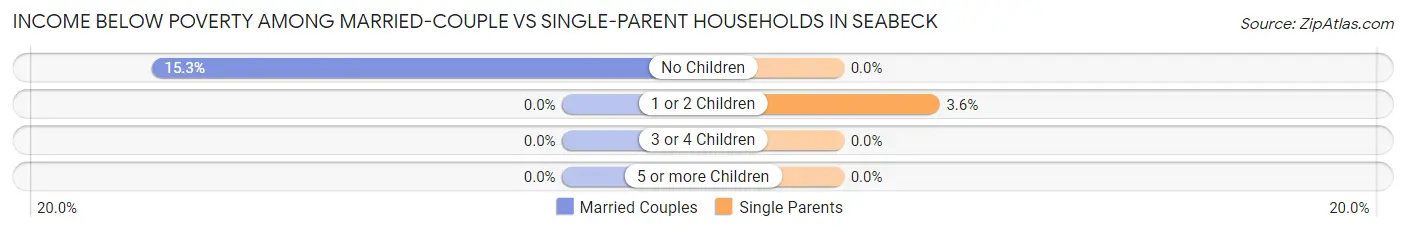
| Children | Married-Couple Families | Single-Parent Households |
| No Children | 20 (15.3%) | 0 (0.0%) |
| 1 or 2 Children | 0 (0.0%) | 3 (3.6%) |
| 3 or 4 Children | 0 (0.0%) | 0 (0.0%) |
| 5 or more Children | 0 (0.0%) | 0 (0.0%) |
| Total | 20 (10.9%) | 3 (3.6%) |
Race in Seabeck
The most populous races in Seabeck are White / Caucasian (670 | 74.6%), Hispanic or Latino (217 | 24.2%), and Two or more Races (175 | 19.5%).
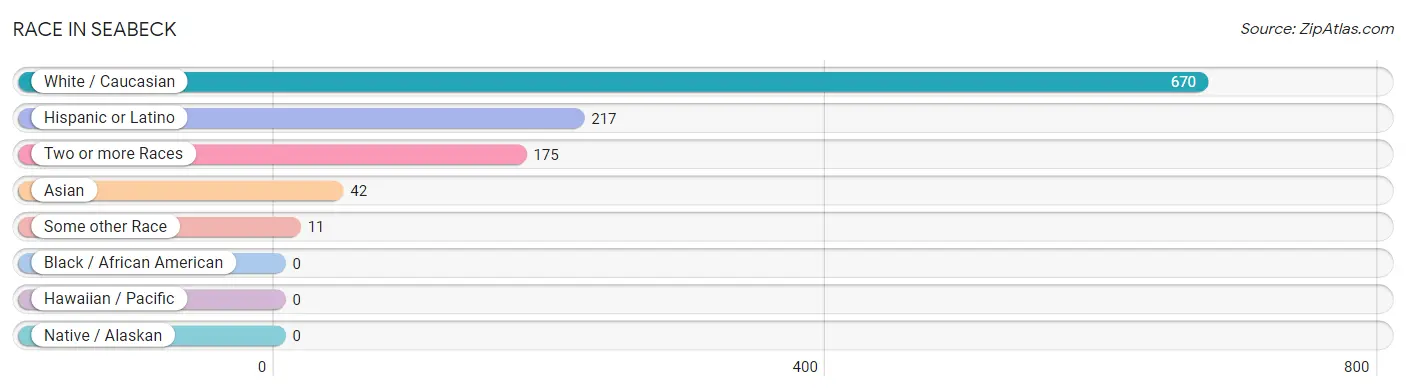
| Race | # Population | % Population |
| Asian | 42 | 4.7% |
| Black / African American | 0 | 0.0% |
| Hawaiian / Pacific | 0 | 0.0% |
| Hispanic or Latino | 217 | 24.2% |
| Native / Alaskan | 0 | 0.0% |
| White / Caucasian | 670 | 74.6% |
| Two or more Races | 175 | 19.5% |
| Some other Race | 11 | 1.2% |
| Total | 898 | 100.0% |
Ancestry in Seabeck
The most populous ancestries reported in Seabeck are German (243 | 27.1%), Mexican (118 | 13.1%), Irish (94 | 10.5%), Norwegian (94 | 10.5%), and English (92 | 10.2%), together accounting for 71.4% of all Seabeck residents.
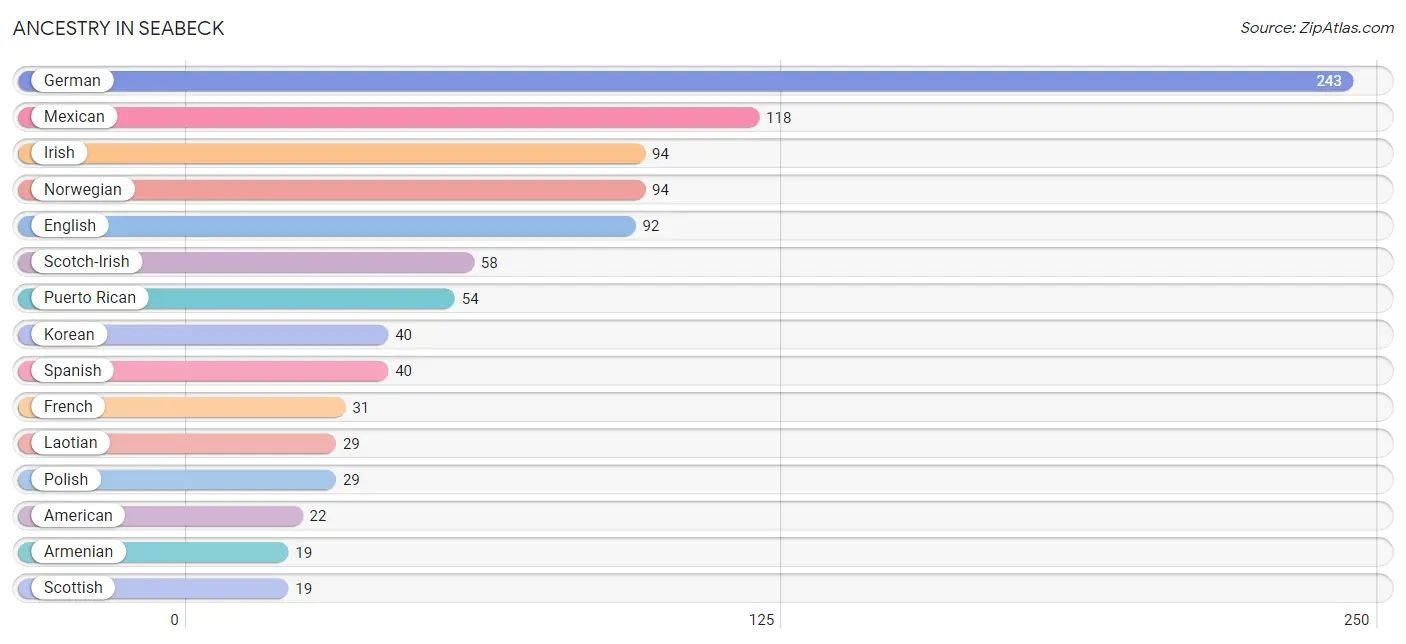
| Ancestry | # Population | % Population |
| American | 22 | 2.5% |
| Armenian | 19 | 2.1% |
| Bhutanese | 17 | 1.9% |
| British | 9 | 1.0% |
| Danish | 7 | 0.8% |
| Dutch | 11 | 1.2% |
| English | 92 | 10.2% |
| European | 14 | 1.6% |
| French | 31 | 3.5% |
| French Canadian | 12 | 1.3% |
| German | 243 | 27.1% |
| Hungarian | 7 | 0.8% |
| Irish | 94 | 10.5% |
| Korean | 40 | 4.4% |
| Laotian | 29 | 3.2% |
| Mexican | 118 | 13.1% |
| Norwegian | 94 | 10.5% |
| Polish | 29 | 3.2% |
| Puerto Rican | 54 | 6.0% |
| Russian | 9 | 1.0% |
| Scotch-Irish | 58 | 6.5% |
| Scottish | 19 | 2.1% |
| Spaniard | 5 | 0.6% |
| Spanish | 40 | 4.4% |
| Swedish | 9 | 1.0% |
| Welsh | 19 | 2.1% | View All 26 Rows |
Immigrants in Seabeck
The most numerous immigrant groups reported in Seabeck came from Central America (33 | 3.7%), Latin America (33 | 3.7%), Mexico (33 | 3.7%), Asia (28 | 3.1%), and South Eastern Asia (25 | 2.8%), together accounting for 16.9% of all Seabeck residents.
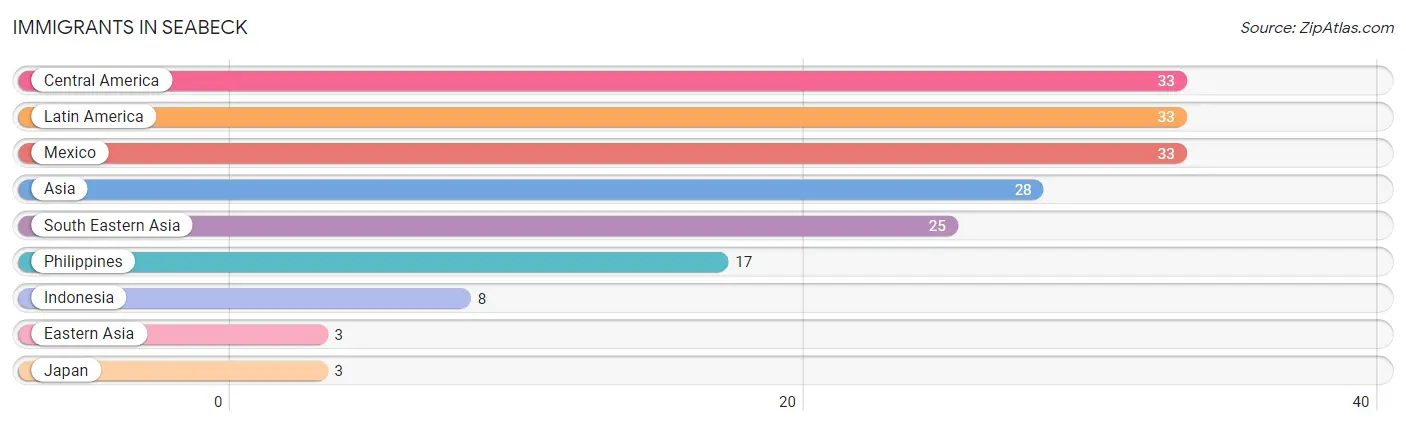
| Immigration Origin | # Population | % Population |
| Asia | 28 | 3.1% |
| Central America | 33 | 3.7% |
| Eastern Asia | 3 | 0.3% |
| Indonesia | 8 | 0.9% |
| Japan | 3 | 0.3% |
| Latin America | 33 | 3.7% |
| Mexico | 33 | 3.7% |
| Philippines | 17 | 1.9% |
| South Eastern Asia | 25 | 2.8% | View All 9 Rows |
Sex and Age in Seabeck
Sex and Age in Seabeck
The most populous age groups in Seabeck are 50 to 54 Years (79 | 16.2%) for men and 45 to 49 Years (51 | 12.4%) for women.
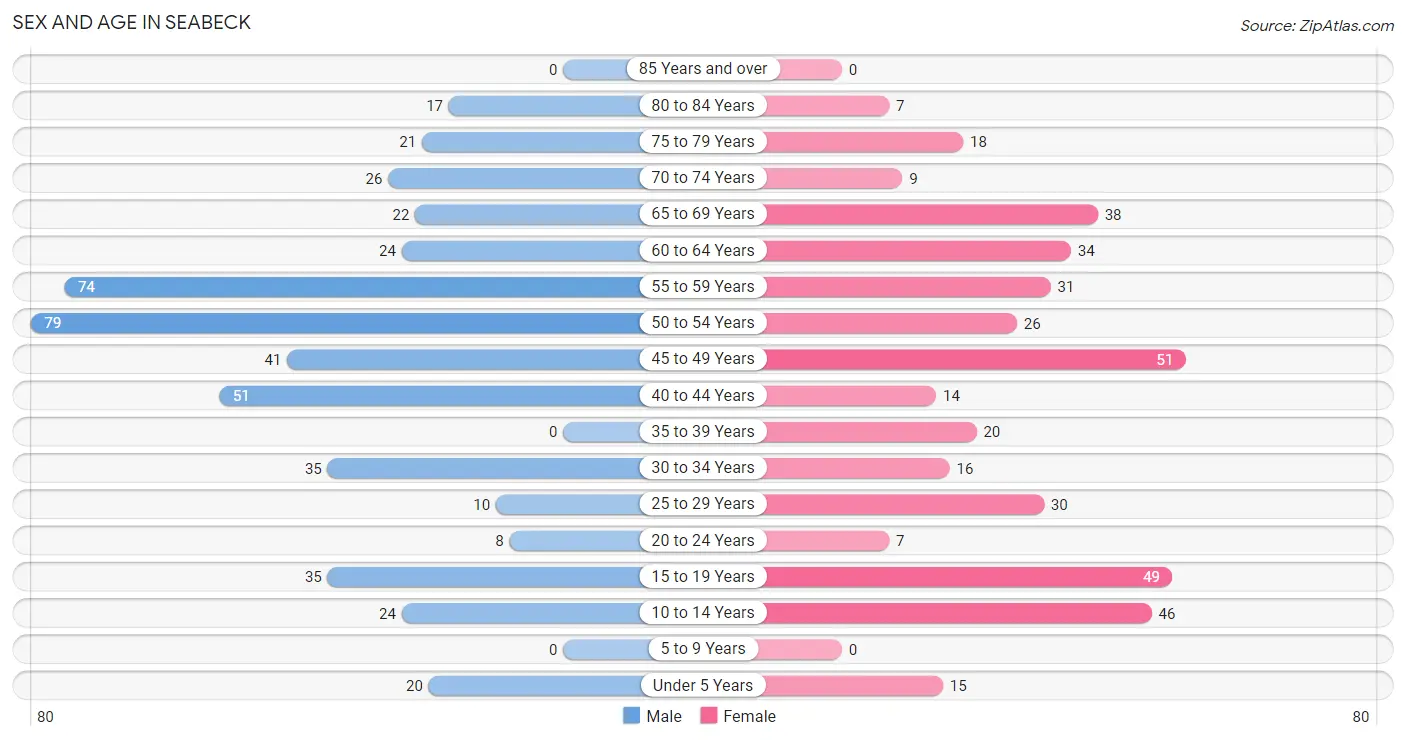
| Age Bracket | Male | Female |
| Under 5 Years | 20 (4.1%) | 15 (3.6%) |
| 5 to 9 Years | 0 (0.0%) | 0 (0.0%) |
| 10 to 14 Years | 24 (4.9%) | 46 (11.2%) |
| 15 to 19 Years | 35 (7.2%) | 49 (11.9%) |
| 20 to 24 Years | 8 (1.6%) | 7 (1.7%) |
| 25 to 29 Years | 10 (2.1%) | 30 (7.3%) |
| 30 to 34 Years | 35 (7.2%) | 16 (3.9%) |
| 35 to 39 Years | 0 (0.0%) | 20 (4.9%) |
| 40 to 44 Years | 51 (10.5%) | 14 (3.4%) |
| 45 to 49 Years | 41 (8.4%) | 51 (12.4%) |
| 50 to 54 Years | 79 (16.2%) | 26 (6.3%) |
| 55 to 59 Years | 74 (15.2%) | 31 (7.5%) |
| 60 to 64 Years | 24 (4.9%) | 34 (8.3%) |
| 65 to 69 Years | 22 (4.5%) | 38 (9.2%) |
| 70 to 74 Years | 26 (5.3%) | 9 (2.2%) |
| 75 to 79 Years | 21 (4.3%) | 18 (4.4%) |
| 80 to 84 Years | 17 (3.5%) | 7 (1.7%) |
| 85 Years and over | 0 (0.0%) | 0 (0.0%) |
| Total | 487 (100.0%) | 411 (100.0%) |
Families and Households in Seabeck
Median Family Size in Seabeck
The median family size in Seabeck is 2.59 persons per family, with married-couple families (184 | 68.7%) accounting for the largest median family size of 2.76 persons per family. On the other hand, single female/mother families (49 | 18.3%) represent the smallest median family size with 2.00 persons per family.
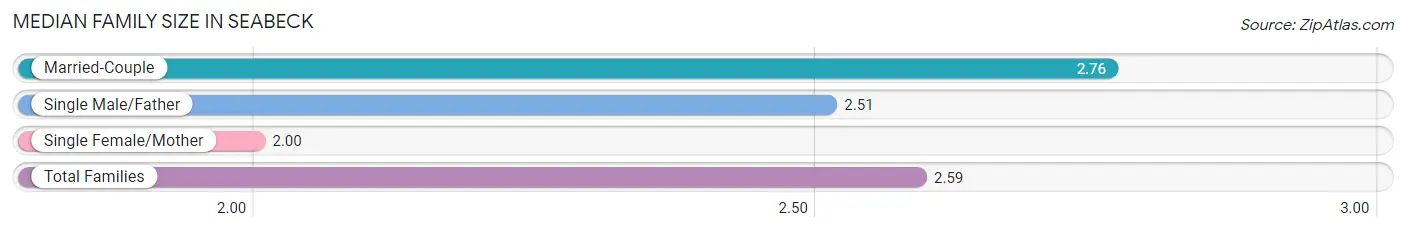
| Family Type | # Families | Family Size |
| Married-Couple | 184 (68.7%) | 2.76 |
| Single Male/Father | 35 (13.1%) | 2.51 |
| Single Female/Mother | 49 (18.3%) | 2.00 |
| Total Families | 268 (100.0%) | 2.59 |
Median Household Size in Seabeck
The median household size in Seabeck is 2.27 persons per household, with single female/mother households (49 | 12.4%) accounting for the largest median household size of 3.16 persons per household. non-family households (127 | 32.2%) represent the smallest median household size with 1.16 persons per household.
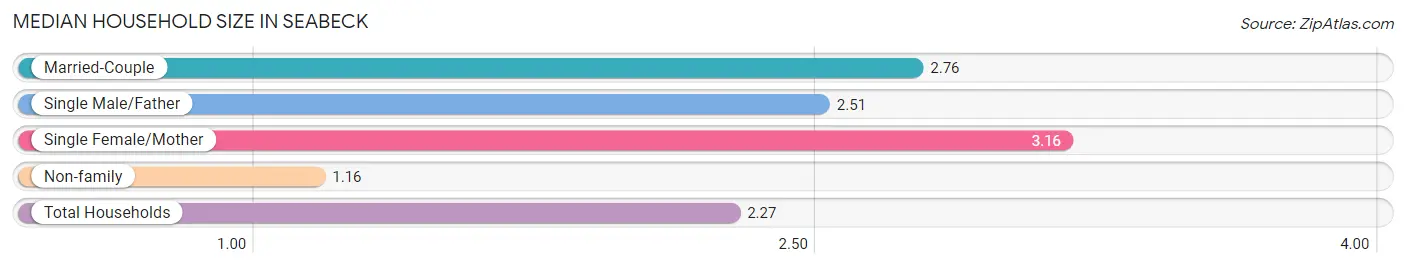
| Household Type | # Households | Household Size |
| Married-Couple | 184 (46.6%) | 2.76 |
| Single Male/Father | 35 (8.9%) | 2.51 |
| Single Female/Mother | 49 (12.4%) | 3.16 |
| Non-family | 127 (32.2%) | 1.16 |
| Total Households | 395 (100.0%) | 2.27 |
Household Size by Marriage Status in Seabeck
Out of a total of 395 households in Seabeck, 268 (67.8%) are family households, while 127 (32.2%) are nonfamily households. The most numerous type of family households are 2-person households, comprising 140, and the most common type of nonfamily households are 1-person households, comprising 110.
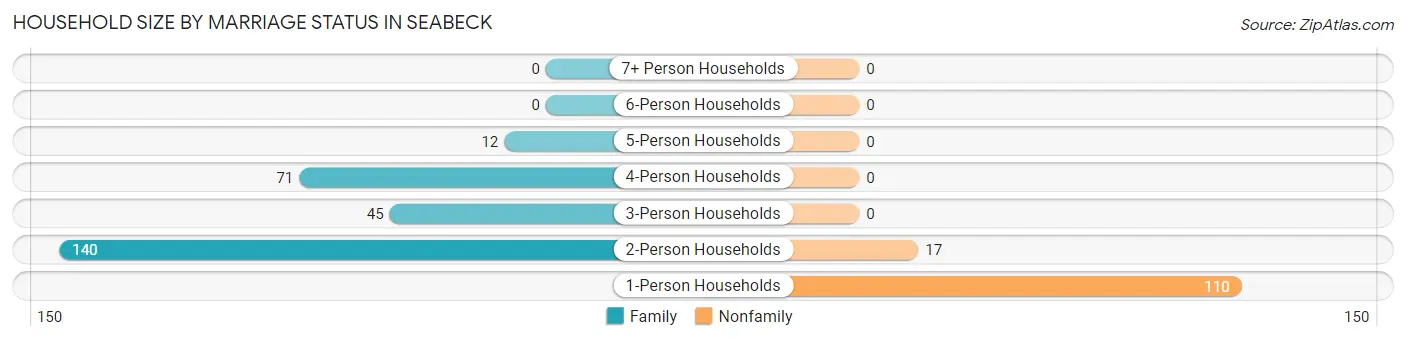
| Household Size | Family Households | Nonfamily Households |
| 1-Person Households | - | 110 (27.9%) |
| 2-Person Households | 140 (35.4%) | 17 (4.3%) |
| 3-Person Households | 45 (11.4%) | 0 (0.0%) |
| 4-Person Households | 71 (18.0%) | 0 (0.0%) |
| 5-Person Households | 12 (3.0%) | 0 (0.0%) |
| 6-Person Households | 0 (0.0%) | 0 (0.0%) |
| 7+ Person Households | 0 (0.0%) | 0 (0.0%) |
| Total | 268 (67.8%) | 127 (32.2%) |
Female Fertility in Seabeck
Fertility by Age in Seabeck
Average fertility rate in Seabeck is 86.0 births per 1,000 women. Women in the age bracket of 20 to 34 years have the highest fertility rate with 302.0 births per 1,000 women. Women in the age bracket of 20 to 34 years acount for 100.0% of all women with births.
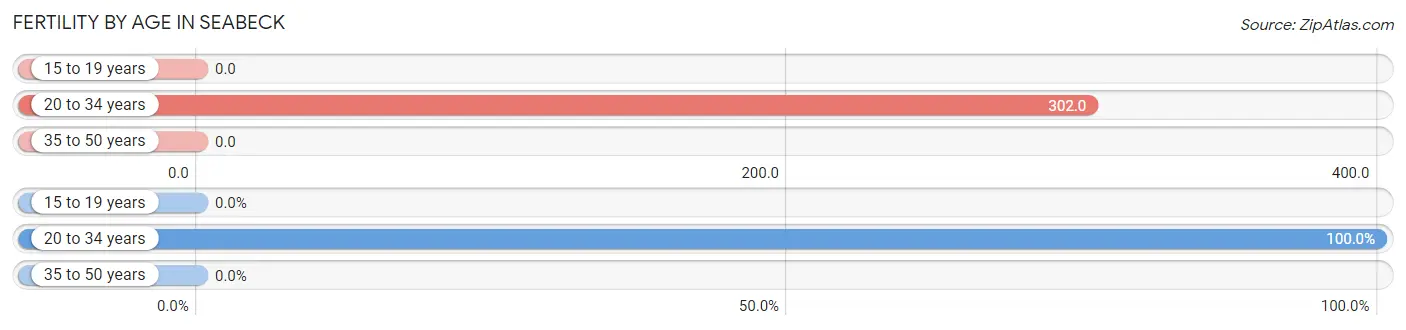
| Age Bracket | Women with Births | Births / 1,000 Women |
| 15 to 19 years | 0 (0.0%) | 0.0 |
| 20 to 34 years | 16 (100.0%) | 302.0 |
| 35 to 50 years | 0 (0.0%) | 0.0 |
| Total | 16 (100.0%) | 86.0 |
Fertility by Age by Marriage Status in Seabeck
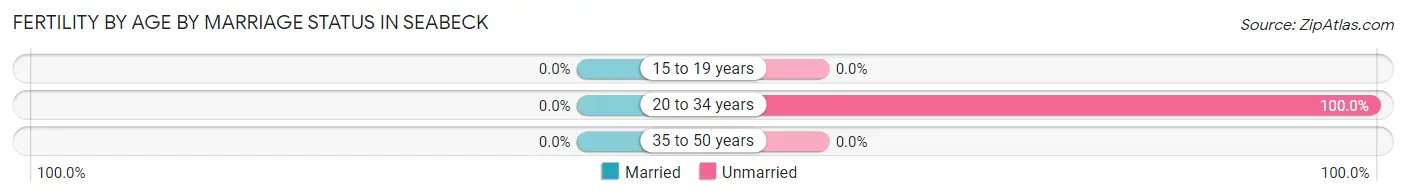
| Age Bracket | Married | Unmarried |
| 15 to 19 years | 0 (0.0%) | 0 (0.0%) |
| 20 to 34 years | 0 (0.0%) | 16 (100.0%) |
| 35 to 50 years | 0 (0.0%) | 0 (0.0%) |
| Total | 0 (0.0%) | 16 (100.0%) |
Fertility by Education in Seabeck
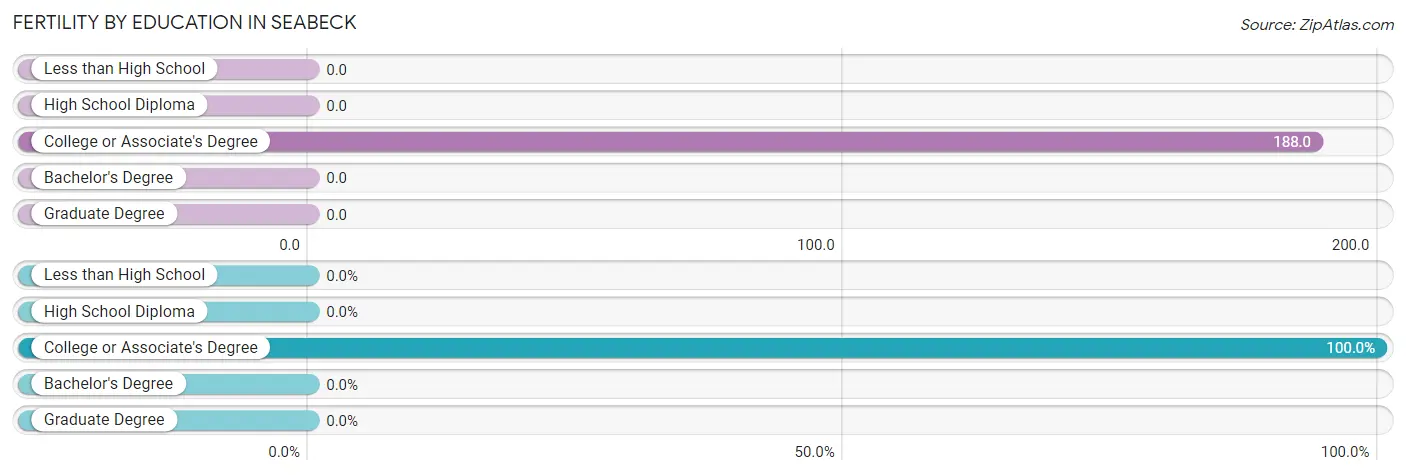
| Educational Attainment | Women with Births | Births / 1,000 Women |
| Less than High School | 0 (0.0%) | 0.0 |
| High School Diploma | 0 (0.0%) | 0.0 |
| College or Associate's Degree | 16 (100.0%) | 188.0 |
| Bachelor's Degree | 0 (0.0%) | 0.0 |
| Graduate Degree | 0 (0.0%) | 0.0 |
| Total | 16 (100.0%) | 86.0 |
Fertility by Education by Marriage Status in Seabeck
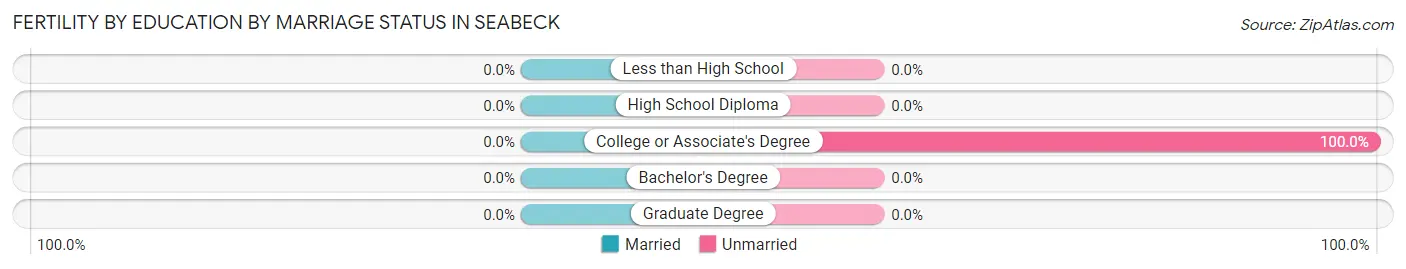
| Educational Attainment | Married | Unmarried |
| Less than High School | 0 (0.0%) | 0 (0.0%) |
| High School Diploma | 0 (0.0%) | 0 (0.0%) |
| College or Associate's Degree | 0 (0.0%) | 16 (100.0%) |
| Bachelor's Degree | 0 (0.0%) | 0 (0.0%) |
| Graduate Degree | 0 (0.0%) | 0 (0.0%) |
| Total | 0 (0.0%) | 16 (100.0%) |
Employment Characteristics in Seabeck
Employment by Class of Employer in Seabeck
Among the 389 employed individuals in Seabeck, private company employees (207 | 53.2%), federal government employees (74 | 19.0%), and self-employed (incorporated) (34 | 8.7%) make up the most common classes of employment.
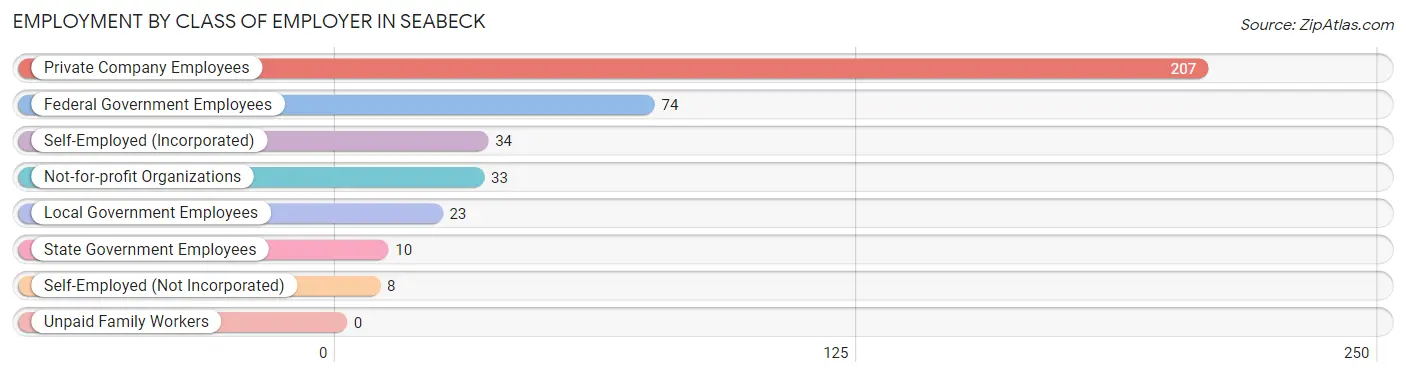
| Employer Class | # Employees | % Employees |
| Private Company Employees | 207 | 53.2% |
| Self-Employed (Incorporated) | 34 | 8.7% |
| Self-Employed (Not Incorporated) | 8 | 2.1% |
| Not-for-profit Organizations | 33 | 8.5% |
| Local Government Employees | 23 | 5.9% |
| State Government Employees | 10 | 2.6% |
| Federal Government Employees | 74 | 19.0% |
| Unpaid Family Workers | 0 | 0.0% |
| Total | 389 | 100.0% |
Employment Status by Age in Seabeck
According to the labor force statistics for Seabeck, out of the total population over 16 years of age (774), 58.8% or 455 individuals are in the labor force, with 14.9% or 68 of them unemployed. The age group with the highest labor force participation rate is 20 to 24 years, with 100.0% or 15 individuals in the labor force. Within the labor force, the 45 to 54 years age range has the highest percentage of unemployed individuals, with 37.6% or 55 of them being unemployed.
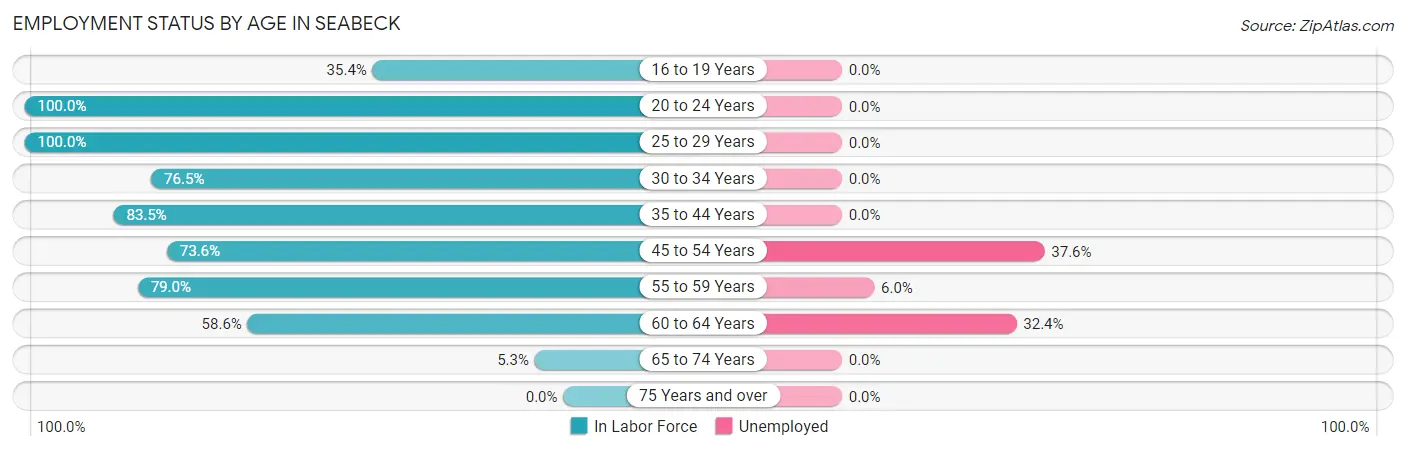
| Age Bracket | In Labor Force | Unemployed |
| 16 to 19 Years | 23 (35.4%) | 0 (0.0%) |
| 20 to 24 Years | 15 (100.0%) | 0 (0.0%) |
| 25 to 29 Years | 40 (100.0%) | 0 (0.0%) |
| 30 to 34 Years | 39 (76.5%) | 0 (0.0%) |
| 35 to 44 Years | 71 (83.5%) | 0 (0.0%) |
| 45 to 54 Years | 145 (73.6%) | 55 (37.6%) |
| 55 to 59 Years | 83 (79.0%) | 5 (6.0%) |
| 60 to 64 Years | 34 (58.6%) | 11 (32.4%) |
| 65 to 74 Years | 5 (5.3%) | 0 (0.0%) |
| 75 Years and over | 0 (0.0%) | 0 (0.0%) |
| Total | 455 (58.8%) | 68 (14.9%) |
Employment Status by Educational Attainment in Seabeck
According to labor force statistics for Seabeck, 76.9% of individuals (412) out of the total population between 25 and 64 years of age (536) are in the labor force, with 16.5% or 68 of them being unemployed. The group with the highest labor force participation rate are those with the educational attainment of less than high school, with 100.0% or 40 individuals in the labor force. Within the labor force, individuals with less than high school education have the highest percentage of unemployment, with 82.5% or 33 of them being unemployed.
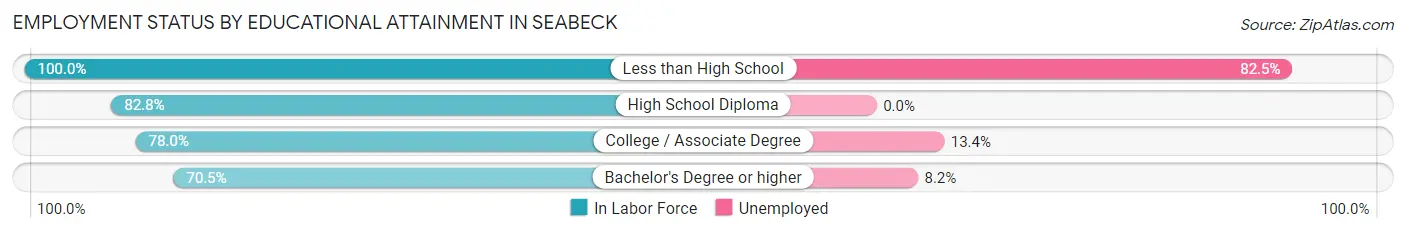
| Educational Attainment | In Labor Force | Unemployed |
| Less than High School | 40 (100.0%) | 33 (82.5%) |
| High School Diploma | 53 (82.8%) | 0 (0.0%) |
| College / Associate Degree | 149 (78.0%) | 26 (13.4%) |
| Bachelor's Degree or higher | 170 (70.5%) | 20 (8.2%) |
| Total | 412 (76.9%) | 88 (16.5%) |
Employment Occupations by Sex in Seabeck
Management, Business, Science and Arts Occupations
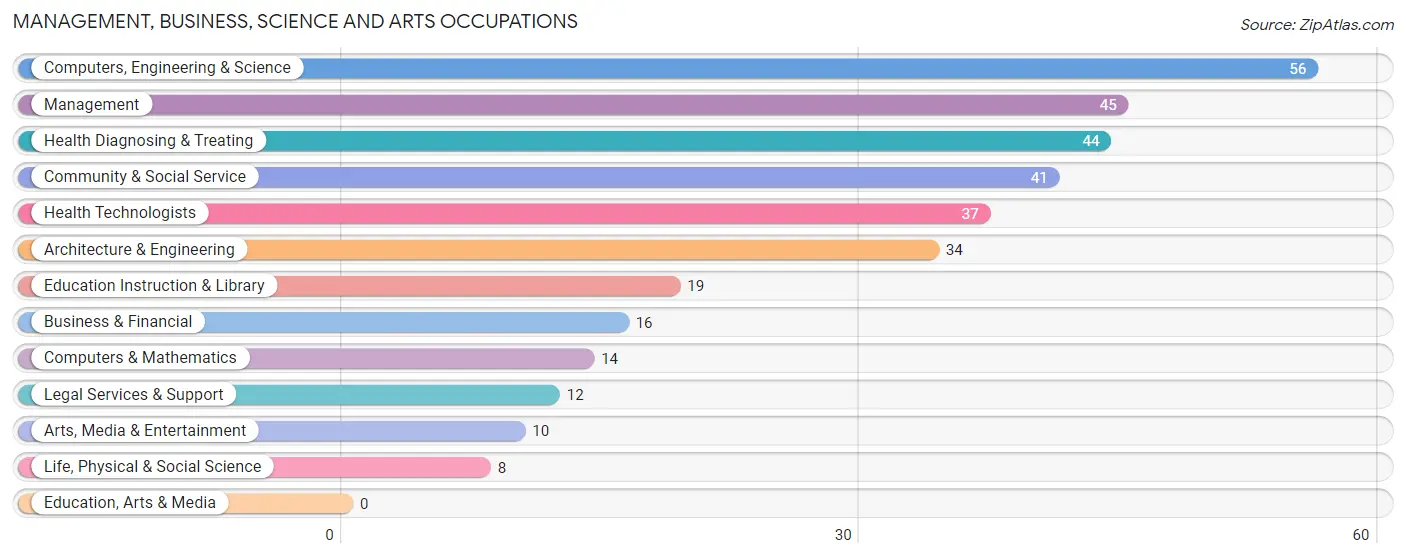
The most common Management, Business, Science and Arts occupations in Seabeck are Computers, Engineering & Science (56 | 14.8%), Management (45 | 11.9%), Health Diagnosing & Treating (44 | 11.7%), Community & Social Service (41 | 10.9%), and Health Technologists (37 | 9.8%).
Management, Business, Science and Arts Occupations by Sex
Within the Management, Business, Science and Arts occupations in Seabeck, the most male-oriented occupations are Business & Financial (100.0%), Architecture & Engineering (100.0%), and Life, Physical & Social Science (100.0%), while the most female-oriented occupations are Computers & Mathematics (100.0%), Education Instruction & Library (100.0%), and Health Diagnosing & Treating (50.0%).
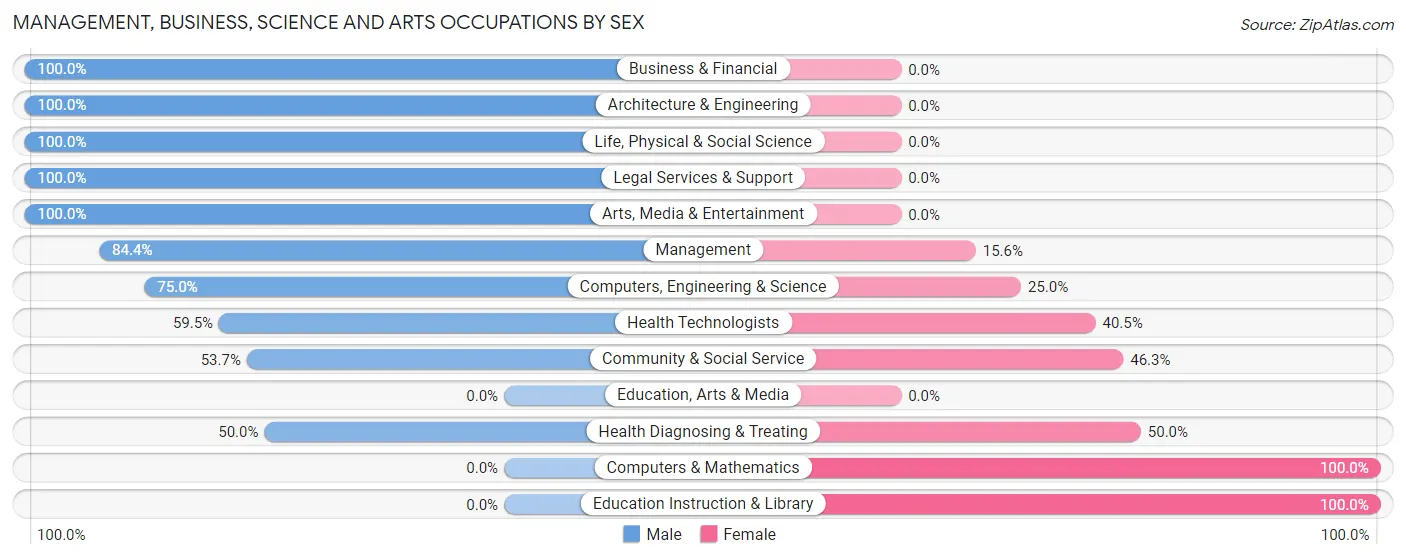
| Occupation | Male | Female |
| Management | 38 (84.4%) | 7 (15.6%) |
| Business & Financial | 16 (100.0%) | 0 (0.0%) |
| Computers, Engineering & Science | 42 (75.0%) | 14 (25.0%) |
| Computers & Mathematics | 0 (0.0%) | 14 (100.0%) |
| Architecture & Engineering | 34 (100.0%) | 0 (0.0%) |
| Life, Physical & Social Science | 8 (100.0%) | 0 (0.0%) |
| Community & Social Service | 22 (53.7%) | 19 (46.3%) |
| Education, Arts & Media | 0 (0.0%) | 0 (0.0%) |
| Legal Services & Support | 12 (100.0%) | 0 (0.0%) |
| Education Instruction & Library | 0 (0.0%) | 19 (100.0%) |
| Arts, Media & Entertainment | 10 (100.0%) | 0 (0.0%) |
| Health Diagnosing & Treating | 22 (50.0%) | 22 (50.0%) |
| Health Technologists | 22 (59.5%) | 15 (40.5%) |
| Total (Category) | 140 (69.3%) | 62 (30.7%) |
| Total (Overall) | 225 (59.7%) | 152 (40.3%) |
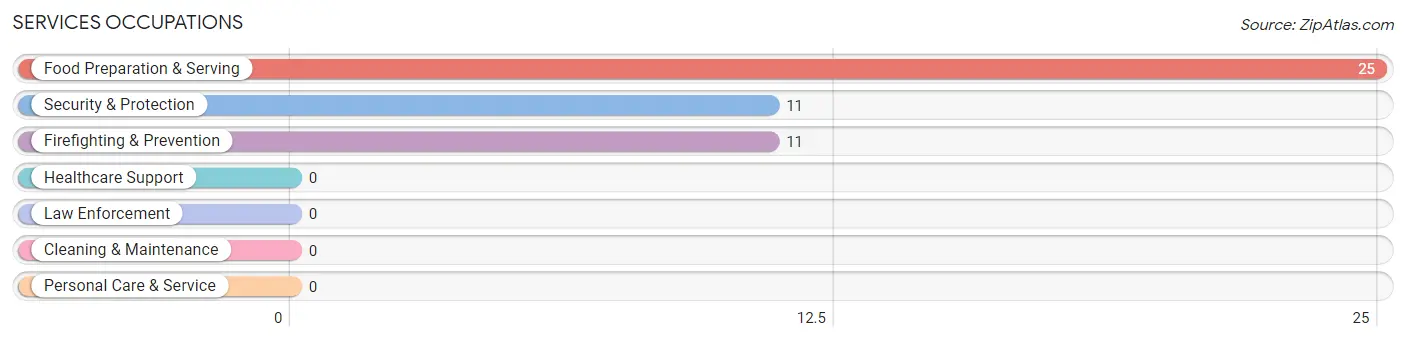
Services Occupations
The most common Services occupations in Seabeck are Food Preparation & Serving (25 | 6.6%), Security & Protection (11 | 2.9%), and Firefighting & Prevention (11 | 2.9%).
Services Occupations by Sex
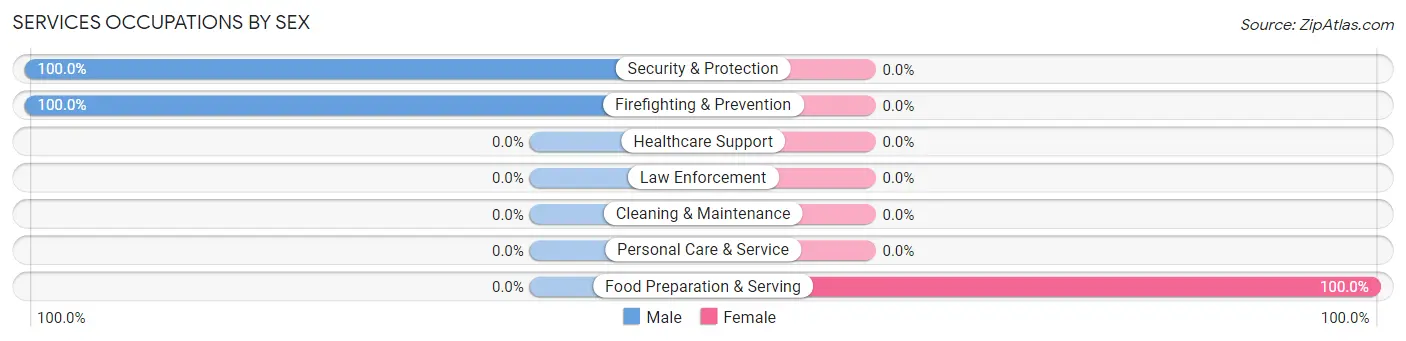
| Occupation | Male | Female |
| Healthcare Support | 0 (0.0%) | 0 (0.0%) |
| Security & Protection | 11 (100.0%) | 0 (0.0%) |
| Firefighting & Prevention | 11 (100.0%) | 0 (0.0%) |
| Law Enforcement | 0 (0.0%) | 0 (0.0%) |
| Food Preparation & Serving | 0 (0.0%) | 25 (100.0%) |
| Cleaning & Maintenance | 0 (0.0%) | 0 (0.0%) |
| Personal Care & Service | 0 (0.0%) | 0 (0.0%) |
| Total (Category) | 11 (30.6%) | 25 (69.4%) |
| Total (Overall) | 225 (59.7%) | 152 (40.3%) |
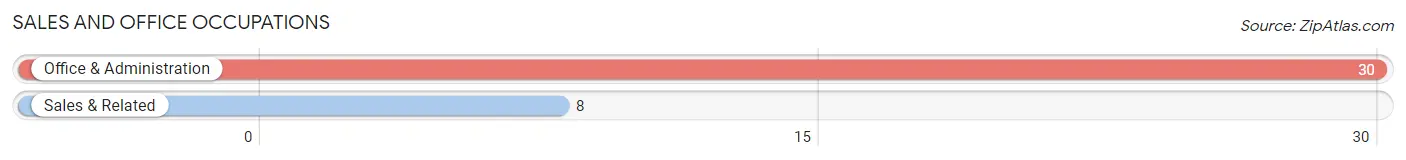
Sales and Office Occupations
The most common Sales and Office occupations in Seabeck are Office & Administration (30 | 8.0%), and Sales & Related (8 | 2.1%).
Sales and Office Occupations by Sex
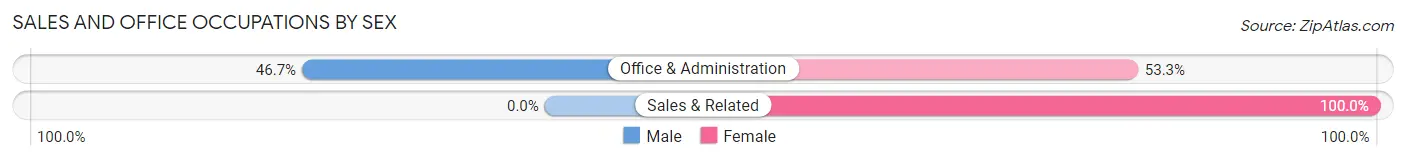
| Occupation | Male | Female |
| Sales & Related | 0 (0.0%) | 8 (100.0%) |
| Office & Administration | 14 (46.7%) | 16 (53.3%) |
| Total (Category) | 14 (36.8%) | 24 (63.2%) |
| Total (Overall) | 225 (59.7%) | 152 (40.3%) |
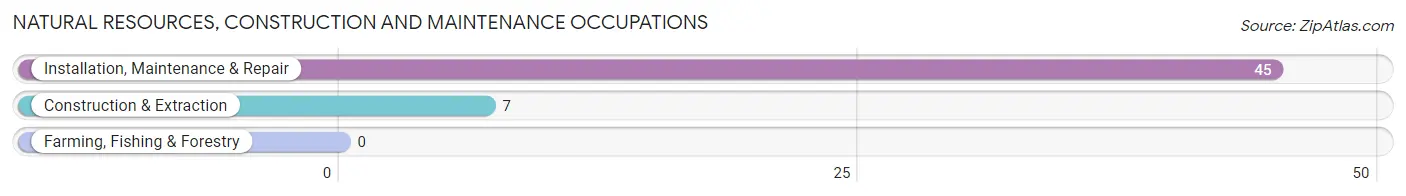
Natural Resources, Construction and Maintenance Occupations
The most common Natural Resources, Construction and Maintenance occupations in Seabeck are Installation, Maintenance & Repair (45 | 11.9%), and Construction & Extraction (7 | 1.9%).
Natural Resources, Construction and Maintenance Occupations by Sex
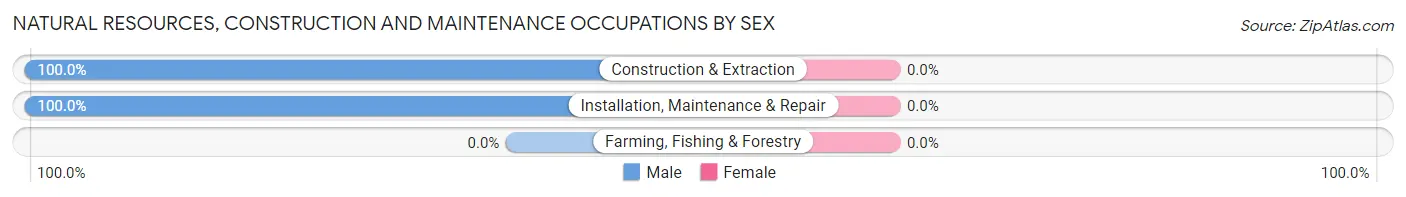
| Occupation | Male | Female |
| Farming, Fishing & Forestry | 0 (0.0%) | 0 (0.0%) |
| Construction & Extraction | 7 (100.0%) | 0 (0.0%) |
| Installation, Maintenance & Repair | 45 (100.0%) | 0 (0.0%) |
| Total (Category) | 52 (100.0%) | 0 (0.0%) |
| Total (Overall) | 225 (59.7%) | 152 (40.3%) |
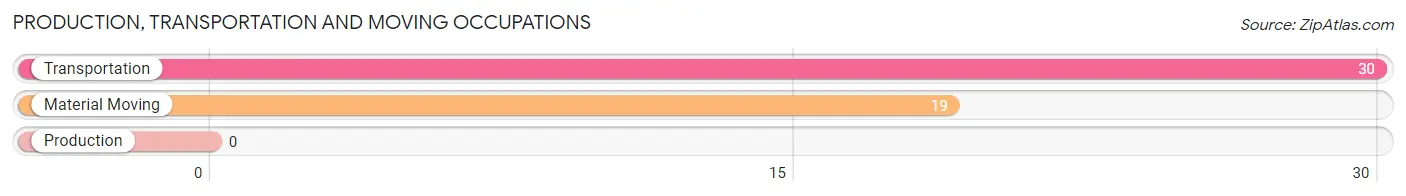
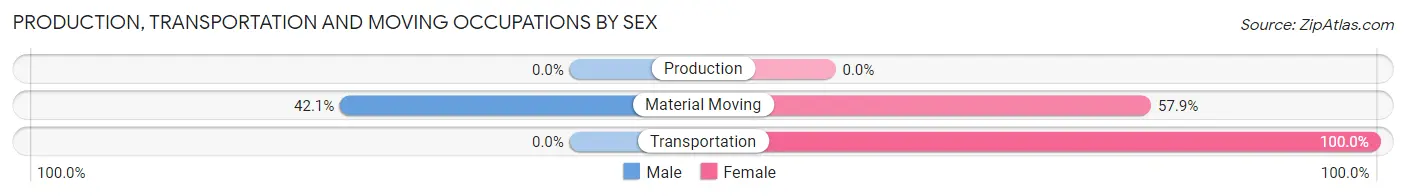
Production, Transportation and Moving Occupations
The most common Production, Transportation and Moving occupations in Seabeck are Transportation (30 | 8.0%), and Material Moving (19 | 5.0%).
Production, Transportation and Moving Occupations by Sex
| Occupation | Male | Female |
| Production | 0 (0.0%) | 0 (0.0%) |
| Transportation | 0 (0.0%) | 30 (100.0%) |
| Material Moving | 8 (42.1%) | 11 (57.9%) |
| Total (Category) | 8 (16.3%) | 41 (83.7%) |
| Total (Overall) | 225 (59.7%) | 152 (40.3%) |
Employment Industries by Sex in Seabeck
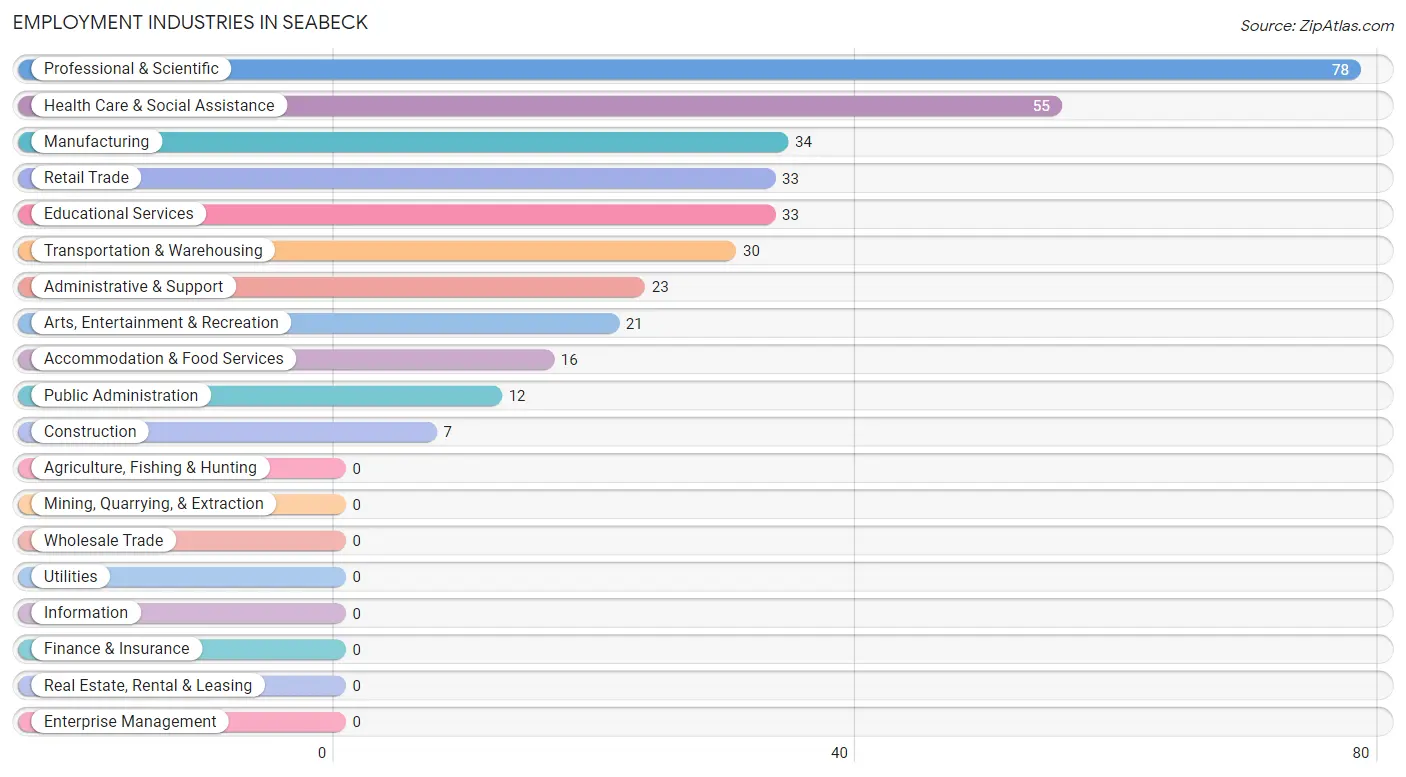
Employment Industries in Seabeck
The major employment industries in Seabeck include Professional & Scientific (78 | 20.7%), Health Care & Social Assistance (55 | 14.6%), Manufacturing (34 | 9.0%), Retail Trade (33 | 8.7%), and Educational Services (33 | 8.7%).
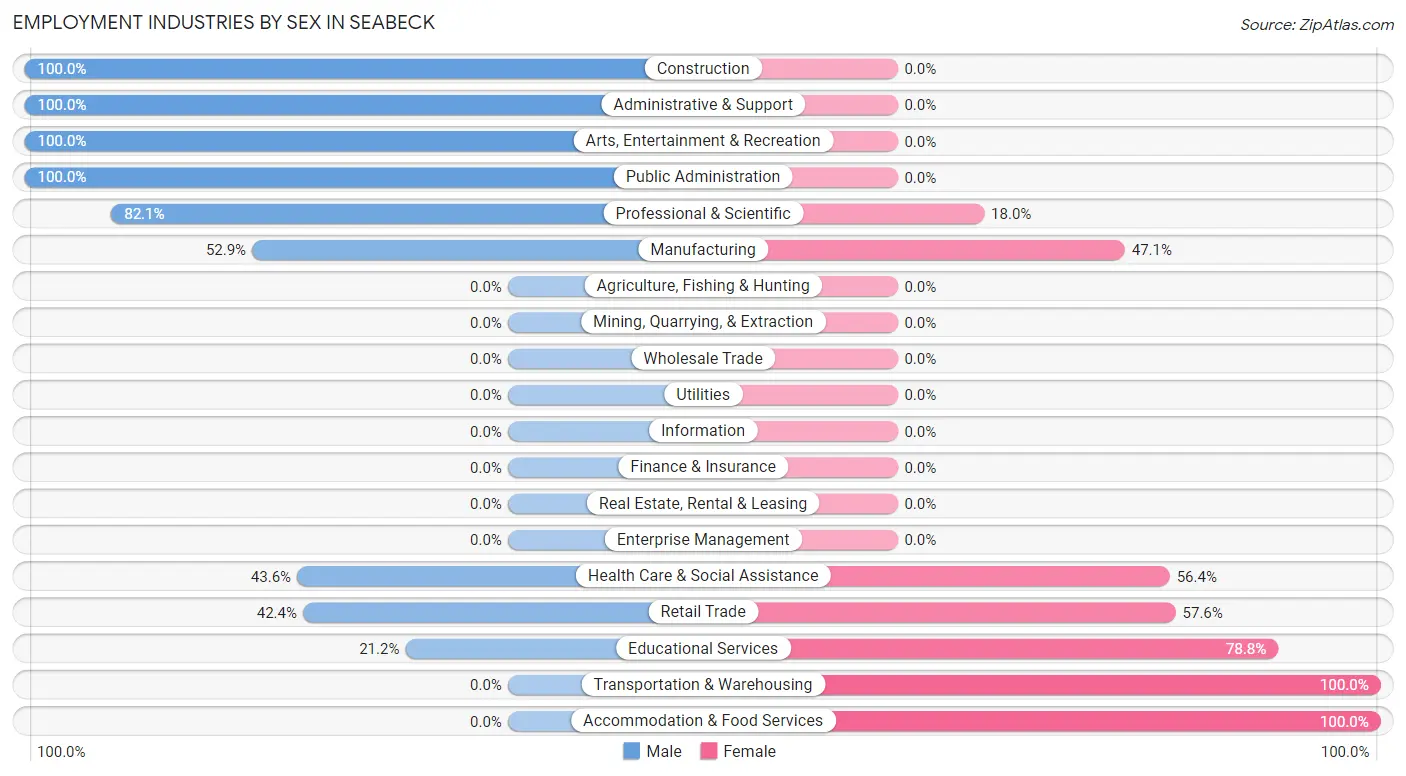
Employment Industries by Sex in Seabeck
The Seabeck industries that see more men than women are Construction (100.0%), Administrative & Support (100.0%), and Arts, Entertainment & Recreation (100.0%), whereas the industries that tend to have a higher number of women are Transportation & Warehousing (100.0%), Accommodation & Food Services (100.0%), and Educational Services (78.8%).
| Industry | Male | Female |
| Agriculture, Fishing & Hunting | 0 (0.0%) | 0 (0.0%) |
| Mining, Quarrying, & Extraction | 0 (0.0%) | 0 (0.0%) |
| Construction | 7 (100.0%) | 0 (0.0%) |
| Manufacturing | 18 (52.9%) | 16 (47.1%) |
| Wholesale Trade | 0 (0.0%) | 0 (0.0%) |
| Retail Trade | 14 (42.4%) | 19 (57.6%) |
| Transportation & Warehousing | 0 (0.0%) | 30 (100.0%) |
| Utilities | 0 (0.0%) | 0 (0.0%) |
| Information | 0 (0.0%) | 0 (0.0%) |
| Finance & Insurance | 0 (0.0%) | 0 (0.0%) |
| Real Estate, Rental & Leasing | 0 (0.0%) | 0 (0.0%) |
| Professional & Scientific | 64 (82.1%) | 14 (17.9%) |
| Enterprise Management | 0 (0.0%) | 0 (0.0%) |
| Administrative & Support | 23 (100.0%) | 0 (0.0%) |
| Educational Services | 7 (21.2%) | 26 (78.8%) |
| Health Care & Social Assistance | 24 (43.6%) | 31 (56.4%) |
| Arts, Entertainment & Recreation | 21 (100.0%) | 0 (0.0%) |
| Accommodation & Food Services | 0 (0.0%) | 16 (100.0%) |
| Public Administration | 12 (100.0%) | 0 (0.0%) |
| Total | 225 (59.7%) | 152 (40.3%) |
Education in Seabeck
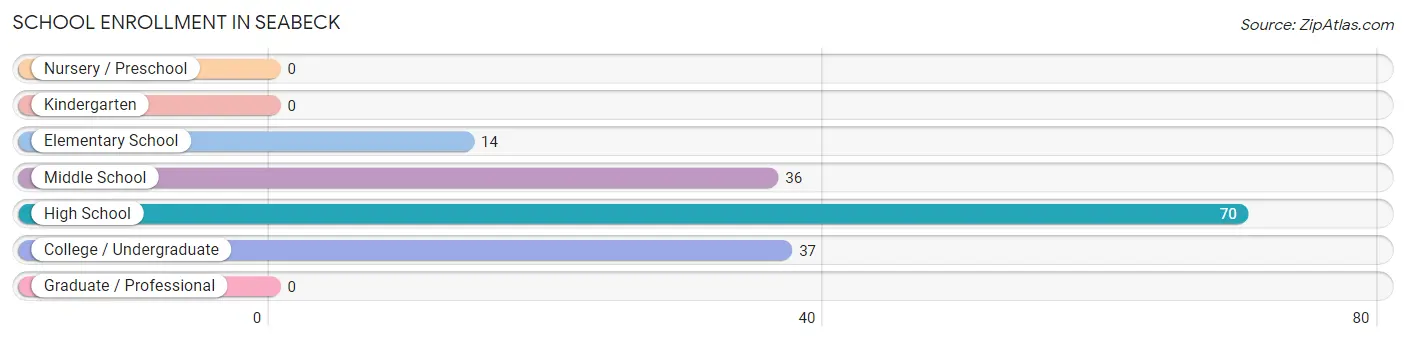
School Enrollment in Seabeck
The most common levels of schooling among the 157 students in Seabeck are high school (70 | 44.6%), college / undergraduate (37 | 23.6%), and middle school (36 | 22.9%).
| School Level | # Students | % Students |
| Nursery / Preschool | 0 | 0.0% |
| Kindergarten | 0 | 0.0% |
| Elementary School | 14 | 8.9% |
| Middle School | 36 | 22.9% |
| High School | 70 | 44.6% |
| College / Undergraduate | 37 | 23.6% |
| Graduate / Professional | 0 | 0.0% |
| Total | 157 | 100.0% |
School Enrollment by Age by Funding Source in Seabeck
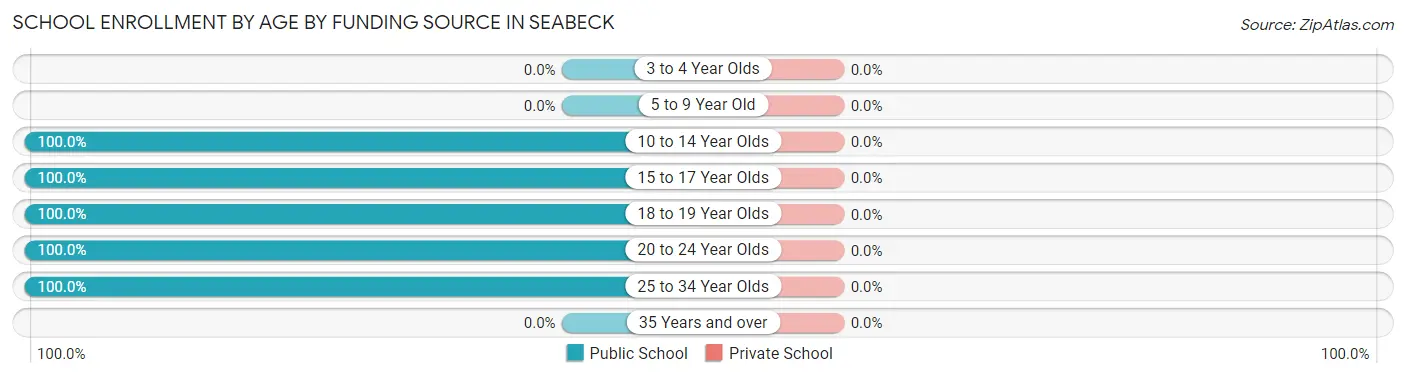
| Age Bracket | Public School | Private School |
| 3 to 4 Year Olds | 0 (0.0%) | 0 (0.0%) |
| 5 to 9 Year Old | 0 (0.0%) | 0 (0.0%) |
| 10 to 14 Year Olds | 50 (100.0%) | 0 (0.0%) |
| 15 to 17 Year Olds | 49 (100.0%) | 0 (0.0%) |
| 18 to 19 Year Olds | 21 (100.0%) | 0 (0.0%) |
| 20 to 24 Year Olds | 7 (100.0%) | 0 (0.0%) |
| 25 to 34 Year Olds | 30 (100.0%) | 0 (0.0%) |
| 35 Years and over | 0 (0.0%) | 0 (0.0%) |
| Total | 157 (100.0%) | 0 (0.0%) |
Educational Attainment by Field of Study in Seabeck
Education (86 | 25.5%), engineering (67 | 19.9%), bio, nature & agricultural (45 | 13.4%), social sciences (31 | 9.2%), and communications (24 | 7.1%) are the most common fields of study among 337 individuals in Seabeck who have obtained a bachelor's degree or higher.
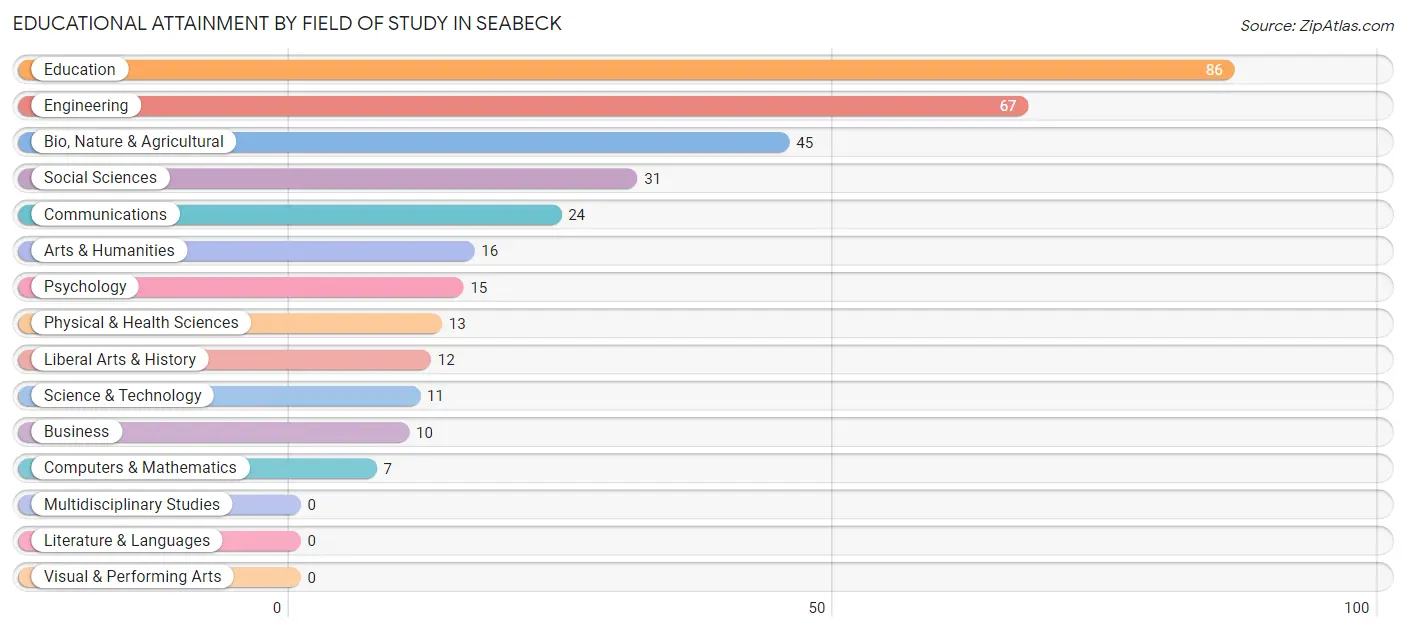
| Field of Study | # Graduates | % Graduates |
| Computers & Mathematics | 7 | 2.1% |
| Bio, Nature & Agricultural | 45 | 13.4% |
| Physical & Health Sciences | 13 | 3.9% |
| Psychology | 15 | 4.4% |
| Social Sciences | 31 | 9.2% |
| Engineering | 67 | 19.9% |
| Multidisciplinary Studies | 0 | 0.0% |
| Science & Technology | 11 | 3.3% |
| Business | 10 | 3.0% |
| Education | 86 | 25.5% |
| Literature & Languages | 0 | 0.0% |
| Liberal Arts & History | 12 | 3.6% |
| Visual & Performing Arts | 0 | 0.0% |
| Communications | 24 | 7.1% |
| Arts & Humanities | 16 | 4.8% |
| Total | 337 | 100.0% |
Transportation & Commute in Seabeck
Vehicle Availability by Sex in Seabeck
The most prevalent vehicle ownership categories in Seabeck are males with 3 vehicles (132, accounting for 55.7%) and females with 3 vehicles (46, making up 86.8%).
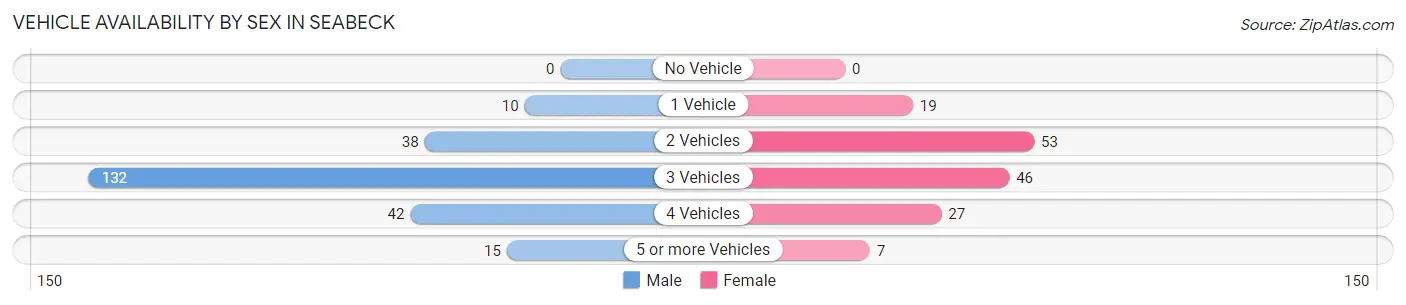
| Vehicles Available | Male | Female |
| No Vehicle | 0 (0.0%) | 0 (0.0%) |
| 1 Vehicle | 10 (4.2%) | 19 (12.5%) |
| 2 Vehicles | 38 (16.0%) | 53 (34.9%) |
| 3 Vehicles | 132 (55.7%) | 46 (30.3%) |
| 4 Vehicles | 42 (17.7%) | 27 (17.8%) |
| 5 or more Vehicles | 15 (6.3%) | 7 (4.6%) |
| Total | 237 (100.0%) | 152 (100.0%) |
Commute Time in Seabeck
The most frequently occuring commute durations in Seabeck are 30 to 34 minutes (80 commuters, 22.4%), 25 to 29 minutes (69 commuters, 19.3%), and 20 to 24 minutes (66 commuters, 18.4%).
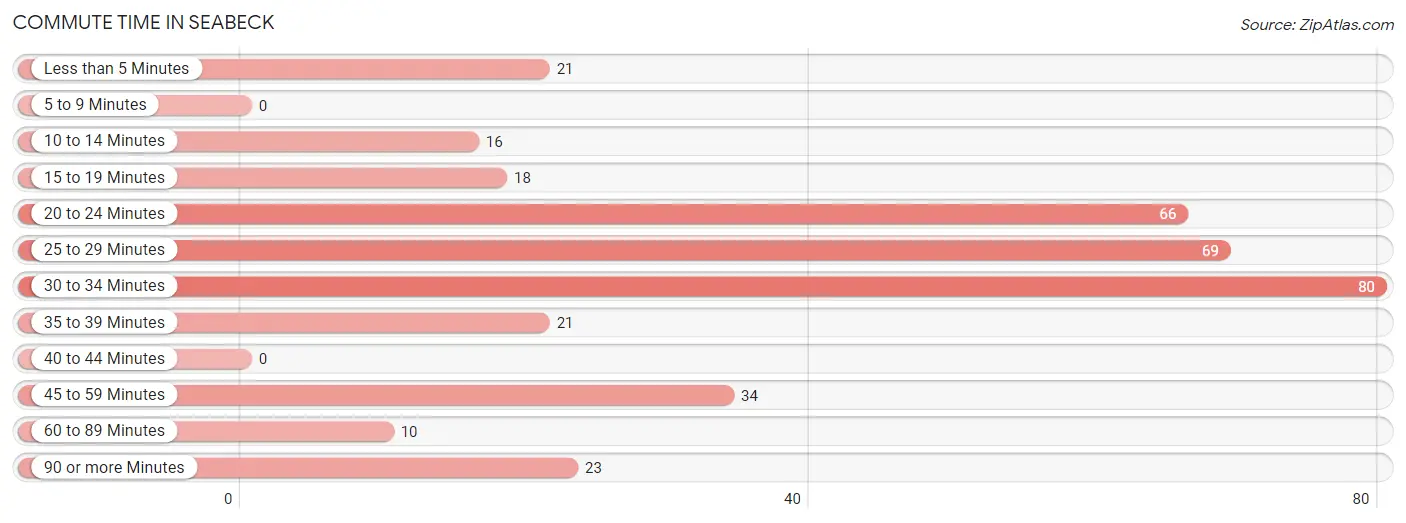
| Commute Time | # Commuters | % Commuters |
| Less than 5 Minutes | 21 | 5.9% |
| 5 to 9 Minutes | 0 | 0.0% |
| 10 to 14 Minutes | 16 | 4.5% |
| 15 to 19 Minutes | 18 | 5.0% |
| 20 to 24 Minutes | 66 | 18.4% |
| 25 to 29 Minutes | 69 | 19.3% |
| 30 to 34 Minutes | 80 | 22.4% |
| 35 to 39 Minutes | 21 | 5.9% |
| 40 to 44 Minutes | 0 | 0.0% |
| 45 to 59 Minutes | 34 | 9.5% |
| 60 to 89 Minutes | 10 | 2.8% |
| 90 or more Minutes | 23 | 6.4% |
Commute Time by Sex in Seabeck
The most common commute times in Seabeck are 20 to 24 minutes (50 commuters, 21.8%) for males and 30 to 34 minutes (47 commuters, 36.4%) for females.
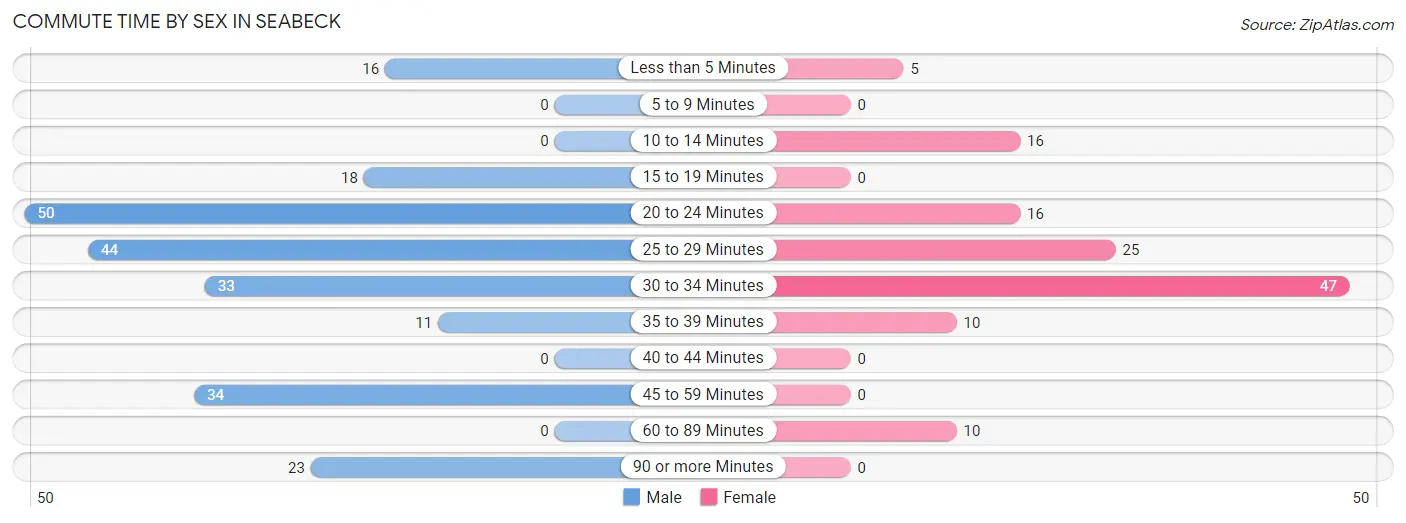
| Commute Time | Male | Female |
| Less than 5 Minutes | 16 (7.0%) | 5 (3.9%) |
| 5 to 9 Minutes | 0 (0.0%) | 0 (0.0%) |
| 10 to 14 Minutes | 0 (0.0%) | 16 (12.4%) |
| 15 to 19 Minutes | 18 (7.9%) | 0 (0.0%) |
| 20 to 24 Minutes | 50 (21.8%) | 16 (12.4%) |
| 25 to 29 Minutes | 44 (19.2%) | 25 (19.4%) |
| 30 to 34 Minutes | 33 (14.4%) | 47 (36.4%) |
| 35 to 39 Minutes | 11 (4.8%) | 10 (7.7%) |
| 40 to 44 Minutes | 0 (0.0%) | 0 (0.0%) |
| 45 to 59 Minutes | 34 (14.8%) | 0 (0.0%) |
| 60 to 89 Minutes | 0 (0.0%) | 10 (7.7%) |
| 90 or more Minutes | 23 (10.0%) | 0 (0.0%) |
Time of Departure to Work by Sex in Seabeck
The most frequent times of departure to work in Seabeck are 8:00 AM to 8:29 AM (53, 23.1%) for males and 12:00 AM to 4:59 AM (63, 48.8%) for females.
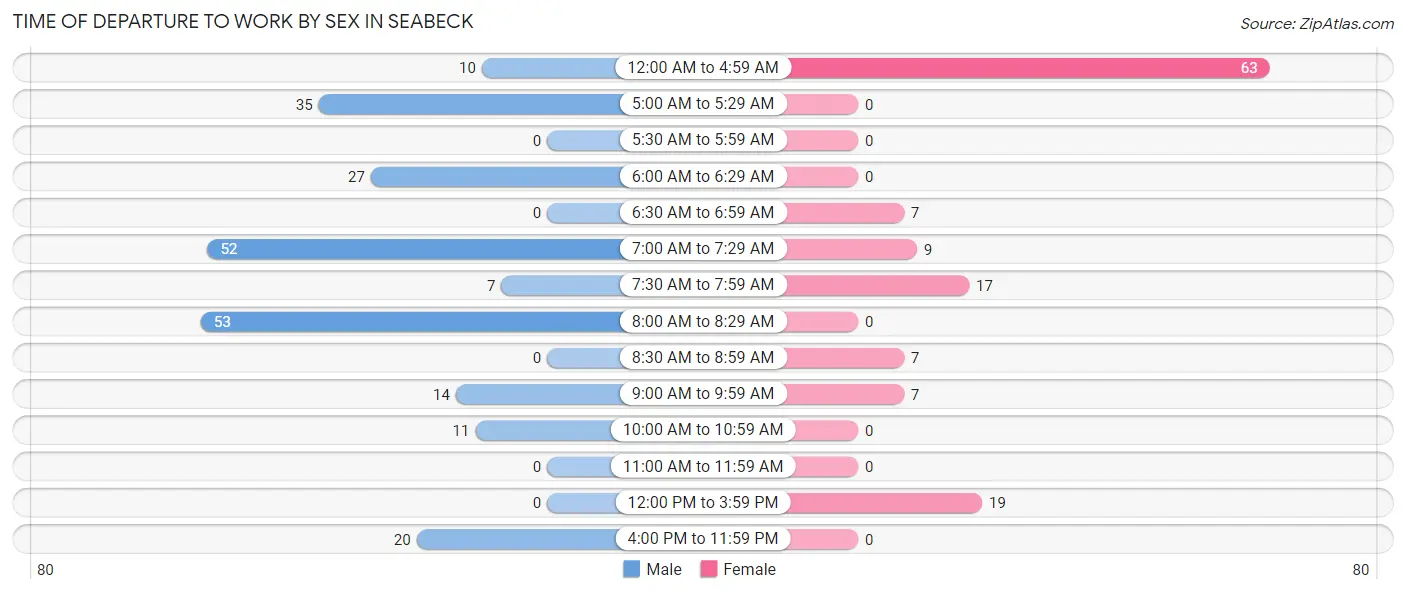
| Time of Departure | Male | Female |
| 12:00 AM to 4:59 AM | 10 (4.4%) | 63 (48.8%) |
| 5:00 AM to 5:29 AM | 35 (15.3%) | 0 (0.0%) |
| 5:30 AM to 5:59 AM | 0 (0.0%) | 0 (0.0%) |
| 6:00 AM to 6:29 AM | 27 (11.8%) | 0 (0.0%) |
| 6:30 AM to 6:59 AM | 0 (0.0%) | 7 (5.4%) |
| 7:00 AM to 7:29 AM | 52 (22.7%) | 9 (7.0%) |
| 7:30 AM to 7:59 AM | 7 (3.1%) | 17 (13.2%) |
| 8:00 AM to 8:29 AM | 53 (23.1%) | 0 (0.0%) |
| 8:30 AM to 8:59 AM | 0 (0.0%) | 7 (5.4%) |
| 9:00 AM to 9:59 AM | 14 (6.1%) | 7 (5.4%) |
| 10:00 AM to 10:59 AM | 11 (4.8%) | 0 (0.0%) |
| 11:00 AM to 11:59 AM | 0 (0.0%) | 0 (0.0%) |
| 12:00 PM to 3:59 PM | 0 (0.0%) | 19 (14.7%) |
| 4:00 PM to 11:59 PM | 20 (8.7%) | 0 (0.0%) |
| Total | 229 (100.0%) | 129 (100.0%) |
Housing Occupancy in Seabeck
Occupancy by Ownership in Seabeck
Of the total 395 dwellings in Seabeck, owner-occupied units account for 241 (61.0%), while renter-occupied units make up 154 (39.0%).
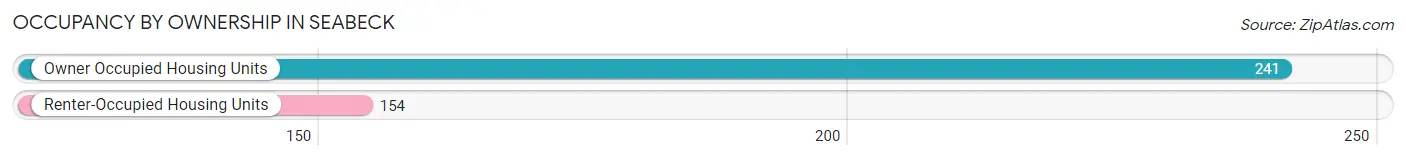
| Occupancy | # Housing Units | % Housing Units |
| Owner Occupied Housing Units | 241 | 61.0% |
| Renter-Occupied Housing Units | 154 | 39.0% |
| Total Occupied Housing Units | 395 | 100.0% |
Occupancy by Household Size in Seabeck
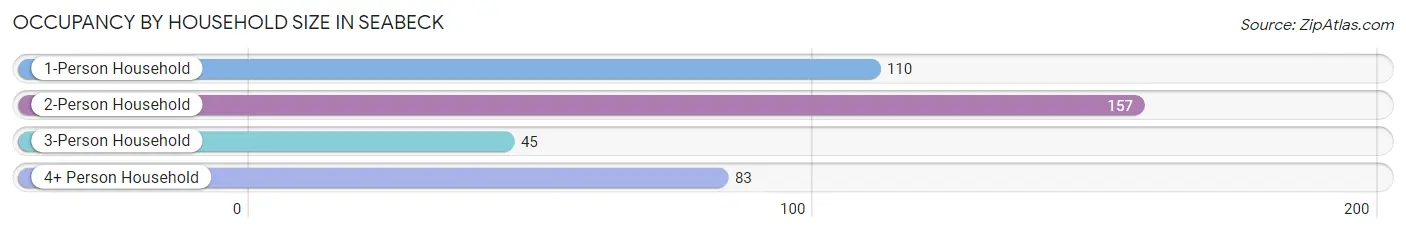
| Household Size | # Housing Units | % Housing Units |
| 1-Person Household | 110 | 27.9% |
| 2-Person Household | 157 | 39.8% |
| 3-Person Household | 45 | 11.4% |
| 4+ Person Household | 83 | 21.0% |
| Total Housing Units | 395 | 100.0% |
Occupancy by Ownership by Household Size in Seabeck
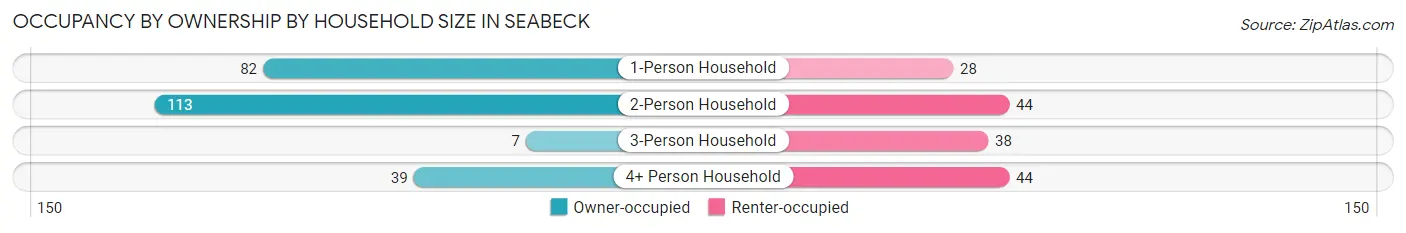
| Household Size | Owner-occupied | Renter-occupied |
| 1-Person Household | 82 (74.6%) | 28 (25.5%) |
| 2-Person Household | 113 (72.0%) | 44 (28.0%) |
| 3-Person Household | 7 (15.6%) | 38 (84.4%) |
| 4+ Person Household | 39 (47.0%) | 44 (53.0%) |
| Total Housing Units | 241 (61.0%) | 154 (39.0%) |
Occupancy by Educational Attainment in Seabeck
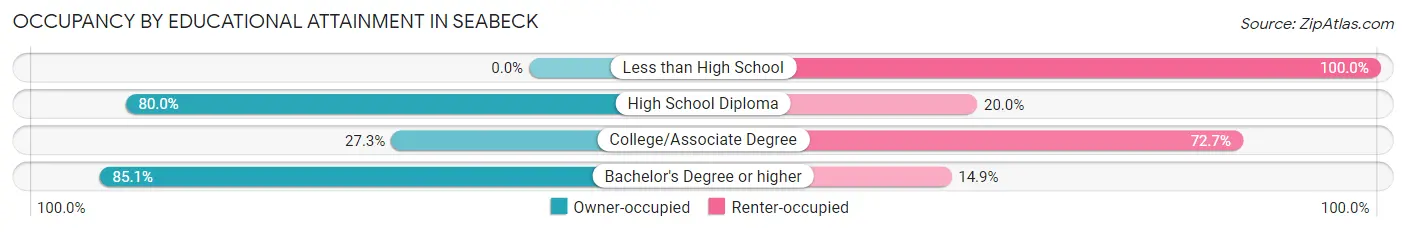
| Household Size | Owner-occupied | Renter-occupied |
| Less than High School | 0 (0.0%) | 7 (100.0%) |
| High School Diploma | 40 (80.0%) | 10 (20.0%) |
| College/Associate Degree | 41 (27.3%) | 109 (72.7%) |
| Bachelor's Degree or higher | 160 (85.1%) | 28 (14.9%) |
Occupancy by Age of Householder in Seabeck
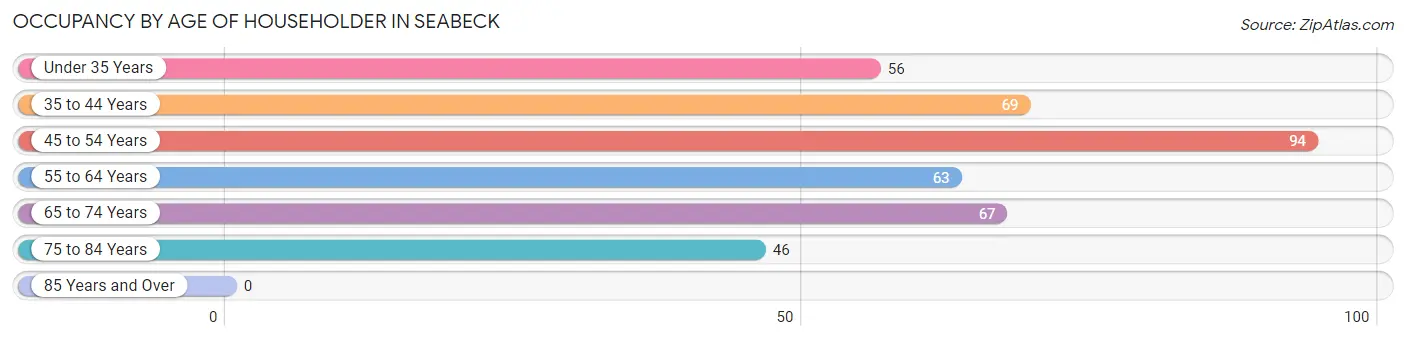
| Age Bracket | # Households | % Households |
| Under 35 Years | 56 | 14.2% |
| 35 to 44 Years | 69 | 17.5% |
| 45 to 54 Years | 94 | 23.8% |
| 55 to 64 Years | 63 | 16.0% |
| 65 to 74 Years | 67 | 17.0% |
| 75 to 84 Years | 46 | 11.7% |
| 85 Years and Over | 0 | 0.0% |
| Total | 395 | 100.0% |
Housing Finances in Seabeck
Median Income by Occupancy in Seabeck
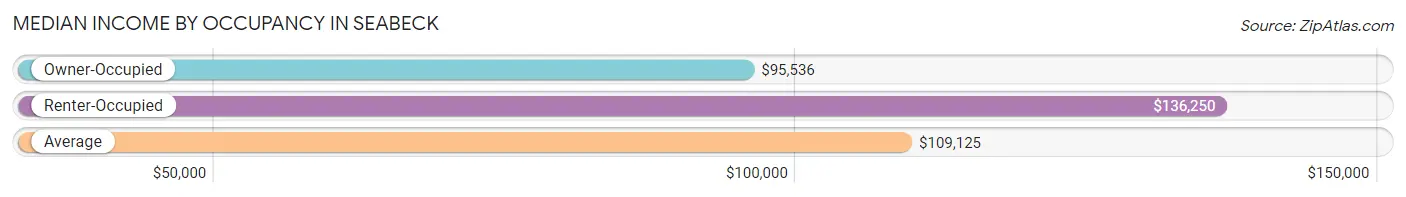
| Occupancy Type | # Households | Median Income |
| Owner-Occupied | 241 (61.0%) | $95,536 |
| Renter-Occupied | 154 (39.0%) | $136,250 |
| Average | 395 (100.0%) | $109,125 |
Occupancy by Householder Income Bracket in Seabeck
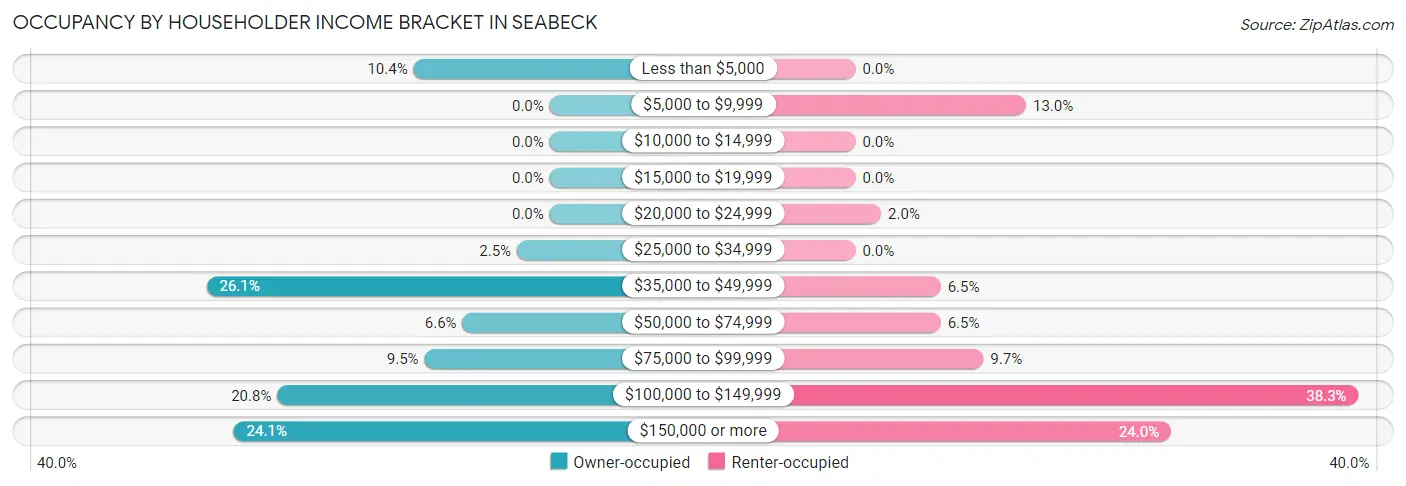
| Income Bracket | Owner-occupied | Renter-occupied |
| Less than $5,000 | 25 (10.4%) | 0 (0.0%) |
| $5,000 to $9,999 | 0 (0.0%) | 20 (13.0%) |
| $10,000 to $14,999 | 0 (0.0%) | 0 (0.0%) |
| $15,000 to $19,999 | 0 (0.0%) | 0 (0.0%) |
| $20,000 to $24,999 | 0 (0.0%) | 3 (1.9%) |
| $25,000 to $34,999 | 6 (2.5%) | 0 (0.0%) |
| $35,000 to $49,999 | 63 (26.1%) | 10 (6.5%) |
| $50,000 to $74,999 | 16 (6.6%) | 10 (6.5%) |
| $75,000 to $99,999 | 23 (9.5%) | 15 (9.7%) |
| $100,000 to $149,999 | 50 (20.7%) | 59 (38.3%) |
| $150,000 or more | 58 (24.1%) | 37 (24.0%) |
| Total | 241 (100.0%) | 154 (100.0%) |
Monthly Housing Cost Tiers in Seabeck
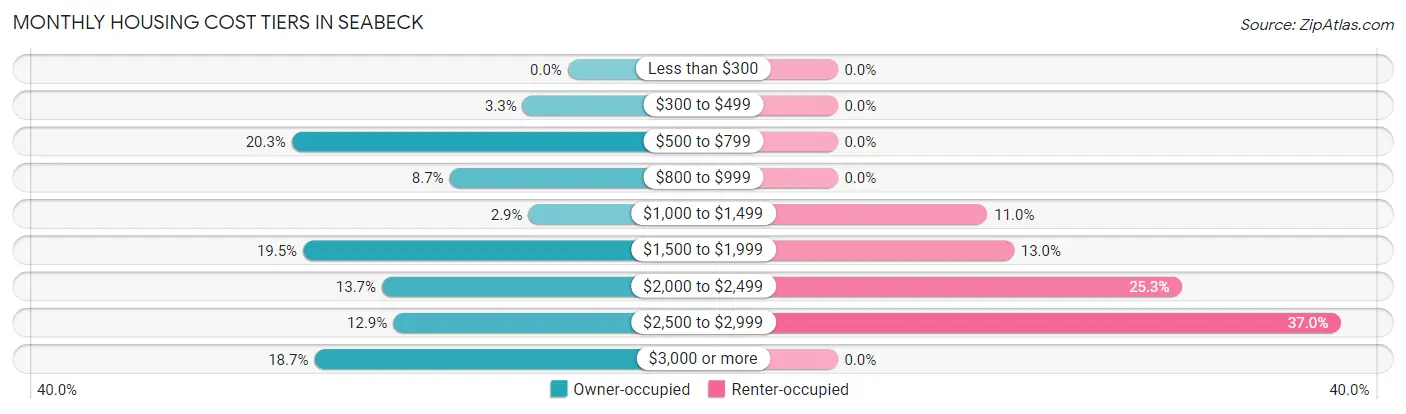
| Monthly Cost | Owner-occupied | Renter-occupied |
| Less than $300 | 0 (0.0%) | 0 (0.0%) |
| $300 to $499 | 8 (3.3%) | 0 (0.0%) |
| $500 to $799 | 49 (20.3%) | 0 (0.0%) |
| $800 to $999 | 21 (8.7%) | 0 (0.0%) |
| $1,000 to $1,499 | 7 (2.9%) | 17 (11.0%) |
| $1,500 to $1,999 | 47 (19.5%) | 20 (13.0%) |
| $2,000 to $2,499 | 33 (13.7%) | 39 (25.3%) |
| $2,500 to $2,999 | 31 (12.9%) | 57 (37.0%) |
| $3,000 or more | 45 (18.7%) | 0 (0.0%) |
| Total | 241 (100.0%) | 154 (100.0%) |
Physical Housing Characteristics in Seabeck
Housing Structures in Seabeck
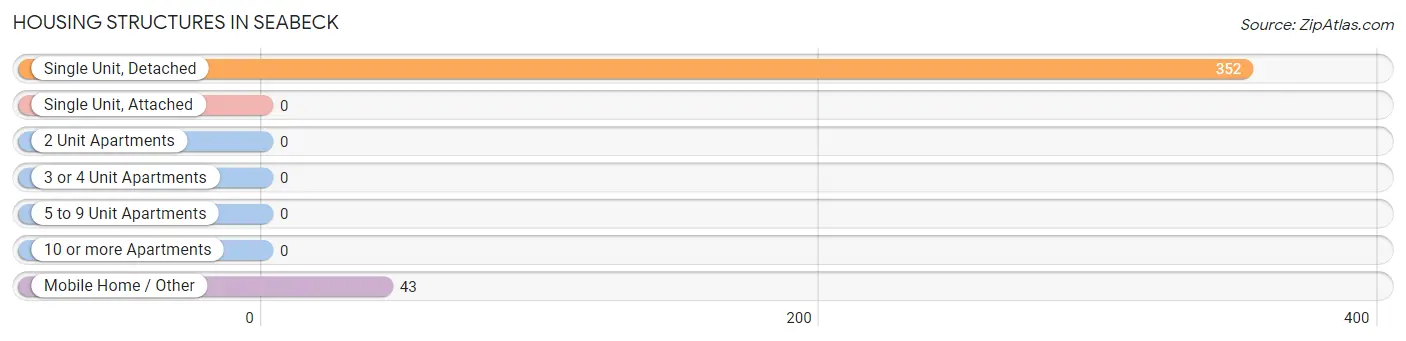
| Structure Type | # Housing Units | % Housing Units |
| Single Unit, Detached | 352 | 89.1% |
| Single Unit, Attached | 0 | 0.0% |
| 2 Unit Apartments | 0 | 0.0% |
| 3 or 4 Unit Apartments | 0 | 0.0% |
| 5 to 9 Unit Apartments | 0 | 0.0% |
| 10 or more Apartments | 0 | 0.0% |
| Mobile Home / Other | 43 | 10.9% |
| Total | 395 | 100.0% |
Housing Structures by Occupancy in Seabeck
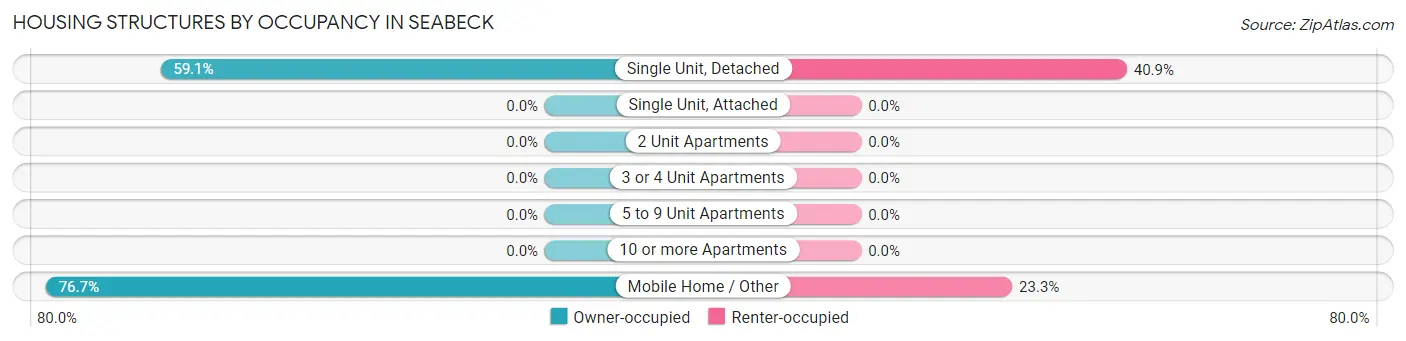
| Structure Type | Owner-occupied | Renter-occupied |
| Single Unit, Detached | 208 (59.1%) | 144 (40.9%) |
| Single Unit, Attached | 0 (0.0%) | 0 (0.0%) |
| 2 Unit Apartments | 0 (0.0%) | 0 (0.0%) |
| 3 or 4 Unit Apartments | 0 (0.0%) | 0 (0.0%) |
| 5 to 9 Unit Apartments | 0 (0.0%) | 0 (0.0%) |
| 10 or more Apartments | 0 (0.0%) | 0 (0.0%) |
| Mobile Home / Other | 33 (76.7%) | 10 (23.3%) |
| Total | 241 (61.0%) | 154 (39.0%) |
Housing Structures by Number of Rooms in Seabeck
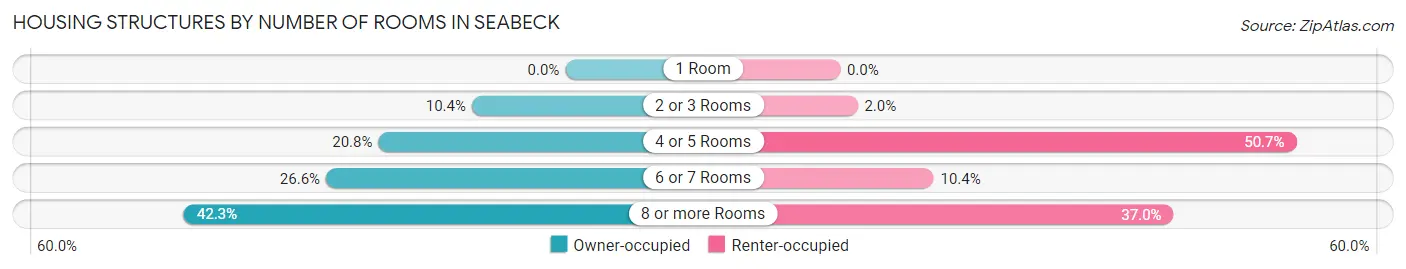
| Number of Rooms | Owner-occupied | Renter-occupied |
| 1 Room | 0 (0.0%) | 0 (0.0%) |
| 2 or 3 Rooms | 25 (10.4%) | 3 (1.9%) |
| 4 or 5 Rooms | 50 (20.7%) | 78 (50.6%) |
| 6 or 7 Rooms | 64 (26.6%) | 16 (10.4%) |
| 8 or more Rooms | 102 (42.3%) | 57 (37.0%) |
| Total | 241 (100.0%) | 154 (100.0%) |
Housing Structure by Heating Type in Seabeck
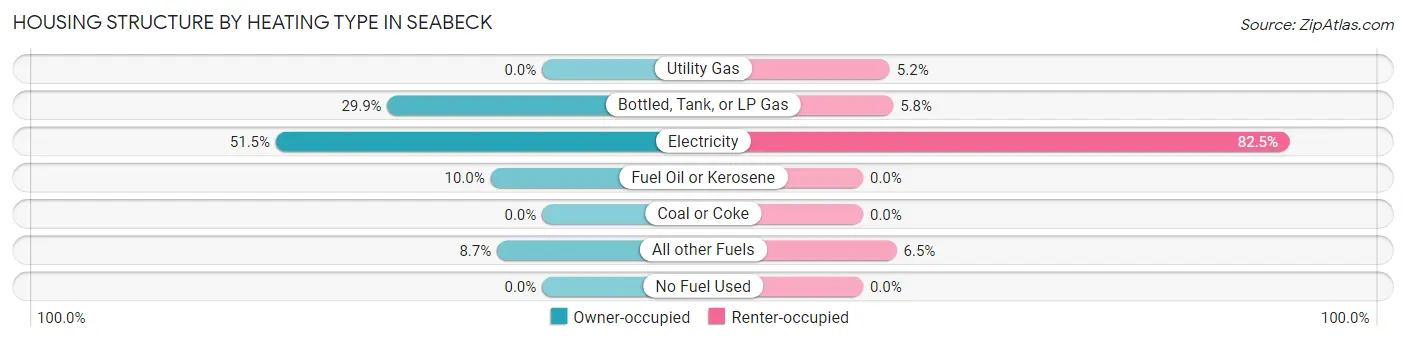
| Heating Type | Owner-occupied | Renter-occupied |
| Utility Gas | 0 (0.0%) | 8 (5.2%) |
| Bottled, Tank, or LP Gas | 72 (29.9%) | 9 (5.8%) |
| Electricity | 124 (51.4%) | 127 (82.5%) |
| Fuel Oil or Kerosene | 24 (10.0%) | 0 (0.0%) |
| Coal or Coke | 0 (0.0%) | 0 (0.0%) |
| All other Fuels | 21 (8.7%) | 10 (6.5%) |
| No Fuel Used | 0 (0.0%) | 0 (0.0%) |
| Total | 241 (100.0%) | 154 (100.0%) |
Household Vehicle Usage in Seabeck
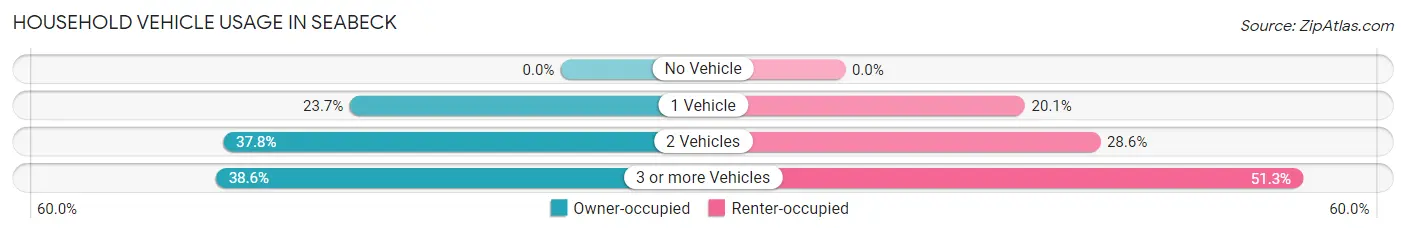
| Vehicles per Household | Owner-occupied | Renter-occupied |
| No Vehicle | 0 (0.0%) | 0 (0.0%) |
| 1 Vehicle | 57 (23.6%) | 31 (20.1%) |
| 2 Vehicles | 91 (37.8%) | 44 (28.6%) |
| 3 or more Vehicles | 93 (38.6%) | 79 (51.3%) |
| Total | 241 (100.0%) | 154 (100.0%) |
Real Estate & Mortgages in Seabeck
Real Estate and Mortgage Overview in Seabeck
| Characteristic | Without Mortgage | With Mortgage |
| Housing Units | 103 | 138 |
| Median Property Value | $504,600 | $643,800 |
| Median Household Income | $65,139 | $40 |
| Monthly Housing Costs | $774 | $45 |
| Real Estate Taxes | $4,575 | $0 |
Property Value by Mortgage Status in Seabeck
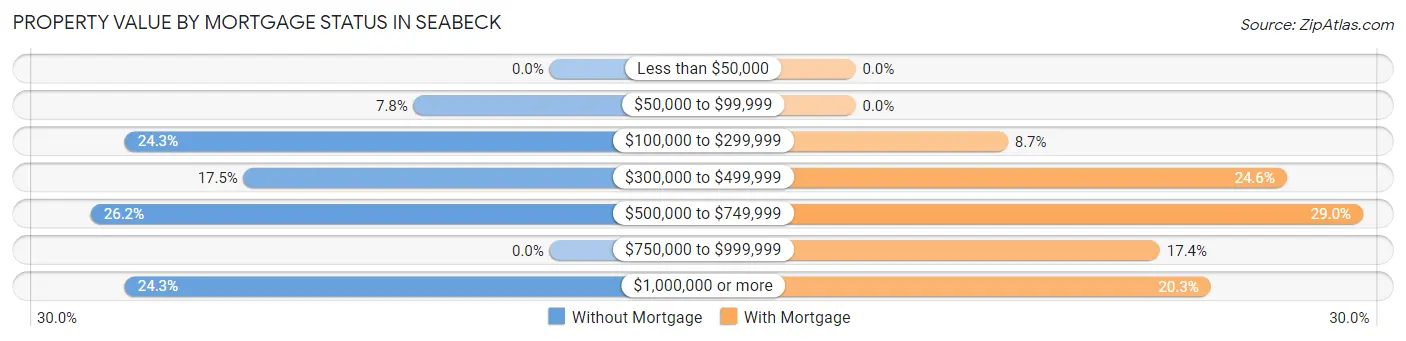
| Property Value | Without Mortgage | With Mortgage |
| Less than $50,000 | 0 (0.0%) | 0 (0.0%) |
| $50,000 to $99,999 | 8 (7.8%) | 0 (0.0%) |
| $100,000 to $299,999 | 25 (24.3%) | 12 (8.7%) |
| $300,000 to $499,999 | 18 (17.5%) | 34 (24.6%) |
| $500,000 to $749,999 | 27 (26.2%) | 40 (29.0%) |
| $750,000 to $999,999 | 0 (0.0%) | 24 (17.4%) |
| $1,000,000 or more | 25 (24.3%) | 28 (20.3%) |
| Total | 103 (100.0%) | 138 (100.0%) |
Household Income by Mortgage Status in Seabeck
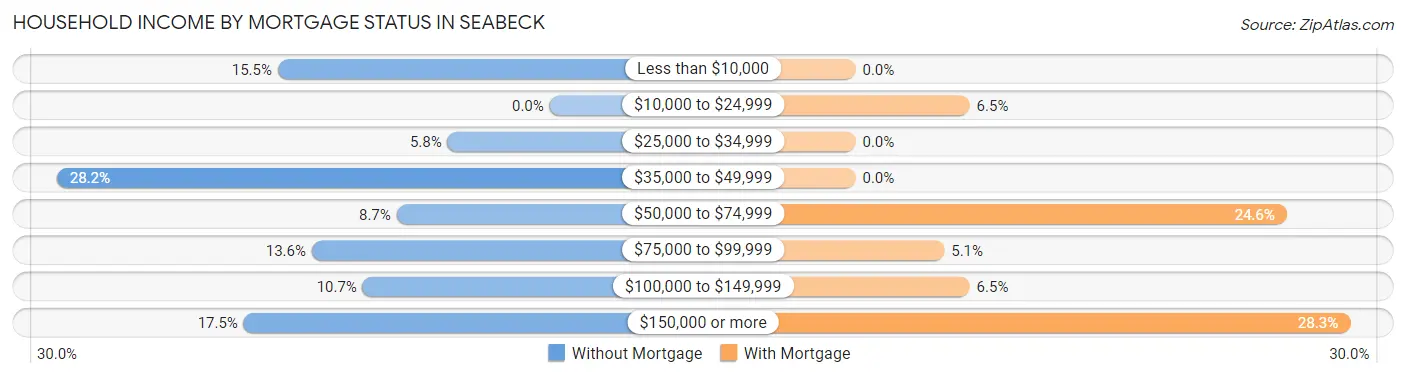
| Household Income | Without Mortgage | With Mortgage |
| Less than $10,000 | 16 (15.5%) | 0 (0.0%) |
| $10,000 to $24,999 | 0 (0.0%) | 9 (6.5%) |
| $25,000 to $34,999 | 6 (5.8%) | 0 (0.0%) |
| $35,000 to $49,999 | 29 (28.2%) | 0 (0.0%) |
| $50,000 to $74,999 | 9 (8.7%) | 34 (24.6%) |
| $75,000 to $99,999 | 14 (13.6%) | 7 (5.1%) |
| $100,000 to $149,999 | 11 (10.7%) | 9 (6.5%) |
| $150,000 or more | 18 (17.5%) | 39 (28.3%) |
| Total | 103 (100.0%) | 138 (100.0%) |
Property Value to Household Income Ratio in Seabeck
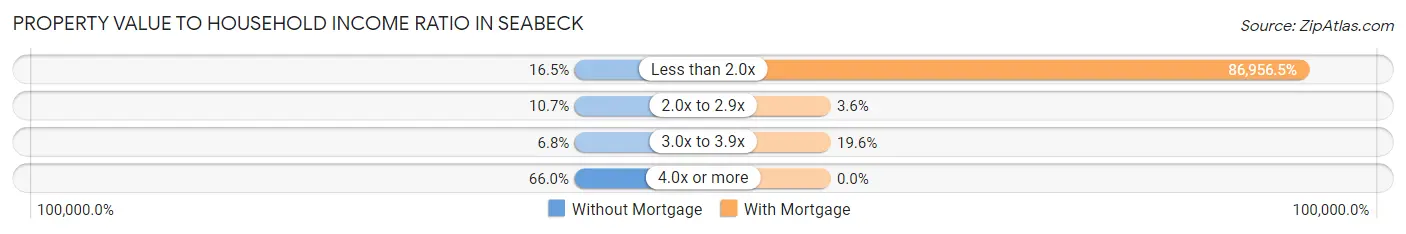
| Value-to-Income Ratio | Without Mortgage | With Mortgage |
| Less than 2.0x | 17 (16.5%) | 120,000 (86,956.5%) |
| 2.0x to 2.9x | 11 (10.7%) | 5 (3.6%) |
| 3.0x to 3.9x | 7 (6.8%) | 27 (19.6%) |
| 4.0x or more | 68 (66.0%) | 0 (0.0%) |
| Total | 103 (100.0%) | 138 (100.0%) |
Real Estate Taxes by Mortgage Status in Seabeck
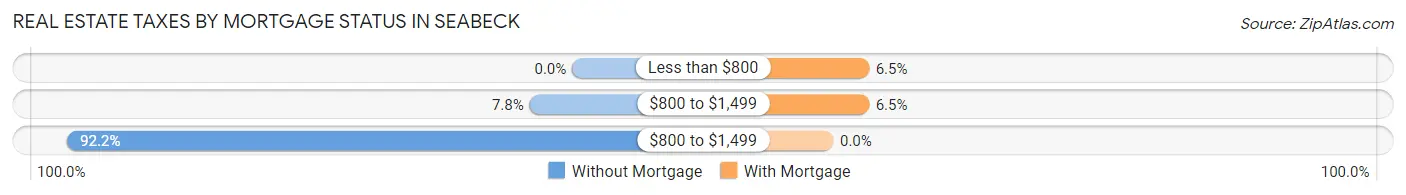
| Property Taxes | Without Mortgage | With Mortgage |
| Less than $800 | 0 (0.0%) | 9 (6.5%) |
| $800 to $1,499 | 8 (7.8%) | 9 (6.5%) |
| $800 to $1,499 | 95 (92.2%) | 0 (0.0%) |
| Total | 103 (100.0%) | 138 (100.0%) |
Health & Disability in Seabeck
Health Insurance Coverage by Age in Seabeck
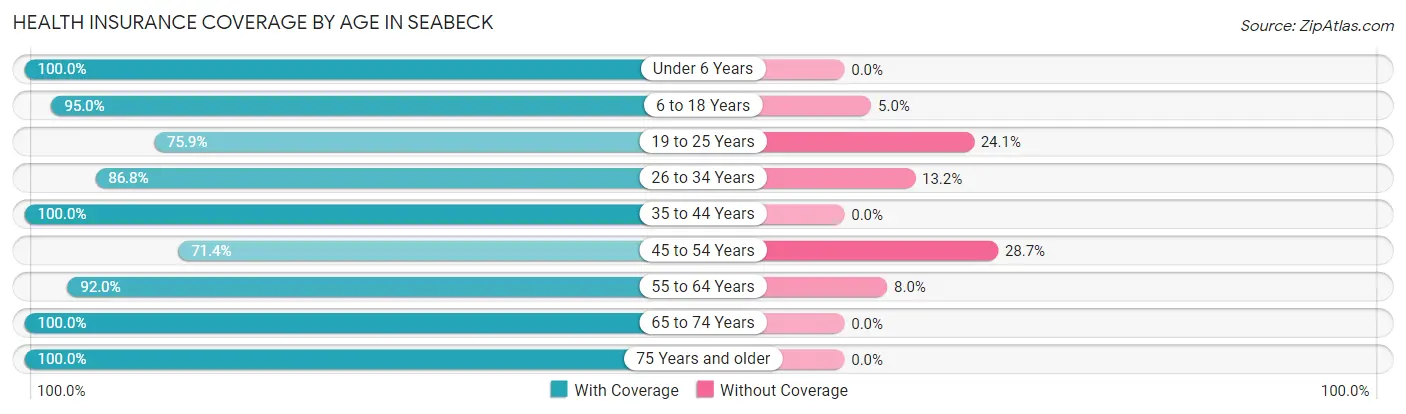
| Age Bracket | With Coverage | Without Coverage |
| Under 6 Years | 35 (100.0%) | 0 (0.0%) |
| 6 to 18 Years | 133 (95.0%) | 7 (5.0%) |
| 19 to 25 Years | 22 (75.9%) | 7 (24.1%) |
| 26 to 34 Years | 79 (86.8%) | 12 (13.2%) |
| 35 to 44 Years | 85 (100.0%) | 0 (0.0%) |
| 45 to 54 Years | 132 (71.4%) | 53 (28.6%) |
| 55 to 64 Years | 150 (92.0%) | 13 (8.0%) |
| 65 to 74 Years | 95 (100.0%) | 0 (0.0%) |
| 75 Years and older | 63 (100.0%) | 0 (0.0%) |
| Total | 794 (89.6%) | 92 (10.4%) |
Health Insurance Coverage by Citizenship Status in Seabeck
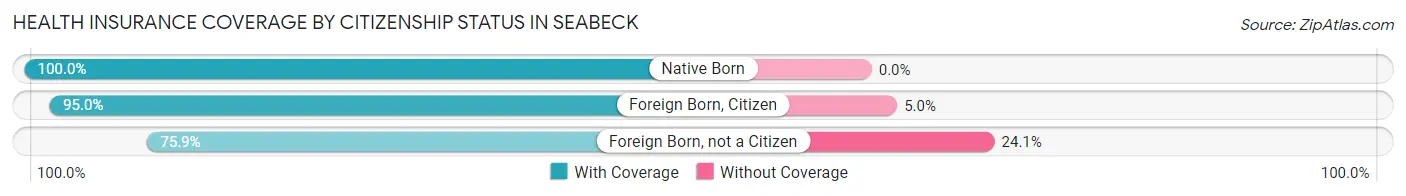
| Citizenship Status | With Coverage | Without Coverage |
| Native Born | 35 (100.0%) | 0 (0.0%) |
| Foreign Born, Citizen | 133 (95.0%) | 7 (5.0%) |
| Foreign Born, not a Citizen | 22 (75.9%) | 7 (24.1%) |
Health Insurance Coverage by Household Income in Seabeck
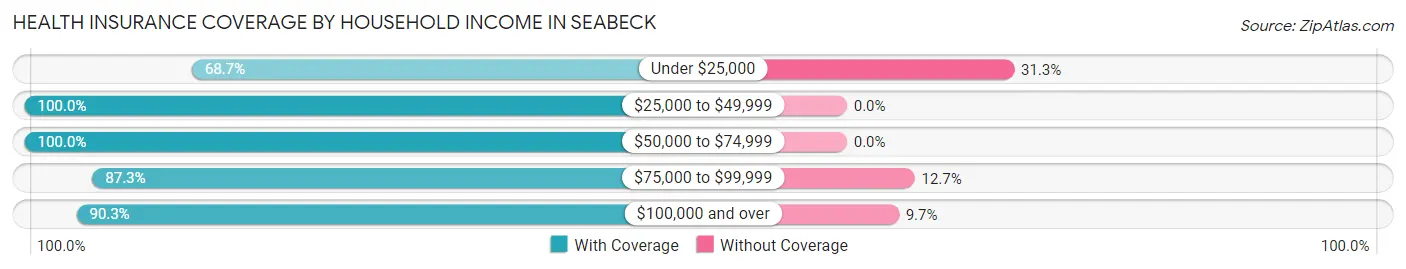
| Household Income | With Coverage | Without Coverage |
| Under $25,000 | 57 (68.7%) | 26 (31.3%) |
| $25,000 to $49,999 | 110 (100.0%) | 0 (0.0%) |
| $50,000 to $74,999 | 33 (100.0%) | 0 (0.0%) |
| $75,000 to $99,999 | 55 (87.3%) | 8 (12.7%) |
| $100,000 and over | 539 (90.3%) | 58 (9.7%) |
Public vs Private Health Insurance Coverage by Age in Seabeck
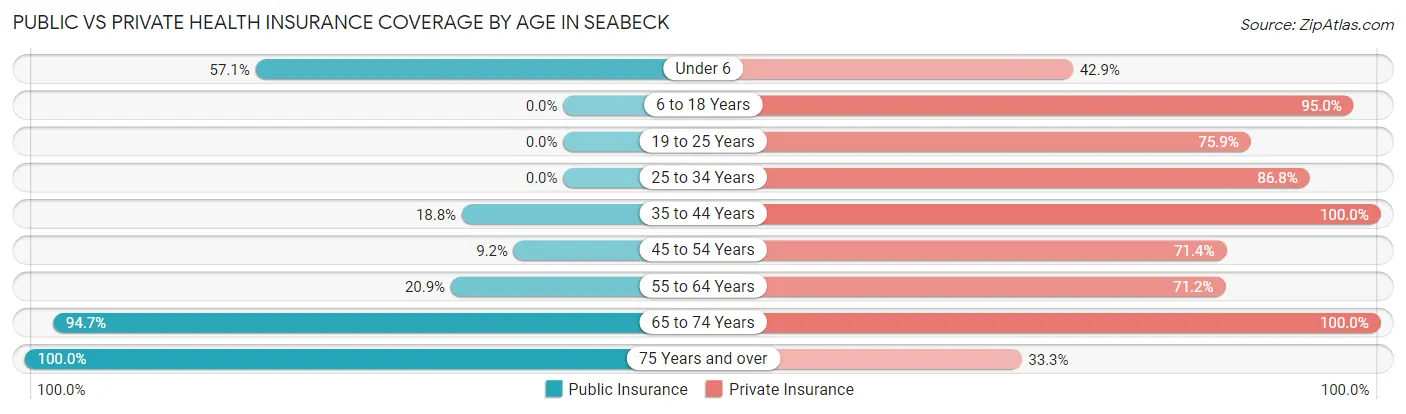
| Age Bracket | Public Insurance | Private Insurance |
| Under 6 | 20 (57.1%) | 15 (42.9%) |
| 6 to 18 Years | 0 (0.0%) | 133 (95.0%) |
| 19 to 25 Years | 0 (0.0%) | 22 (75.9%) |
| 25 to 34 Years | 0 (0.0%) | 79 (86.8%) |
| 35 to 44 Years | 16 (18.8%) | 85 (100.0%) |
| 45 to 54 Years | 17 (9.2%) | 132 (71.4%) |
| 55 to 64 Years | 34 (20.9%) | 116 (71.2%) |
| 65 to 74 Years | 90 (94.7%) | 95 (100.0%) |
| 75 Years and over | 63 (100.0%) | 21 (33.3%) |
| Total | 240 (27.1%) | 698 (78.8%) |
Disability Status by Sex by Age in Seabeck
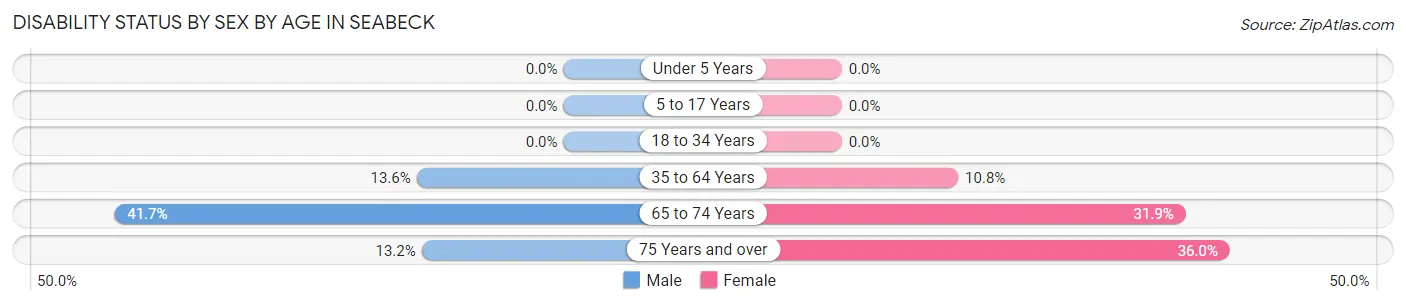
| Age Bracket | Male | Female |
| Under 5 Years | 0 (0.0%) | 0 (0.0%) |
| 5 to 17 Years | 0 (0.0%) | 0 (0.0%) |
| 18 to 34 Years | 0 (0.0%) | 0 (0.0%) |
| 35 to 64 Years | 35 (13.6%) | 19 (10.8%) |
| 65 to 74 Years | 20 (41.7%) | 15 (31.9%) |
| 75 Years and over | 5 (13.2%) | 9 (36.0%) |
Disability Class by Sex by Age in Seabeck
Disability Class: Hearing Difficulty
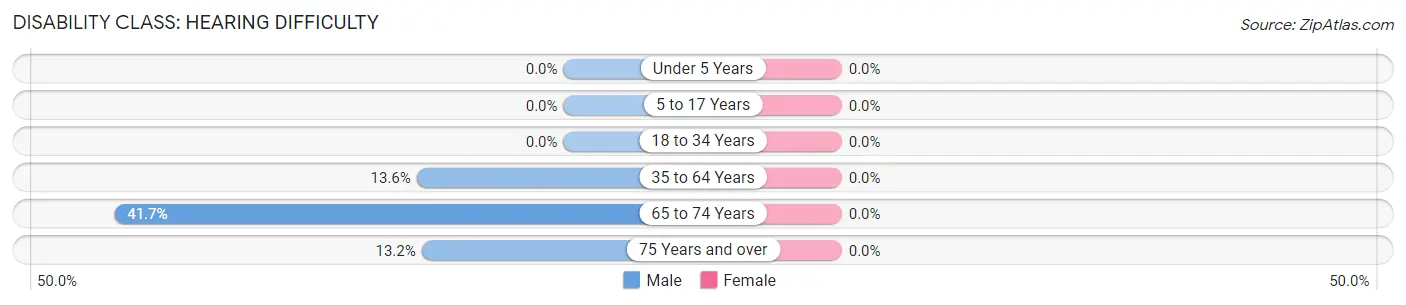
| Age Bracket | Male | Female |
| Under 5 Years | 0 (0.0%) | 0 (0.0%) |
| 5 to 17 Years | 0 (0.0%) | 0 (0.0%) |
| 18 to 34 Years | 0 (0.0%) | 0 (0.0%) |
| 35 to 64 Years | 35 (13.6%) | 0 (0.0%) |
| 65 to 74 Years | 20 (41.7%) | 0 (0.0%) |
| 75 Years and over | 5 (13.2%) | 0 (0.0%) |
Disability Class: Vision Difficulty
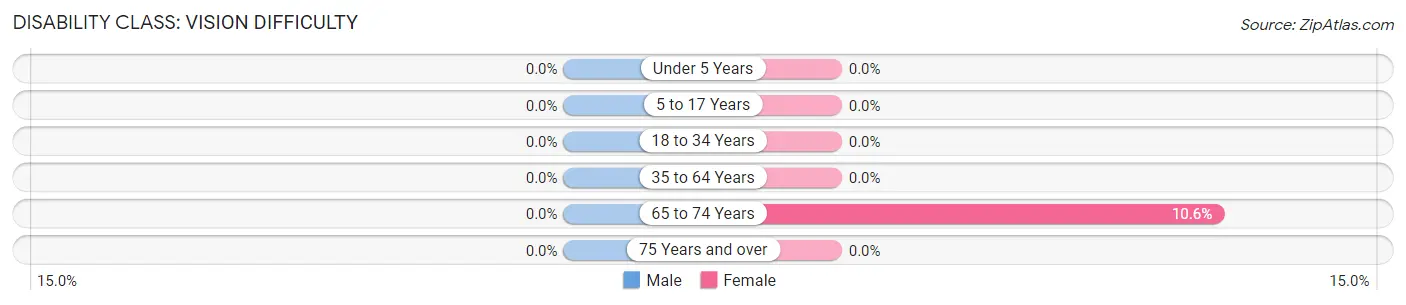
| Age Bracket | Male | Female |
| Under 5 Years | 0 (0.0%) | 0 (0.0%) |
| 5 to 17 Years | 0 (0.0%) | 0 (0.0%) |
| 18 to 34 Years | 0 (0.0%) | 0 (0.0%) |
| 35 to 64 Years | 0 (0.0%) | 0 (0.0%) |
| 65 to 74 Years | 0 (0.0%) | 5 (10.6%) |
| 75 Years and over | 0 (0.0%) | 0 (0.0%) |
Disability Class: Cognitive Difficulty
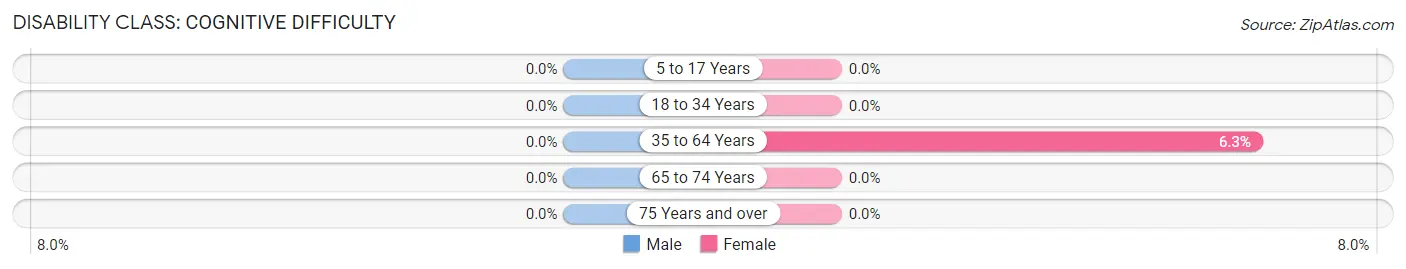
| Age Bracket | Male | Female |
| 5 to 17 Years | 0 (0.0%) | 0 (0.0%) |
| 18 to 34 Years | 0 (0.0%) | 0 (0.0%) |
| 35 to 64 Years | 0 (0.0%) | 11 (6.2%) |
| 65 to 74 Years | 0 (0.0%) | 0 (0.0%) |
| 75 Years and over | 0 (0.0%) | 0 (0.0%) |
Disability Class: Ambulatory Difficulty
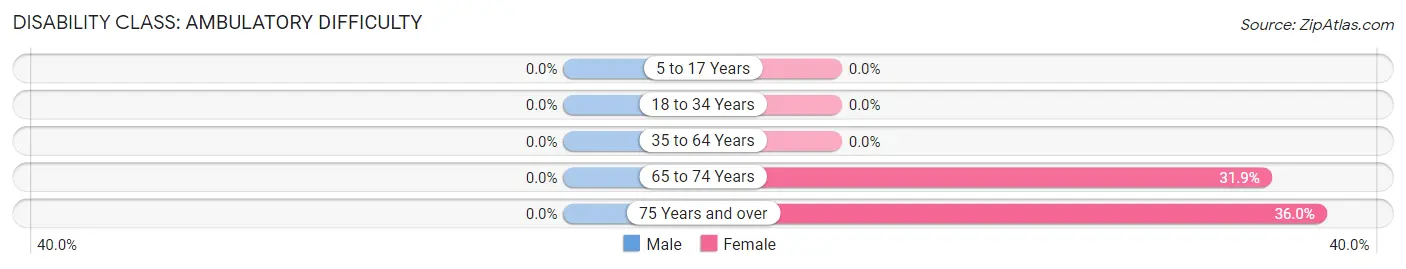
| Age Bracket | Male | Female |
| 5 to 17 Years | 0 (0.0%) | 0 (0.0%) |
| 18 to 34 Years | 0 (0.0%) | 0 (0.0%) |
| 35 to 64 Years | 0 (0.0%) | 0 (0.0%) |
| 65 to 74 Years | 0 (0.0%) | 15 (31.9%) |
| 75 Years and over | 0 (0.0%) | 9 (36.0%) |
Disability Class: Self-Care Difficulty
| Age Bracket | Male | Female |
| 5 to 17 Years | 0 (0.0%) | 0 (0.0%) |
| 18 to 34 Years | 0 (0.0%) | 0 (0.0%) |
| 35 to 64 Years | 0 (0.0%) | 0 (0.0%) |
| 65 to 74 Years | 0 (0.0%) | 0 (0.0%) |
| 75 Years and over | 0 (0.0%) | 0 (0.0%) |
Technology Access in Seabeck
Computing Device Access in Seabeck
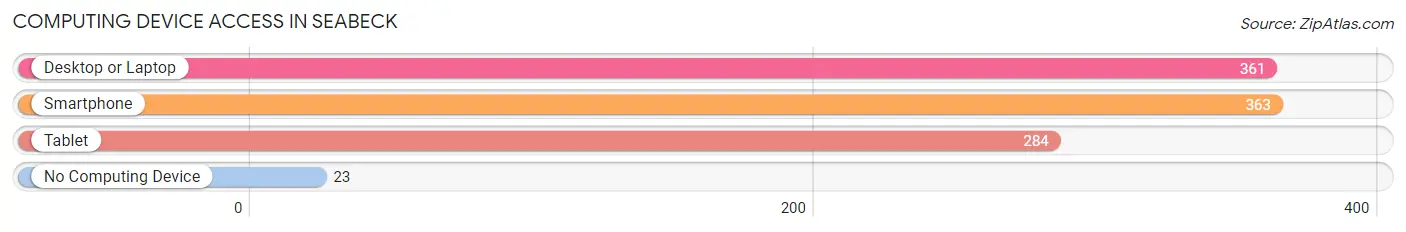
| Device Type | # Households | % Households |
| Desktop or Laptop | 361 | 91.4% |
| Smartphone | 363 | 91.9% |
| Tablet | 284 | 71.9% |
| No Computing Device | 23 | 5.8% |
| Total | 395 | 100.0% |
Internet Access in Seabeck
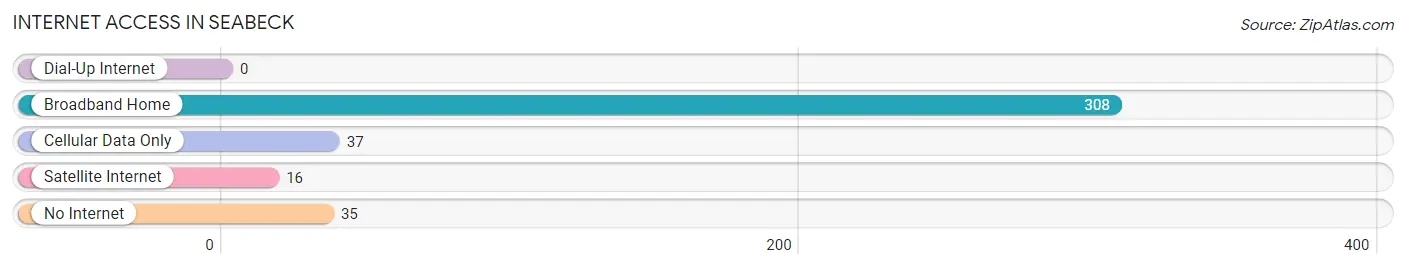
| Internet Type | # Households | % Households |
| Dial-Up Internet | 0 | 0.0% |
| Broadband Home | 308 | 78.0% |
| Cellular Data Only | 37 | 9.4% |
| Satellite Internet | 16 | 4.1% |
| No Internet | 35 | 8.9% |
| Total | 395 | 100.0% |
Seabeck Summary
Seabeck, Washington is a small unincorporated community located in Kitsap County, Washington. It is situated on the Hood Canal, a fjord of the Puget Sound. The population of Seabeck was 1,717 at the 2010 census.
History
The area now known as Seabeck was first inhabited by the Suquamish Tribe, who lived in the area for thousands of years. The first European settlers arrived in the area in the mid-1800s, and the town was officially founded in 1854. The town was named after a local settler, William Seabeck, who was a prominent figure in the area.
The town was initially a logging and fishing community, and the local economy was largely based on these industries. In the early 1900s, the town began to grow and develop, and the population increased. The town was incorporated in 1909, and the first post office was established in 1910.
Geography
Seabeck is located in Kitsap County, Washington, on the Hood Canal. The town is situated on the western shore of the canal, and is surrounded by forests and mountains. The town is located approximately 25 miles northwest of Seattle, and is accessible by car via State Route 3.
The climate in Seabeck is mild and temperate, with warm summers and cool winters. The average annual temperature is around 50 degrees Fahrenheit, and the average annual precipitation is around 40 inches.
Economy
The economy of Seabeck is largely based on tourism and recreation. The town is a popular destination for outdoor activities such as fishing, boating, and hiking. The town is also home to several marinas, which provide services for boaters.
In addition to tourism and recreation, the town is also home to several small businesses, including restaurants, shops, and galleries. The town is also home to a number of small farms, which produce a variety of fruits and vegetables.
Demographics
As of the 2010 census, the population of Seabeck was 1,717. The racial makeup of the town was 94.3% White, 0.7% African American, 0.7% Native American, 0.7% Asian, 0.2% Pacific Islander, and 2.6% from other races. The median household income was $50,938, and the median family income was $58,938.
Conclusion
Seabeck, Washington is a small unincorporated community located in Kitsap County, Washington. It is situated on the Hood Canal, a fjord of the Puget Sound. The town was founded in 1854, and was initially a logging and fishing community. Today, the economy of Seabeck is largely based on tourism and recreation, and the town is home to several small businesses, farms, and marinas. The population of Seabeck was 1,717 at the 2010 census, and the median household income was $50,938.
Common Questions
What is Per Capita Income in Seabeck?
Per Capita income in Seabeck is $64,457.
What is the Median Family Income in Seabeck?
Median Family Income in Seabeck is $122,321.
What is the Median Household income in Seabeck?
Median Household Income in Seabeck is $109,125.
What is Income or Wage Gap in Seabeck?
Income or Wage Gap in Seabeck is 47.4%.
Women in Seabeck earn 52.6 cents for every dollar earned by a man.
What is Inequality or Gini Index in Seabeck?
Inequality or Gini Index in Seabeck is 0.50.
What is the Total Population of Seabeck?
Total Population of Seabeck is 898.
What is the Total Male Population of Seabeck?
Total Male Population of Seabeck is 487.
What is the Total Female Population of Seabeck?
Total Female Population of Seabeck is 411.
What is the Ratio of Males per 100 Females in Seabeck?
There are 118.49 Males per 100 Females in Seabeck.
What is the Ratio of Females per 100 Males in Seabeck?
There are 84.39 Females per 100 Males in Seabeck.
What is the Median Population Age in Seabeck?
Median Population Age in Seabeck is 48.5 Years.
What is the Average Family Size in Seabeck
Average Family Size in Seabeck is 2.6 People.
What is the Average Household Size in Seabeck
Average Household Size in Seabeck is 2.3 People.
How Large is the Labor Force in Seabeck?
There are 455 People in the Labor Forcein in Seabeck.
What is the Percentage of People in the Labor Force in Seabeck?
58.8% of People are in the Labor Force in Seabeck.
What is the Unemployment Rate in Seabeck?
Unemployment Rate in Seabeck is 14.9%.