Port Ludlow, WA Map & Demographics
Port Ludlow Map
Port Ludlow Overview
$60,741
PER CAPITA INCOME
$117,019
AVG FAMILY INCOME
$86,891
AVG HOUSEHOLD INCOME
56.6%
WAGE / INCOME GAP [ % ]
43.4¢/ $1
WAGE / INCOME GAP [ $ ]
0.49
INEQUALITY / GINI INDEX
3,096
TOTAL POPULATION
1,497
MALE POPULATION
1,599
FEMALE POPULATION
93.62
MALES / 100 FEMALES
106.81
FEMALES / 100 MALES
64.4
MEDIAN AGE
2.5
AVG FAMILY SIZE
2.0
AVG HOUSEHOLD SIZE
1,003
LABOR FORCE [ PEOPLE ]
38.1%
PERCENT IN LABOR FORCE
5.3%
UNEMPLOYMENT RATE
Port Ludlow Zip Codes
Port Ludlow Area Codes
Income in Port Ludlow
Income Overview in Port Ludlow
Per Capita Income in Port Ludlow is $60,741, while median incomes of families and households are $117,019 and $86,891 respectively.
| Characteristic | Number | Measure |
| Per Capita Income | 3,096 | $60,741 |
| Median Family Income | 1,050 | $117,019 |
| Mean Family Income | 1,050 | $151,674 |
| Median Household Income | 1,507 | $86,891 |
| Mean Household Income | 1,507 | $124,602 |
| Income Deficit | 1,050 | $0 |
| Wage / Income Gap (%) | 3,096 | 56.57% |
| Wage / Income Gap ($) | 3,096 | 43.43¢ per $1 |
| Gini / Inequality Index | 3,096 | 0.49 |
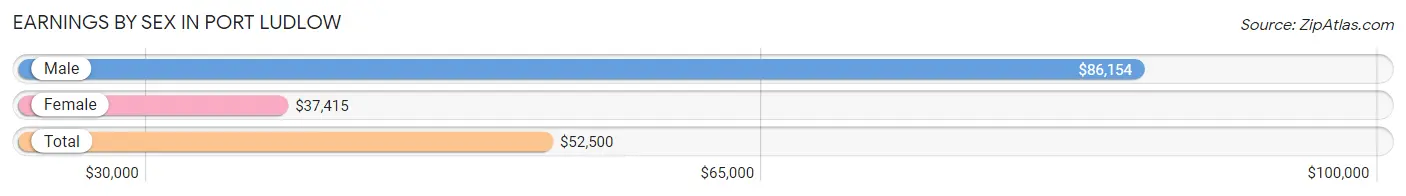
Earnings by Sex in Port Ludlow
Average Earnings in Port Ludlow are $52,500, $86,154 for men and $37,415 for women, a difference of 56.6%.
| Sex | Number | Average Earnings |
| Male | 584 (56.8%) | $86,154 |
| Female | 444 (43.2%) | $37,415 |
| Total | 1,028 (100.0%) | $52,500 |
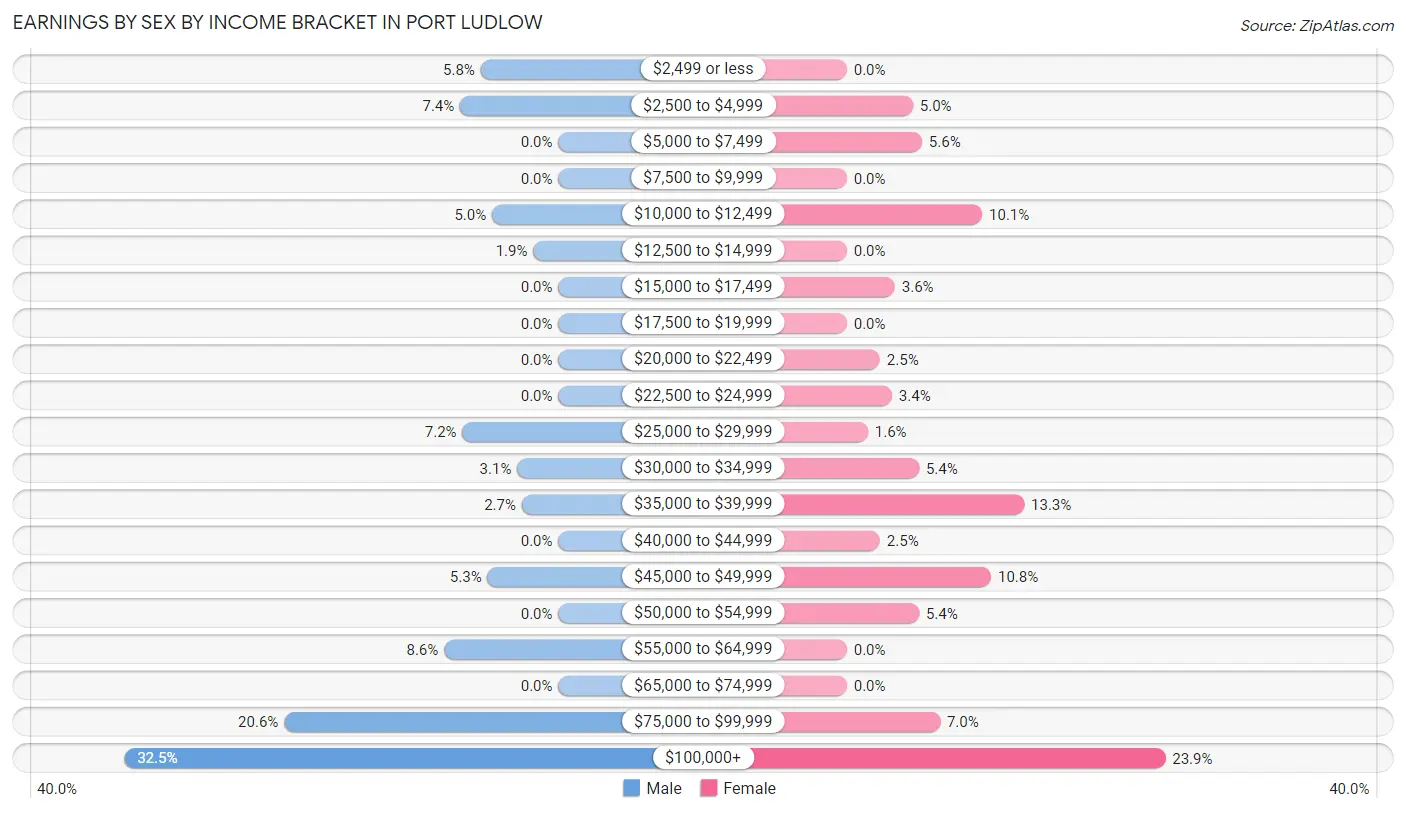
Earnings by Sex by Income Bracket in Port Ludlow
The most common earnings brackets in Port Ludlow are $100,000+ for men (190 | 32.5%) and $100,000+ for women (106 | 23.9%).
| Income | Male | Female |
| $2,499 or less | 34 (5.8%) | 0 (0.0%) |
| $2,500 to $4,999 | 43 (7.4%) | 22 (5.0%) |
| $5,000 to $7,499 | 0 (0.0%) | 25 (5.6%) |
| $7,500 to $9,999 | 0 (0.0%) | 0 (0.0%) |
| $10,000 to $12,499 | 29 (5.0%) | 45 (10.1%) |
| $12,500 to $14,999 | 11 (1.9%) | 0 (0.0%) |
| $15,000 to $17,499 | 0 (0.0%) | 16 (3.6%) |
| $17,500 to $19,999 | 0 (0.0%) | 0 (0.0%) |
| $20,000 to $22,499 | 0 (0.0%) | 11 (2.5%) |
| $22,500 to $24,999 | 0 (0.0%) | 15 (3.4%) |
| $25,000 to $29,999 | 42 (7.2%) | 7 (1.6%) |
| $30,000 to $34,999 | 18 (3.1%) | 24 (5.4%) |
| $35,000 to $39,999 | 16 (2.7%) | 59 (13.3%) |
| $40,000 to $44,999 | 0 (0.0%) | 11 (2.5%) |
| $45,000 to $49,999 | 31 (5.3%) | 48 (10.8%) |
| $50,000 to $54,999 | 0 (0.0%) | 24 (5.4%) |
| $55,000 to $64,999 | 50 (8.6%) | 0 (0.0%) |
| $65,000 to $74,999 | 0 (0.0%) | 0 (0.0%) |
| $75,000 to $99,999 | 120 (20.5%) | 31 (7.0%) |
| $100,000+ | 190 (32.5%) | 106 (23.9%) |
| Total | 584 (100.0%) | 444 (100.0%) |
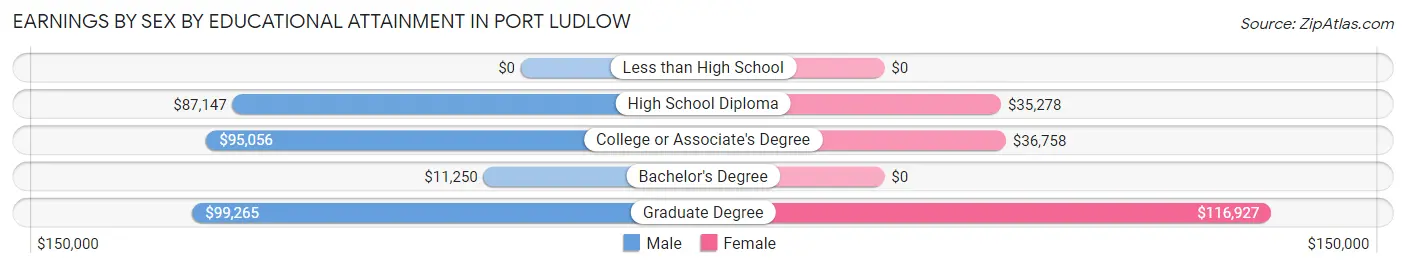
Earnings by Sex by Educational Attainment in Port Ludlow
Average earnings in Port Ludlow are $90,278 for men and $42,841 for women, a difference of 52.5%. Men with an educational attainment of graduate degree enjoy the highest average annual earnings of $99,265, while those with bachelor's degree education earn the least with $11,250. Women with an educational attainment of graduate degree earn the most with the average annual earnings of $116,927, while those with high school diploma education have the smallest earnings of $35,278.
| Educational Attainment | Male Income | Female Income |
| Less than High School | - | - |
| High School Diploma | $87,147 | $35,278 |
| College or Associate's Degree | $95,056 | $36,758 |
| Bachelor's Degree | $11,250 | $0 |
| Graduate Degree | $99,265 | $116,927 |
| Total | $90,278 | $42,841 |
Family Income in Port Ludlow
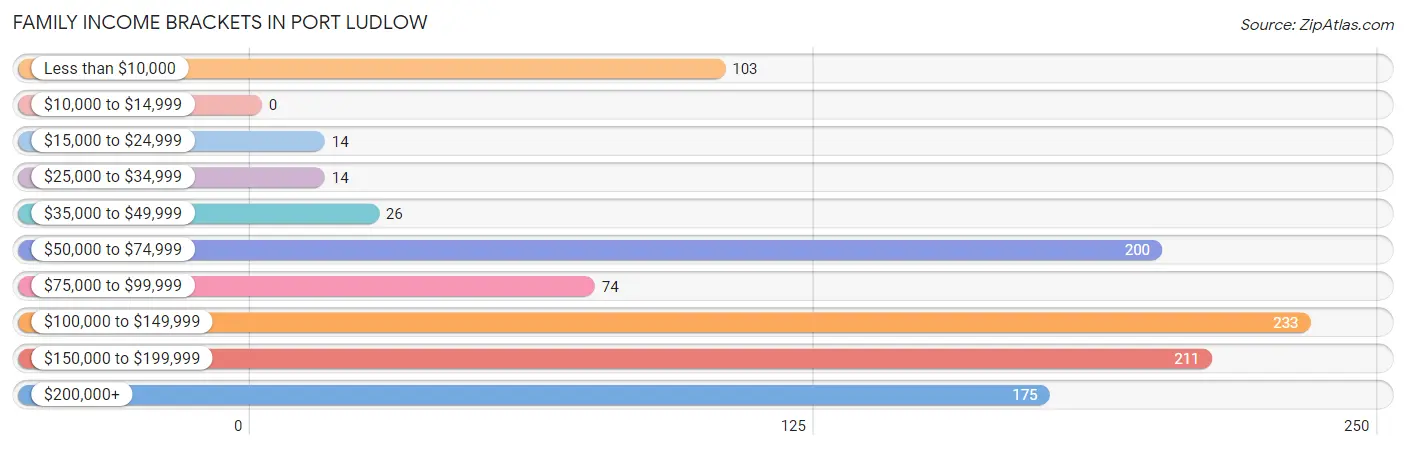
Family Income Brackets in Port Ludlow
According to the Port Ludlow family income data, there are 233 families falling into the $100,000 to $149,999 income range, which is the most common income bracket and makes up 22.2% of all families.
| Income Bracket | # Families | % Families |
| Less than $10,000 | 103 | 9.8% |
| $10,000 to $14,999 | 0 | 0.0% |
| $15,000 to $24,999 | 14 | 1.3% |
| $25,000 to $34,999 | 14 | 1.3% |
| $35,000 to $49,999 | 26 | 2.5% |
| $50,000 to $74,999 | 200 | 19.0% |
| $75,000 to $99,999 | 74 | 7.0% |
| $100,000 to $149,999 | 233 | 22.2% |
| $150,000 to $199,999 | 211 | 20.1% |
| $200,000+ | 175 | 16.7% |
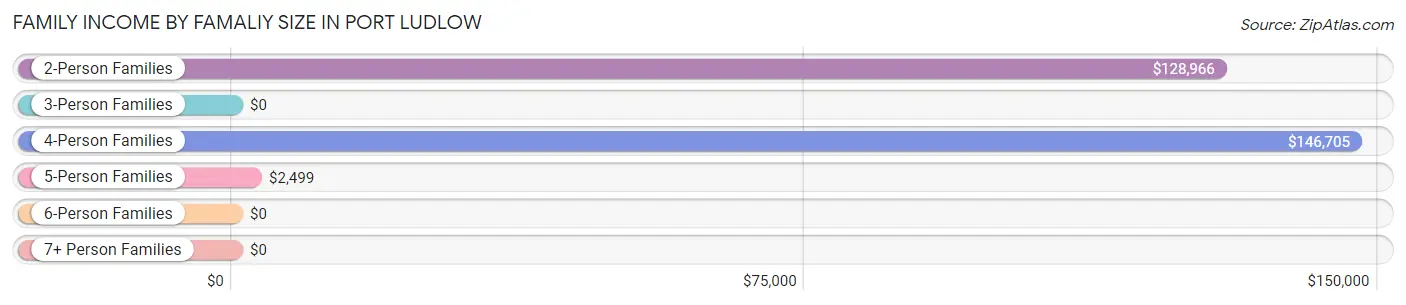
Family Income by Famaliy Size in Port Ludlow
4-person families (70 | 6.7%) account for the highest median family income in Port Ludlow with $146,705 per family, while 2-person families (790 | 75.2%) have the highest median income of $64,483 per family member.
| Income Bracket | # Families | Median Income |
| 2-Person Families | 790 (75.2%) | $128,966 |
| 3-Person Families | 116 (11.1%) | $0 |
| 4-Person Families | 70 (6.7%) | $146,705 |
| 5-Person Families | 74 (7.0%) | $2,499 |
| 6-Person Families | 0 (0.0%) | $0 |
| 7+ Person Families | 0 (0.0%) | $0 |
| Total | 1,050 (100.0%) | $117,019 |
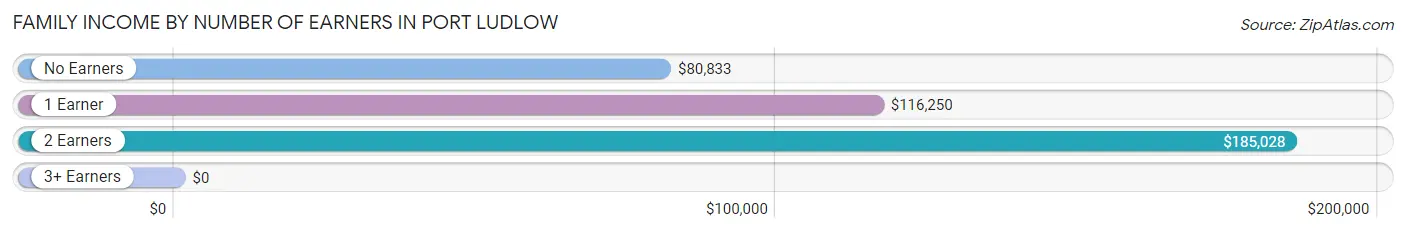
Family Income by Number of Earners in Port Ludlow
| Number of Earners | # Families | Median Income |
| No Earners | 454 (43.2%) | $80,833 |
| 1 Earner | 364 (34.7%) | $116,250 |
| 2 Earners | 205 (19.5%) | $185,028 |
| 3+ Earners | 27 (2.6%) | $0 |
| Total | 1,050 (100.0%) | $117,019 |
Household Income in Port Ludlow
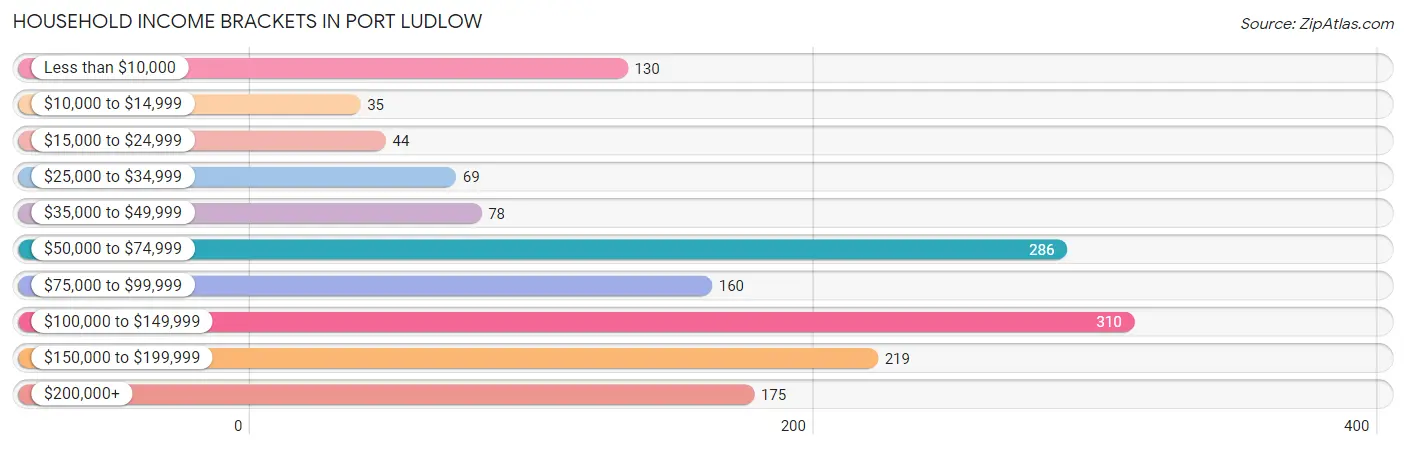
Household Income Brackets in Port Ludlow
With 310 households falling in the category, the $100,000 to $149,999 income range is the most frequent in Port Ludlow, accounting for 20.6% of all households. In contrast, only 35 households (2.3%) fall into the $10,000 to $14,999 income bracket, making it the least populous group.
| Income Bracket | # Households | % Households |
| Less than $10,000 | 130 | 8.6% |
| $10,000 to $14,999 | 35 | 2.3% |
| $15,000 to $24,999 | 44 | 2.9% |
| $25,000 to $34,999 | 69 | 4.6% |
| $35,000 to $49,999 | 78 | 5.2% |
| $50,000 to $74,999 | 286 | 19.0% |
| $75,000 to $99,999 | 160 | 10.6% |
| $100,000 to $149,999 | 310 | 20.6% |
| $150,000 to $199,999 | 219 | 14.5% |
| $200,000+ | 175 | 11.6% |
Household Income by Householder Age in Port Ludlow
The median household income in Port Ludlow is $86,891, with the highest median household income of $118,047 found in the 45 to 64 years age bracket for the primary householder. A total of 389 households (25.8%) fall into this category.
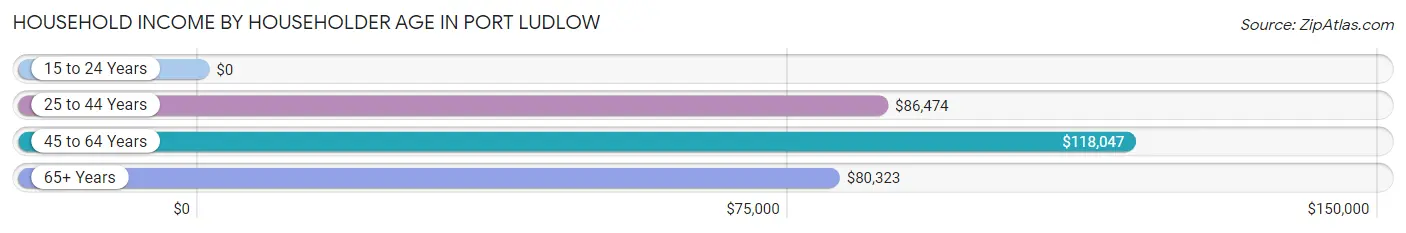
| Income Bracket | # Households | Median Income |
| 15 to 24 Years | 0 (0.0%) | $0 |
| 25 to 44 Years | 252 (16.7%) | $86,474 |
| 45 to 64 Years | 389 (25.8%) | $118,047 |
| 65+ Years | 866 (57.5%) | $80,323 |
| Total | 1,507 (100.0%) | $86,891 |
Poverty in Port Ludlow
Income Below Poverty by Sex and Age in Port Ludlow
With 14.2% poverty level for males and 12.3% for females among the residents of Port Ludlow, 15 year old males and 16 and 17 year old females are the most vulnerable to poverty, with 13 males (100.0%) and 8 females (100.0%) in their respective age groups living below the poverty level.
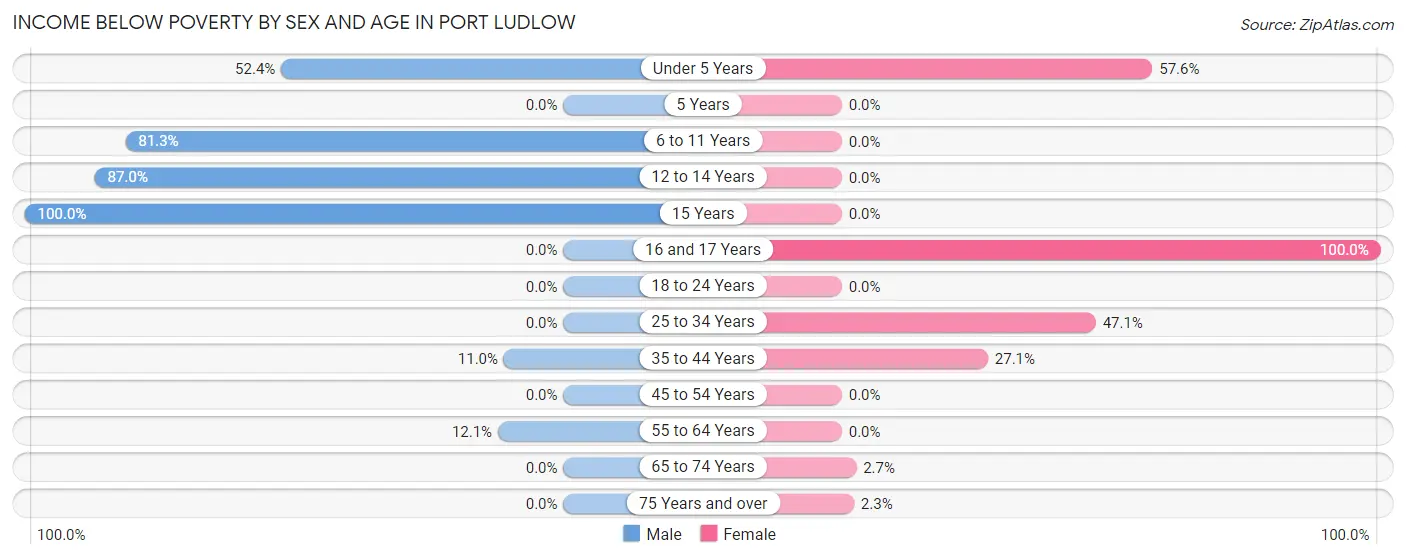
| Age Bracket | Male | Female |
| Under 5 Years | 11 (52.4%) | 83 (57.6%) |
| 5 Years | 0 (0.0%) | 0 (0.0%) |
| 6 to 11 Years | 87 (81.3%) | 0 (0.0%) |
| 12 to 14 Years | 67 (87.0%) | 0 (0.0%) |
| 15 Years | 13 (100.0%) | 0 (0.0%) |
| 16 and 17 Years | 0 (0.0%) | 8 (100.0%) |
| 18 to 24 Years | 0 (0.0%) | 0 (0.0%) |
| 25 to 34 Years | 0 (0.0%) | 41 (47.1%) |
| 35 to 44 Years | 17 (11.0%) | 45 (27.1%) |
| 45 to 54 Years | 0 (0.0%) | 0 (0.0%) |
| 55 to 64 Years | 17 (12.1%) | 0 (0.0%) |
| 65 to 74 Years | 0 (0.0%) | 10 (2.7%) |
| 75 Years and over | 0 (0.0%) | 9 (2.2%) |
| Total | 212 (14.2%) | 196 (12.3%) |
Income Above Poverty by Sex and Age in Port Ludlow
According to the poverty statistics in Port Ludlow, males aged 5 years and females aged 6 to 11 years are the age groups that are most secure financially, with 100.0% of males and 100.0% of females in these age groups living above the poverty line.
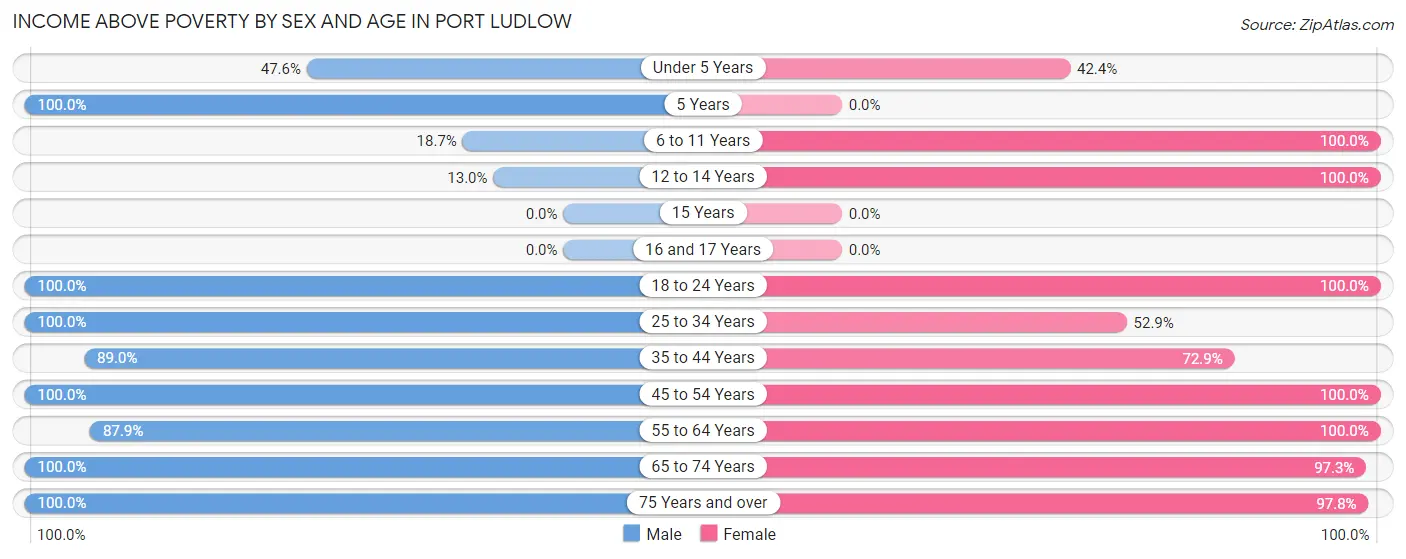
| Age Bracket | Male | Female |
| Under 5 Years | 10 (47.6%) | 61 (42.4%) |
| 5 Years | 28 (100.0%) | 0 (0.0%) |
| 6 to 11 Years | 20 (18.7%) | 55 (100.0%) |
| 12 to 14 Years | 10 (13.0%) | 19 (100.0%) |
| 15 Years | 0 (0.0%) | 0 (0.0%) |
| 16 and 17 Years | 0 (0.0%) | 0 (0.0%) |
| 18 to 24 Years | 44 (100.0%) | 18 (100.0%) |
| 25 to 34 Years | 61 (100.0%) | 46 (52.9%) |
| 35 to 44 Years | 137 (89.0%) | 121 (72.9%) |
| 45 to 54 Years | 137 (100.0%) | 92 (100.0%) |
| 55 to 64 Years | 123 (87.9%) | 235 (100.0%) |
| 65 to 74 Years | 354 (100.0%) | 365 (97.3%) |
| 75 Years and over | 361 (100.0%) | 391 (97.8%) |
| Total | 1,285 (85.8%) | 1,403 (87.7%) |
Income Below Poverty Among Married-Couple Families in Port Ludlow
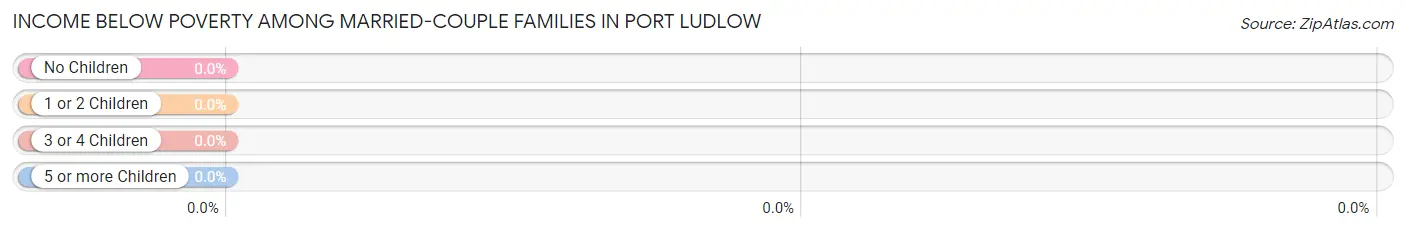
| Children | Above Poverty | Below Poverty |
| No Children | 782 (100.0%) | 0 (0.0%) |
| 1 or 2 Children | 78 (100.0%) | 0 (0.0%) |
| 3 or 4 Children | 16 (100.0%) | 0 (0.0%) |
| 5 or more Children | 0 (0.0%) | 0 (0.0%) |
| Total | 876 (100.0%) | 0 (0.0%) |
Income Below Poverty Among Single-Parent Households in Port Ludlow
According to the poverty data in Port Ludlow, 100.0% or 17 single-father households and 54.8% or 86 single-mother households are living below the poverty line. Among single-father households, those with 3 or 4 children have the highest poverty rate, with 17 households (100.0%) experiencing poverty. Likewise, among single-mother households, those with 1 or 2 children have the highest poverty rate, with 45 households (100.0%) falling below the poverty line.
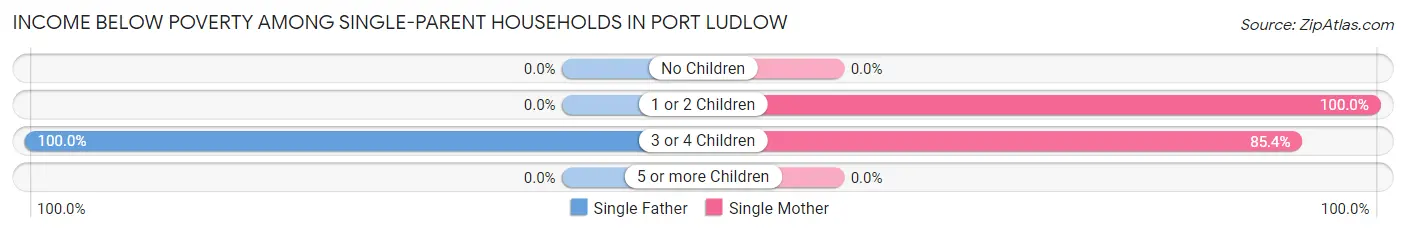
| Children | Single Father | Single Mother |
| No Children | 0 (0.0%) | 0 (0.0%) |
| 1 or 2 Children | 0 (0.0%) | 45 (100.0%) |
| 3 or 4 Children | 17 (100.0%) | 41 (85.4%) |
| 5 or more Children | 0 (0.0%) | 0 (0.0%) |
| Total | 17 (100.0%) | 86 (54.8%) |
Income Below Poverty Among Married-Couple vs Single-Parent Households in Port Ludlow
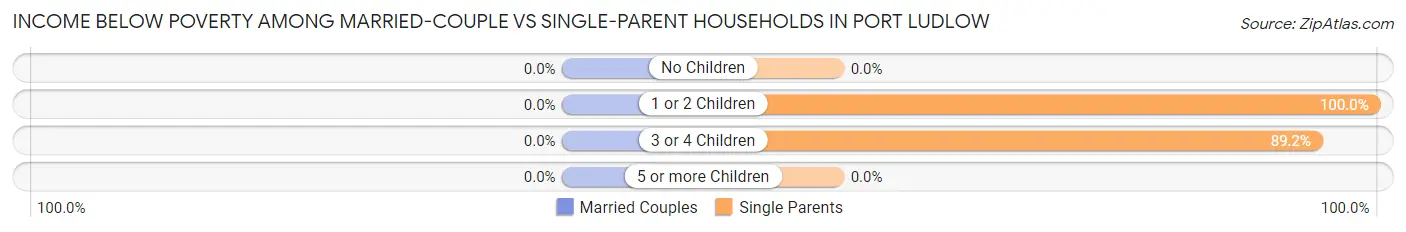
| Children | Married-Couple Families | Single-Parent Households |
| No Children | 0 (0.0%) | 0 (0.0%) |
| 1 or 2 Children | 0 (0.0%) | 45 (100.0%) |
| 3 or 4 Children | 0 (0.0%) | 58 (89.2%) |
| 5 or more Children | 0 (0.0%) | 0 (0.0%) |
| Total | 0 (0.0%) | 103 (59.2%) |
Race in Port Ludlow
The most populous races in Port Ludlow are White / Caucasian (2,805 | 90.6%), Hispanic or Latino (302 | 9.8%), and Two or more Races (155 | 5.0%).
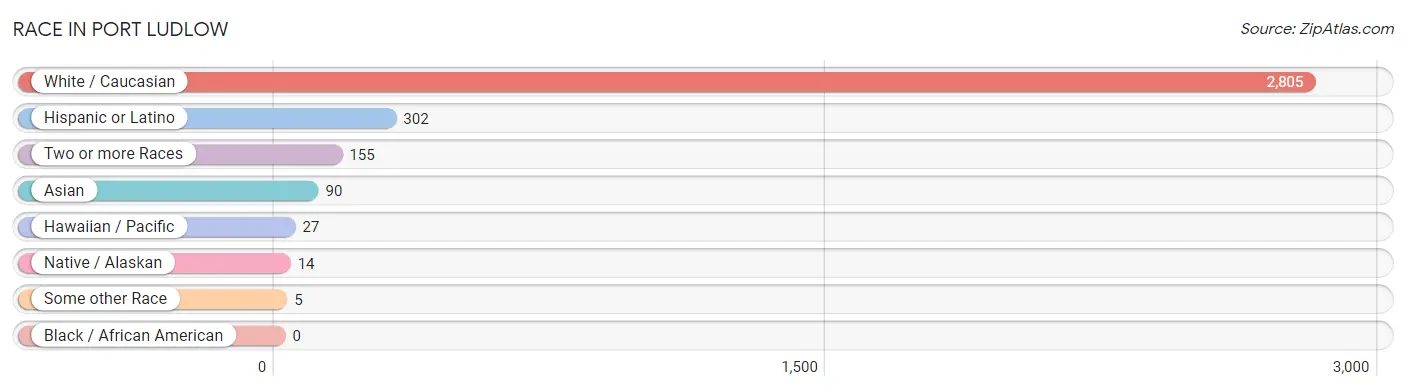
| Race | # Population | % Population |
| Asian | 90 | 2.9% |
| Black / African American | 0 | 0.0% |
| Hawaiian / Pacific | 27 | 0.9% |
| Hispanic or Latino | 302 | 9.8% |
| Native / Alaskan | 14 | 0.4% |
| White / Caucasian | 2,805 | 90.6% |
| Two or more Races | 155 | 5.0% |
| Some other Race | 5 | 0.2% |
| Total | 3,096 | 100.0% |
Ancestry in Port Ludlow
The most populous ancestries reported in Port Ludlow are English (610 | 19.7%), German (491 | 15.9%), Irish (444 | 14.3%), Russian (236 | 7.6%), and French (195 | 6.3%), together accounting for 63.8% of all Port Ludlow residents.
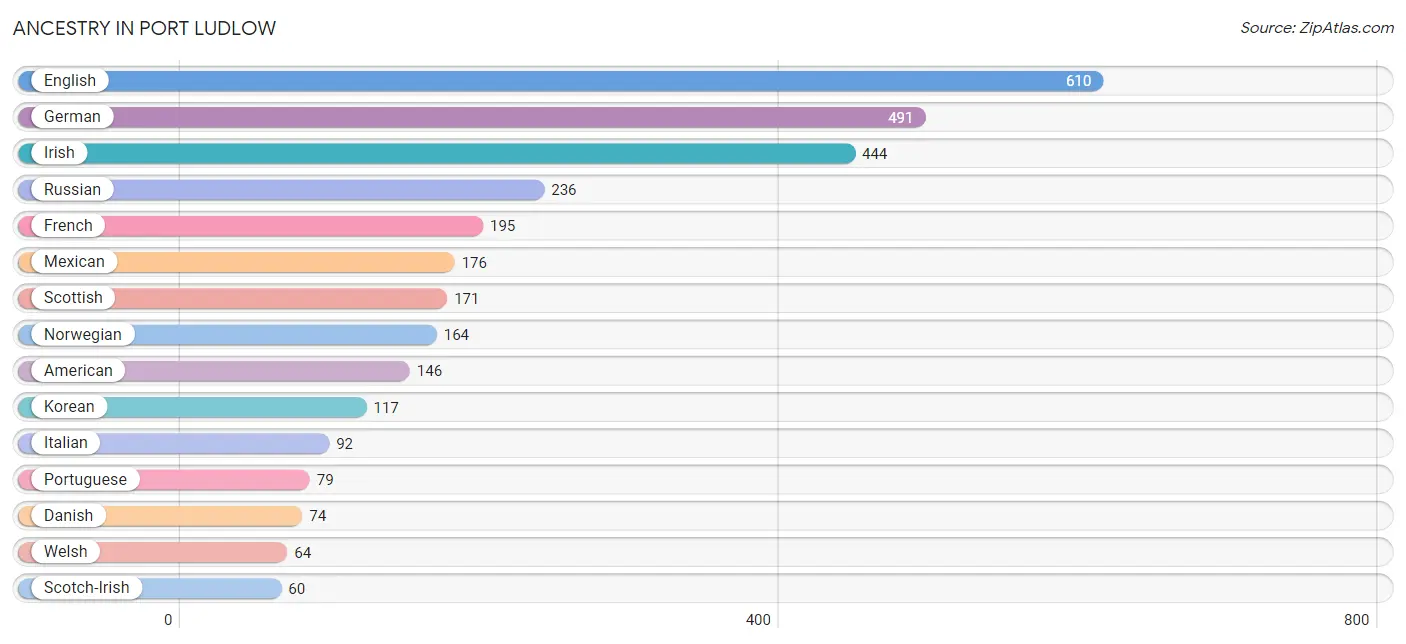
| Ancestry | # Population | % Population |
| American | 146 | 4.7% |
| Arab | 59 | 1.9% |
| Bhutanese | 11 | 0.4% |
| British | 33 | 1.1% |
| Central American | 36 | 1.2% |
| Costa Rican | 36 | 1.2% |
| Croatian | 13 | 0.4% |
| Czech | 16 | 0.5% |
| Danish | 74 | 2.4% |
| Dutch | 46 | 1.5% |
| English | 610 | 19.7% |
| European | 15 | 0.5% |
| Filipino | 14 | 0.4% |
| French | 195 | 6.3% |
| German | 491 | 15.9% |
| Greek | 8 | 0.3% |
| Guamanian / Chamorro | 27 | 0.9% |
| Hungarian | 35 | 1.1% |
| Irish | 444 | 14.3% |
| Italian | 92 | 3.0% |
| Korean | 117 | 3.8% |
| Lebanese | 59 | 1.9% |
| Lithuanian | 13 | 0.4% |
| Mexican | 176 | 5.7% |
| Northern European | 35 | 1.1% |
| Norwegian | 164 | 5.3% |
| Polish | 56 | 1.8% |
| Portuguese | 79 | 2.5% |
| Russian | 236 | 7.6% |
| Scandinavian | 24 | 0.8% |
| Scotch-Irish | 60 | 1.9% |
| Scottish | 171 | 5.5% |
| Spaniard | 50 | 1.6% |
| Spanish | 40 | 1.3% |
| Swedish | 27 | 0.9% |
| Swiss | 14 | 0.4% |
| Ukrainian | 15 | 0.5% |
| Welsh | 64 | 2.1% | View All 38 Rows |
Immigrants in Port Ludlow
The most numerous immigrant groups reported in Port Ludlow came from Europe (99 | 3.2%), Asia (79 | 2.5%), Philippines (65 | 2.1%), South Eastern Asia (65 | 2.1%), and England (44 | 1.4%), together accounting for 11.4% of all Port Ludlow residents.
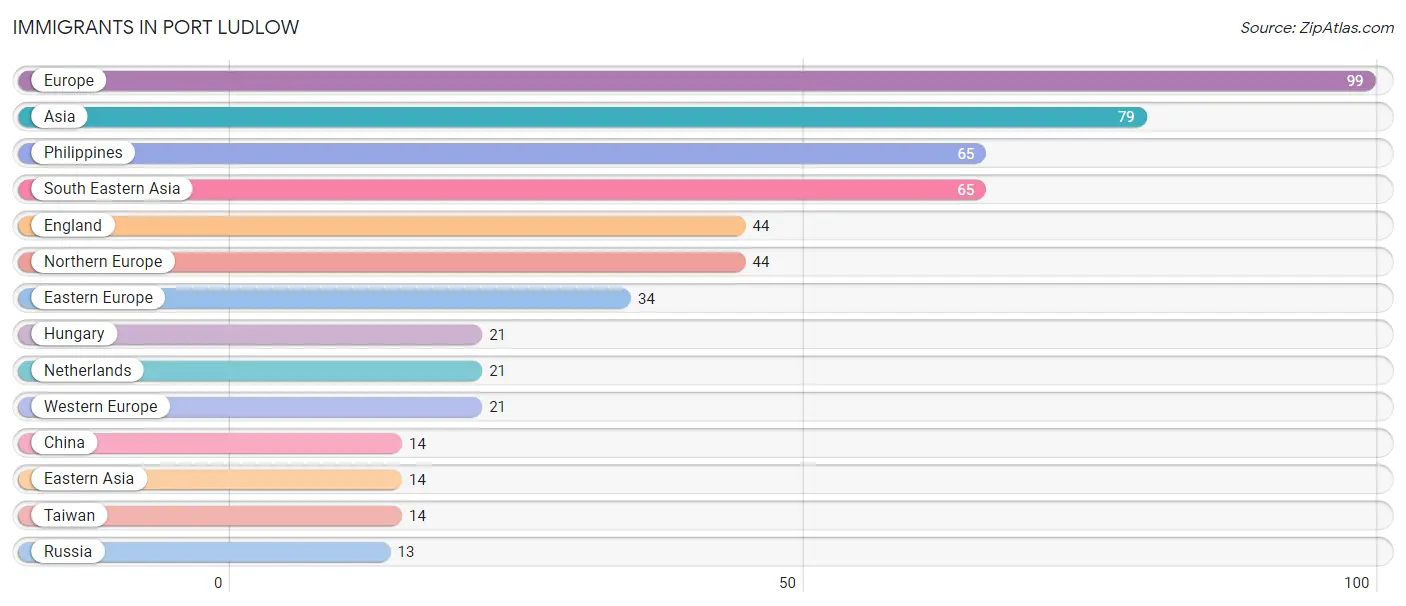
| Immigration Origin | # Population | % Population |
| Asia | 79 | 2.5% |
| China | 14 | 0.4% |
| Eastern Asia | 14 | 0.4% |
| Eastern Europe | 34 | 1.1% |
| England | 44 | 1.4% |
| Europe | 99 | 3.2% |
| Hungary | 21 | 0.7% |
| Netherlands | 21 | 0.7% |
| Northern Europe | 44 | 1.4% |
| Philippines | 65 | 2.1% |
| Russia | 13 | 0.4% |
| South Eastern Asia | 65 | 2.1% |
| Taiwan | 14 | 0.4% |
| Western Europe | 21 | 0.7% | View All 14 Rows |
Sex and Age in Port Ludlow
Sex and Age in Port Ludlow
The most populous age groups in Port Ludlow are 70 to 74 Years (192 | 12.8%) for men and 75 to 79 Years (246 | 15.4%) for women.
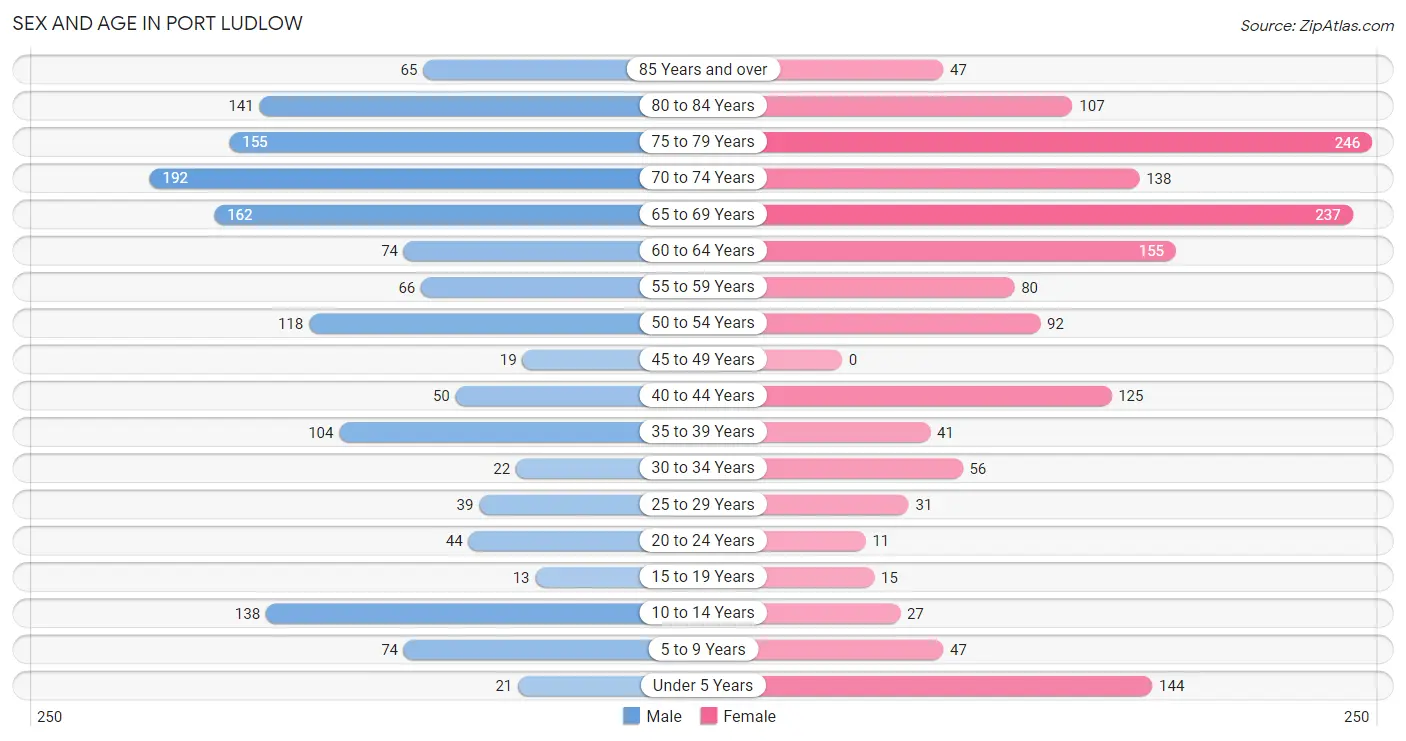
| Age Bracket | Male | Female |
| Under 5 Years | 21 (1.4%) | 144 (9.0%) |
| 5 to 9 Years | 74 (4.9%) | 47 (2.9%) |
| 10 to 14 Years | 138 (9.2%) | 27 (1.7%) |
| 15 to 19 Years | 13 (0.9%) | 15 (0.9%) |
| 20 to 24 Years | 44 (2.9%) | 11 (0.7%) |
| 25 to 29 Years | 39 (2.6%) | 31 (1.9%) |
| 30 to 34 Years | 22 (1.5%) | 56 (3.5%) |
| 35 to 39 Years | 104 (7.0%) | 41 (2.6%) |
| 40 to 44 Years | 50 (3.3%) | 125 (7.8%) |
| 45 to 49 Years | 19 (1.3%) | 0 (0.0%) |
| 50 to 54 Years | 118 (7.9%) | 92 (5.8%) |
| 55 to 59 Years | 66 (4.4%) | 80 (5.0%) |
| 60 to 64 Years | 74 (4.9%) | 155 (9.7%) |
| 65 to 69 Years | 162 (10.8%) | 237 (14.8%) |
| 70 to 74 Years | 192 (12.8%) | 138 (8.6%) |
| 75 to 79 Years | 155 (10.3%) | 246 (15.4%) |
| 80 to 84 Years | 141 (9.4%) | 107 (6.7%) |
| 85 Years and over | 65 (4.3%) | 47 (2.9%) |
| Total | 1,497 (100.0%) | 1,599 (100.0%) |
Families and Households in Port Ludlow
Median Family Size in Port Ludlow
The median family size in Port Ludlow is 2.47 persons per family, with single male/father families (17 | 1.6%) accounting for the largest median family size of 4.06 persons per family. On the other hand, married-couple families (876 | 83.4%) represent the smallest median family size with 2.30 persons per family.
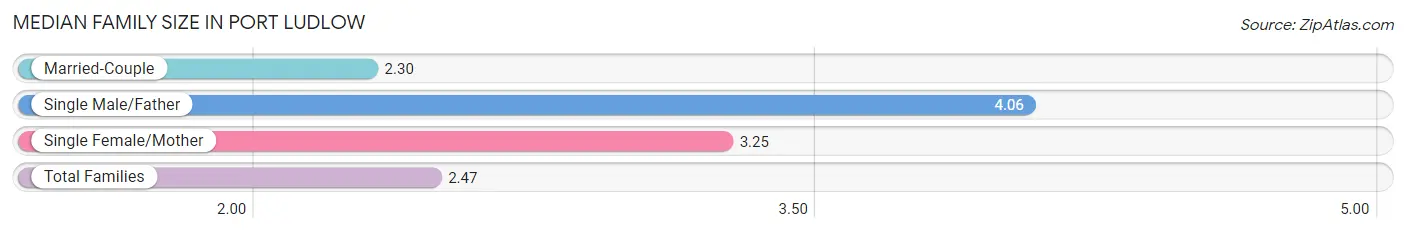
| Family Type | # Families | Family Size |
| Married-Couple | 876 (83.4%) | 2.30 |
| Single Male/Father | 17 (1.6%) | 4.06 |
| Single Female/Mother | 157 (14.9%) | 3.25 |
| Total Families | 1,050 (100.0%) | 2.47 |
Median Household Size in Port Ludlow
The median household size in Port Ludlow is 2.05 persons per household, with single male/father households (17 | 1.1%) accounting for the largest median household size of 4.06 persons per household. non-family households (457 | 30.3%) represent the smallest median household size with 1.05 persons per household.
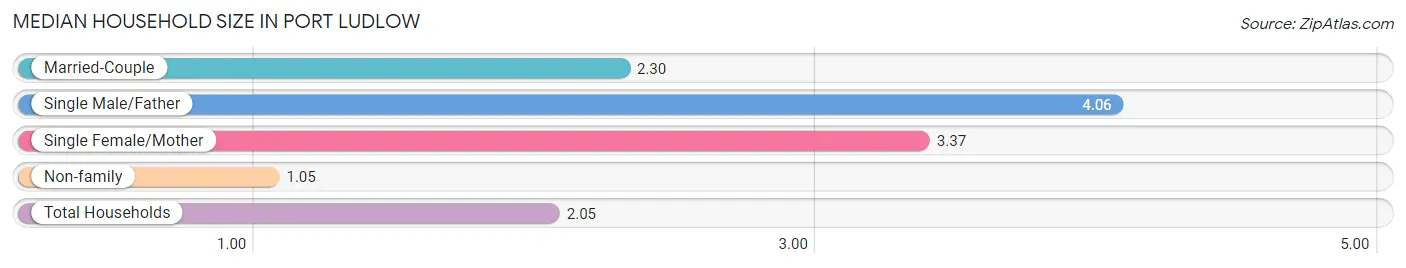
| Household Type | # Households | Household Size |
| Married-Couple | 876 (58.1%) | 2.30 |
| Single Male/Father | 17 (1.1%) | 4.06 |
| Single Female/Mother | 157 (10.4%) | 3.37 |
| Non-family | 457 (30.3%) | 1.05 |
| Total Households | 1,507 (100.0%) | 2.05 |
Household Size by Marriage Status in Port Ludlow
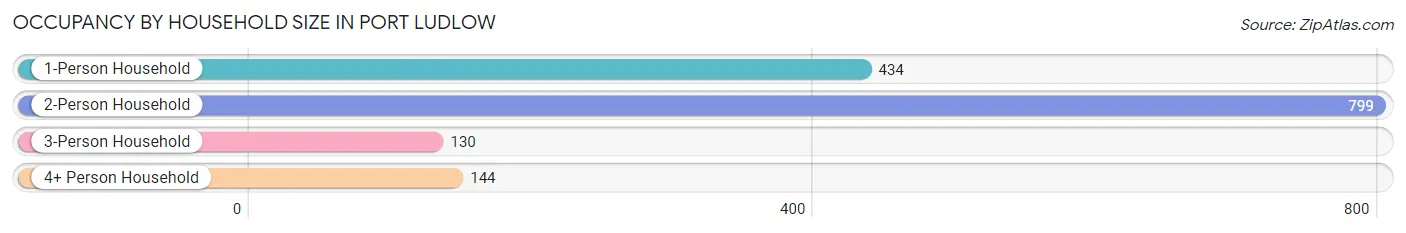
Out of a total of 1,507 households in Port Ludlow, 1,050 (69.7%) are family households, while 457 (30.3%) are nonfamily households. The most numerous type of family households are 2-person households, comprising 776, and the most common type of nonfamily households are 1-person households, comprising 434.
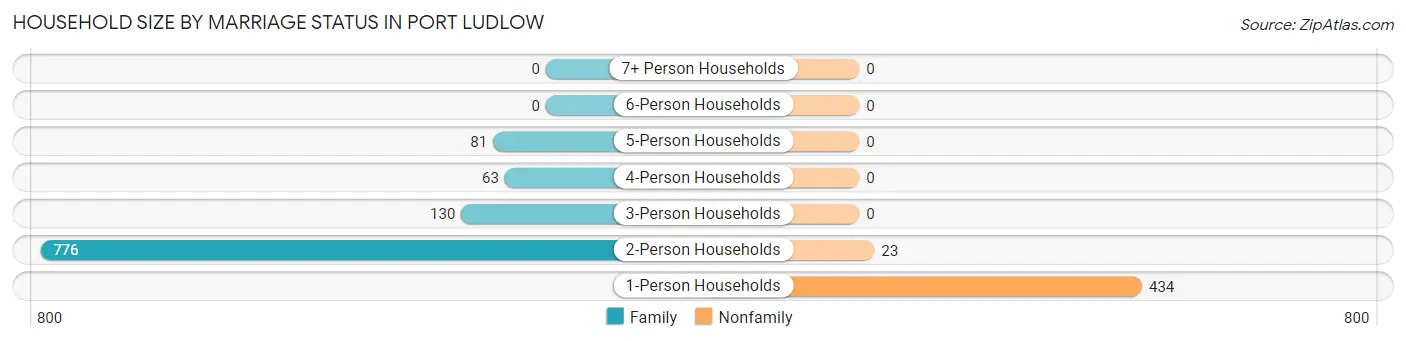
| Household Size | Family Households | Nonfamily Households |
| 1-Person Households | - | 434 (28.8%) |
| 2-Person Households | 776 (51.5%) | 23 (1.5%) |
| 3-Person Households | 130 (8.6%) | 0 (0.0%) |
| 4-Person Households | 63 (4.2%) | 0 (0.0%) |
| 5-Person Households | 81 (5.4%) | 0 (0.0%) |
| 6-Person Households | 0 (0.0%) | 0 (0.0%) |
| 7+ Person Households | 0 (0.0%) | 0 (0.0%) |
| Total | 1,050 (69.7%) | 457 (30.3%) |
Female Fertility in Port Ludlow
Fertility by Age in Port Ludlow
Average fertility rate in Port Ludlow is 54.0 births per 1,000 women. Women in the age bracket of 20 to 34 years have the highest fertility rate with 153.0 births per 1,000 women. Women in the age bracket of 20 to 34 years acount for 100.0% of all women with births.
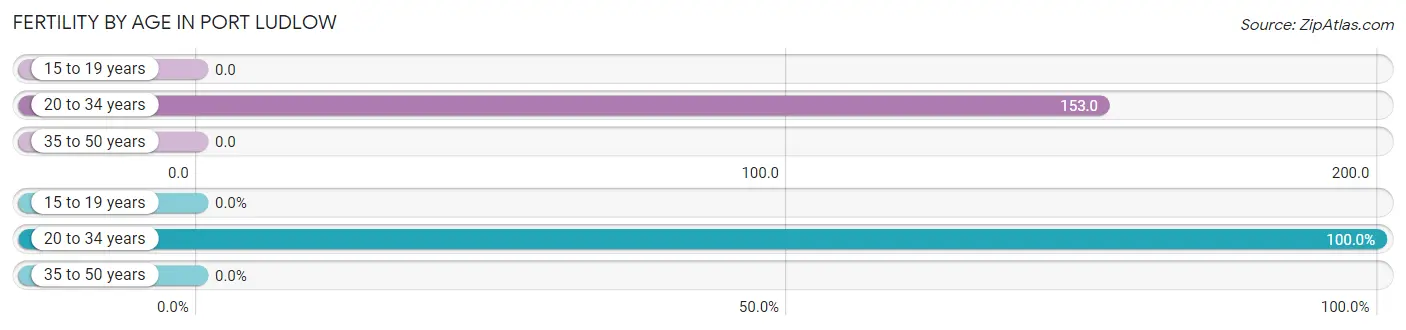
| Age Bracket | Women with Births | Births / 1,000 Women |
| 15 to 19 years | 0 (0.0%) | 0.0 |
| 20 to 34 years | 15 (100.0%) | 153.0 |
| 35 to 50 years | 0 (0.0%) | 0.0 |
| Total | 15 (100.0%) | 54.0 |
Fertility by Age by Marriage Status in Port Ludlow
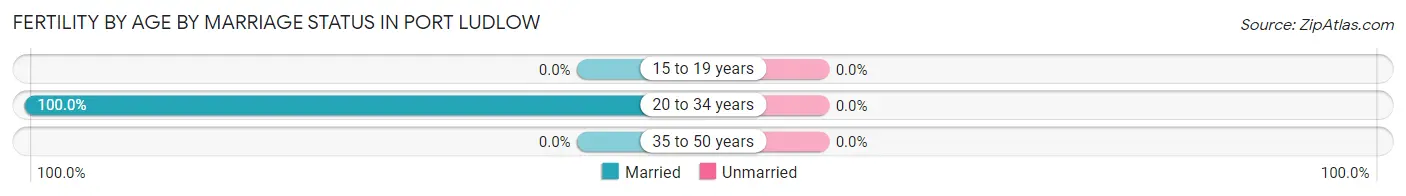
| Age Bracket | Married | Unmarried |
| 15 to 19 years | 0 (0.0%) | 0 (0.0%) |
| 20 to 34 years | 15 (100.0%) | 0 (0.0%) |
| 35 to 50 years | 0 (0.0%) | 0 (0.0%) |
| Total | 15 (100.0%) | 0 (0.0%) |
Fertility by Education in Port Ludlow
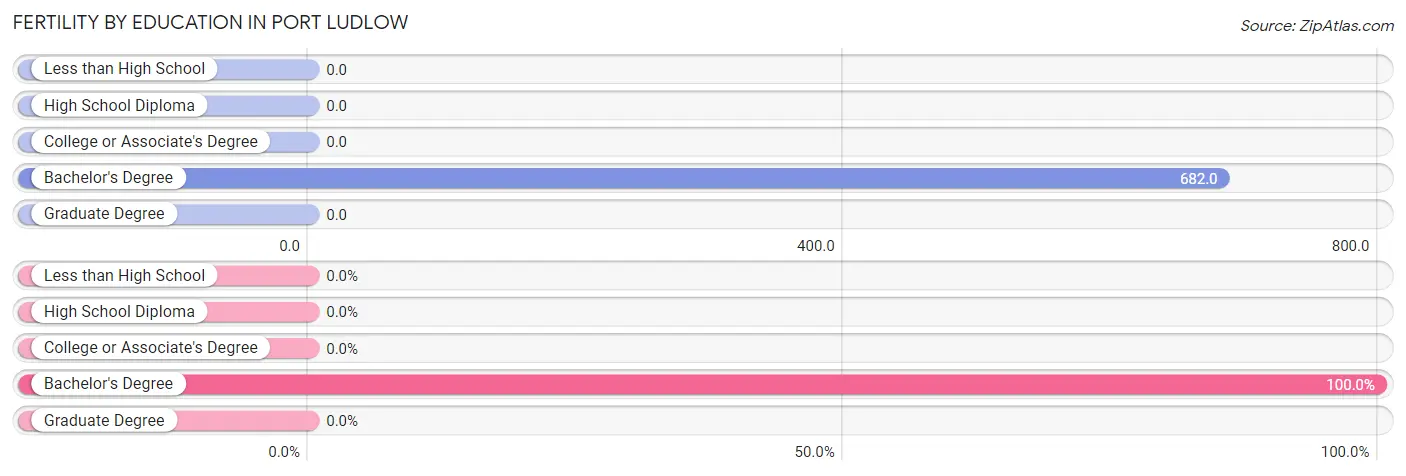
| Educational Attainment | Women with Births | Births / 1,000 Women |
| Less than High School | 0 (0.0%) | 0.0 |
| High School Diploma | 0 (0.0%) | 0.0 |
| College or Associate's Degree | 0 (0.0%) | 0.0 |
| Bachelor's Degree | 15 (100.0%) | 682.0 |
| Graduate Degree | 0 (0.0%) | 0.0 |
| Total | 15 (100.0%) | 54.0 |
Fertility by Education by Marriage Status in Port Ludlow
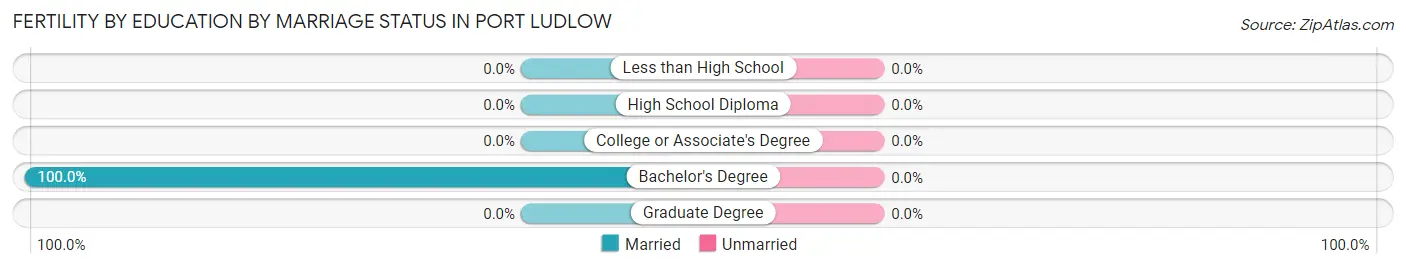
| Educational Attainment | Married | Unmarried |
| Less than High School | 0 (0.0%) | 0 (0.0%) |
| High School Diploma | 0 (0.0%) | 0 (0.0%) |
| College or Associate's Degree | 0 (0.0%) | 0 (0.0%) |
| Bachelor's Degree | 15 (100.0%) | 0 (0.0%) |
| Graduate Degree | 0 (0.0%) | 0 (0.0%) |
| Total | 15 (100.0%) | 0 (0.0%) |
Employment Characteristics in Port Ludlow
Employment by Class of Employer in Port Ludlow
Among the 950 employed individuals in Port Ludlow, private company employees (496 | 52.2%), self-employed (not incorporated) (119 | 12.5%), and state government employees (104 | 11.0%) make up the most common classes of employment.
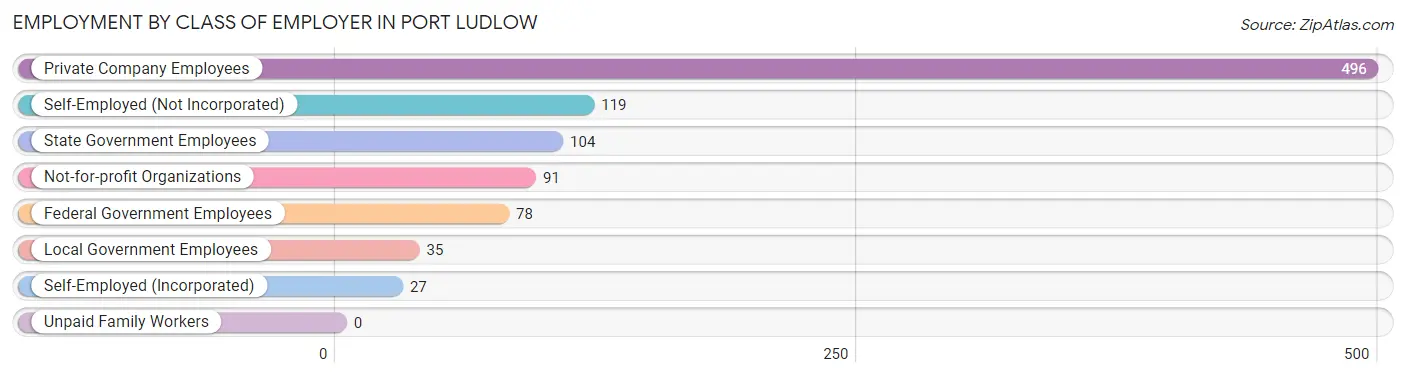
| Employer Class | # Employees | % Employees |
| Private Company Employees | 496 | 52.2% |
| Self-Employed (Incorporated) | 27 | 2.8% |
| Self-Employed (Not Incorporated) | 119 | 12.5% |
| Not-for-profit Organizations | 91 | 9.6% |
| Local Government Employees | 35 | 3.7% |
| State Government Employees | 104 | 11.0% |
| Federal Government Employees | 78 | 8.2% |
| Unpaid Family Workers | 0 | 0.0% |
| Total | 950 | 100.0% |
Employment Status by Age in Port Ludlow
According to the labor force statistics for Port Ludlow, out of the total population over 16 years of age (2,632), 38.1% or 1,003 individuals are in the labor force, with 5.3% or 53 of them unemployed. The age group with the highest labor force participation rate is 20 to 24 years, with 100.0% or 55 individuals in the labor force. Within the labor force, the 20 to 24 years age range has the highest percentage of unemployed individuals, with 47.3% or 26 of them being unemployed.
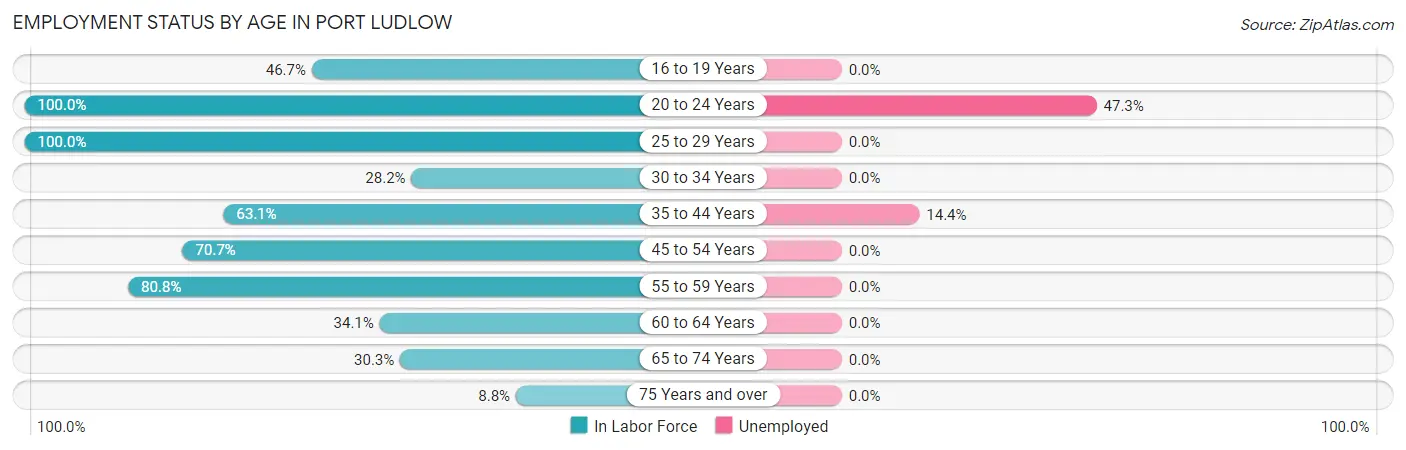
| Age Bracket | In Labor Force | Unemployed |
| 16 to 19 Years | 7 (46.7%) | 0 (0.0%) |
| 20 to 24 Years | 55 (100.0%) | 26 (47.3%) |
| 25 to 29 Years | 70 (100.0%) | 0 (0.0%) |
| 30 to 34 Years | 22 (28.2%) | 0 (0.0%) |
| 35 to 44 Years | 202 (63.1%) | 29 (14.4%) |
| 45 to 54 Years | 162 (70.7%) | 0 (0.0%) |
| 55 to 59 Years | 118 (80.8%) | 0 (0.0%) |
| 60 to 64 Years | 78 (34.1%) | 0 (0.0%) |
| 65 to 74 Years | 221 (30.3%) | 0 (0.0%) |
| 75 Years and over | 67 (8.8%) | 0 (0.0%) |
| Total | 1,003 (38.1%) | 53 (5.3%) |
Employment Status by Educational Attainment in Port Ludlow
According to labor force statistics for Port Ludlow, 60.8% of individuals (652) out of the total population between 25 and 64 years of age (1,072) are in the labor force, with 4.1% or 27 of them being unemployed. The group with the highest labor force participation rate are those with the educational attainment of bachelor's degree or higher, with 78.5% or 321 individuals in the labor force. Within the labor force, individuals with bachelor's degree or higher education have the highest percentage of unemployment, with 8.1% or 26 of them being unemployed.
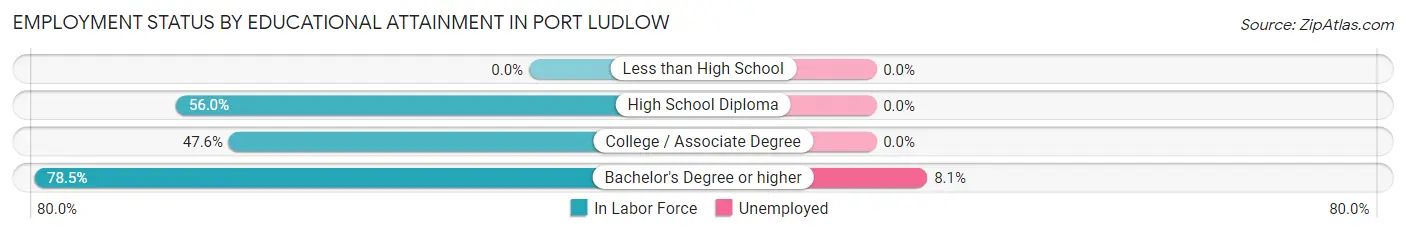
| Educational Attainment | In Labor Force | Unemployed |
| Less than High School | 0 (0.0%) | 0 (0.0%) |
| High School Diploma | 103 (56.0%) | 0 (0.0%) |
| College / Associate Degree | 228 (47.6%) | 0 (0.0%) |
| Bachelor's Degree or higher | 321 (78.5%) | 33 (8.1%) |
| Total | 652 (60.8%) | 44 (4.1%) |
Employment Occupations by Sex in Port Ludlow
Management, Business, Science and Arts Occupations
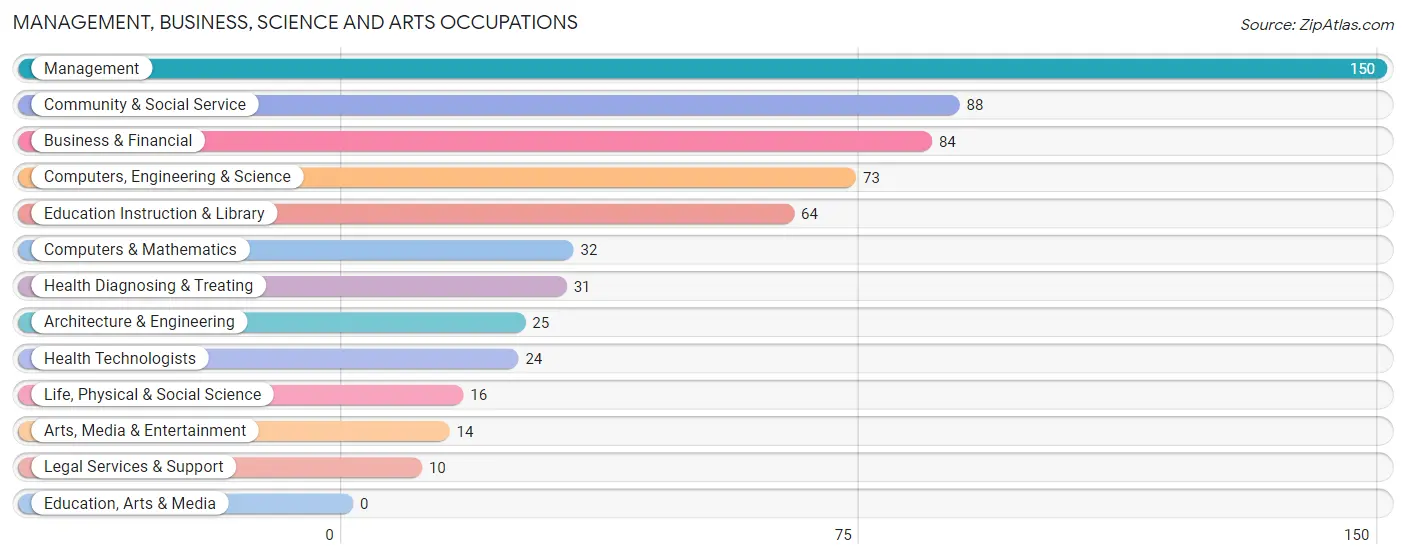
The most common Management, Business, Science and Arts occupations in Port Ludlow are Management (150 | 16.2%), Community & Social Service (88 | 9.5%), Business & Financial (84 | 9.0%), Computers, Engineering & Science (73 | 7.9%), and Education Instruction & Library (64 | 6.9%).
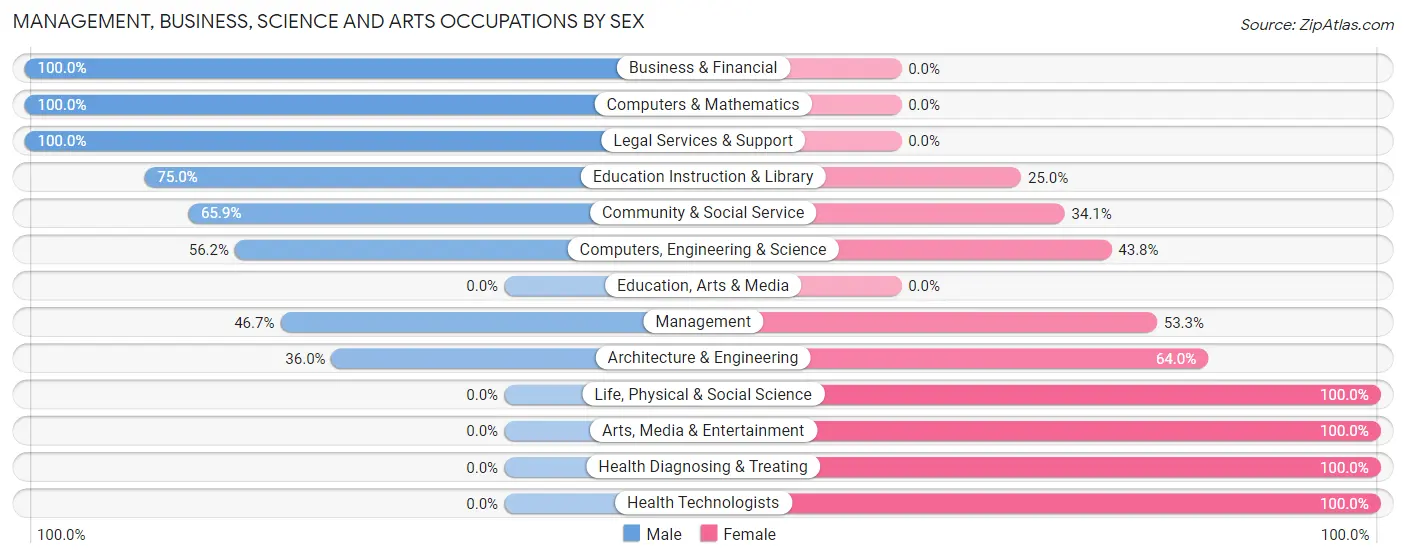
Management, Business, Science and Arts Occupations by Sex
Within the Management, Business, Science and Arts occupations in Port Ludlow, the most male-oriented occupations are Business & Financial (100.0%), Computers & Mathematics (100.0%), and Legal Services & Support (100.0%), while the most female-oriented occupations are Life, Physical & Social Science (100.0%), Arts, Media & Entertainment (100.0%), and Health Diagnosing & Treating (100.0%).
| Occupation | Male | Female |
| Management | 70 (46.7%) | 80 (53.3%) |
| Business & Financial | 84 (100.0%) | 0 (0.0%) |
| Computers, Engineering & Science | 41 (56.2%) | 32 (43.8%) |
| Computers & Mathematics | 32 (100.0%) | 0 (0.0%) |
| Architecture & Engineering | 9 (36.0%) | 16 (64.0%) |
| Life, Physical & Social Science | 0 (0.0%) | 16 (100.0%) |
| Community & Social Service | 58 (65.9%) | 30 (34.1%) |
| Education, Arts & Media | 0 (0.0%) | 0 (0.0%) |
| Legal Services & Support | 10 (100.0%) | 0 (0.0%) |
| Education Instruction & Library | 48 (75.0%) | 16 (25.0%) |
| Arts, Media & Entertainment | 0 (0.0%) | 14 (100.0%) |
| Health Diagnosing & Treating | 0 (0.0%) | 31 (100.0%) |
| Health Technologists | 0 (0.0%) | 24 (100.0%) |
| Total (Category) | 253 (59.4%) | 173 (40.6%) |
| Total (Overall) | 522 (56.2%) | 407 (43.8%) |
Services Occupations
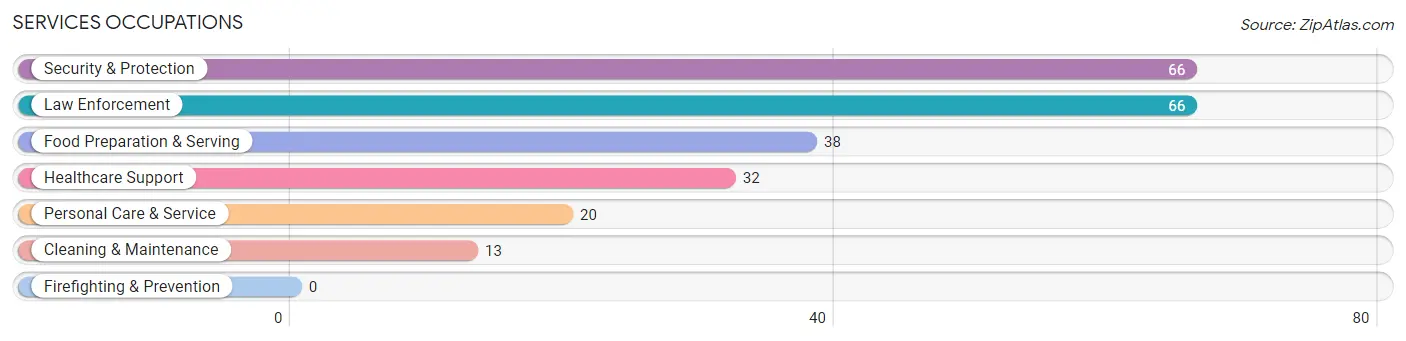
The most common Services occupations in Port Ludlow are Security & Protection (66 | 7.1%), Law Enforcement (66 | 7.1%), Food Preparation & Serving (38 | 4.1%), Healthcare Support (32 | 3.4%), and Personal Care & Service (20 | 2.1%).
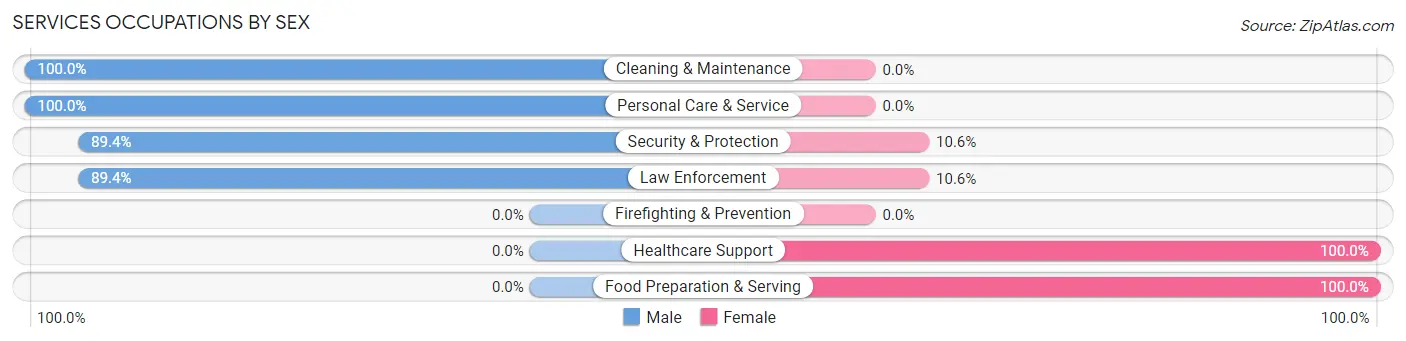
Services Occupations by Sex
Within the Services occupations in Port Ludlow, the most male-oriented occupations are Cleaning & Maintenance (100.0%), Personal Care & Service (100.0%), and Security & Protection (89.4%), while the most female-oriented occupations are Healthcare Support (100.0%), Food Preparation & Serving (100.0%), and Security & Protection (10.6%).
| Occupation | Male | Female |
| Healthcare Support | 0 (0.0%) | 32 (100.0%) |
| Security & Protection | 59 (89.4%) | 7 (10.6%) |
| Firefighting & Prevention | 0 (0.0%) | 0 (0.0%) |
| Law Enforcement | 59 (89.4%) | 7 (10.6%) |
| Food Preparation & Serving | 0 (0.0%) | 38 (100.0%) |
| Cleaning & Maintenance | 13 (100.0%) | 0 (0.0%) |
| Personal Care & Service | 20 (100.0%) | 0 (0.0%) |
| Total (Category) | 92 (54.4%) | 77 (45.6%) |
| Total (Overall) | 522 (56.2%) | 407 (43.8%) |
Sales and Office Occupations
The most common Sales and Office occupations in Port Ludlow are Office & Administration (139 | 15.0%), and Sales & Related (89 | 9.6%).
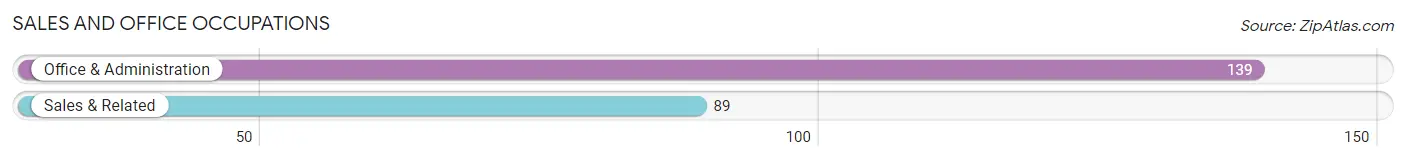
Sales and Office Occupations by Sex
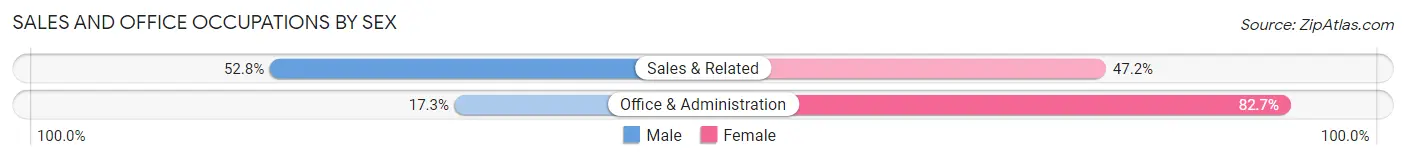
| Occupation | Male | Female |
| Sales & Related | 47 (52.8%) | 42 (47.2%) |
| Office & Administration | 24 (17.3%) | 115 (82.7%) |
| Total (Category) | 71 (31.1%) | 157 (68.9%) |
| Total (Overall) | 522 (56.2%) | 407 (43.8%) |
Natural Resources, Construction and Maintenance Occupations
The most common Natural Resources, Construction and Maintenance occupations in Port Ludlow are Installation, Maintenance & Repair (29 | 3.1%), Construction & Extraction (19 | 2.1%), and Farming, Fishing & Forestry (18 | 1.9%).
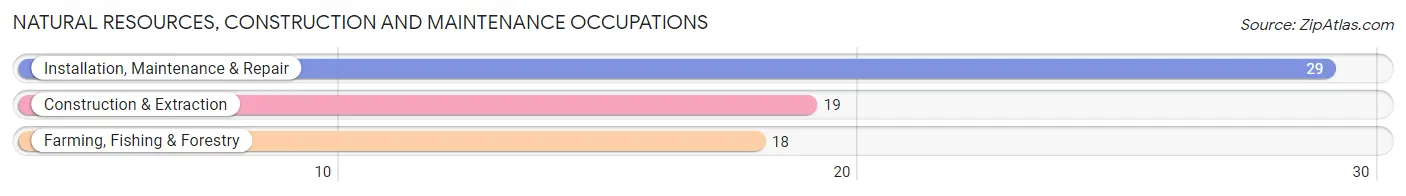
Natural Resources, Construction and Maintenance Occupations by Sex
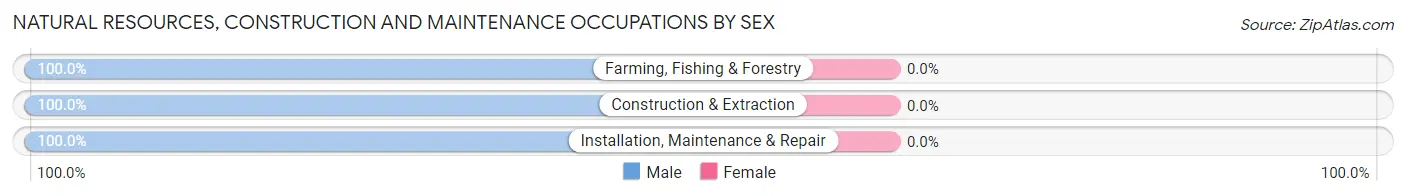
| Occupation | Male | Female |
| Farming, Fishing & Forestry | 18 (100.0%) | 0 (0.0%) |
| Construction & Extraction | 19 (100.0%) | 0 (0.0%) |
| Installation, Maintenance & Repair | 29 (100.0%) | 0 (0.0%) |
| Total (Category) | 66 (100.0%) | 0 (0.0%) |
| Total (Overall) | 522 (56.2%) | 407 (43.8%) |
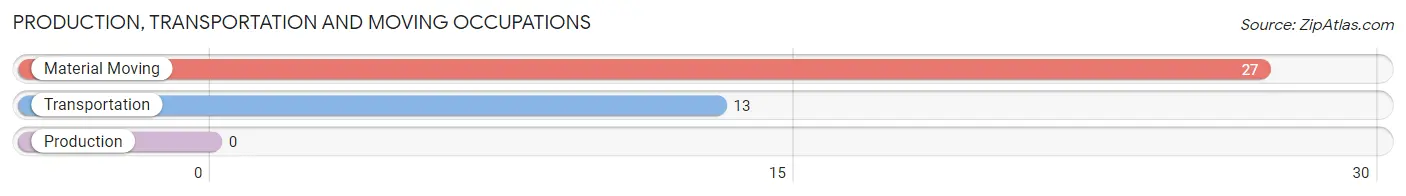
Production, Transportation and Moving Occupations
The most common Production, Transportation and Moving occupations in Port Ludlow are Material Moving (27 | 2.9%), and Transportation (13 | 1.4%).
Production, Transportation and Moving Occupations by Sex
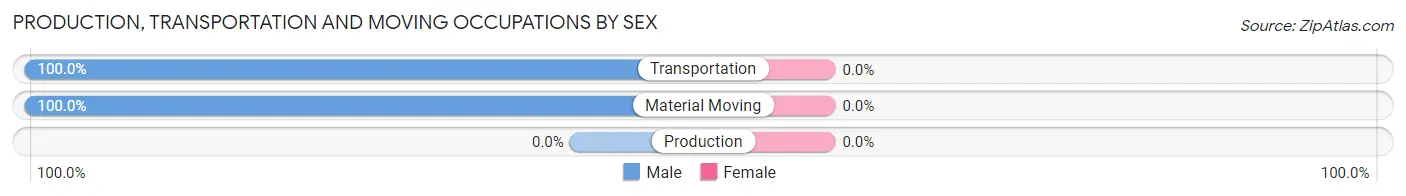
| Occupation | Male | Female |
| Production | 0 (0.0%) | 0 (0.0%) |
| Transportation | 13 (100.0%) | 0 (0.0%) |
| Material Moving | 27 (100.0%) | 0 (0.0%) |
| Total (Category) | 40 (100.0%) | 0 (0.0%) |
| Total (Overall) | 522 (56.2%) | 407 (43.8%) |
Employment Industries by Sex in Port Ludlow
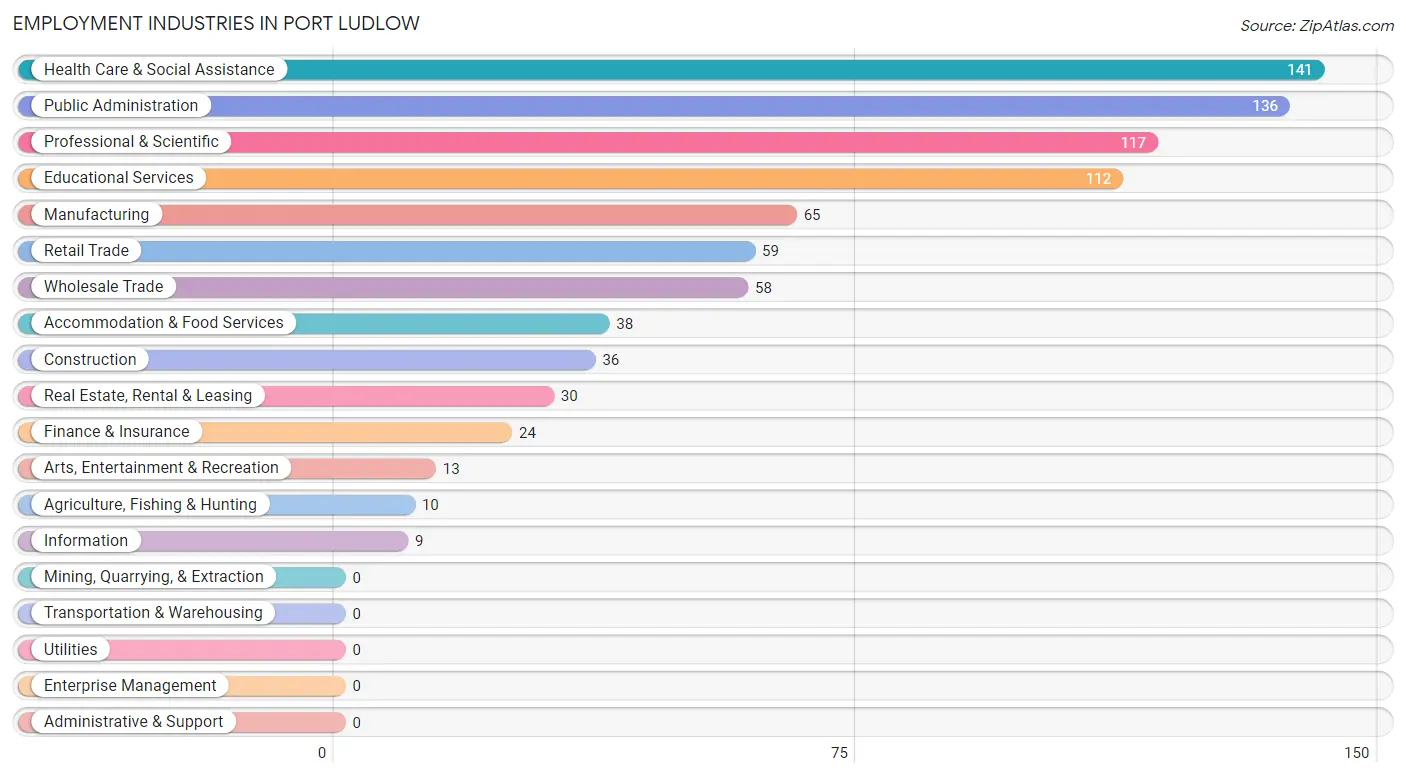
Employment Industries in Port Ludlow
The major employment industries in Port Ludlow include Health Care & Social Assistance (141 | 15.2%), Public Administration (136 | 14.6%), Professional & Scientific (117 | 12.6%), Educational Services (112 | 12.1%), and Manufacturing (65 | 7.0%).
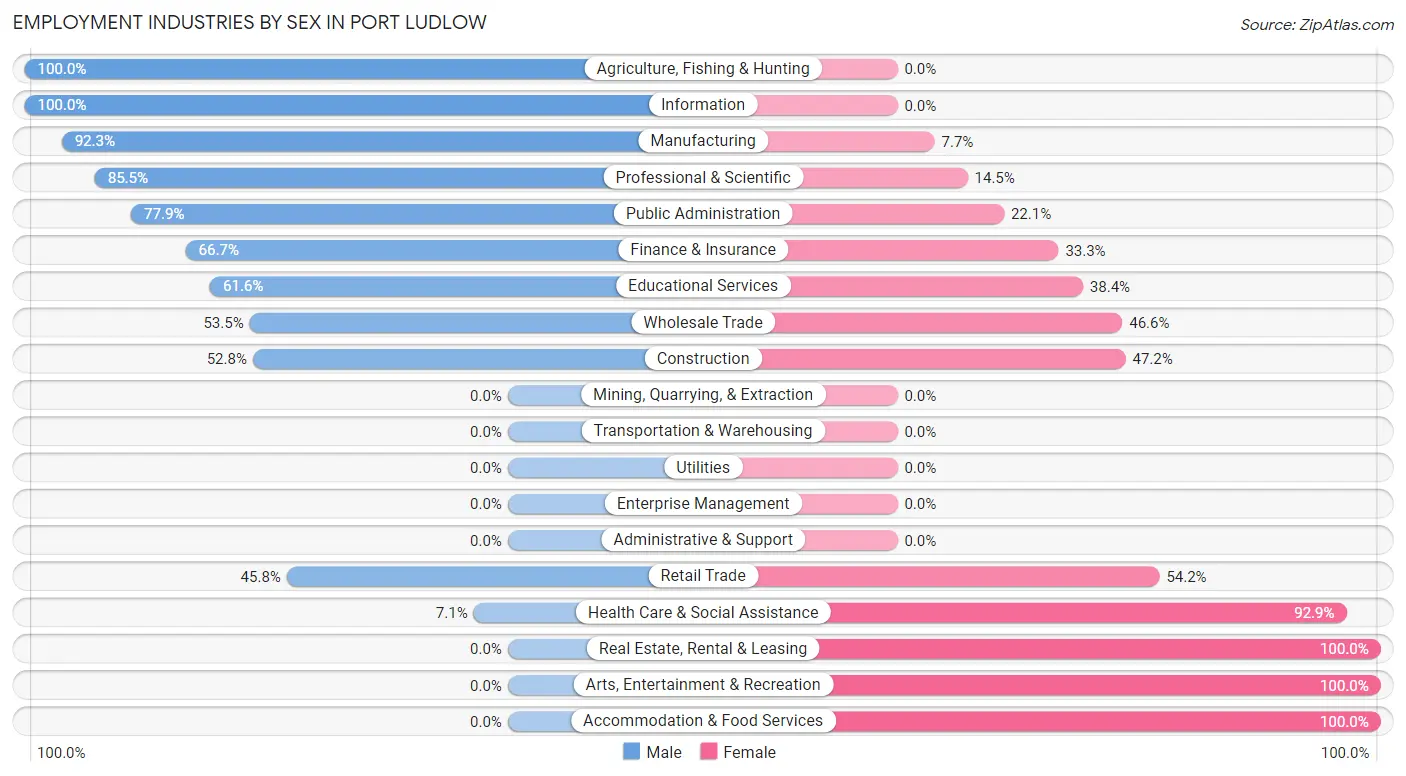
Employment Industries by Sex in Port Ludlow
The Port Ludlow industries that see more men than women are Agriculture, Fishing & Hunting (100.0%), Information (100.0%), and Manufacturing (92.3%), whereas the industries that tend to have a higher number of women are Real Estate, Rental & Leasing (100.0%), Arts, Entertainment & Recreation (100.0%), and Accommodation & Food Services (100.0%).
| Industry | Male | Female |
| Agriculture, Fishing & Hunting | 10 (100.0%) | 0 (0.0%) |
| Mining, Quarrying, & Extraction | 0 (0.0%) | 0 (0.0%) |
| Construction | 19 (52.8%) | 17 (47.2%) |
| Manufacturing | 60 (92.3%) | 5 (7.7%) |
| Wholesale Trade | 31 (53.4%) | 27 (46.6%) |
| Retail Trade | 27 (45.8%) | 32 (54.2%) |
| Transportation & Warehousing | 0 (0.0%) | 0 (0.0%) |
| Utilities | 0 (0.0%) | 0 (0.0%) |
| Information | 9 (100.0%) | 0 (0.0%) |
| Finance & Insurance | 16 (66.7%) | 8 (33.3%) |
| Real Estate, Rental & Leasing | 0 (0.0%) | 30 (100.0%) |
| Professional & Scientific | 100 (85.5%) | 17 (14.5%) |
| Enterprise Management | 0 (0.0%) | 0 (0.0%) |
| Administrative & Support | 0 (0.0%) | 0 (0.0%) |
| Educational Services | 69 (61.6%) | 43 (38.4%) |
| Health Care & Social Assistance | 10 (7.1%) | 131 (92.9%) |
| Arts, Entertainment & Recreation | 0 (0.0%) | 13 (100.0%) |
| Accommodation & Food Services | 0 (0.0%) | 38 (100.0%) |
| Public Administration | 106 (77.9%) | 30 (22.1%) |
| Total | 522 (56.2%) | 407 (43.8%) |
Education in Port Ludlow
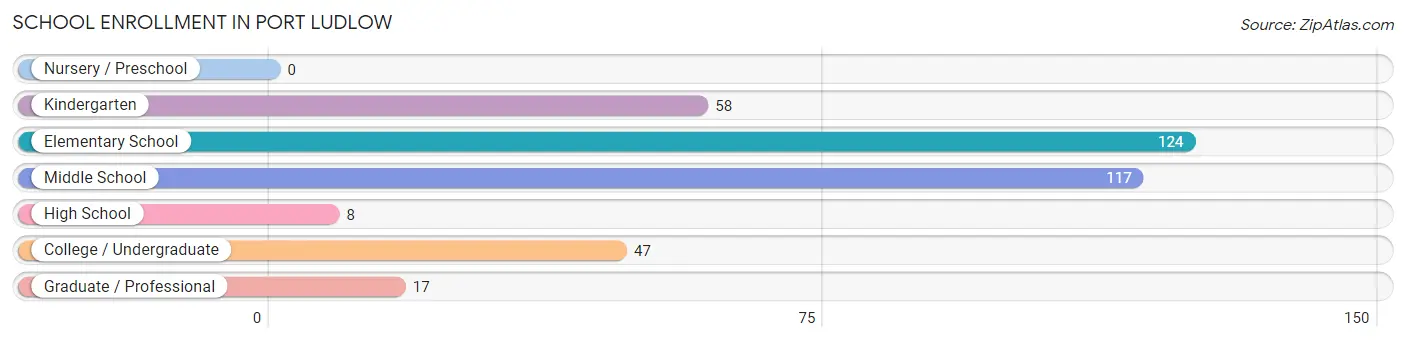
School Enrollment in Port Ludlow
The most common levels of schooling among the 371 students in Port Ludlow are elementary school (124 | 33.4%), middle school (117 | 31.5%), and kindergarten (58 | 15.6%).
| School Level | # Students | % Students |
| Nursery / Preschool | 0 | 0.0% |
| Kindergarten | 58 | 15.6% |
| Elementary School | 124 | 33.4% |
| Middle School | 117 | 31.5% |
| High School | 8 | 2.2% |
| College / Undergraduate | 47 | 12.7% |
| Graduate / Professional | 17 | 4.6% |
| Total | 371 | 100.0% |
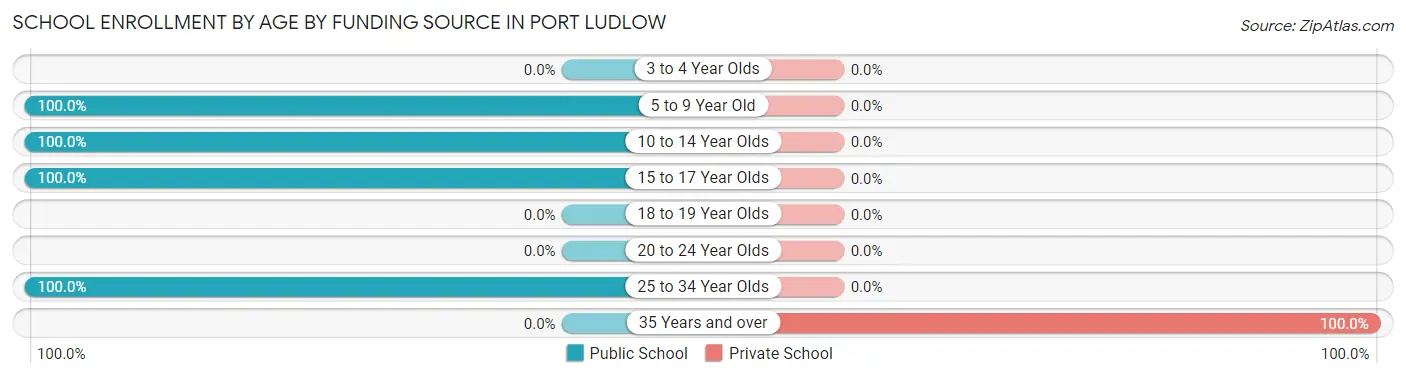
School Enrollment by Age by Funding Source in Port Ludlow
Out of a total of 371 students who are enrolled in schools in Port Ludlow, 33 (8.9%) attend a private institution, while the remaining 338 (91.1%) are enrolled in public schools. The age group of 35 years and over has the highest likelihood of being enrolled in private schools, with 33 (100.0% in the age bracket) enrolled. Conversely, the age group of 5 to 9 year old has the lowest likelihood of being enrolled in a private school, with 121 (100.0% in the age bracket) attending a public institution.
| Age Bracket | Public School | Private School |
| 3 to 4 Year Olds | 0 (0.0%) | 0 (0.0%) |
| 5 to 9 Year Old | 121 (100.0%) | 0 (0.0%) |
| 10 to 14 Year Olds | 165 (100.0%) | 0 (0.0%) |
| 15 to 17 Year Olds | 21 (100.0%) | 0 (0.0%) |
| 18 to 19 Year Olds | 0 (0.0%) | 0 (0.0%) |
| 20 to 24 Year Olds | 0 (0.0%) | 0 (0.0%) |
| 25 to 34 Year Olds | 31 (100.0%) | 0 (0.0%) |
| 35 Years and over | 0 (0.0%) | 33 (100.0%) |
| Total | 338 (91.1%) | 33 (8.9%) |
Educational Attainment by Field of Study in Port Ludlow
Business (227 | 17.3%), social sciences (200 | 15.2%), engineering (131 | 10.0%), education (116 | 8.8%), and science & technology (113 | 8.6%) are the most common fields of study among 1,313 individuals in Port Ludlow who have obtained a bachelor's degree or higher.
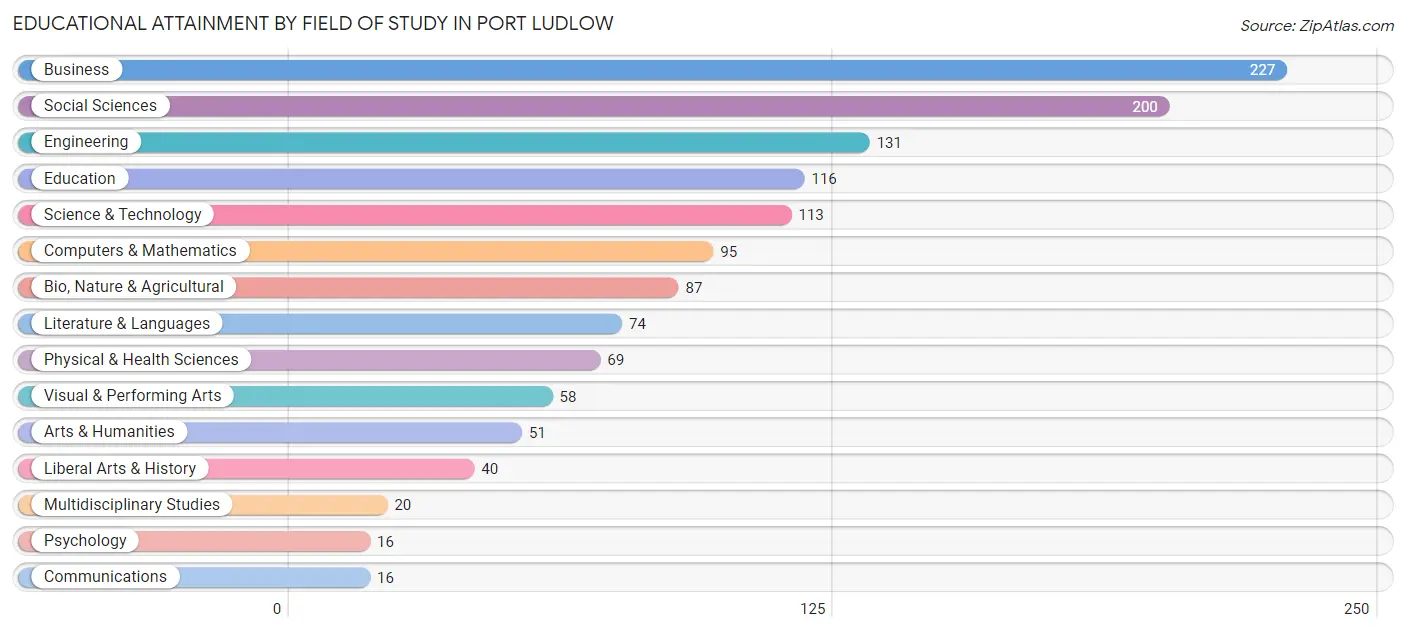
| Field of Study | # Graduates | % Graduates |
| Computers & Mathematics | 95 | 7.2% |
| Bio, Nature & Agricultural | 87 | 6.6% |
| Physical & Health Sciences | 69 | 5.3% |
| Psychology | 16 | 1.2% |
| Social Sciences | 200 | 15.2% |
| Engineering | 131 | 10.0% |
| Multidisciplinary Studies | 20 | 1.5% |
| Science & Technology | 113 | 8.6% |
| Business | 227 | 17.3% |
| Education | 116 | 8.8% |
| Literature & Languages | 74 | 5.6% |
| Liberal Arts & History | 40 | 3.0% |
| Visual & Performing Arts | 58 | 4.4% |
| Communications | 16 | 1.2% |
| Arts & Humanities | 51 | 3.9% |
| Total | 1,313 | 100.0% |
Transportation & Commute in Port Ludlow
Vehicle Availability by Sex in Port Ludlow
The most prevalent vehicle ownership categories in Port Ludlow are males with 2 vehicles (288, accounting for 53.0%) and females with 2 vehicles (262, making up 70.8%).
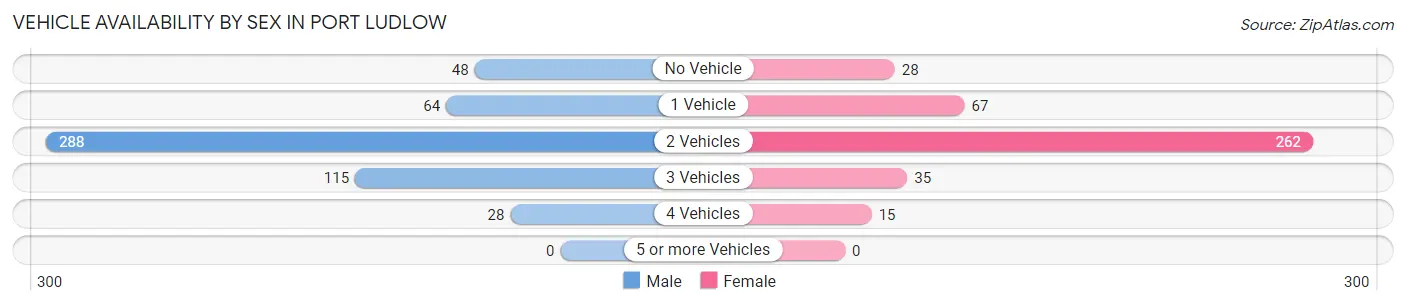
| Vehicles Available | Male | Female |
| No Vehicle | 48 (8.8%) | 28 (6.9%) |
| 1 Vehicle | 64 (11.8%) | 67 (16.5%) |
| 2 Vehicles | 288 (53.0%) | 262 (64.4%) |
| 3 Vehicles | 115 (21.2%) | 35 (8.6%) |
| 4 Vehicles | 28 (5.2%) | 15 (3.7%) |
| 5 or more Vehicles | 0 (0.0%) | 0 (0.0%) |
| Total | 543 (100.0%) | 407 (100.0%) |
Commute Time in Port Ludlow
The most frequently occuring commute durations in Port Ludlow are 30 to 34 minutes (145 commuters, 20.9%), 45 to 59 minutes (135 commuters, 19.5%), and 25 to 29 minutes (107 commuters, 15.4%).
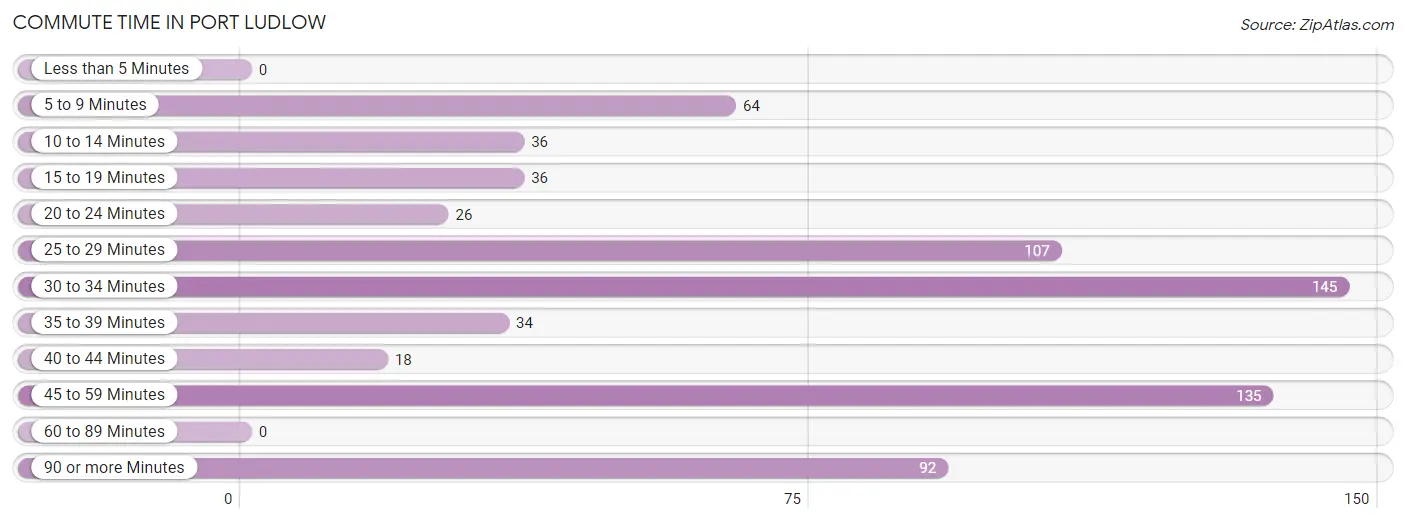
| Commute Time | # Commuters | % Commuters |
| Less than 5 Minutes | 0 | 0.0% |
| 5 to 9 Minutes | 64 | 9.2% |
| 10 to 14 Minutes | 36 | 5.2% |
| 15 to 19 Minutes | 36 | 5.2% |
| 20 to 24 Minutes | 26 | 3.7% |
| 25 to 29 Minutes | 107 | 15.4% |
| 30 to 34 Minutes | 145 | 20.9% |
| 35 to 39 Minutes | 34 | 4.9% |
| 40 to 44 Minutes | 18 | 2.6% |
| 45 to 59 Minutes | 135 | 19.5% |
| 60 to 89 Minutes | 0 | 0.0% |
| 90 or more Minutes | 92 | 13.3% |
Commute Time by Sex in Port Ludlow
The most common commute times in Port Ludlow are 45 to 59 minutes (100 commuters, 25.8%) for males and 30 to 34 minutes (106 commuters, 34.6%) for females.
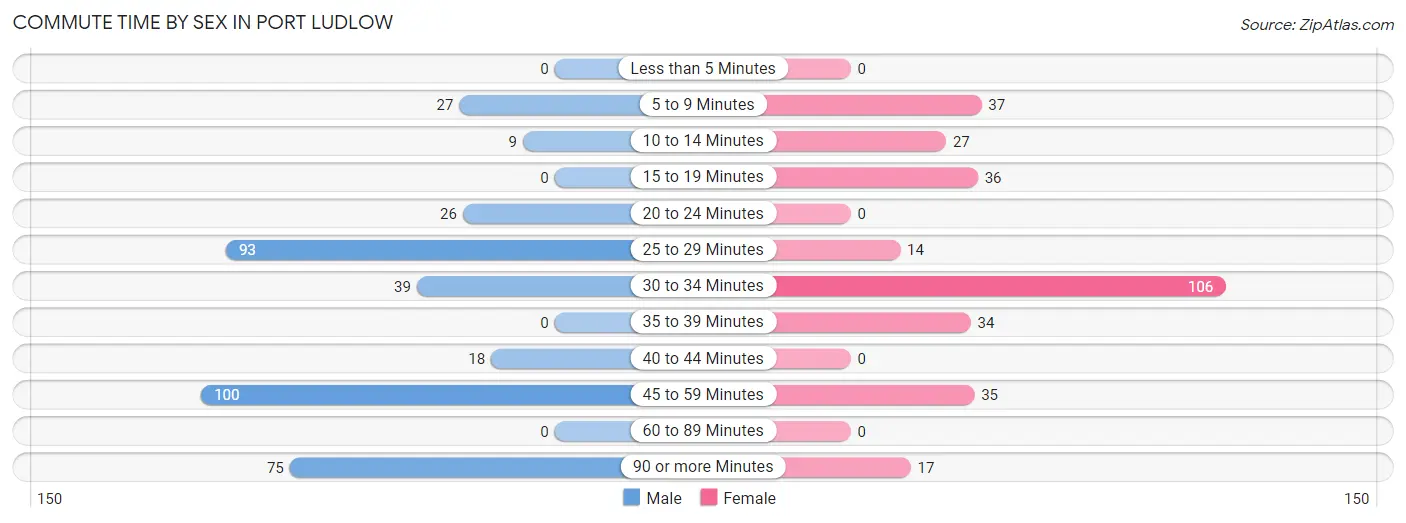
| Commute Time | Male | Female |
| Less than 5 Minutes | 0 (0.0%) | 0 (0.0%) |
| 5 to 9 Minutes | 27 (7.0%) | 37 (12.1%) |
| 10 to 14 Minutes | 9 (2.3%) | 27 (8.8%) |
| 15 to 19 Minutes | 0 (0.0%) | 36 (11.8%) |
| 20 to 24 Minutes | 26 (6.7%) | 0 (0.0%) |
| 25 to 29 Minutes | 93 (24.0%) | 14 (4.6%) |
| 30 to 34 Minutes | 39 (10.1%) | 106 (34.6%) |
| 35 to 39 Minutes | 0 (0.0%) | 34 (11.1%) |
| 40 to 44 Minutes | 18 (4.6%) | 0 (0.0%) |
| 45 to 59 Minutes | 100 (25.8%) | 35 (11.4%) |
| 60 to 89 Minutes | 0 (0.0%) | 0 (0.0%) |
| 90 or more Minutes | 75 (19.4%) | 17 (5.6%) |
Time of Departure to Work by Sex in Port Ludlow
The most frequent times of departure to work in Port Ludlow are 7:00 AM to 7:29 AM (151, 39.0%) for males and 8:00 AM to 8:29 AM (64, 20.9%) for females.
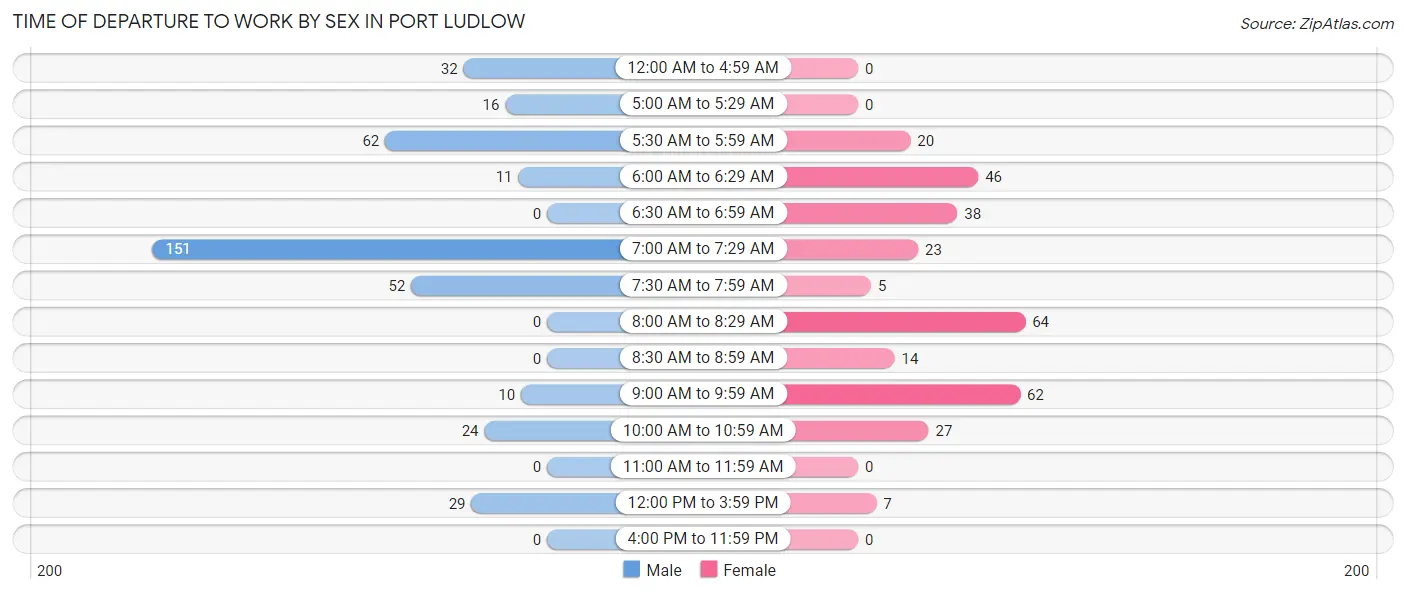
| Time of Departure | Male | Female |
| 12:00 AM to 4:59 AM | 32 (8.3%) | 0 (0.0%) |
| 5:00 AM to 5:29 AM | 16 (4.1%) | 0 (0.0%) |
| 5:30 AM to 5:59 AM | 62 (16.0%) | 20 (6.5%) |
| 6:00 AM to 6:29 AM | 11 (2.8%) | 46 (15.0%) |
| 6:30 AM to 6:59 AM | 0 (0.0%) | 38 (12.4%) |
| 7:00 AM to 7:29 AM | 151 (39.0%) | 23 (7.5%) |
| 7:30 AM to 7:59 AM | 52 (13.4%) | 5 (1.6%) |
| 8:00 AM to 8:29 AM | 0 (0.0%) | 64 (20.9%) |
| 8:30 AM to 8:59 AM | 0 (0.0%) | 14 (4.6%) |
| 9:00 AM to 9:59 AM | 10 (2.6%) | 62 (20.3%) |
| 10:00 AM to 10:59 AM | 24 (6.2%) | 27 (8.8%) |
| 11:00 AM to 11:59 AM | 0 (0.0%) | 0 (0.0%) |
| 12:00 PM to 3:59 PM | 29 (7.5%) | 7 (2.3%) |
| 4:00 PM to 11:59 PM | 0 (0.0%) | 0 (0.0%) |
| Total | 387 (100.0%) | 306 (100.0%) |
Housing Occupancy in Port Ludlow
Occupancy by Ownership in Port Ludlow
Of the total 1,507 dwellings in Port Ludlow, owner-occupied units account for 1,320 (87.6%), while renter-occupied units make up 187 (12.4%).
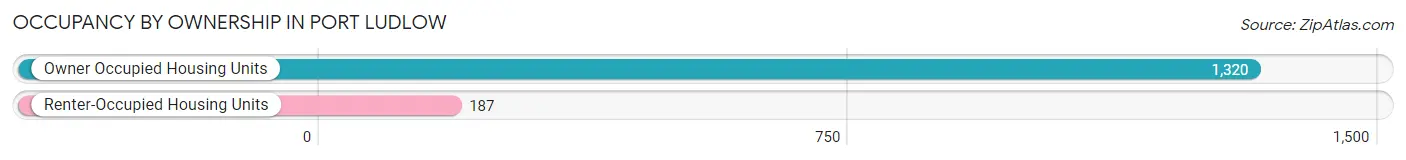
| Occupancy | # Housing Units | % Housing Units |
| Owner Occupied Housing Units | 1,320 | 87.6% |
| Renter-Occupied Housing Units | 187 | 12.4% |
| Total Occupied Housing Units | 1,507 | 100.0% |
Occupancy by Household Size in Port Ludlow
| Household Size | # Housing Units | % Housing Units |
| 1-Person Household | 434 | 28.8% |
| 2-Person Household | 799 | 53.0% |
| 3-Person Household | 130 | 8.6% |
| 4+ Person Household | 144 | 9.6% |
| Total Housing Units | 1,507 | 100.0% |
Occupancy by Ownership by Household Size in Port Ludlow
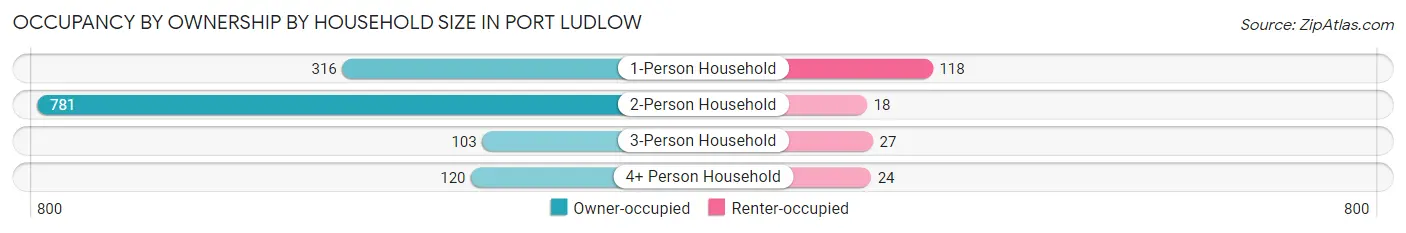
| Household Size | Owner-occupied | Renter-occupied |
| 1-Person Household | 316 (72.8%) | 118 (27.2%) |
| 2-Person Household | 781 (97.8%) | 18 (2.2%) |
| 3-Person Household | 103 (79.2%) | 27 (20.8%) |
| 4+ Person Household | 120 (83.3%) | 24 (16.7%) |
| Total Housing Units | 1,320 (87.6%) | 187 (12.4%) |
Occupancy by Educational Attainment in Port Ludlow
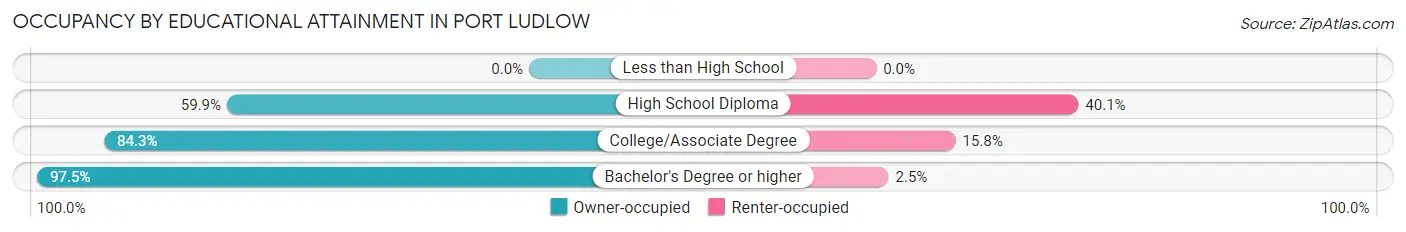
| Household Size | Owner-occupied | Renter-occupied |
| Less than High School | 0 (0.0%) | 0 (0.0%) |
| High School Diploma | 115 (59.9%) | 77 (40.1%) |
| College/Associate Degree | 492 (84.3%) | 92 (15.8%) |
| Bachelor's Degree or higher | 713 (97.5%) | 18 (2.5%) |
Occupancy by Age of Householder in Port Ludlow
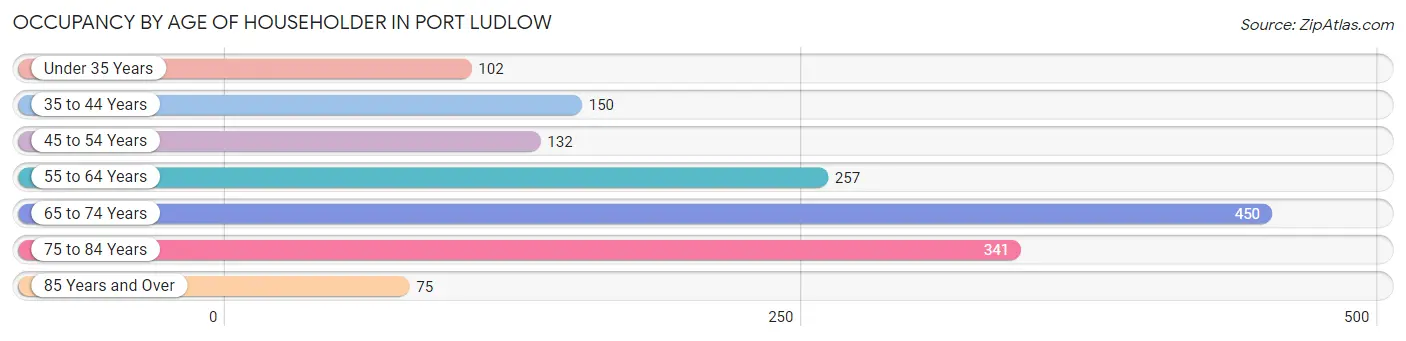
| Age Bracket | # Households | % Households |
| Under 35 Years | 102 | 6.8% |
| 35 to 44 Years | 150 | 10.0% |
| 45 to 54 Years | 132 | 8.8% |
| 55 to 64 Years | 257 | 17.1% |
| 65 to 74 Years | 450 | 29.9% |
| 75 to 84 Years | 341 | 22.6% |
| 85 Years and Over | 75 | 5.0% |
| Total | 1,507 | 100.0% |
Housing Finances in Port Ludlow
Median Income by Occupancy in Port Ludlow
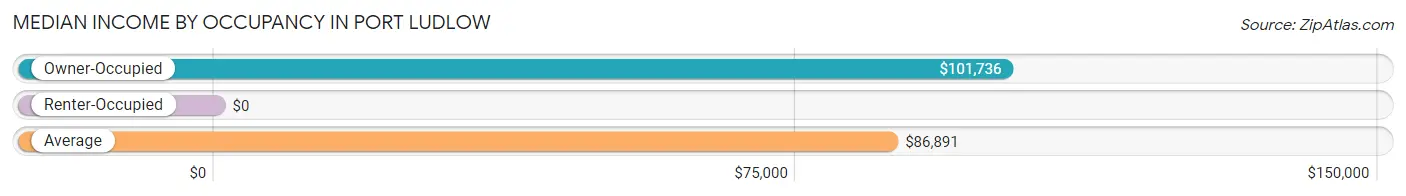
| Occupancy Type | # Households | Median Income |
| Owner-Occupied | 1,320 (87.6%) | $101,736 |
| Renter-Occupied | 187 (12.4%) | $0 |
| Average | 1,507 (100.0%) | $86,891 |
Occupancy by Householder Income Bracket in Port Ludlow
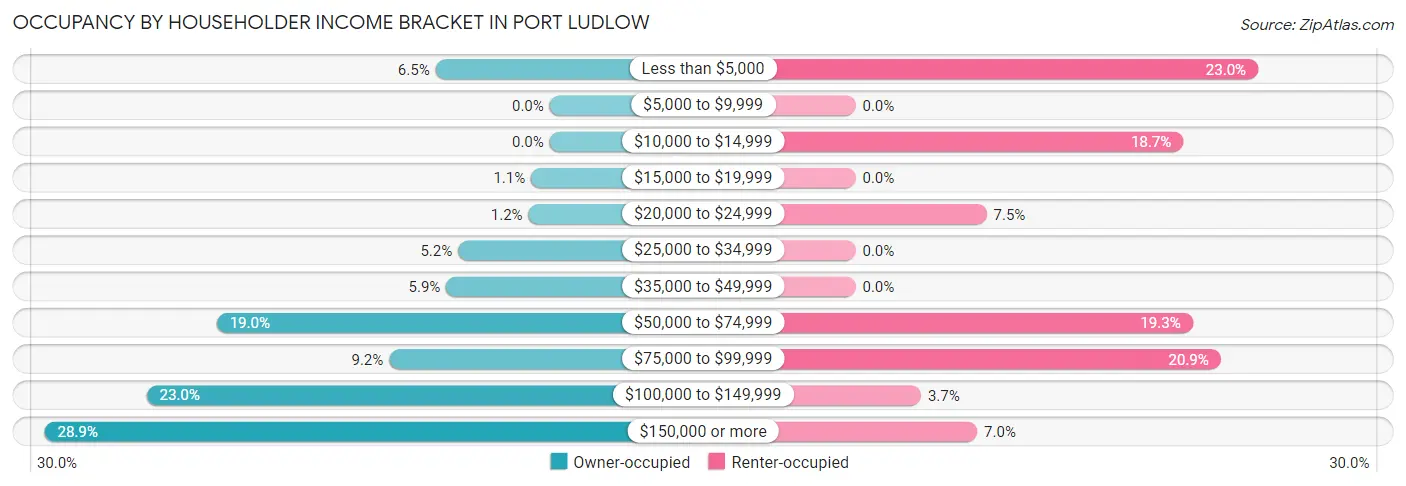
| Income Bracket | Owner-occupied | Renter-occupied |
| Less than $5,000 | 86 (6.5%) | 43 (23.0%) |
| $5,000 to $9,999 | 0 (0.0%) | 0 (0.0%) |
| $10,000 to $14,999 | 0 (0.0%) | 35 (18.7%) |
| $15,000 to $19,999 | 14 (1.1%) | 0 (0.0%) |
| $20,000 to $24,999 | 16 (1.2%) | 14 (7.5%) |
| $25,000 to $34,999 | 69 (5.2%) | 0 (0.0%) |
| $35,000 to $49,999 | 78 (5.9%) | 0 (0.0%) |
| $50,000 to $74,999 | 251 (19.0%) | 36 (19.3%) |
| $75,000 to $99,999 | 121 (9.2%) | 39 (20.9%) |
| $100,000 to $149,999 | 304 (23.0%) | 7 (3.7%) |
| $150,000 or more | 381 (28.9%) | 13 (7.0%) |
| Total | 1,320 (100.0%) | 187 (100.0%) |
Monthly Housing Cost Tiers in Port Ludlow
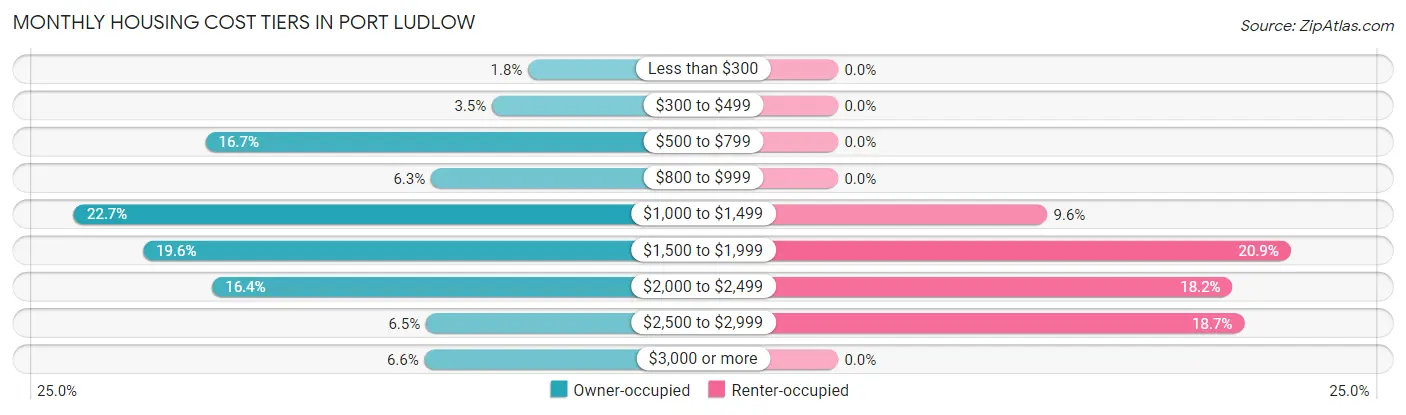
| Monthly Cost | Owner-occupied | Renter-occupied |
| Less than $300 | 24 (1.8%) | 0 (0.0%) |
| $300 to $499 | 46 (3.5%) | 0 (0.0%) |
| $500 to $799 | 220 (16.7%) | 0 (0.0%) |
| $800 to $999 | 83 (6.3%) | 0 (0.0%) |
| $1,000 to $1,499 | 300 (22.7%) | 18 (9.6%) |
| $1,500 to $1,999 | 258 (19.6%) | 39 (20.9%) |
| $2,000 to $2,499 | 216 (16.4%) | 34 (18.2%) |
| $2,500 to $2,999 | 86 (6.5%) | 35 (18.7%) |
| $3,000 or more | 87 (6.6%) | 0 (0.0%) |
| Total | 1,320 (100.0%) | 187 (100.0%) |
Physical Housing Characteristics in Port Ludlow
Housing Structures in Port Ludlow
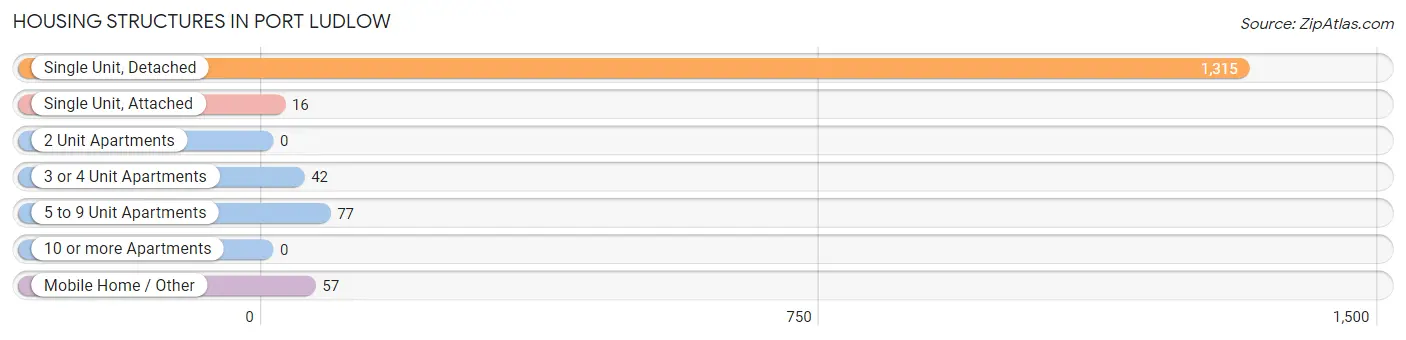
| Structure Type | # Housing Units | % Housing Units |
| Single Unit, Detached | 1,315 | 87.3% |
| Single Unit, Attached | 16 | 1.1% |
| 2 Unit Apartments | 0 | 0.0% |
| 3 or 4 Unit Apartments | 42 | 2.8% |
| 5 to 9 Unit Apartments | 77 | 5.1% |
| 10 or more Apartments | 0 | 0.0% |
| Mobile Home / Other | 57 | 3.8% |
| Total | 1,507 | 100.0% |
Housing Structures by Occupancy in Port Ludlow
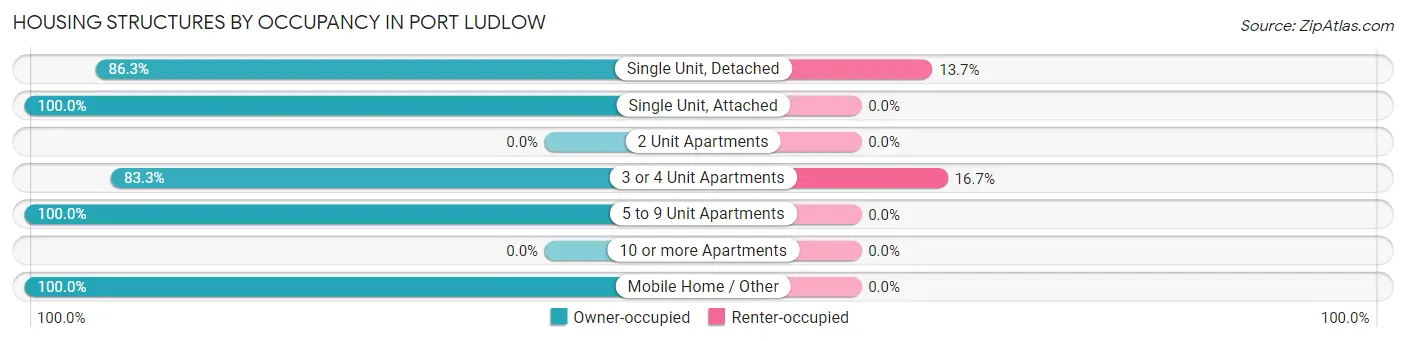
| Structure Type | Owner-occupied | Renter-occupied |
| Single Unit, Detached | 1,135 (86.3%) | 180 (13.7%) |
| Single Unit, Attached | 16 (100.0%) | 0 (0.0%) |
| 2 Unit Apartments | 0 (0.0%) | 0 (0.0%) |
| 3 or 4 Unit Apartments | 35 (83.3%) | 7 (16.7%) |
| 5 to 9 Unit Apartments | 77 (100.0%) | 0 (0.0%) |
| 10 or more Apartments | 0 (0.0%) | 0 (0.0%) |
| Mobile Home / Other | 57 (100.0%) | 0 (0.0%) |
| Total | 1,320 (87.6%) | 187 (12.4%) |
Housing Structures by Number of Rooms in Port Ludlow
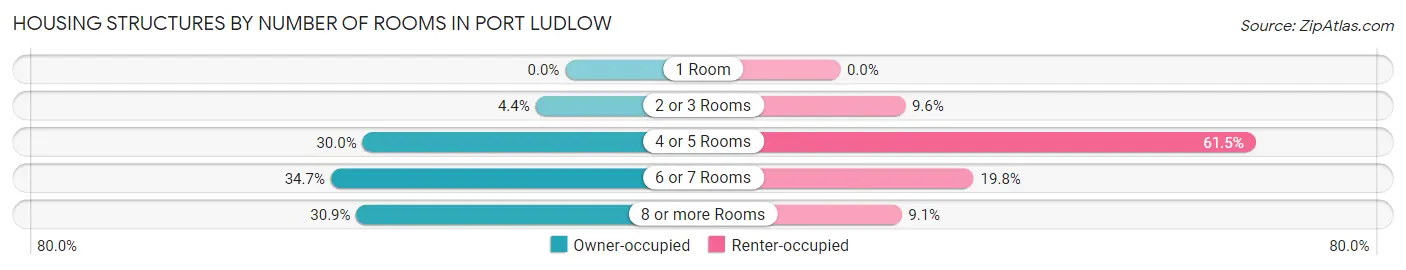
| Number of Rooms | Owner-occupied | Renter-occupied |
| 1 Room | 0 (0.0%) | 0 (0.0%) |
| 2 or 3 Rooms | 58 (4.4%) | 18 (9.6%) |
| 4 or 5 Rooms | 396 (30.0%) | 115 (61.5%) |
| 6 or 7 Rooms | 458 (34.7%) | 37 (19.8%) |
| 8 or more Rooms | 408 (30.9%) | 17 (9.1%) |
| Total | 1,320 (100.0%) | 187 (100.0%) |
Housing Structure by Heating Type in Port Ludlow
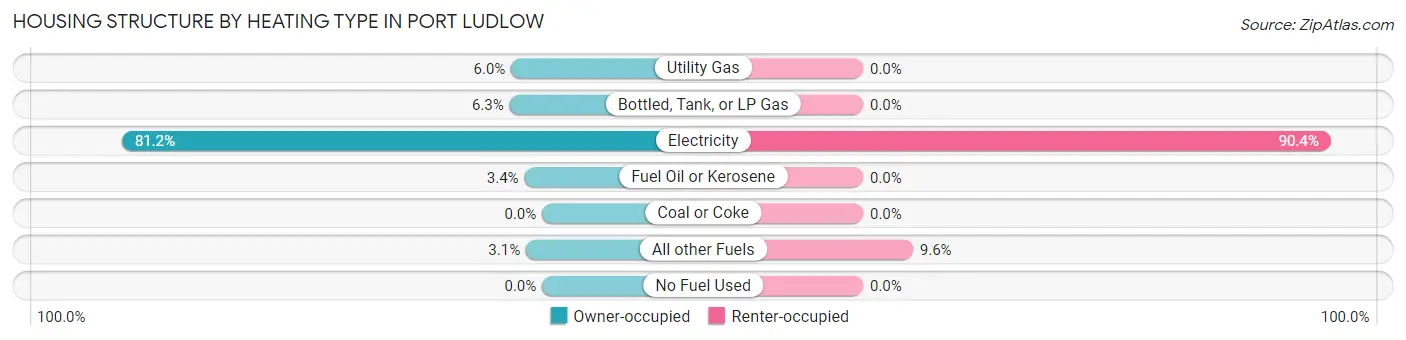
| Heating Type | Owner-occupied | Renter-occupied |
| Utility Gas | 79 (6.0%) | 0 (0.0%) |
| Bottled, Tank, or LP Gas | 83 (6.3%) | 0 (0.0%) |
| Electricity | 1,072 (81.2%) | 169 (90.4%) |
| Fuel Oil or Kerosene | 45 (3.4%) | 0 (0.0%) |
| Coal or Coke | 0 (0.0%) | 0 (0.0%) |
| All other Fuels | 41 (3.1%) | 18 (9.6%) |
| No Fuel Used | 0 (0.0%) | 0 (0.0%) |
| Total | 1,320 (100.0%) | 187 (100.0%) |
Household Vehicle Usage in Port Ludlow
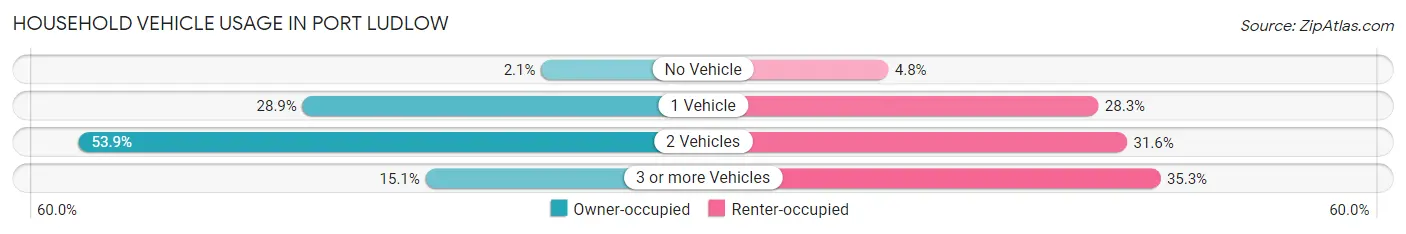
| Vehicles per Household | Owner-occupied | Renter-occupied |
| No Vehicle | 28 (2.1%) | 9 (4.8%) |
| 1 Vehicle | 381 (28.9%) | 53 (28.3%) |
| 2 Vehicles | 712 (53.9%) | 59 (31.6%) |
| 3 or more Vehicles | 199 (15.1%) | 66 (35.3%) |
| Total | 1,320 (100.0%) | 187 (100.0%) |
Real Estate & Mortgages in Port Ludlow
Real Estate and Mortgage Overview in Port Ludlow
| Characteristic | Without Mortgage | With Mortgage |
| Housing Units | 514 | 806 |
| Median Property Value | $531,300 | $567,500 |
| Median Household Income | $82,279 | $287 |
| Monthly Housing Costs | $765 | $87 |
| Real Estate Taxes | $4,383 | $13 |
Property Value by Mortgage Status in Port Ludlow
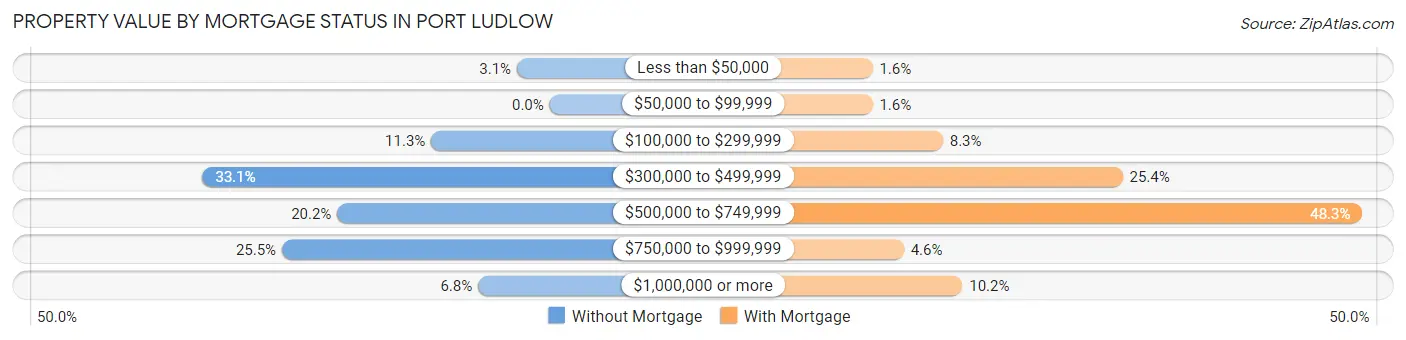
| Property Value | Without Mortgage | With Mortgage |
| Less than $50,000 | 16 (3.1%) | 13 (1.6%) |
| $50,000 to $99,999 | 0 (0.0%) | 13 (1.6%) |
| $100,000 to $299,999 | 58 (11.3%) | 67 (8.3%) |
| $300,000 to $499,999 | 170 (33.1%) | 205 (25.4%) |
| $500,000 to $749,999 | 104 (20.2%) | 389 (48.3%) |
| $750,000 to $999,999 | 131 (25.5%) | 37 (4.6%) |
| $1,000,000 or more | 35 (6.8%) | 82 (10.2%) |
| Total | 514 (100.0%) | 806 (100.0%) |
Household Income by Mortgage Status in Port Ludlow
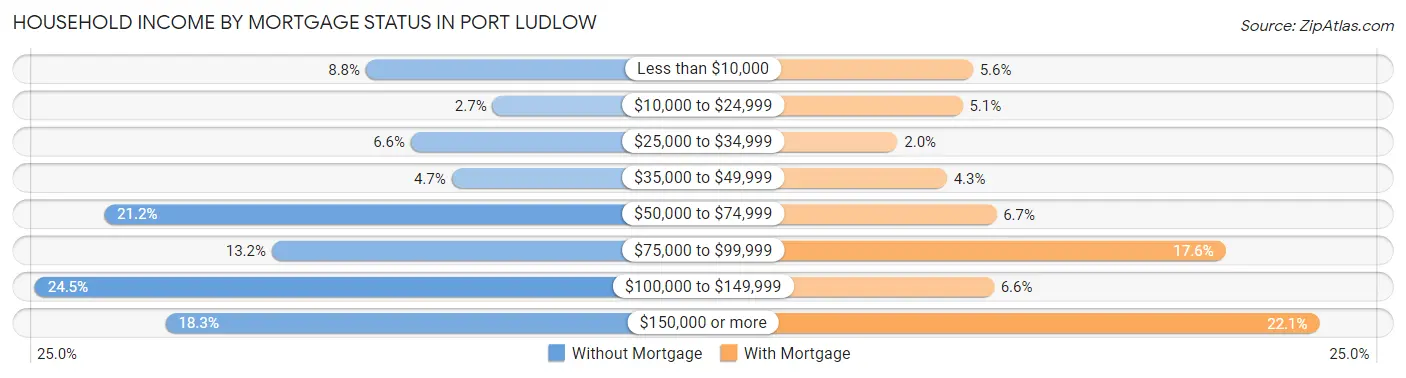
| Household Income | Without Mortgage | With Mortgage |
| Less than $10,000 | 45 (8.7%) | 45 (5.6%) |
| $10,000 to $24,999 | 14 (2.7%) | 41 (5.1%) |
| $25,000 to $34,999 | 34 (6.6%) | 16 (2.0%) |
| $35,000 to $49,999 | 24 (4.7%) | 35 (4.3%) |
| $50,000 to $74,999 | 109 (21.2%) | 54 (6.7%) |
| $75,000 to $99,999 | 68 (13.2%) | 142 (17.6%) |
| $100,000 to $149,999 | 126 (24.5%) | 53 (6.6%) |
| $150,000 or more | 94 (18.3%) | 178 (22.1%) |
| Total | 514 (100.0%) | 806 (100.0%) |
Property Value to Household Income Ratio in Port Ludlow
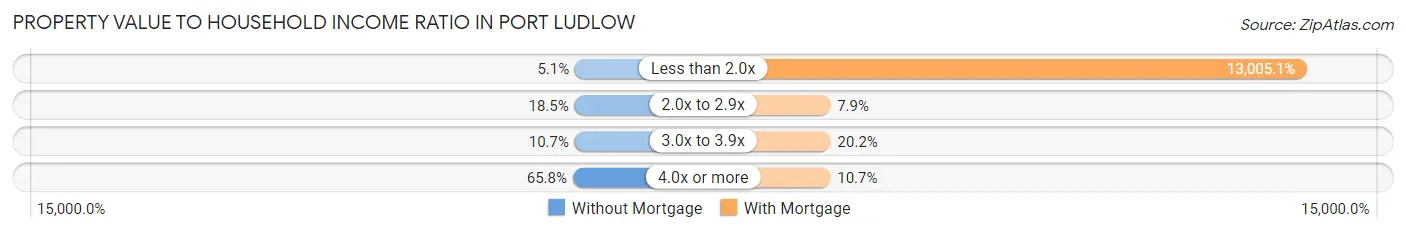
| Value-to-Income Ratio | Without Mortgage | With Mortgage |
| Less than 2.0x | 26 (5.1%) | 104,821 (13,005.1%) |
| 2.0x to 2.9x | 95 (18.5%) | 64 (7.9%) |
| 3.0x to 3.9x | 55 (10.7%) | 163 (20.2%) |
| 4.0x or more | 338 (65.8%) | 86 (10.7%) |
| Total | 514 (100.0%) | 806 (100.0%) |
Real Estate Taxes by Mortgage Status in Port Ludlow
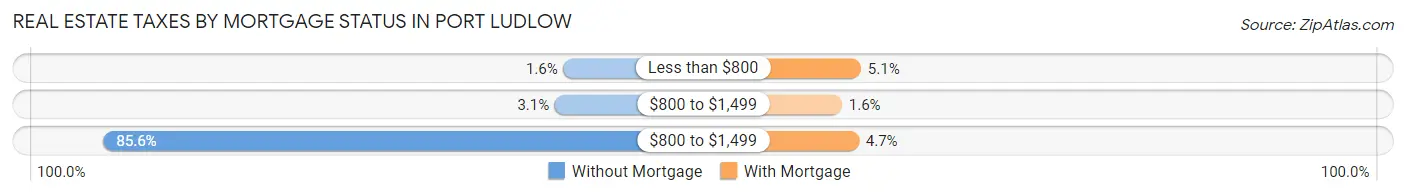
| Property Taxes | Without Mortgage | With Mortgage |
| Less than $800 | 8 (1.6%) | 41 (5.1%) |
| $800 to $1,499 | 16 (3.1%) | 13 (1.6%) |
| $800 to $1,499 | 440 (85.6%) | 38 (4.7%) |
| Total | 514 (100.0%) | 806 (100.0%) |
Health & Disability in Port Ludlow
Health Insurance Coverage by Age in Port Ludlow
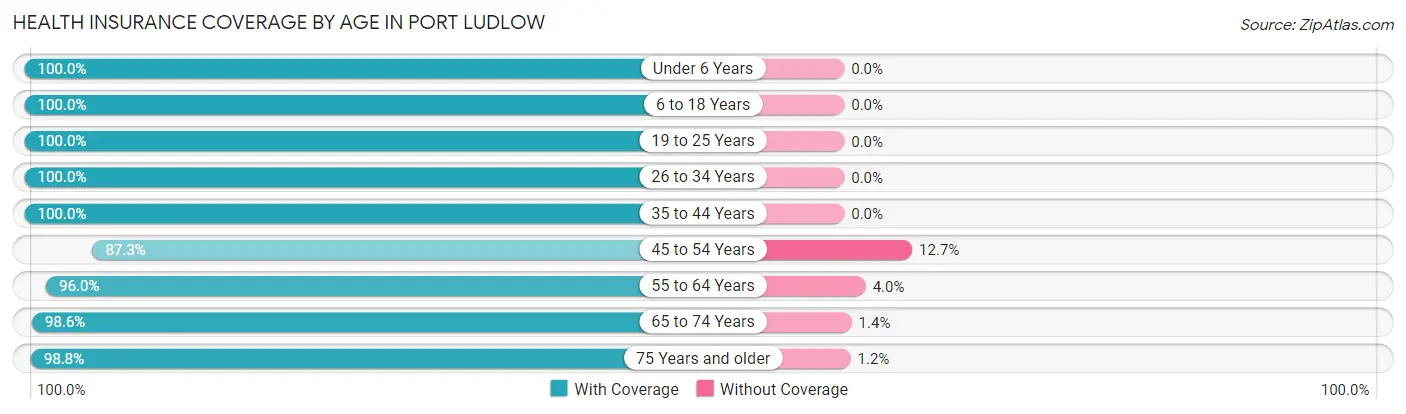
| Age Bracket | With Coverage | Without Coverage |
| Under 6 Years | 193 (100.0%) | 0 (0.0%) |
| 6 to 18 Years | 279 (100.0%) | 0 (0.0%) |
| 19 to 25 Years | 62 (100.0%) | 0 (0.0%) |
| 26 to 34 Years | 148 (100.0%) | 0 (0.0%) |
| 35 to 44 Years | 299 (100.0%) | 0 (0.0%) |
| 45 to 54 Years | 200 (87.3%) | 29 (12.7%) |
| 55 to 64 Years | 360 (96.0%) | 15 (4.0%) |
| 65 to 74 Years | 719 (98.6%) | 10 (1.4%) |
| 75 Years and older | 752 (98.8%) | 9 (1.2%) |
| Total | 3,012 (98.0%) | 63 (2.1%) |
Health Insurance Coverage by Citizenship Status in Port Ludlow
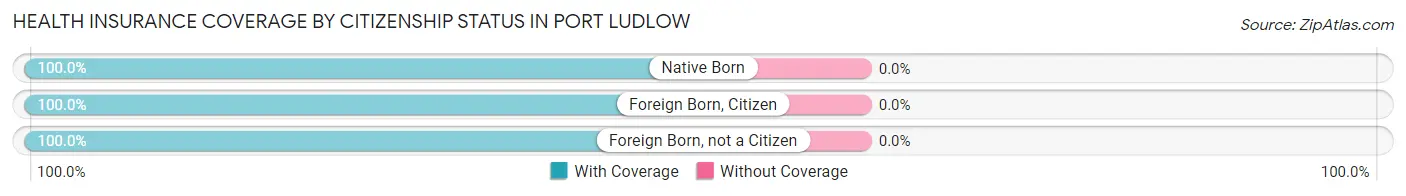
| Citizenship Status | With Coverage | Without Coverage |
| Native Born | 193 (100.0%) | 0 (0.0%) |
| Foreign Born, Citizen | 279 (100.0%) | 0 (0.0%) |
| Foreign Born, not a Citizen | 62 (100.0%) | 0 (0.0%) |
Health Insurance Coverage by Household Income in Port Ludlow
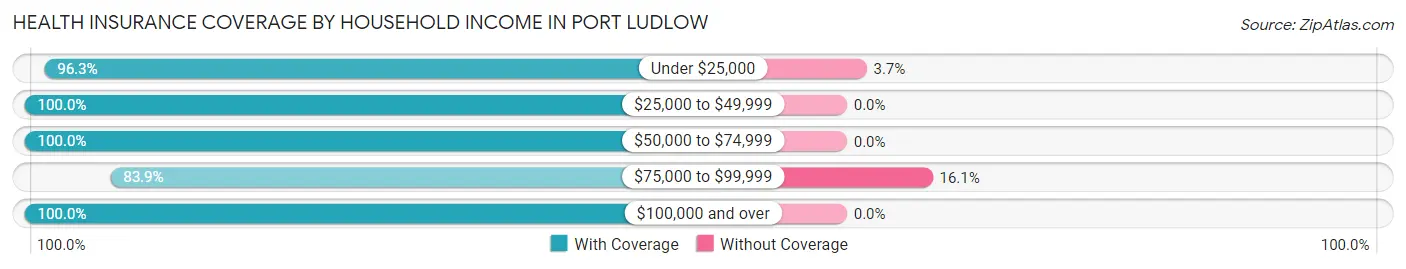
| Household Income | With Coverage | Without Coverage |
| Under $25,000 | 494 (96.3%) | 19 (3.7%) |
| $25,000 to $49,999 | 185 (100.0%) | 0 (0.0%) |
| $50,000 to $74,999 | 548 (100.0%) | 0 (0.0%) |
| $75,000 to $99,999 | 230 (83.9%) | 44 (16.1%) |
| $100,000 and over | 1,555 (100.0%) | 0 (0.0%) |
Public vs Private Health Insurance Coverage by Age in Port Ludlow
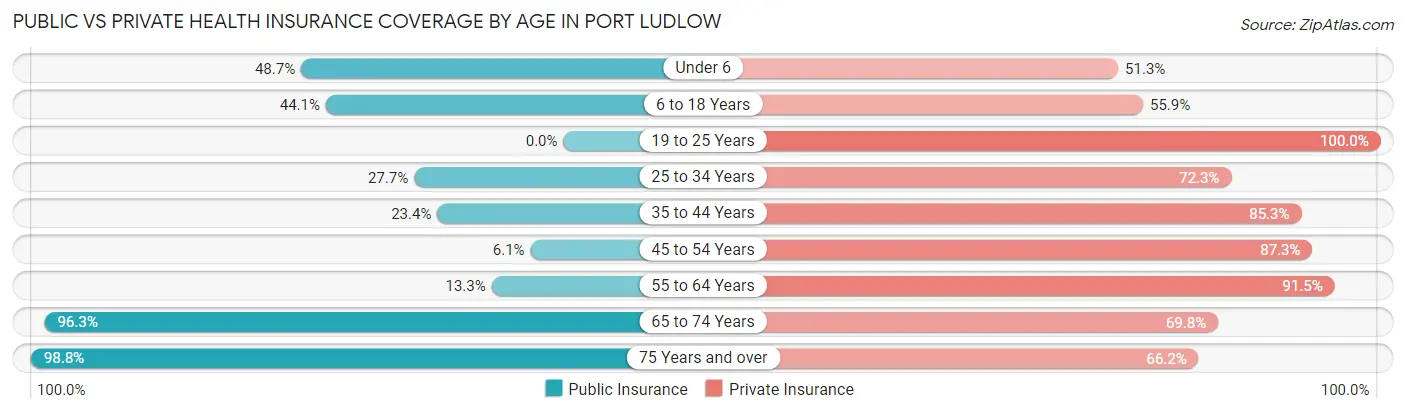
| Age Bracket | Public Insurance | Private Insurance |
| Under 6 | 94 (48.7%) | 99 (51.3%) |
| 6 to 18 Years | 123 (44.1%) | 156 (55.9%) |
| 19 to 25 Years | 0 (0.0%) | 62 (100.0%) |
| 25 to 34 Years | 41 (27.7%) | 107 (72.3%) |
| 35 to 44 Years | 70 (23.4%) | 255 (85.3%) |
| 45 to 54 Years | 14 (6.1%) | 200 (87.3%) |
| 55 to 64 Years | 50 (13.3%) | 343 (91.5%) |
| 65 to 74 Years | 702 (96.3%) | 509 (69.8%) |
| 75 Years and over | 752 (98.8%) | 504 (66.2%) |
| Total | 1,846 (60.0%) | 2,235 (72.7%) |
Disability Status by Sex by Age in Port Ludlow
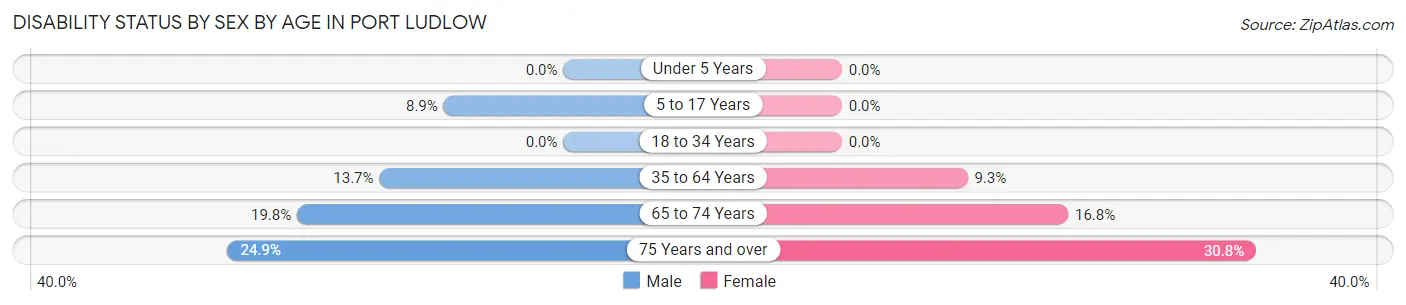
| Age Bracket | Male | Female |
| Under 5 Years | 0 (0.0%) | 0 (0.0%) |
| 5 to 17 Years | 20 (8.9%) | 0 (0.0%) |
| 18 to 34 Years | 0 (0.0%) | 0 (0.0%) |
| 35 to 64 Years | 56 (13.7%) | 46 (9.3%) |
| 65 to 74 Years | 70 (19.8%) | 63 (16.8%) |
| 75 Years and over | 90 (24.9%) | 123 (30.7%) |
Disability Class by Sex by Age in Port Ludlow
Disability Class: Hearing Difficulty
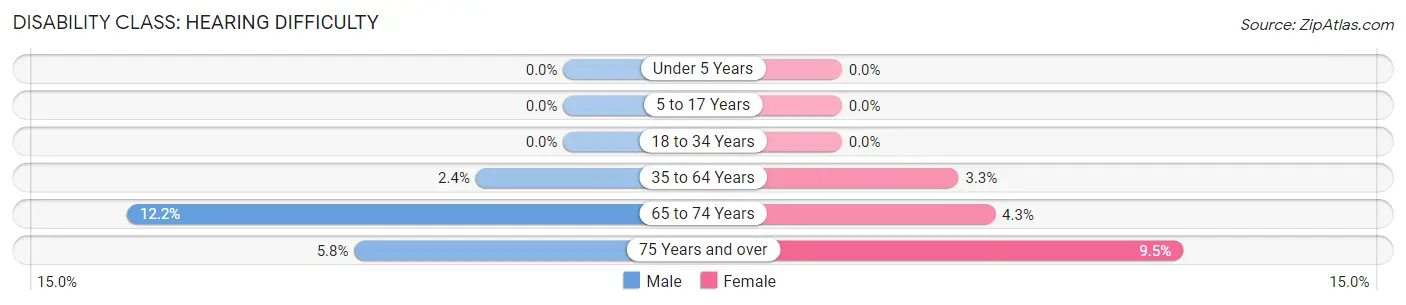
| Age Bracket | Male | Female |
| Under 5 Years | 0 (0.0%) | 0 (0.0%) |
| 5 to 17 Years | 0 (0.0%) | 0 (0.0%) |
| 18 to 34 Years | 0 (0.0%) | 0 (0.0%) |
| 35 to 64 Years | 10 (2.4%) | 16 (3.3%) |
| 65 to 74 Years | 43 (12.1%) | 16 (4.3%) |
| 75 Years and over | 21 (5.8%) | 38 (9.5%) |
Disability Class: Vision Difficulty
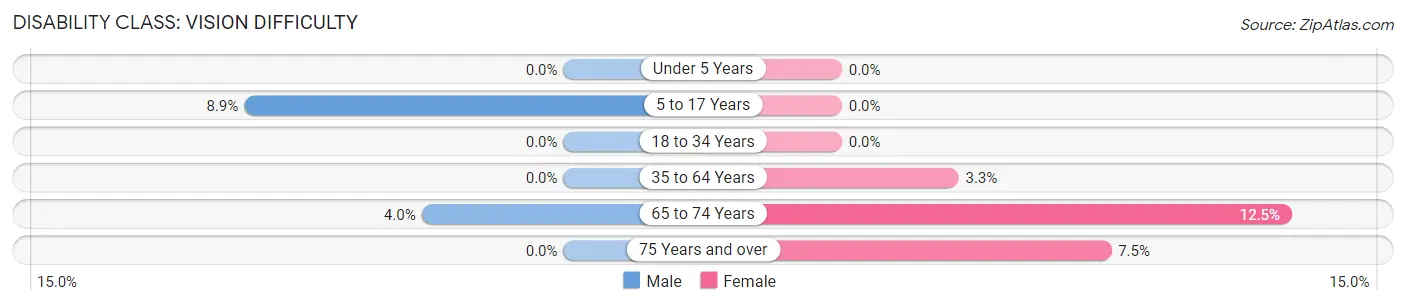
| Age Bracket | Male | Female |
| Under 5 Years | 0 (0.0%) | 0 (0.0%) |
| 5 to 17 Years | 20 (8.9%) | 0 (0.0%) |
| 18 to 34 Years | 0 (0.0%) | 0 (0.0%) |
| 35 to 64 Years | 0 (0.0%) | 16 (3.3%) |
| 65 to 74 Years | 14 (4.0%) | 47 (12.5%) |
| 75 Years and over | 0 (0.0%) | 30 (7.5%) |
Disability Class: Cognitive Difficulty
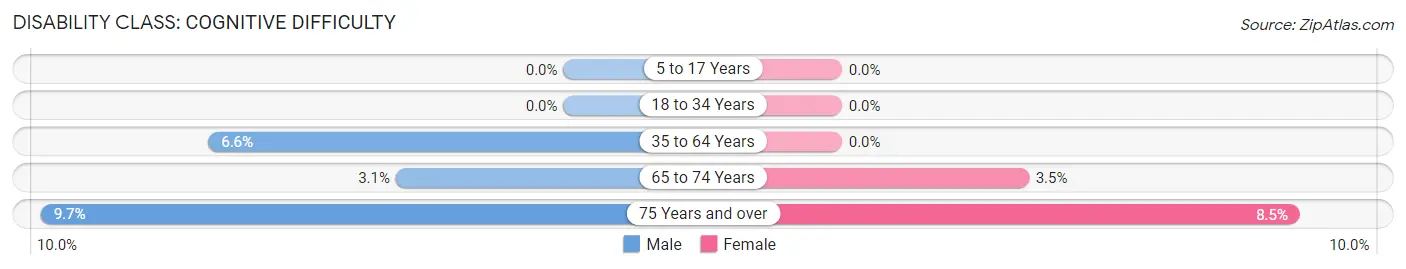
| Age Bracket | Male | Female |
| 5 to 17 Years | 0 (0.0%) | 0 (0.0%) |
| 18 to 34 Years | 0 (0.0%) | 0 (0.0%) |
| 35 to 64 Years | 27 (6.6%) | 0 (0.0%) |
| 65 to 74 Years | 11 (3.1%) | 13 (3.5%) |
| 75 Years and over | 35 (9.7%) | 34 (8.5%) |
Disability Class: Ambulatory Difficulty
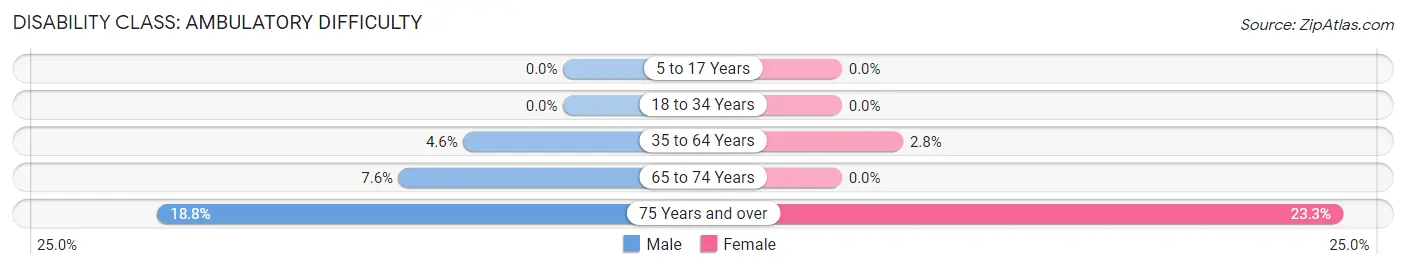
| Age Bracket | Male | Female |
| 5 to 17 Years | 0 (0.0%) | 0 (0.0%) |
| 18 to 34 Years | 0 (0.0%) | 0 (0.0%) |
| 35 to 64 Years | 19 (4.6%) | 14 (2.8%) |
| 65 to 74 Years | 27 (7.6%) | 0 (0.0%) |
| 75 Years and over | 68 (18.8%) | 93 (23.3%) |
Disability Class: Self-Care Difficulty
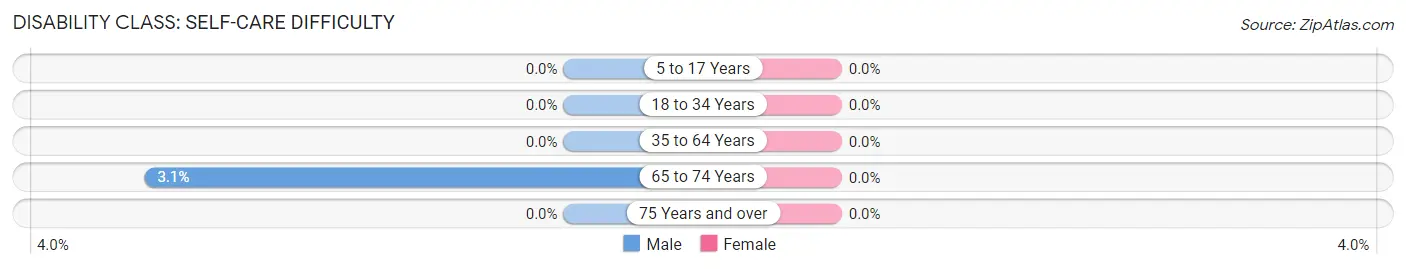
| Age Bracket | Male | Female |
| 5 to 17 Years | 0 (0.0%) | 0 (0.0%) |
| 18 to 34 Years | 0 (0.0%) | 0 (0.0%) |
| 35 to 64 Years | 0 (0.0%) | 0 (0.0%) |
| 65 to 74 Years | 11 (3.1%) | 0 (0.0%) |
| 75 Years and over | 0 (0.0%) | 0 (0.0%) |
Technology Access in Port Ludlow
Computing Device Access in Port Ludlow
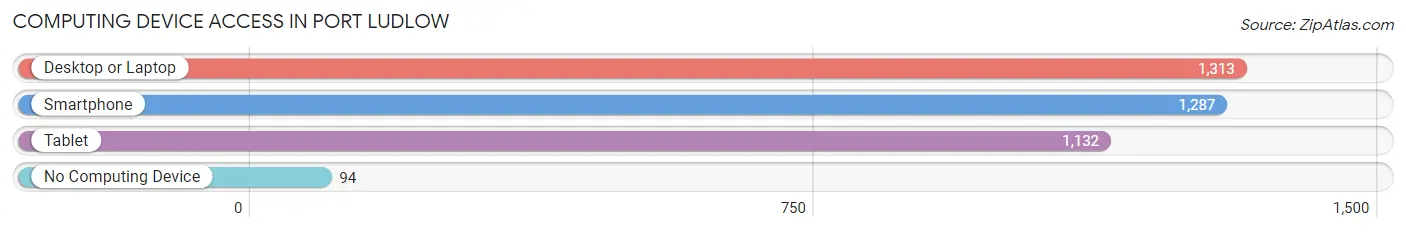
| Device Type | # Households | % Households |
| Desktop or Laptop | 1,313 | 87.1% |
| Smartphone | 1,287 | 85.4% |
| Tablet | 1,132 | 75.1% |
| No Computing Device | 94 | 6.2% |
| Total | 1,507 | 100.0% |
Internet Access in Port Ludlow
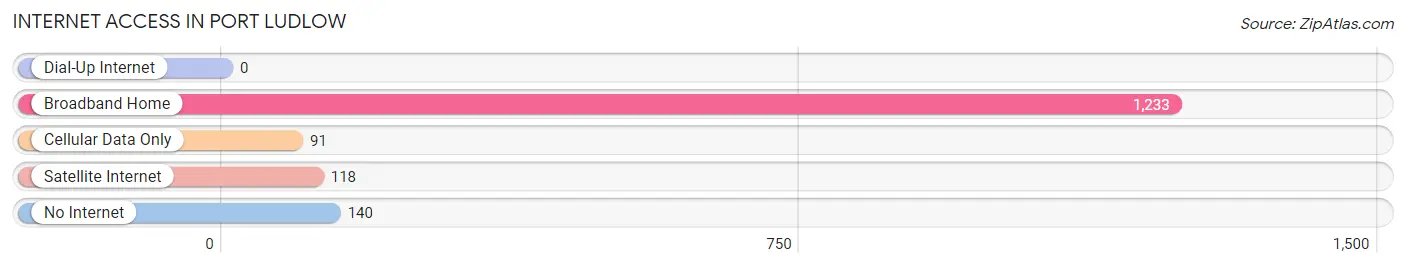
| Internet Type | # Households | % Households |
| Dial-Up Internet | 0 | 0.0% |
| Broadband Home | 1,233 | 81.8% |
| Cellular Data Only | 91 | 6.0% |
| Satellite Internet | 118 | 7.8% |
| No Internet | 140 | 9.3% |
| Total | 1,507 | 100.0% |
Port Ludlow Summary
History
Port Ludlow is a small unincorporated community located in Jefferson County, Washington, United States. It is situated on the Olympic Peninsula, at the head of the Ludlow Bay, and is part of the Port Townsend Micropolitan Statistical Area. The area was first settled in the late 19th century by the S’Klallam tribe, who named the area “Ludlow” after a local chief. The area was later developed by the Puget Sound and Alaska Railroad Company, which built a wharf and a sawmill in the area in the early 1900s. The town was officially incorporated in 1909, and the name was changed to Port Ludlow in 1910.
The town grew rapidly in the early 20th century, and by the 1930s it had become a popular tourist destination. The town was home to several resorts, including the Port Ludlow Resort, which opened in the 1950s and is still in operation today. The town also had a thriving lumber industry, and was home to several sawmills and logging camps.
In the late 20th century, the town began to decline as the logging industry declined and the tourist industry shifted to other areas. The town’s population dropped from a peak of 1,500 in the 1950s to just over 500 in 2000.
Geography
Port Ludlow is located on the Olympic Peninsula, at the head of Ludlow Bay. The town is situated on a narrow strip of land between the bay and the Hood Canal. The town is surrounded by forests and mountains, and is located approximately 25 miles northwest of Port Townsend.
The town has a total area of 2.2 square miles, all of which is land. The town is located at an elevation of approximately 20 feet above sea level.
Economy
Port Ludlow’s economy is largely based on tourism and recreation. The town is home to the Port Ludlow Resort, which offers a variety of amenities, including a golf course, spa, and marina. The resort is a popular destination for visitors from around the world.
The town is also home to several small businesses, including restaurants, shops, and galleries. The town is also home to a number of marinas, which offer boat rentals and other services.
Demographics
As of the 2010 census, the population of Port Ludlow was 1,961. The population is predominantly white (94.3%), with small percentages of Native American (1.2%), Asian (1.1%), and African American (0.7%) residents. The median household income is $50,938, and the median age is 48.7 years. The town has a higher-than-average percentage of residents over the age of 65 (21.3%).
Common Questions
What is Per Capita Income in Port Ludlow?
Per Capita income in Port Ludlow is $60,741.
What is the Median Family Income in Port Ludlow?
Median Family Income in Port Ludlow is $117,019.
What is the Median Household income in Port Ludlow?
Median Household Income in Port Ludlow is $86,891.
What is Income or Wage Gap in Port Ludlow?
Income or Wage Gap in Port Ludlow is 56.6%.
Women in Port Ludlow earn 43.4 cents for every dollar earned by a man.
What is Inequality or Gini Index in Port Ludlow?
Inequality or Gini Index in Port Ludlow is 0.49.
What is the Total Population of Port Ludlow?
Total Population of Port Ludlow is 3,096.
What is the Total Male Population of Port Ludlow?
Total Male Population of Port Ludlow is 1,497.
What is the Total Female Population of Port Ludlow?
Total Female Population of Port Ludlow is 1,599.
What is the Ratio of Males per 100 Females in Port Ludlow?
There are 93.62 Males per 100 Females in Port Ludlow.
What is the Ratio of Females per 100 Males in Port Ludlow?
There are 106.81 Females per 100 Males in Port Ludlow.
What is the Median Population Age in Port Ludlow?
Median Population Age in Port Ludlow is 64.4 Years.
What is the Average Family Size in Port Ludlow
Average Family Size in Port Ludlow is 2.5 People.
What is the Average Household Size in Port Ludlow
Average Household Size in Port Ludlow is 2.0 People.
How Large is the Labor Force in Port Ludlow?
There are 1,003 People in the Labor Forcein in Port Ludlow.
What is the Percentage of People in the Labor Force in Port Ludlow?
38.1% of People are in the Labor Force in Port Ludlow.
What is the Unemployment Rate in Port Ludlow?
Unemployment Rate in Port Ludlow is 5.3%.