Palouse, WA Map & Demographics
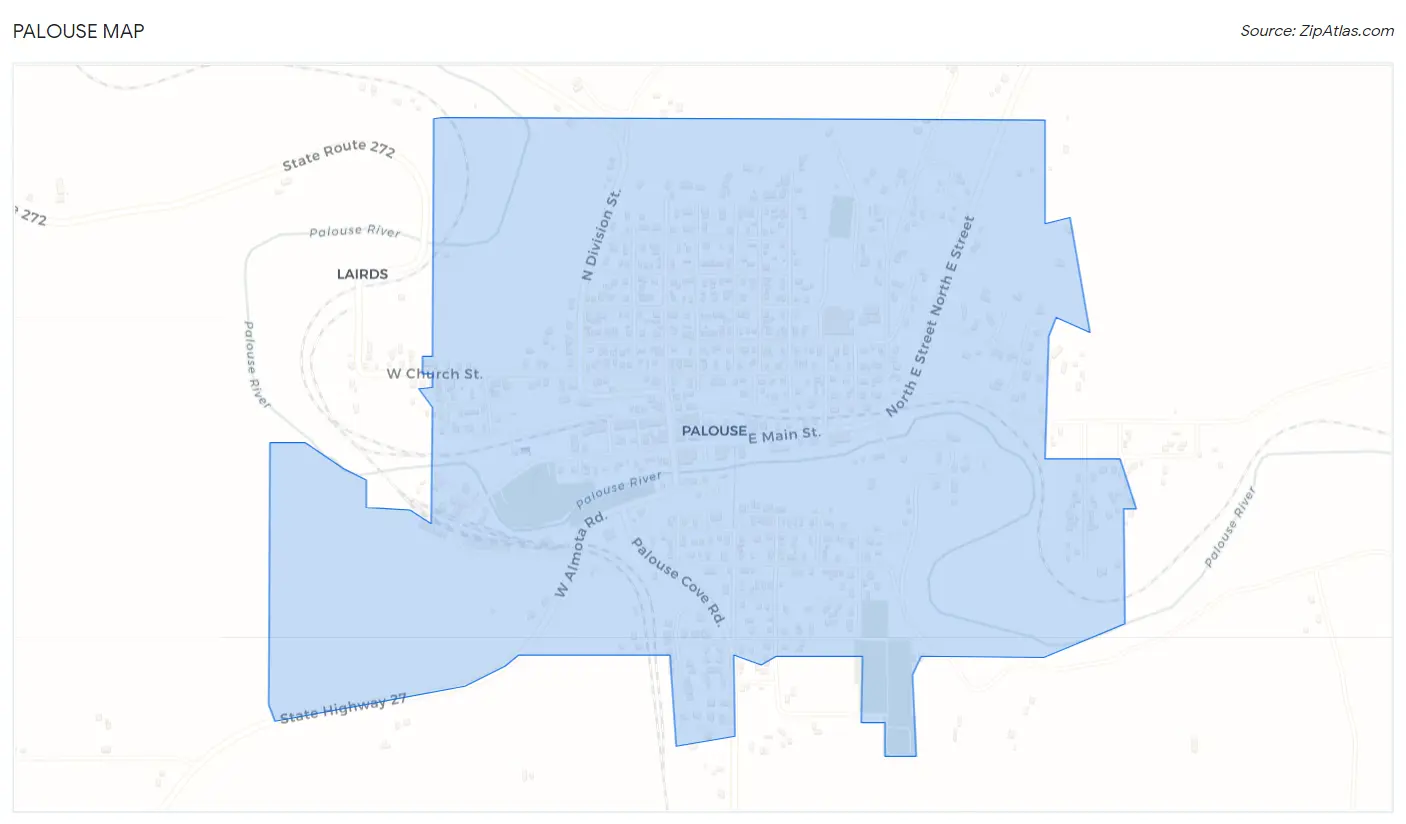
Palouse Map
Palouse Overview
$41,091
PER CAPITA INCOME
$120,568
AVG FAMILY INCOME
$89,479
AVG HOUSEHOLD INCOME
18.1%
WAGE / INCOME GAP [ % ]
81.9¢/ $1
WAGE / INCOME GAP [ $ ]
0.36
INEQUALITY / GINI INDEX
997
TOTAL POPULATION
553
MALE POPULATION
444
FEMALE POPULATION
124.55
MALES / 100 FEMALES
80.29
FEMALES / 100 MALES
44.6
MEDIAN AGE
3.1
AVG FAMILY SIZE
2.4
AVG HOUSEHOLD SIZE
516
LABOR FORCE [ PEOPLE ]
67.0%
PERCENT IN LABOR FORCE
1.4%
UNEMPLOYMENT RATE
Palouse Zip Codes
Palouse Area Codes
Income in Palouse
Income Overview in Palouse
Per Capita Income in Palouse is $41,091, while median incomes of families and households are $120,568 and $89,479 respectively.
| Characteristic | Number | Measure |
| Per Capita Income | 997 | $41,091 |
| Median Family Income | 247 | $120,568 |
| Mean Family Income | 247 | $126,306 |
| Median Household Income | 407 | $89,479 |
| Mean Household Income | 407 | $102,363 |
| Income Deficit | 247 | $0 |
| Wage / Income Gap (%) | 997 | 18.10% |
| Wage / Income Gap ($) | 997 | 81.90¢ per $1 |
| Gini / Inequality Index | 997 | 0.36 |
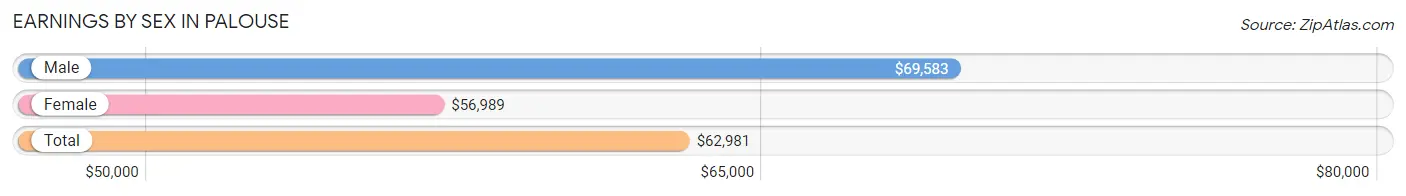
Earnings by Sex in Palouse
Average Earnings in Palouse are $62,981, $69,583 for men and $56,989 for women, a difference of 18.1%.
| Sex | Number | Average Earnings |
| Male | 300 (55.9%) | $69,583 |
| Female | 237 (44.1%) | $56,989 |
| Total | 537 (100.0%) | $62,981 |
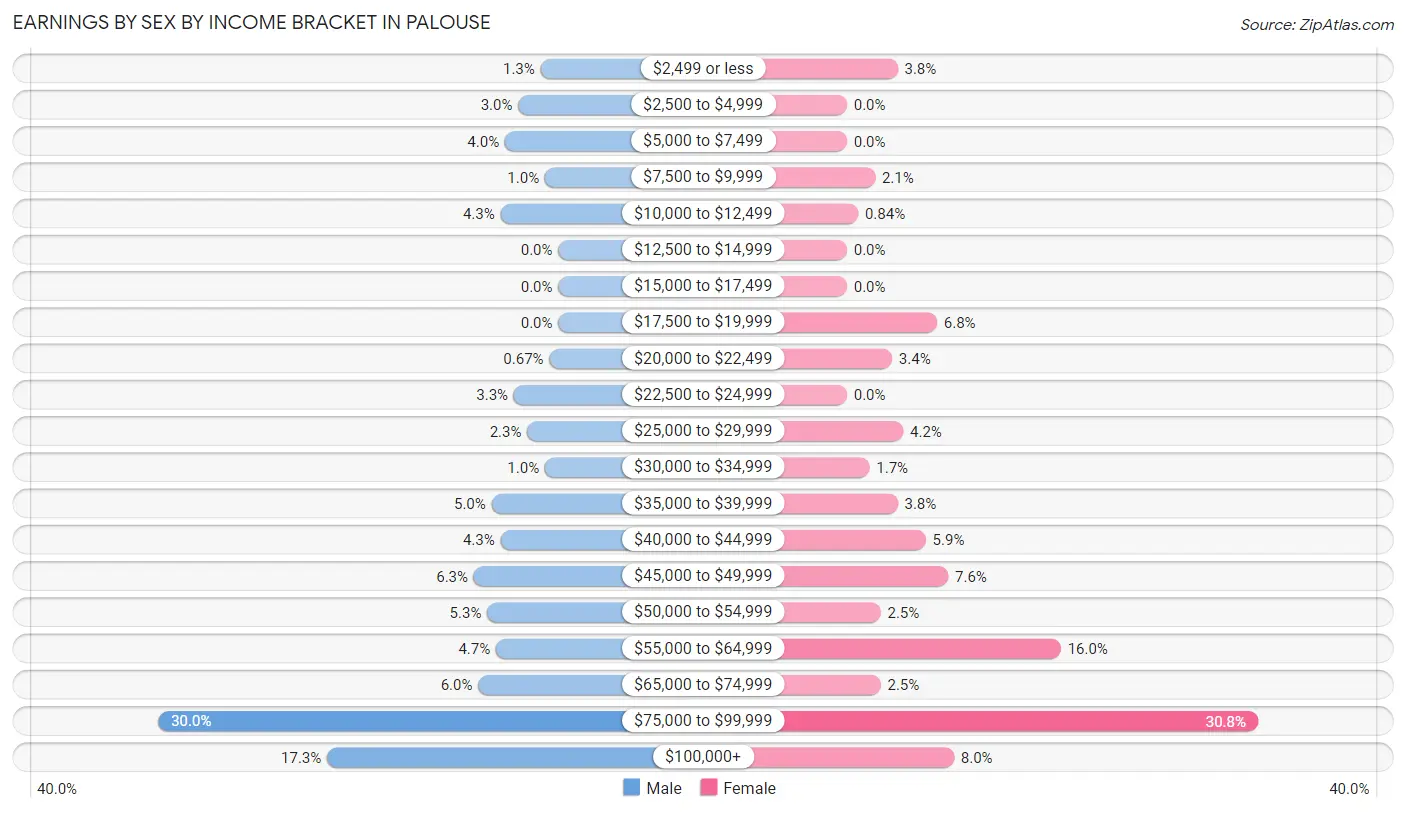
Earnings by Sex by Income Bracket in Palouse
The most common earnings brackets in Palouse are $75,000 to $99,999 for men (90 | 30.0%) and $75,000 to $99,999 for women (73 | 30.8%).
| Income | Male | Female |
| $2,499 or less | 4 (1.3%) | 9 (3.8%) |
| $2,500 to $4,999 | 9 (3.0%) | 0 (0.0%) |
| $5,000 to $7,499 | 12 (4.0%) | 0 (0.0%) |
| $7,500 to $9,999 | 3 (1.0%) | 5 (2.1%) |
| $10,000 to $12,499 | 13 (4.3%) | 2 (0.8%) |
| $12,500 to $14,999 | 0 (0.0%) | 0 (0.0%) |
| $15,000 to $17,499 | 0 (0.0%) | 0 (0.0%) |
| $17,500 to $19,999 | 0 (0.0%) | 16 (6.8%) |
| $20,000 to $22,499 | 2 (0.7%) | 8 (3.4%) |
| $22,500 to $24,999 | 10 (3.3%) | 0 (0.0%) |
| $25,000 to $29,999 | 7 (2.3%) | 10 (4.2%) |
| $30,000 to $34,999 | 3 (1.0%) | 4 (1.7%) |
| $35,000 to $39,999 | 15 (5.0%) | 9 (3.8%) |
| $40,000 to $44,999 | 13 (4.3%) | 14 (5.9%) |
| $45,000 to $49,999 | 19 (6.3%) | 18 (7.6%) |
| $50,000 to $54,999 | 16 (5.3%) | 6 (2.5%) |
| $55,000 to $64,999 | 14 (4.7%) | 38 (16.0%) |
| $65,000 to $74,999 | 18 (6.0%) | 6 (2.5%) |
| $75,000 to $99,999 | 90 (30.0%) | 73 (30.8%) |
| $100,000+ | 52 (17.3%) | 19 (8.0%) |
| Total | 300 (100.0%) | 237 (100.0%) |
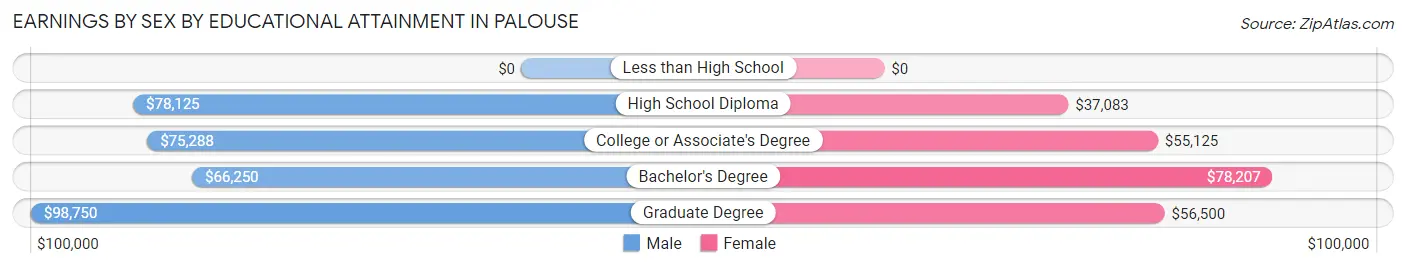
Earnings by Sex by Educational Attainment in Palouse
Average earnings in Palouse are $75,577 for men and $58,000 for women, a difference of 23.3%. Men with an educational attainment of graduate degree enjoy the highest average annual earnings of $98,750, while those with bachelor's degree education earn the least with $66,250. Women with an educational attainment of bachelor's degree earn the most with the average annual earnings of $78,207, while those with high school diploma education have the smallest earnings of $37,083.
| Educational Attainment | Male Income | Female Income |
| Less than High School | - | - |
| High School Diploma | $78,125 | $37,083 |
| College or Associate's Degree | $75,288 | $55,125 |
| Bachelor's Degree | $66,250 | $78,207 |
| Graduate Degree | $98,750 | $56,500 |
| Total | $75,577 | $58,000 |
Family Income in Palouse
Family Income Brackets in Palouse
According to the Palouse family income data, there are 70 families falling into the $100,000 to $149,999 income range, which is the most common income bracket and makes up 28.3% of all families.
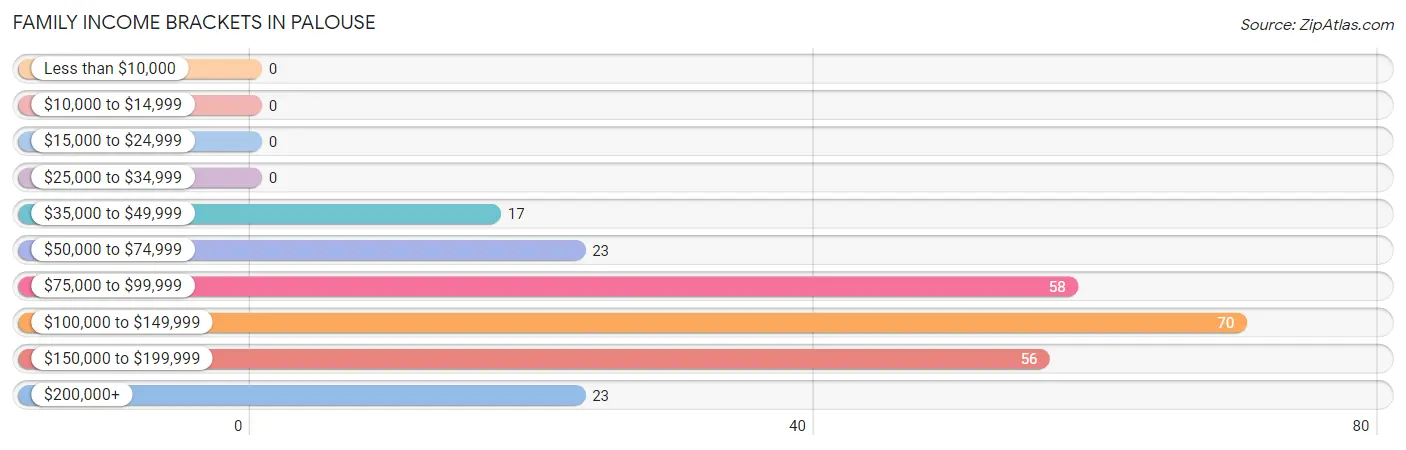
| Income Bracket | # Families | % Families |
| Less than $10,000 | 0 | 0.0% |
| $10,000 to $14,999 | 0 | 0.0% |
| $15,000 to $24,999 | 0 | 0.0% |
| $25,000 to $34,999 | 0 | 0.0% |
| $35,000 to $49,999 | 17 | 6.9% |
| $50,000 to $74,999 | 23 | 9.3% |
| $75,000 to $99,999 | 58 | 23.5% |
| $100,000 to $149,999 | 70 | 28.3% |
| $150,000 to $199,999 | 56 | 22.7% |
| $200,000+ | 23 | 9.3% |
Family Income by Famaliy Size in Palouse
4-person families (48 | 19.4%) account for the highest median family income in Palouse with $157,778 per family, while 2-person families (133 | 53.8%) have the highest median income of $49,792 per family member.
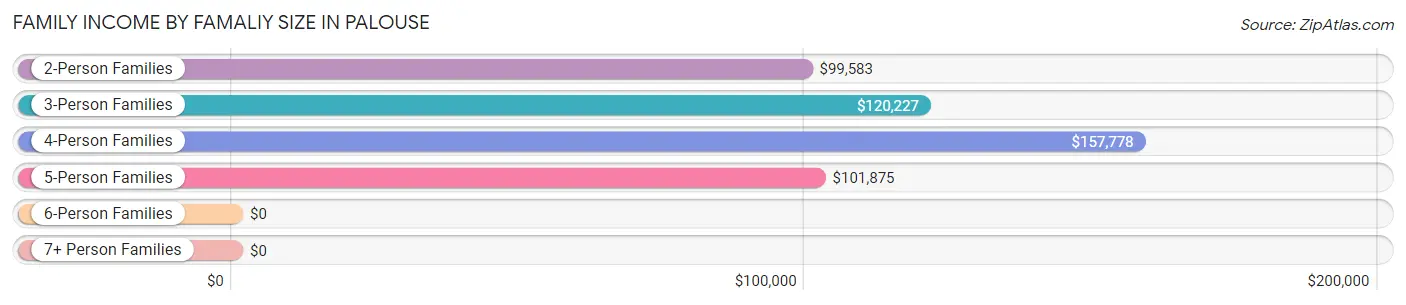
| Income Bracket | # Families | Median Income |
| 2-Person Families | 133 (53.8%) | $99,583 |
| 3-Person Families | 38 (15.4%) | $120,227 |
| 4-Person Families | 48 (19.4%) | $157,778 |
| 5-Person Families | 24 (9.7%) | $101,875 |
| 6-Person Families | 4 (1.6%) | $0 |
| 7+ Person Families | 0 (0.0%) | $0 |
| Total | 247 (100.0%) | $120,568 |
Family Income by Number of Earners in Palouse
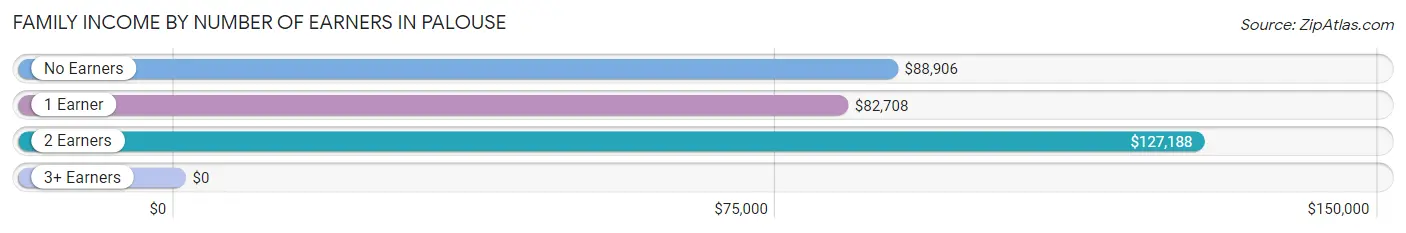
| Number of Earners | # Families | Median Income |
| No Earners | 23 (9.3%) | $88,906 |
| 1 Earner | 57 (23.1%) | $82,708 |
| 2 Earners | 143 (57.9%) | $127,188 |
| 3+ Earners | 24 (9.7%) | $0 |
| Total | 247 (100.0%) | $120,568 |
Household Income in Palouse
Household Income Brackets in Palouse
With 91 households falling in the category, the $100,000 to $149,999 income range is the most frequent in Palouse, accounting for 22.4% of all households.
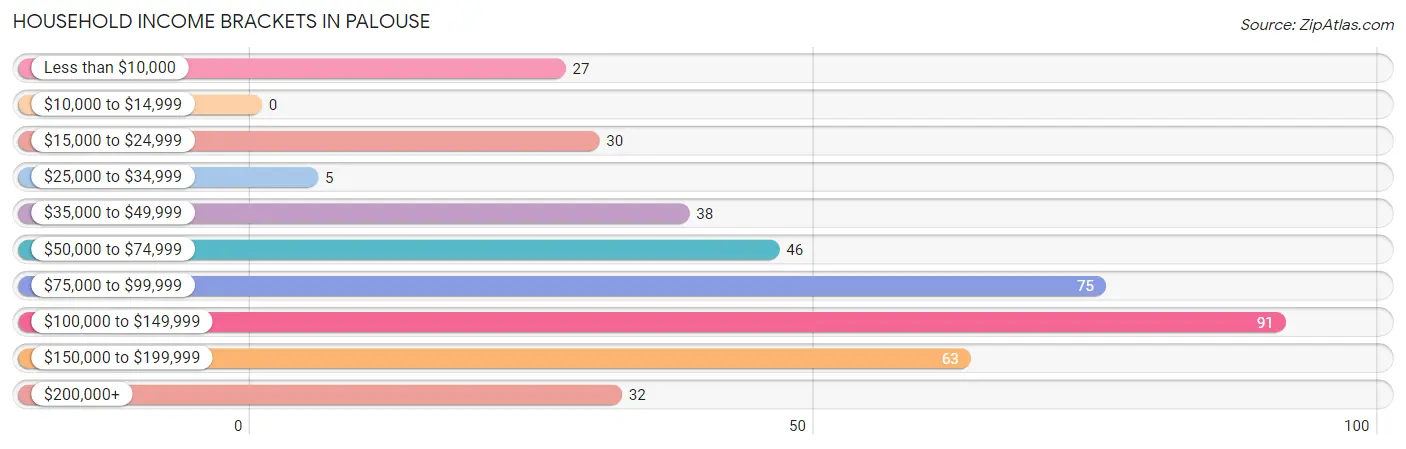
| Income Bracket | # Households | % Households |
| Less than $10,000 | 27 | 6.6% |
| $10,000 to $14,999 | 0 | 0.0% |
| $15,000 to $24,999 | 30 | 7.4% |
| $25,000 to $34,999 | 5 | 1.2% |
| $35,000 to $49,999 | 38 | 9.3% |
| $50,000 to $74,999 | 46 | 11.3% |
| $75,000 to $99,999 | 75 | 18.4% |
| $100,000 to $149,999 | 91 | 22.4% |
| $150,000 to $199,999 | 63 | 15.5% |
| $200,000+ | 32 | 7.9% |
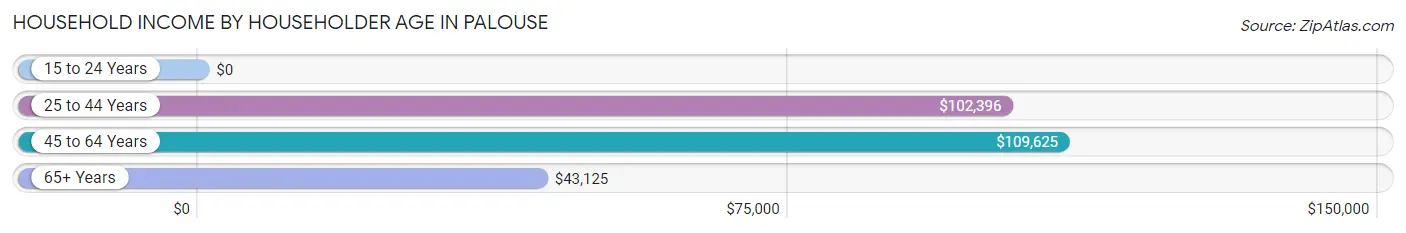
Household Income by Householder Age in Palouse
The median household income in Palouse is $89,479, with the highest median household income of $109,625 found in the 45 to 64 years age bracket for the primary householder. A total of 193 households (47.4%) fall into this category. Meanwhile, the 15 to 24 years age bracket for the primary householder has the lowest median household income of $0, with 9 households (2.2%) in this group.
| Income Bracket | # Households | Median Income |
| 15 to 24 Years | 9 (2.2%) | $0 |
| 25 to 44 Years | 97 (23.8%) | $102,396 |
| 45 to 64 Years | 193 (47.4%) | $109,625 |
| 65+ Years | 108 (26.5%) | $43,125 |
| Total | 407 (100.0%) | $89,479 |
Poverty in Palouse
Income Below Poverty by Sex and Age in Palouse
With 3.9% poverty level for males and 2.7% for females among the residents of Palouse, 65 to 74 year old males and 18 to 24 year old females are the most vulnerable to poverty, with 15 males (19.0%) and 6 females (37.5%) in their respective age groups living below the poverty level.
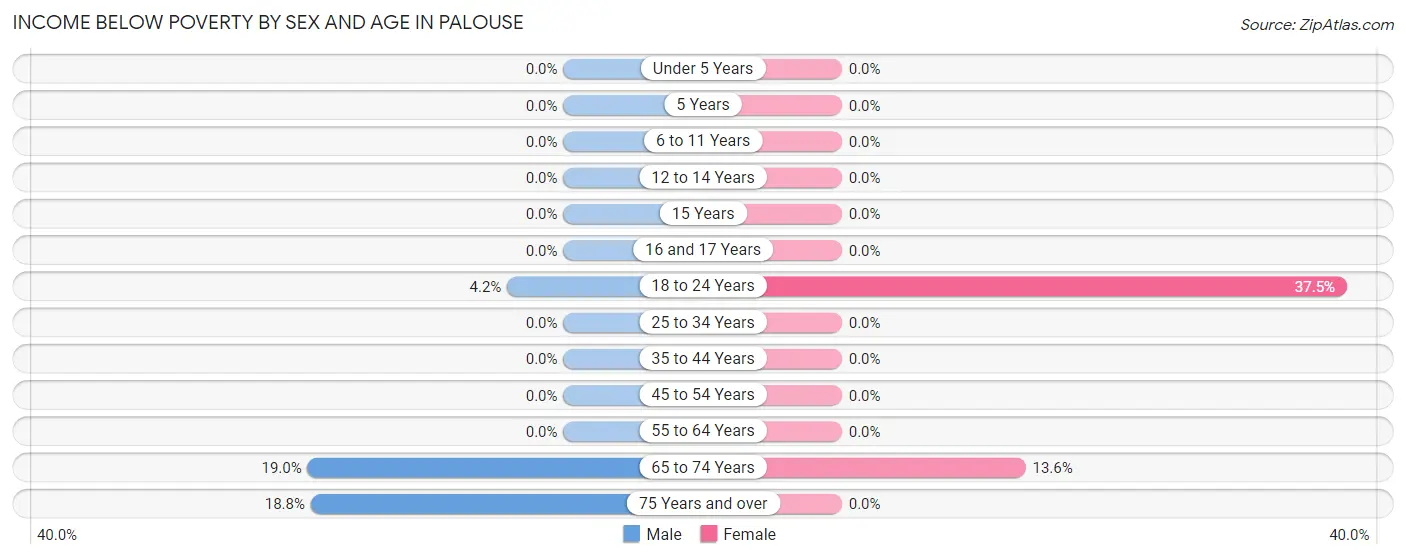
| Age Bracket | Male | Female |
| Under 5 Years | 0 (0.0%) | 0 (0.0%) |
| 5 Years | 0 (0.0%) | 0 (0.0%) |
| 6 to 11 Years | 0 (0.0%) | 0 (0.0%) |
| 12 to 14 Years | 0 (0.0%) | 0 (0.0%) |
| 15 Years | 0 (0.0%) | 0 (0.0%) |
| 16 and 17 Years | 0 (0.0%) | 0 (0.0%) |
| 18 to 24 Years | 3 (4.2%) | 6 (37.5%) |
| 25 to 34 Years | 0 (0.0%) | 0 (0.0%) |
| 35 to 44 Years | 0 (0.0%) | 0 (0.0%) |
| 45 to 54 Years | 0 (0.0%) | 0 (0.0%) |
| 55 to 64 Years | 0 (0.0%) | 0 (0.0%) |
| 65 to 74 Years | 15 (19.0%) | 6 (13.6%) |
| 75 Years and over | 3 (18.8%) | 0 (0.0%) |
| Total | 21 (3.9%) | 12 (2.7%) |
Income Above Poverty by Sex and Age in Palouse
According to the poverty statistics in Palouse, males aged under 5 years and females aged under 5 years are the age groups that are most secure financially, with 100.0% of males and 100.0% of females in these age groups living above the poverty line.
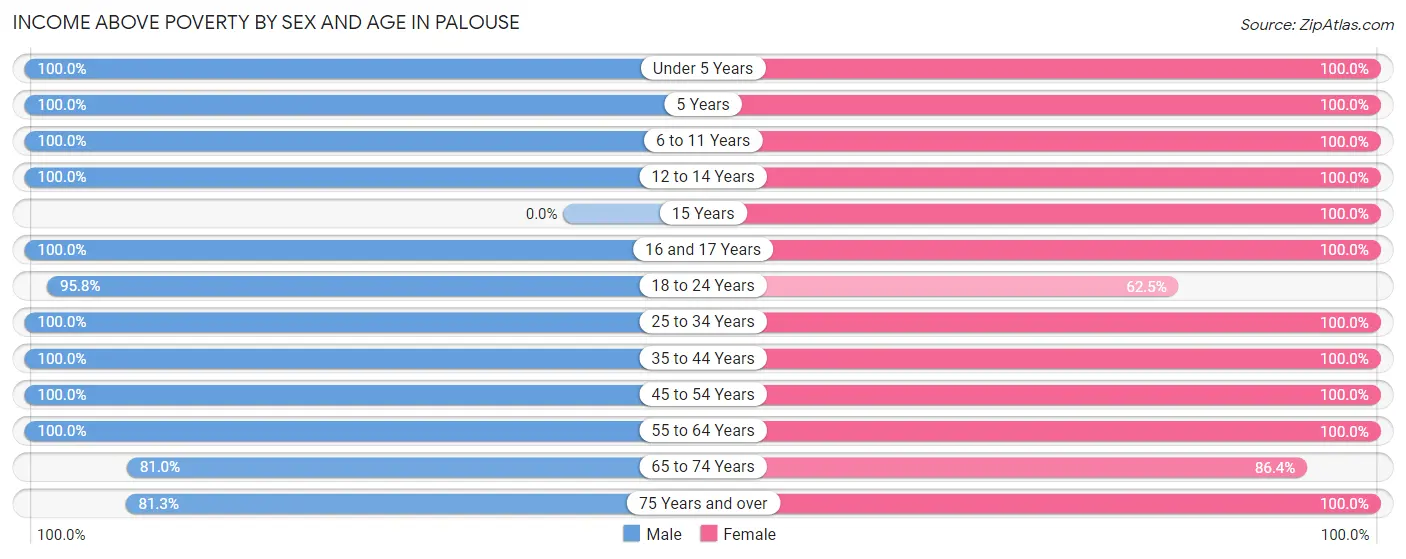
| Age Bracket | Male | Female |
| Under 5 Years | 22 (100.0%) | 6 (100.0%) |
| 5 Years | 3 (100.0%) | 52 (100.0%) |
| 6 to 11 Years | 62 (100.0%) | 36 (100.0%) |
| 12 to 14 Years | 23 (100.0%) | 9 (100.0%) |
| 15 Years | 0 (0.0%) | 5 (100.0%) |
| 16 and 17 Years | 9 (100.0%) | 8 (100.0%) |
| 18 to 24 Years | 69 (95.8%) | 10 (62.5%) |
| 25 to 34 Years | 17 (100.0%) | 20 (100.0%) |
| 35 to 44 Years | 52 (100.0%) | 80 (100.0%) |
| 45 to 54 Years | 89 (100.0%) | 90 (100.0%) |
| 55 to 64 Years | 100 (100.0%) | 59 (100.0%) |
| 65 to 74 Years | 64 (81.0%) | 38 (86.4%) |
| 75 Years and over | 13 (81.2%) | 19 (100.0%) |
| Total | 523 (96.1%) | 432 (97.3%) |
Income Below Poverty Among Married-Couple Families in Palouse
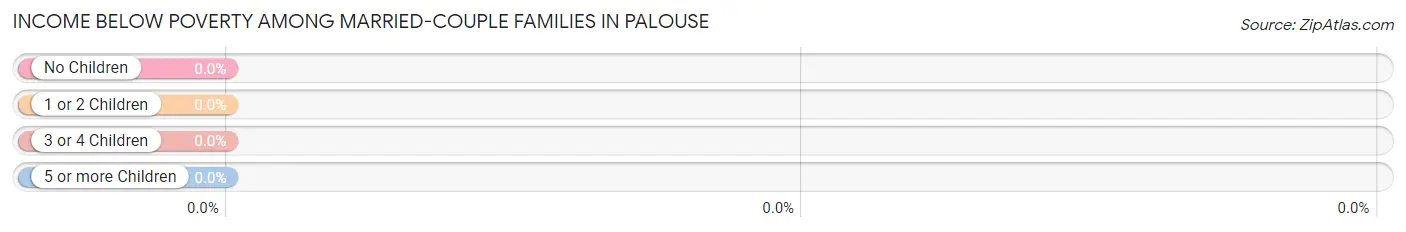
| Children | Above Poverty | Below Poverty |
| No Children | 117 (100.0%) | 0 (0.0%) |
| 1 or 2 Children | 82 (100.0%) | 0 (0.0%) |
| 3 or 4 Children | 20 (100.0%) | 0 (0.0%) |
| 5 or more Children | 0 (0.0%) | 0 (0.0%) |
| Total | 219 (100.0%) | 0 (0.0%) |
Income Below Poverty Among Single-Parent Households in Palouse
| Children | Single Father | Single Mother |
| No Children | 0 (0.0%) | 0 (0.0%) |
| 1 or 2 Children | 0 (0.0%) | 0 (0.0%) |
| 3 or 4 Children | 0 (0.0%) | 0 (0.0%) |
| 5 or more Children | 0 (0.0%) | 0 (0.0%) |
| Total | 0 (0.0%) | 0 (0.0%) |
Income Below Poverty Among Married-Couple vs Single-Parent Households in Palouse
| Children | Married-Couple Families | Single-Parent Households |
| No Children | 0 (0.0%) | 0 (0.0%) |
| 1 or 2 Children | 0 (0.0%) | 0 (0.0%) |
| 3 or 4 Children | 0 (0.0%) | 0 (0.0%) |
| 5 or more Children | 0 (0.0%) | 0 (0.0%) |
| Total | 0 (0.0%) | 0 (0.0%) |
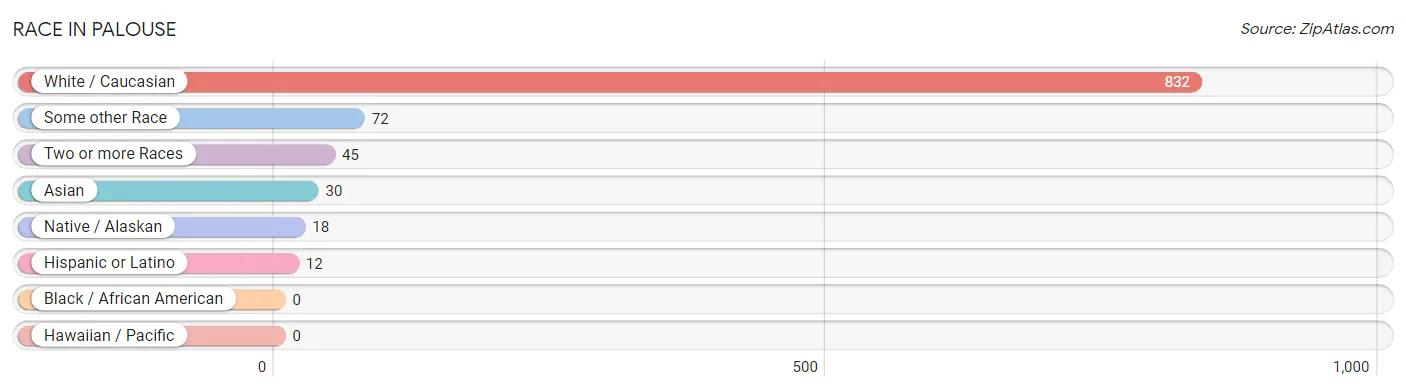
Race in Palouse
The most populous races in Palouse are White / Caucasian (832 | 83.5%), Some other Race (72 | 7.2%), and Two or more Races (45 | 4.5%).
| Race | # Population | % Population |
| Asian | 30 | 3.0% |
| Black / African American | 0 | 0.0% |
| Hawaiian / Pacific | 0 | 0.0% |
| Hispanic or Latino | 12 | 1.2% |
| Native / Alaskan | 18 | 1.8% |
| White / Caucasian | 832 | 83.5% |
| Two or more Races | 45 | 4.5% |
| Some other Race | 72 | 7.2% |
| Total | 997 | 100.0% |
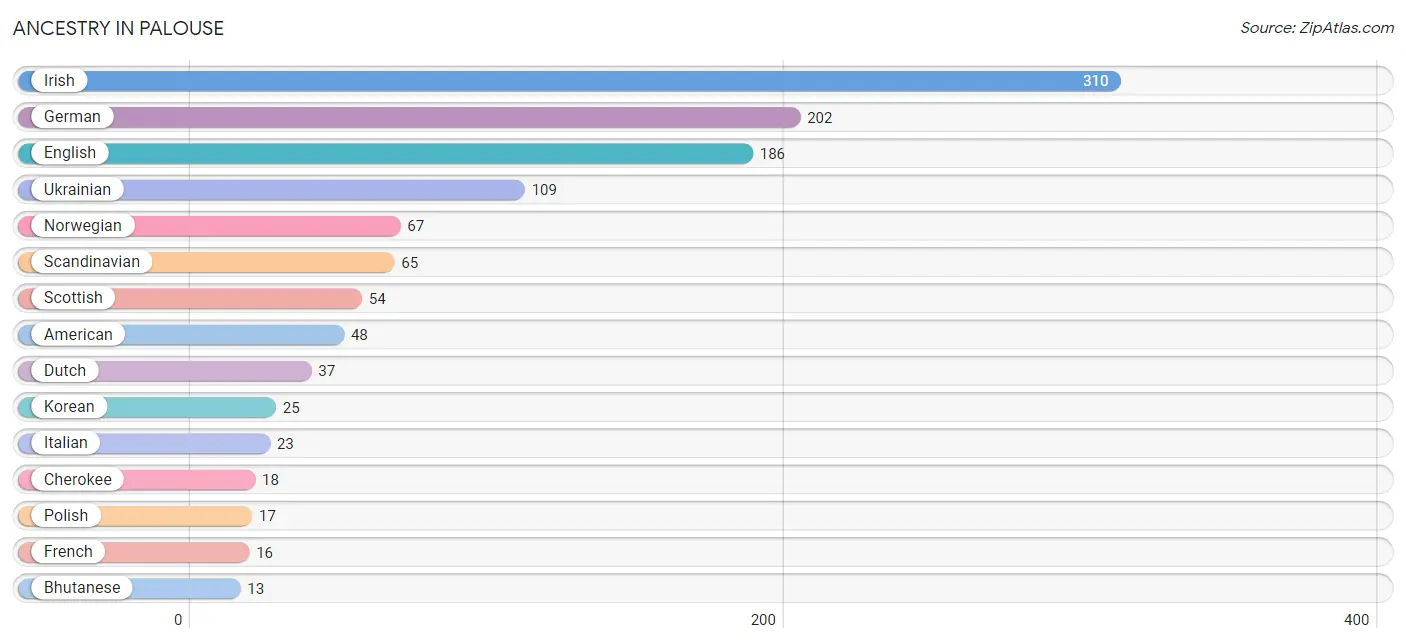
Ancestry in Palouse
The most populous ancestries reported in Palouse are Irish (310 | 31.1%), German (202 | 20.3%), English (186 | 18.7%), Ukrainian (109 | 10.9%), and Norwegian (67 | 6.7%), together accounting for 87.7% of all Palouse residents.
| Ancestry | # Population | % Population |
| American | 48 | 4.8% |
| Arab | 2 | 0.2% |
| Basque | 3 | 0.3% |
| Bhutanese | 13 | 1.3% |
| British | 11 | 1.1% |
| Central American | 4 | 0.4% |
| Cherokee | 18 | 1.8% |
| Danish | 6 | 0.6% |
| Delaware | 1 | 0.1% |
| Dutch | 37 | 3.7% |
| English | 186 | 18.7% |
| European | 11 | 1.1% |
| French | 16 | 1.6% |
| German | 202 | 20.3% |
| Honduran | 4 | 0.4% |
| Irish | 310 | 31.1% |
| Italian | 23 | 2.3% |
| Korean | 25 | 2.5% |
| Latvian | 6 | 0.6% |
| Mexican | 8 | 0.8% |
| Northern European | 7 | 0.7% |
| Norwegian | 67 | 6.7% |
| Polish | 17 | 1.7% |
| Russian | 5 | 0.5% |
| Scandinavian | 65 | 6.5% |
| Scotch-Irish | 11 | 1.1% |
| Scottish | 54 | 5.4% |
| Swedish | 10 | 1.0% |
| Swiss | 4 | 0.4% |
| Ukrainian | 109 | 10.9% |
| Welsh | 12 | 1.2% | View All 31 Rows |
Immigrants in Palouse
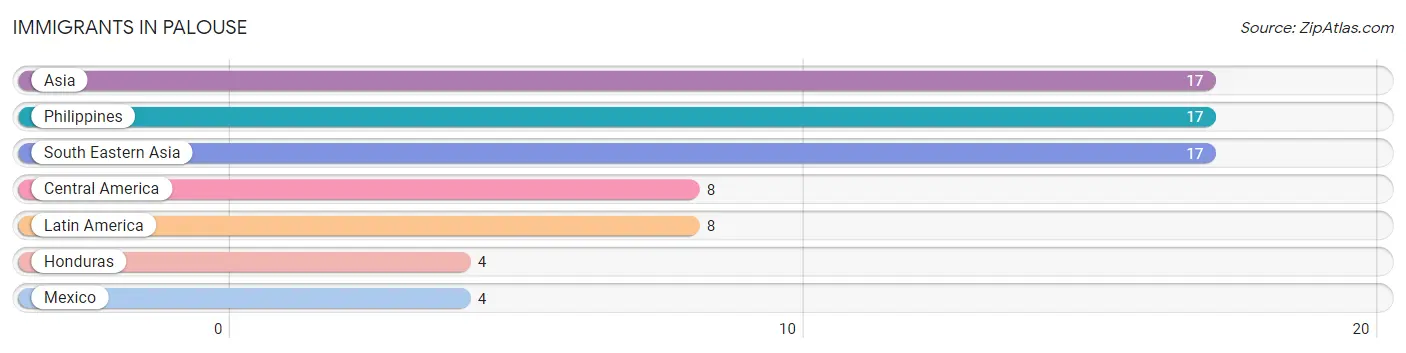
The most numerous immigrant groups reported in Palouse came from Asia (17 | 1.7%), Philippines (17 | 1.7%), South Eastern Asia (17 | 1.7%), Central America (8 | 0.8%), and Latin America (8 | 0.8%), together accounting for 6.7% of all Palouse residents.
| Immigration Origin | # Population | % Population |
| Asia | 17 | 1.7% |
| Central America | 8 | 0.8% |
| Honduras | 4 | 0.4% |
| Latin America | 8 | 0.8% |
| Mexico | 4 | 0.4% |
| Philippines | 17 | 1.7% |
| South Eastern Asia | 17 | 1.7% | View All 7 Rows |
Sex and Age in Palouse
Sex and Age in Palouse
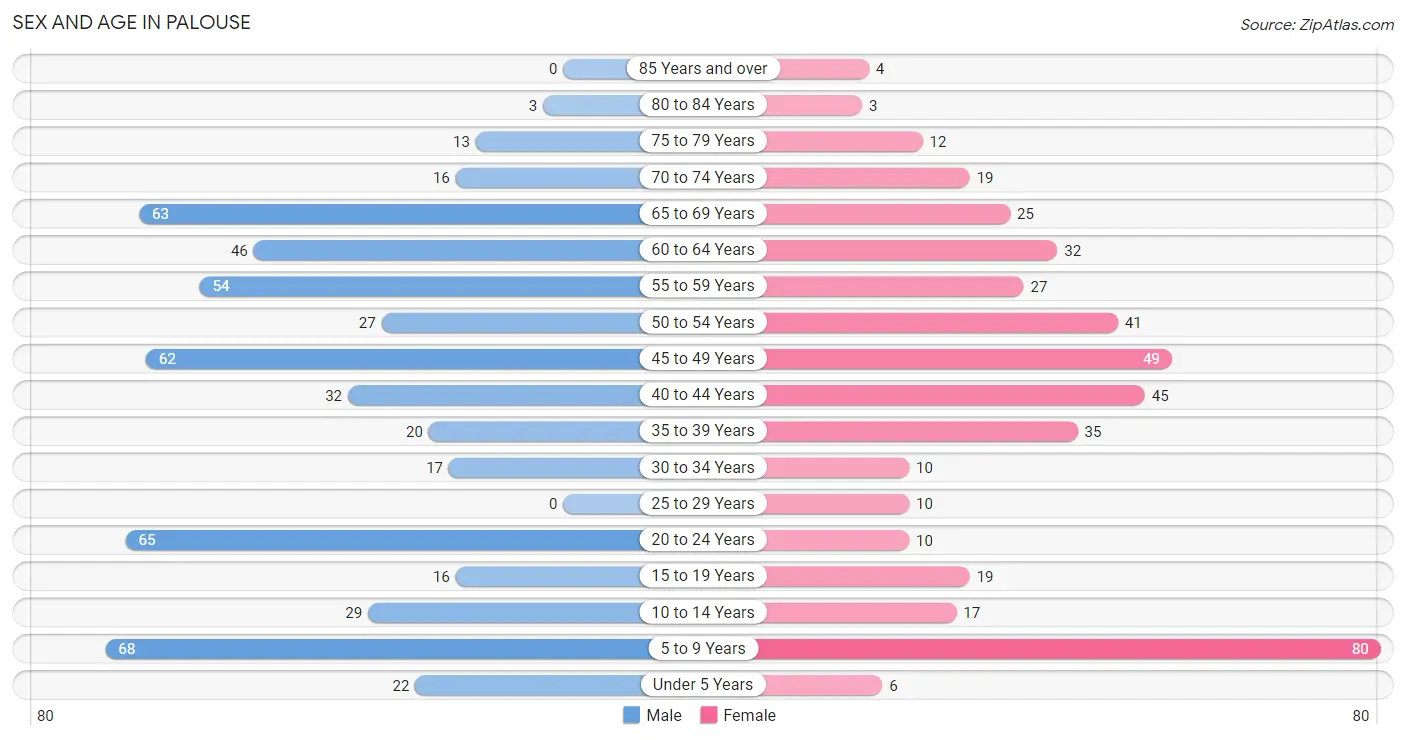
The most populous age groups in Palouse are 5 to 9 Years (68 | 12.3%) for men and 5 to 9 Years (80 | 18.0%) for women.
| Age Bracket | Male | Female |
| Under 5 Years | 22 (4.0%) | 6 (1.3%) |
| 5 to 9 Years | 68 (12.3%) | 80 (18.0%) |
| 10 to 14 Years | 29 (5.2%) | 17 (3.8%) |
| 15 to 19 Years | 16 (2.9%) | 19 (4.3%) |
| 20 to 24 Years | 65 (11.7%) | 10 (2.2%) |
| 25 to 29 Years | 0 (0.0%) | 10 (2.2%) |
| 30 to 34 Years | 17 (3.1%) | 10 (2.2%) |
| 35 to 39 Years | 20 (3.6%) | 35 (7.9%) |
| 40 to 44 Years | 32 (5.8%) | 45 (10.1%) |
| 45 to 49 Years | 62 (11.2%) | 49 (11.0%) |
| 50 to 54 Years | 27 (4.9%) | 41 (9.2%) |
| 55 to 59 Years | 54 (9.8%) | 27 (6.1%) |
| 60 to 64 Years | 46 (8.3%) | 32 (7.2%) |
| 65 to 69 Years | 63 (11.4%) | 25 (5.6%) |
| 70 to 74 Years | 16 (2.9%) | 19 (4.3%) |
| 75 to 79 Years | 13 (2.4%) | 12 (2.7%) |
| 80 to 84 Years | 3 (0.5%) | 3 (0.7%) |
| 85 Years and over | 0 (0.0%) | 4 (0.9%) |
| Total | 553 (100.0%) | 444 (100.0%) |
Families and Households in Palouse
Median Family Size in Palouse
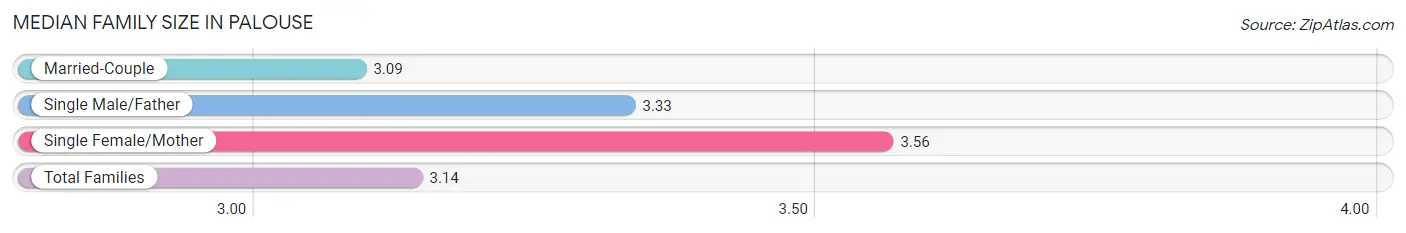
The median family size in Palouse is 3.14 persons per family, with single female/mother families (25 | 10.1%) accounting for the largest median family size of 3.56 persons per family. On the other hand, married-couple families (219 | 88.7%) represent the smallest median family size with 3.09 persons per family.
| Family Type | # Families | Family Size |
| Married-Couple | 219 (88.7%) | 3.09 |
| Single Male/Father | 3 (1.2%) | 3.33 |
| Single Female/Mother | 25 (10.1%) | 3.56 |
| Total Families | 247 (100.0%) | 3.14 |
Median Household Size in Palouse
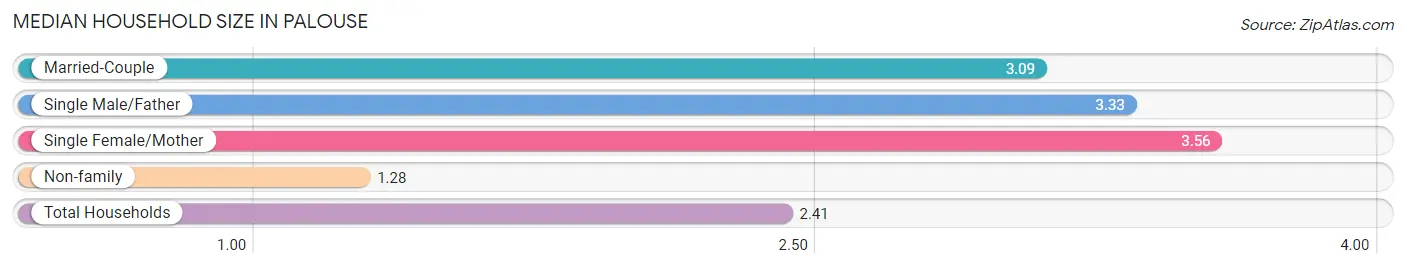
The median household size in Palouse is 2.41 persons per household, with single female/mother households (25 | 6.1%) accounting for the largest median household size of 3.56 persons per household. non-family households (160 | 39.3%) represent the smallest median household size with 1.28 persons per household.
| Household Type | # Households | Household Size |
| Married-Couple | 219 (53.8%) | 3.09 |
| Single Male/Father | 3 (0.7%) | 3.33 |
| Single Female/Mother | 25 (6.1%) | 3.56 |
| Non-family | 160 (39.3%) | 1.28 |
| Total Households | 407 (100.0%) | 2.41 |
Household Size by Marriage Status in Palouse
Out of a total of 407 households in Palouse, 247 (60.7%) are family households, while 160 (39.3%) are nonfamily households. The most numerous type of family households are 2-person households, comprising 133, and the most common type of nonfamily households are 1-person households, comprising 117.
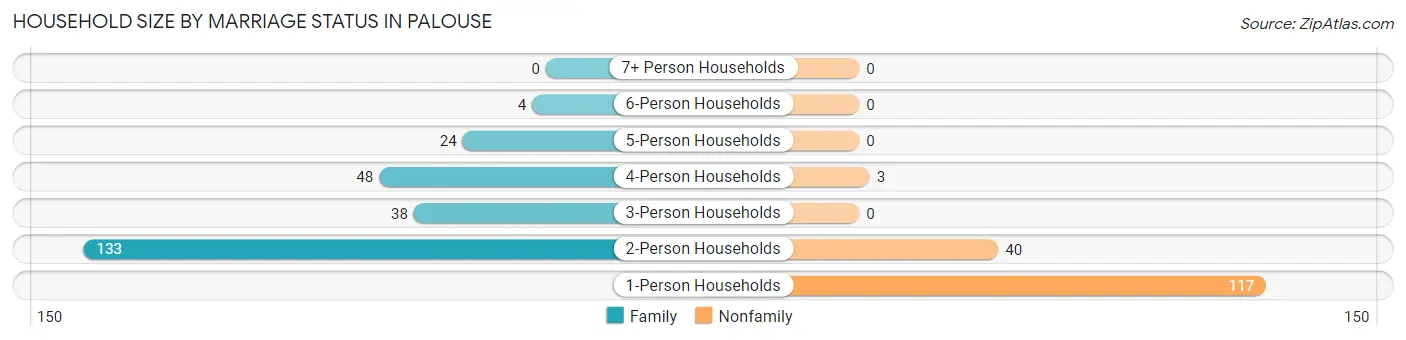
| Household Size | Family Households | Nonfamily Households |
| 1-Person Households | - | 117 (28.7%) |
| 2-Person Households | 133 (32.7%) | 40 (9.8%) |
| 3-Person Households | 38 (9.3%) | 0 (0.0%) |
| 4-Person Households | 48 (11.8%) | 3 (0.7%) |
| 5-Person Households | 24 (5.9%) | 0 (0.0%) |
| 6-Person Households | 4 (1.0%) | 0 (0.0%) |
| 7+ Person Households | 0 (0.0%) | 0 (0.0%) |
| Total | 247 (60.7%) | 160 (39.3%) |
Female Fertility in Palouse
Fertility by Age in Palouse
Average fertility rate in Palouse is 48.0 births per 1,000 women. Women in the age bracket of 35 to 50 years have the highest fertility rate with 66.0 births per 1,000 women. Women in the age bracket of 35 to 50 years acount for 100.0% of all women with births.
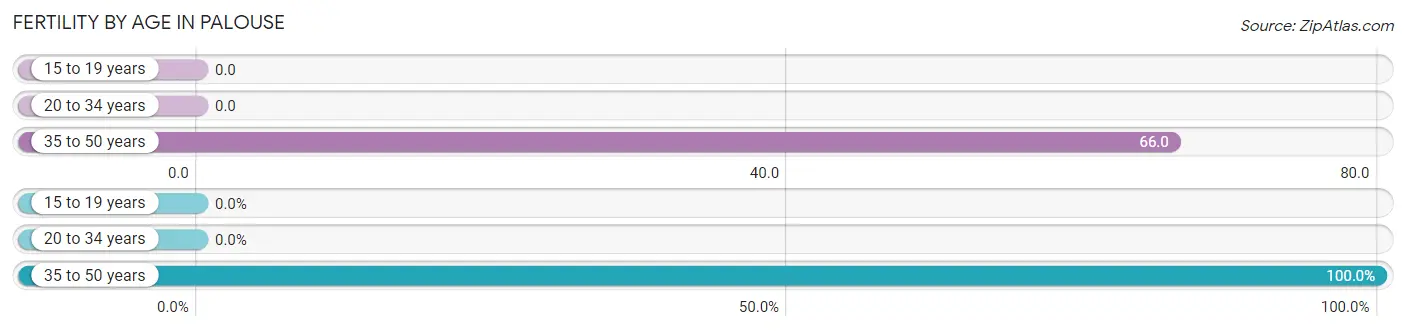
| Age Bracket | Women with Births | Births / 1,000 Women |
| 15 to 19 years | 0 (0.0%) | 0.0 |
| 20 to 34 years | 0 (0.0%) | 0.0 |
| 35 to 50 years | 9 (100.0%) | 66.0 |
| Total | 9 (100.0%) | 48.0 |
Fertility by Age by Marriage Status in Palouse
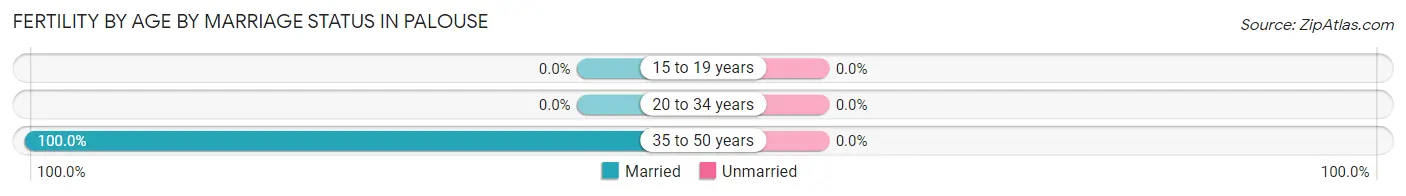
| Age Bracket | Married | Unmarried |
| 15 to 19 years | 0 (0.0%) | 0 (0.0%) |
| 20 to 34 years | 0 (0.0%) | 0 (0.0%) |
| 35 to 50 years | 9 (100.0%) | 0 (0.0%) |
| Total | 9 (100.0%) | 0 (0.0%) |
Fertility by Education in Palouse
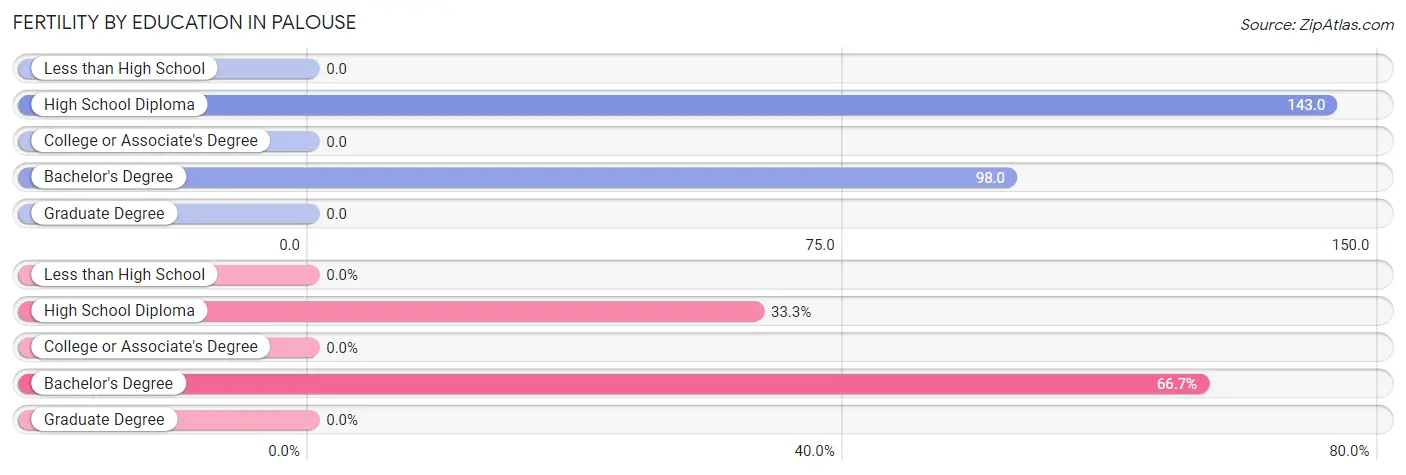
| Educational Attainment | Women with Births | Births / 1,000 Women |
| Less than High School | 0 (0.0%) | 0.0 |
| High School Diploma | 3 (33.3%) | 143.0 |
| College or Associate's Degree | 0 (0.0%) | 0.0 |
| Bachelor's Degree | 6 (66.7%) | 98.0 |
| Graduate Degree | 0 (0.0%) | 0.0 |
| Total | 9 (100.0%) | 48.0 |
Fertility by Education by Marriage Status in Palouse
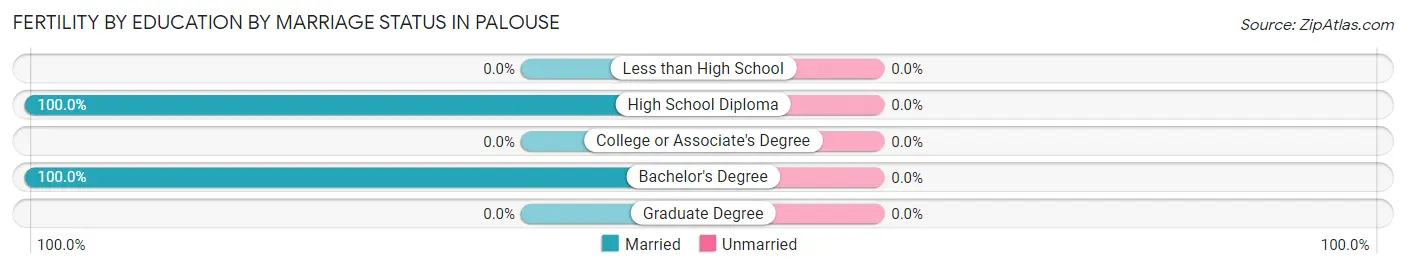
| Educational Attainment | Married | Unmarried |
| Less than High School | 0 (0.0%) | 0 (0.0%) |
| High School Diploma | 3 (100.0%) | 0 (0.0%) |
| College or Associate's Degree | 0 (0.0%) | 0 (0.0%) |
| Bachelor's Degree | 6 (100.0%) | 0 (0.0%) |
| Graduate Degree | 0 (0.0%) | 0 (0.0%) |
| Total | 9 (100.0%) | 0 (0.0%) |
Employment Characteristics in Palouse
Employment by Class of Employer in Palouse
Among the 491 employed individuals in Palouse, private company employees (152 | 31.0%), state government employees (152 | 31.0%), and not-for-profit organizations (81 | 16.5%) make up the most common classes of employment.
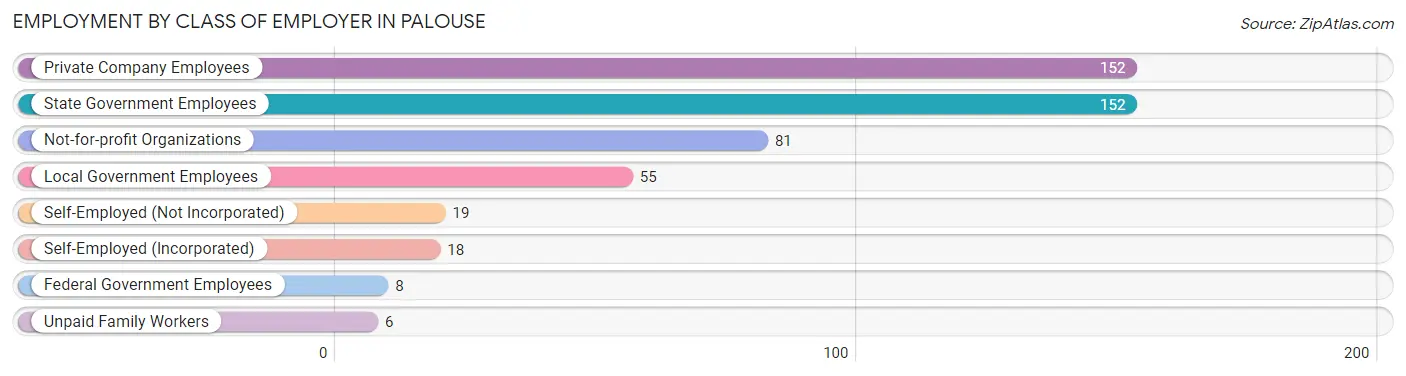
| Employer Class | # Employees | % Employees |
| Private Company Employees | 152 | 31.0% |
| Self-Employed (Incorporated) | 18 | 3.7% |
| Self-Employed (Not Incorporated) | 19 | 3.9% |
| Not-for-profit Organizations | 81 | 16.5% |
| Local Government Employees | 55 | 11.2% |
| State Government Employees | 152 | 31.0% |
| Federal Government Employees | 8 | 1.6% |
| Unpaid Family Workers | 6 | 1.2% |
| Total | 491 | 100.0% |
Employment Status by Age in Palouse
According to the labor force statistics for Palouse, out of the total population over 16 years of age (770), 67.0% or 516 individuals are in the labor force, with 1.4% or 7 of them unemployed. The age group with the highest labor force participation rate is 35 to 44 years, with 97.0% or 128 individuals in the labor force. Within the labor force, the 75 years and over age range has the highest percentage of unemployed individuals, with 75.0% or 3 of them being unemployed.
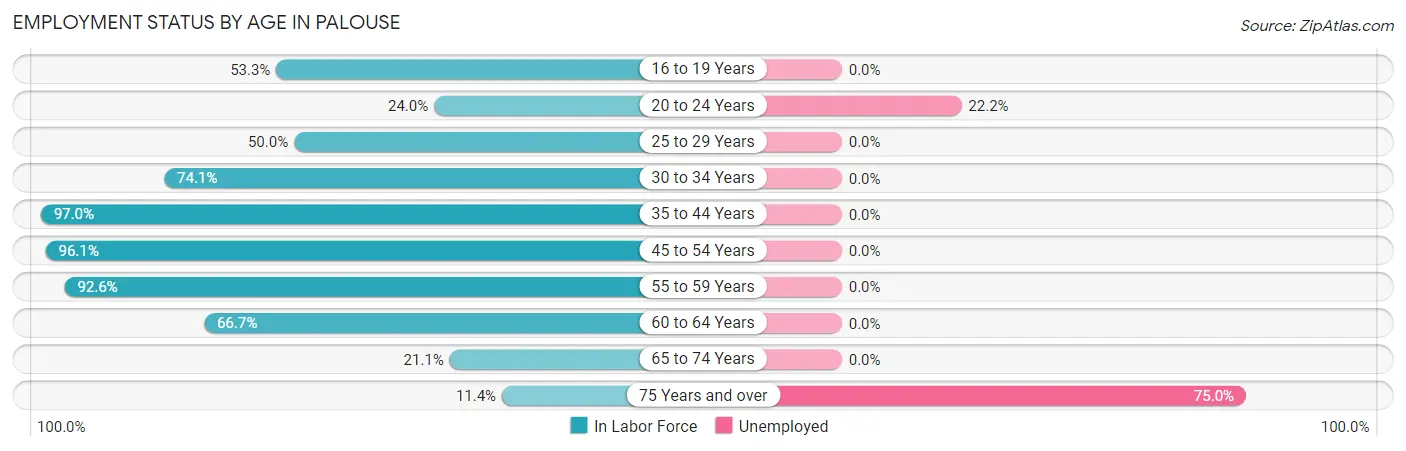
| Age Bracket | In Labor Force | Unemployed |
| 16 to 19 Years | 16 (53.3%) | 0 (0.0%) |
| 20 to 24 Years | 18 (24.0%) | 4 (22.2%) |
| 25 to 29 Years | 5 (50.0%) | 0 (0.0%) |
| 30 to 34 Years | 20 (74.1%) | 0 (0.0%) |
| 35 to 44 Years | 128 (97.0%) | 0 (0.0%) |
| 45 to 54 Years | 172 (96.1%) | 0 (0.0%) |
| 55 to 59 Years | 75 (92.6%) | 0 (0.0%) |
| 60 to 64 Years | 52 (66.7%) | 0 (0.0%) |
| 65 to 74 Years | 26 (21.1%) | 0 (0.0%) |
| 75 Years and over | 4 (11.4%) | 3 (75.0%) |
| Total | 516 (67.0%) | 7 (1.4%) |
Employment Status by Educational Attainment in Palouse
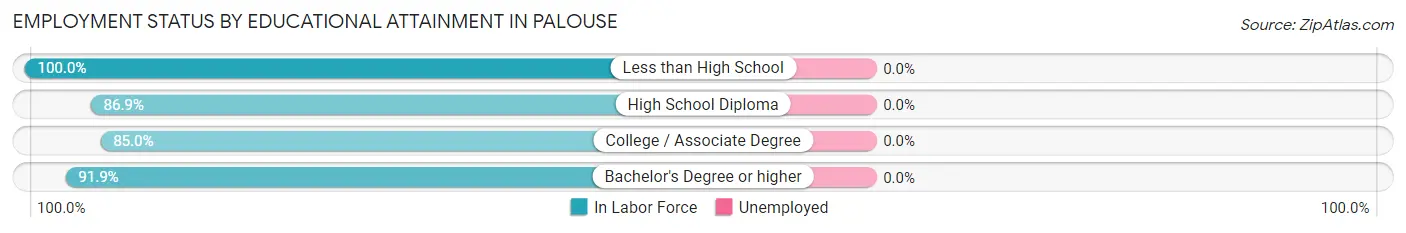
| Educational Attainment | In Labor Force | Unemployed |
| Less than High School | 3 (100.0%) | 0 (0.0%) |
| High School Diploma | 53 (86.9%) | 0 (0.0%) |
| College / Associate Degree | 136 (85.0%) | 0 (0.0%) |
| Bachelor's Degree or higher | 260 (91.9%) | 0 (0.0%) |
| Total | 452 (89.2%) | 0 (0.0%) |
Employment Occupations by Sex in Palouse
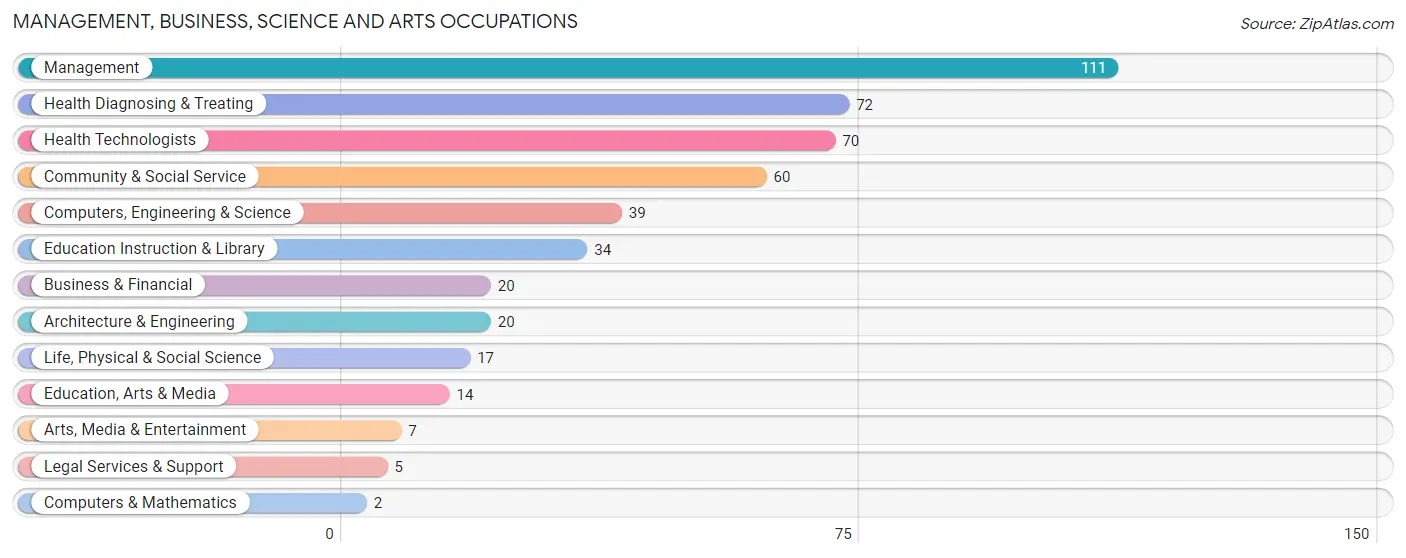
Management, Business, Science and Arts Occupations
The most common Management, Business, Science and Arts occupations in Palouse are Management (111 | 21.8%), Health Diagnosing & Treating (72 | 14.1%), Health Technologists (70 | 13.8%), Community & Social Service (60 | 11.8%), and Computers, Engineering & Science (39 | 7.7%).
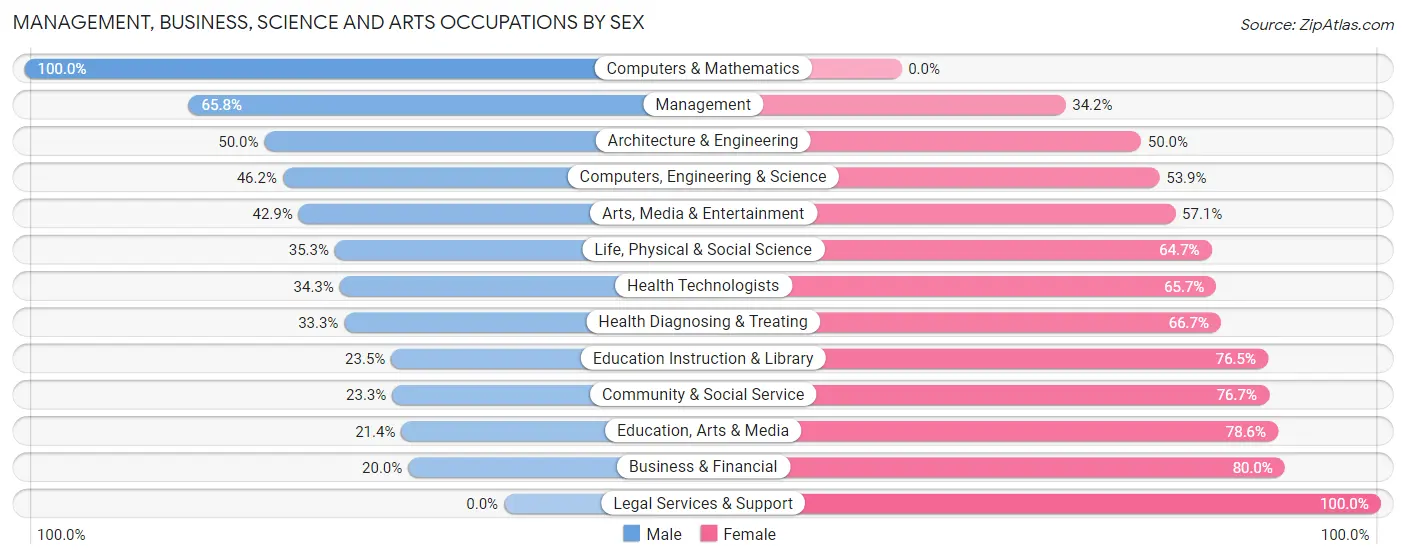
Management, Business, Science and Arts Occupations by Sex
Within the Management, Business, Science and Arts occupations in Palouse, the most male-oriented occupations are Computers & Mathematics (100.0%), Management (65.8%), and Architecture & Engineering (50.0%), while the most female-oriented occupations are Legal Services & Support (100.0%), Business & Financial (80.0%), and Education, Arts & Media (78.6%).
| Occupation | Male | Female |
| Management | 73 (65.8%) | 38 (34.2%) |
| Business & Financial | 4 (20.0%) | 16 (80.0%) |
| Computers, Engineering & Science | 18 (46.2%) | 21 (53.8%) |
| Computers & Mathematics | 2 (100.0%) | 0 (0.0%) |
| Architecture & Engineering | 10 (50.0%) | 10 (50.0%) |
| Life, Physical & Social Science | 6 (35.3%) | 11 (64.7%) |
| Community & Social Service | 14 (23.3%) | 46 (76.7%) |
| Education, Arts & Media | 3 (21.4%) | 11 (78.6%) |
| Legal Services & Support | 0 (0.0%) | 5 (100.0%) |
| Education Instruction & Library | 8 (23.5%) | 26 (76.5%) |
| Arts, Media & Entertainment | 3 (42.9%) | 4 (57.1%) |
| Health Diagnosing & Treating | 24 (33.3%) | 48 (66.7%) |
| Health Technologists | 24 (34.3%) | 46 (65.7%) |
| Total (Category) | 133 (44.0%) | 169 (56.0%) |
| Total (Overall) | 278 (54.6%) | 231 (45.4%) |
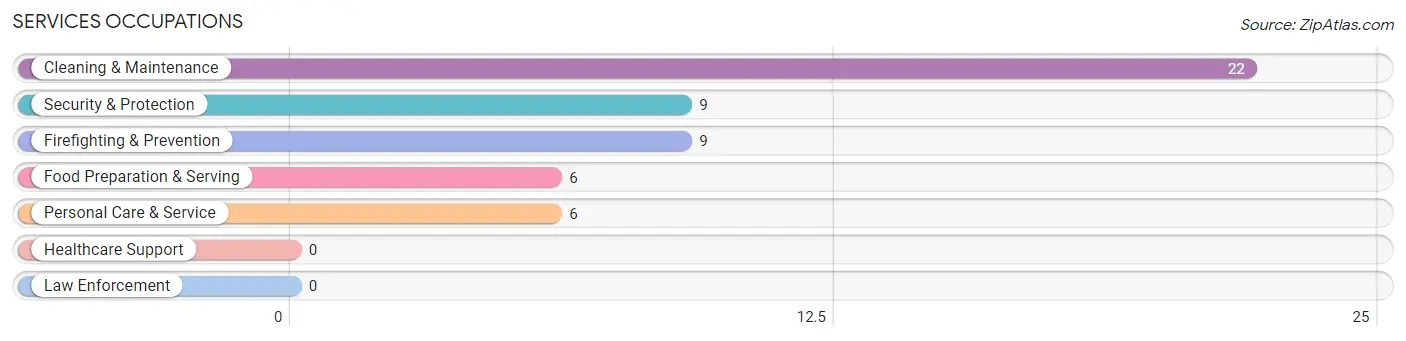
Services Occupations
The most common Services occupations in Palouse are Cleaning & Maintenance (22 | 4.3%), Security & Protection (9 | 1.8%), Firefighting & Prevention (9 | 1.8%), Food Preparation & Serving (6 | 1.2%), and Personal Care & Service (6 | 1.2%).
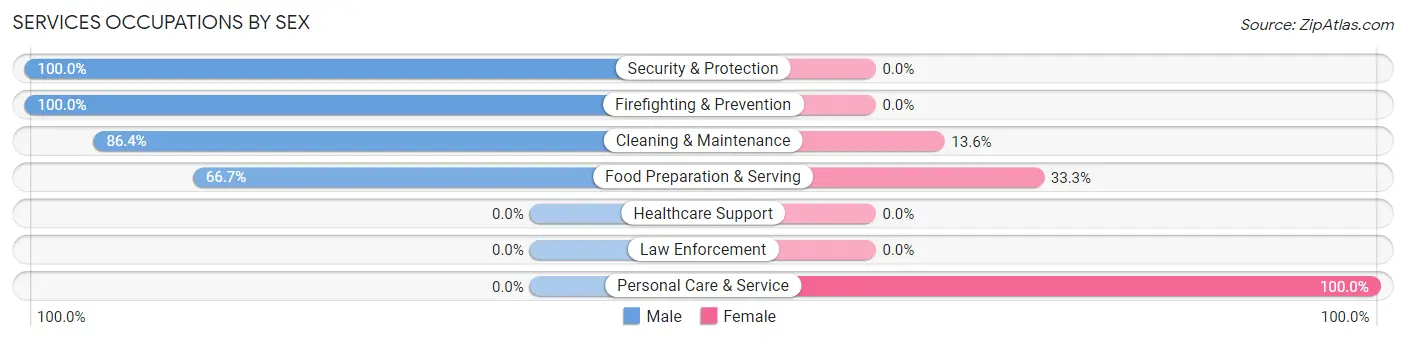
Services Occupations by Sex
Within the Services occupations in Palouse, the most male-oriented occupations are Security & Protection (100.0%), Firefighting & Prevention (100.0%), and Cleaning & Maintenance (86.4%), while the most female-oriented occupations are Personal Care & Service (100.0%), Food Preparation & Serving (33.3%), and Cleaning & Maintenance (13.6%).
| Occupation | Male | Female |
| Healthcare Support | 0 (0.0%) | 0 (0.0%) |
| Security & Protection | 9 (100.0%) | 0 (0.0%) |
| Firefighting & Prevention | 9 (100.0%) | 0 (0.0%) |
| Law Enforcement | 0 (0.0%) | 0 (0.0%) |
| Food Preparation & Serving | 4 (66.7%) | 2 (33.3%) |
| Cleaning & Maintenance | 19 (86.4%) | 3 (13.6%) |
| Personal Care & Service | 0 (0.0%) | 6 (100.0%) |
| Total (Category) | 32 (74.4%) | 11 (25.6%) |
| Total (Overall) | 278 (54.6%) | 231 (45.4%) |
Sales and Office Occupations
The most common Sales and Office occupations in Palouse are Office & Administration (33 | 6.5%), and Sales & Related (21 | 4.1%).
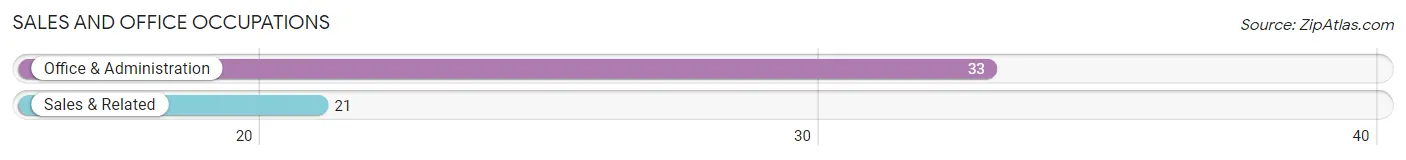
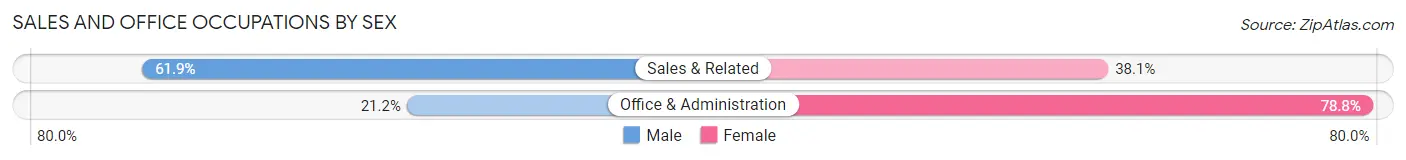
Sales and Office Occupations by Sex
| Occupation | Male | Female |
| Sales & Related | 13 (61.9%) | 8 (38.1%) |
| Office & Administration | 7 (21.2%) | 26 (78.8%) |
| Total (Category) | 20 (37.0%) | 34 (63.0%) |
| Total (Overall) | 278 (54.6%) | 231 (45.4%) |
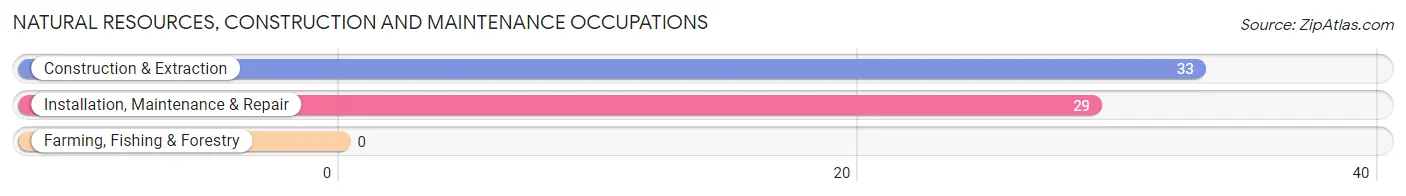
Natural Resources, Construction and Maintenance Occupations
The most common Natural Resources, Construction and Maintenance occupations in Palouse are Construction & Extraction (33 | 6.5%), and Installation, Maintenance & Repair (29 | 5.7%).
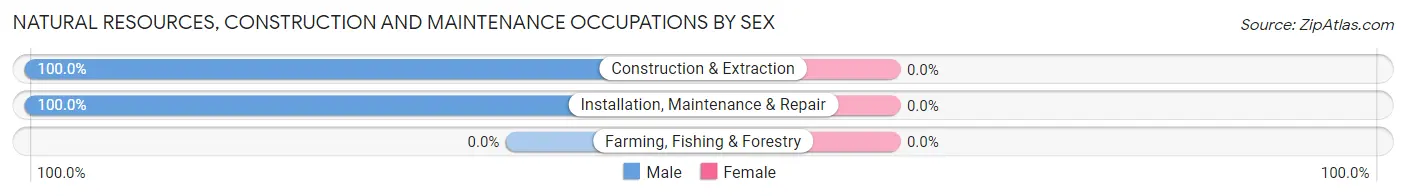
Natural Resources, Construction and Maintenance Occupations by Sex
| Occupation | Male | Female |
| Farming, Fishing & Forestry | 0 (0.0%) | 0 (0.0%) |
| Construction & Extraction | 33 (100.0%) | 0 (0.0%) |
| Installation, Maintenance & Repair | 29 (100.0%) | 0 (0.0%) |
| Total (Category) | 62 (100.0%) | 0 (0.0%) |
| Total (Overall) | 278 (54.6%) | 231 (45.4%) |
Production, Transportation and Moving Occupations
The most common Production, Transportation and Moving occupations in Palouse are Production (44 | 8.6%), and Transportation (4 | 0.8%).
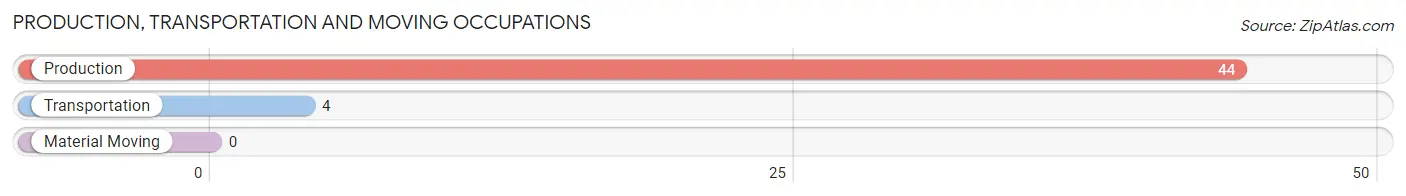
Production, Transportation and Moving Occupations by Sex
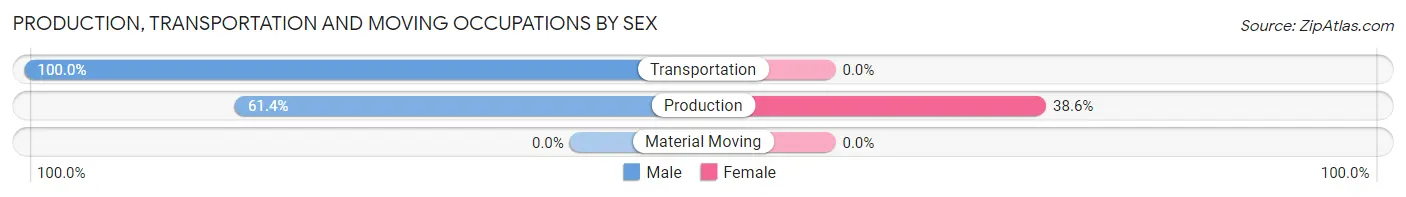
| Occupation | Male | Female |
| Production | 27 (61.4%) | 17 (38.6%) |
| Transportation | 4 (100.0%) | 0 (0.0%) |
| Material Moving | 0 (0.0%) | 0 (0.0%) |
| Total (Category) | 31 (64.6%) | 17 (35.4%) |
| Total (Overall) | 278 (54.6%) | 231 (45.4%) |
Employment Industries by Sex in Palouse
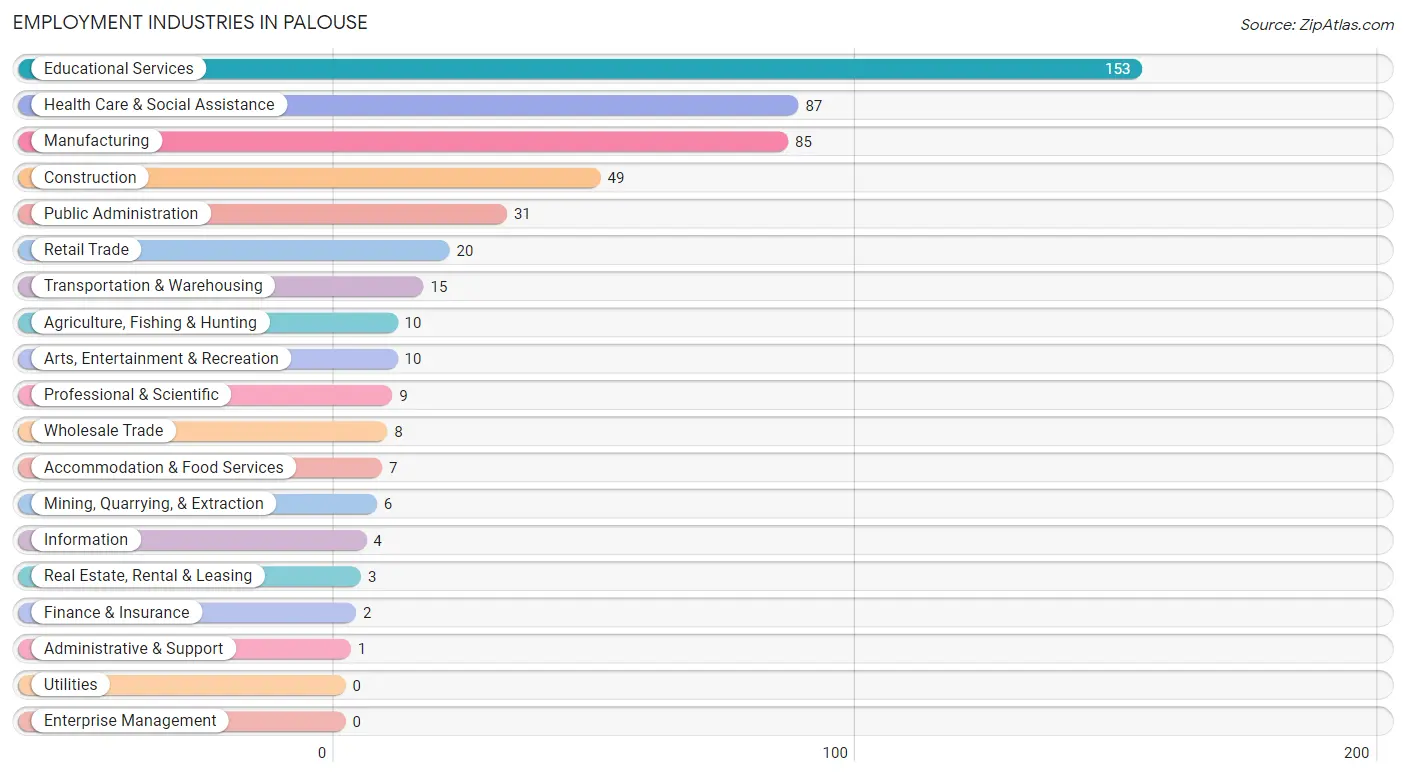
Employment Industries in Palouse
The major employment industries in Palouse include Educational Services (153 | 30.1%), Health Care & Social Assistance (87 | 17.1%), Manufacturing (85 | 16.7%), Construction (49 | 9.6%), and Public Administration (31 | 6.1%).
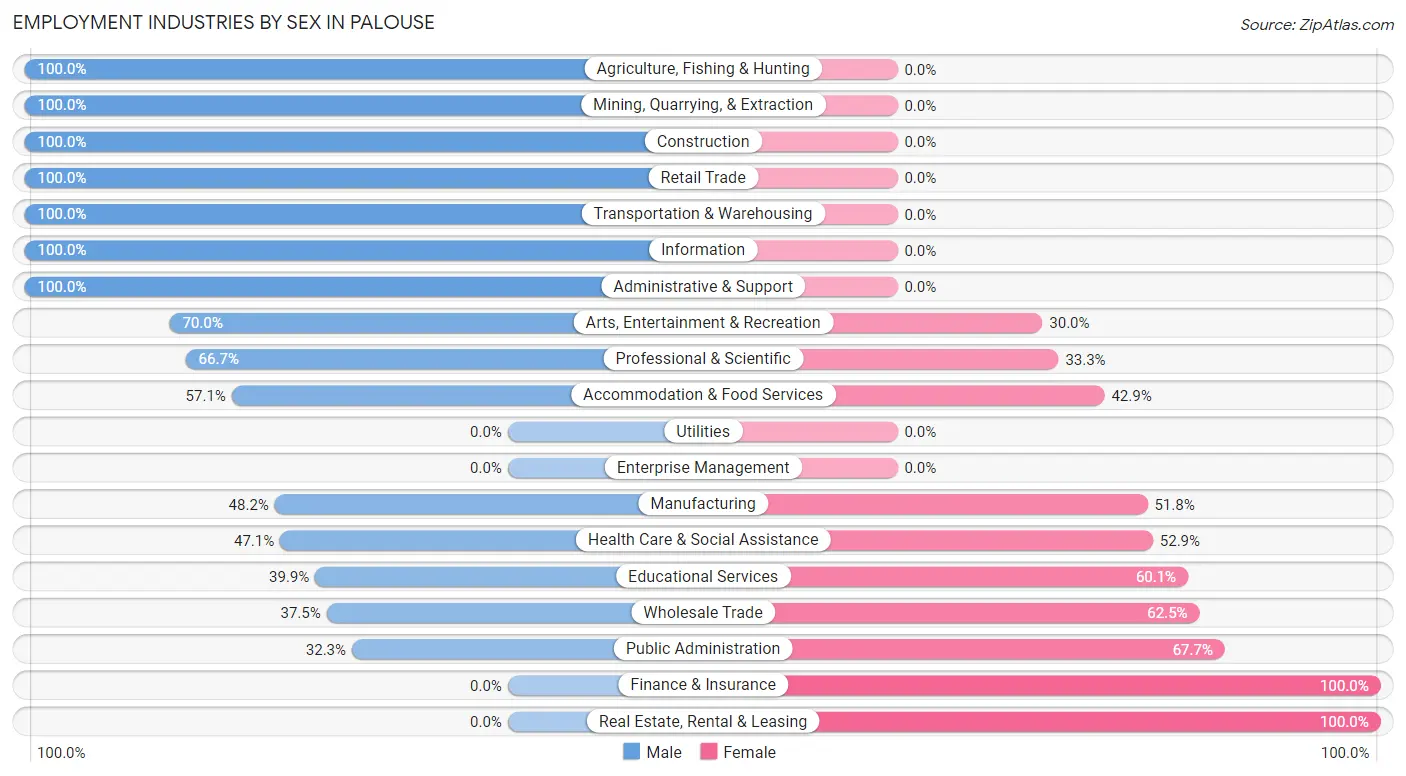
Employment Industries by Sex in Palouse
The Palouse industries that see more men than women are Agriculture, Fishing & Hunting (100.0%), Mining, Quarrying, & Extraction (100.0%), and Construction (100.0%), whereas the industries that tend to have a higher number of women are Finance & Insurance (100.0%), Real Estate, Rental & Leasing (100.0%), and Public Administration (67.7%).
| Industry | Male | Female |
| Agriculture, Fishing & Hunting | 10 (100.0%) | 0 (0.0%) |
| Mining, Quarrying, & Extraction | 6 (100.0%) | 0 (0.0%) |
| Construction | 49 (100.0%) | 0 (0.0%) |
| Manufacturing | 41 (48.2%) | 44 (51.8%) |
| Wholesale Trade | 3 (37.5%) | 5 (62.5%) |
| Retail Trade | 20 (100.0%) | 0 (0.0%) |
| Transportation & Warehousing | 15 (100.0%) | 0 (0.0%) |
| Utilities | 0 (0.0%) | 0 (0.0%) |
| Information | 4 (100.0%) | 0 (0.0%) |
| Finance & Insurance | 0 (0.0%) | 2 (100.0%) |
| Real Estate, Rental & Leasing | 0 (0.0%) | 3 (100.0%) |
| Professional & Scientific | 6 (66.7%) | 3 (33.3%) |
| Enterprise Management | 0 (0.0%) | 0 (0.0%) |
| Administrative & Support | 1 (100.0%) | 0 (0.0%) |
| Educational Services | 61 (39.9%) | 92 (60.1%) |
| Health Care & Social Assistance | 41 (47.1%) | 46 (52.9%) |
| Arts, Entertainment & Recreation | 7 (70.0%) | 3 (30.0%) |
| Accommodation & Food Services | 4 (57.1%) | 3 (42.9%) |
| Public Administration | 10 (32.3%) | 21 (67.7%) |
| Total | 278 (54.6%) | 231 (45.4%) |
Education in Palouse
School Enrollment in Palouse
The most common levels of schooling among the 314 students in Palouse are college / undergraduate (87 | 27.7%), elementary school (83 | 26.4%), and nursery / preschool (46 | 14.6%).
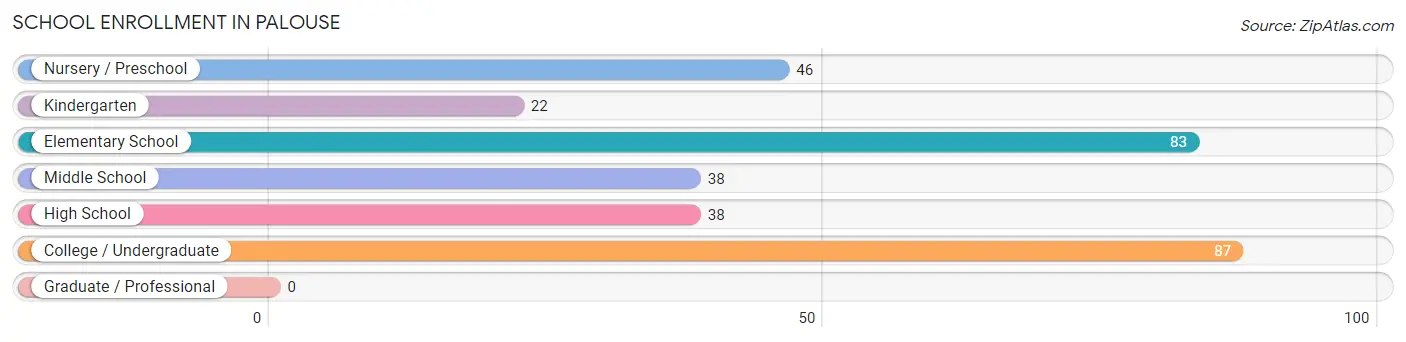
| School Level | # Students | % Students |
| Nursery / Preschool | 46 | 14.6% |
| Kindergarten | 22 | 7.0% |
| Elementary School | 83 | 26.4% |
| Middle School | 38 | 12.1% |
| High School | 38 | 12.1% |
| College / Undergraduate | 87 | 27.7% |
| Graduate / Professional | 0 | 0.0% |
| Total | 314 | 100.0% |
School Enrollment by Age by Funding Source in Palouse
Out of a total of 314 students who are enrolled in schools in Palouse, 17 (5.4%) attend a private institution, while the remaining 297 (94.6%) are enrolled in public schools. The age group of 35 years and over has the highest likelihood of being enrolled in private schools, with 12 (54.5% in the age bracket) enrolled. Conversely, the age group of 5 to 9 year old has the lowest likelihood of being enrolled in a private school, with 141 (100.0% in the age bracket) attending a public institution.
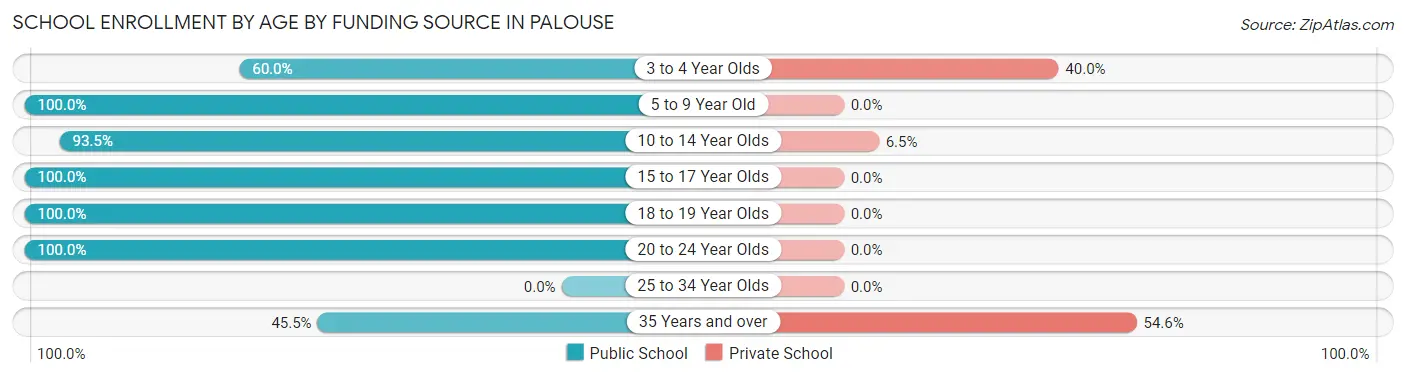
| Age Bracket | Public School | Private School |
| 3 to 4 Year Olds | 3 (60.0%) | 2 (40.0%) |
| 5 to 9 Year Old | 141 (100.0%) | 0 (0.0%) |
| 10 to 14 Year Olds | 43 (93.5%) | 3 (6.5%) |
| 15 to 17 Year Olds | 22 (100.0%) | 0 (0.0%) |
| 18 to 19 Year Olds | 13 (100.0%) | 0 (0.0%) |
| 20 to 24 Year Olds | 65 (100.0%) | 0 (0.0%) |
| 25 to 34 Year Olds | 0 (0.0%) | 0 (0.0%) |
| 35 Years and over | 10 (45.5%) | 12 (54.5%) |
| Total | 297 (94.6%) | 17 (5.4%) |
Educational Attainment by Field of Study in Palouse
Education (63 | 15.2%), bio, nature & agricultural (58 | 14.0%), science & technology (58 | 14.0%), business (42 | 10.1%), and social sciences (33 | 8.0%) are the most common fields of study among 415 individuals in Palouse who have obtained a bachelor's degree or higher.
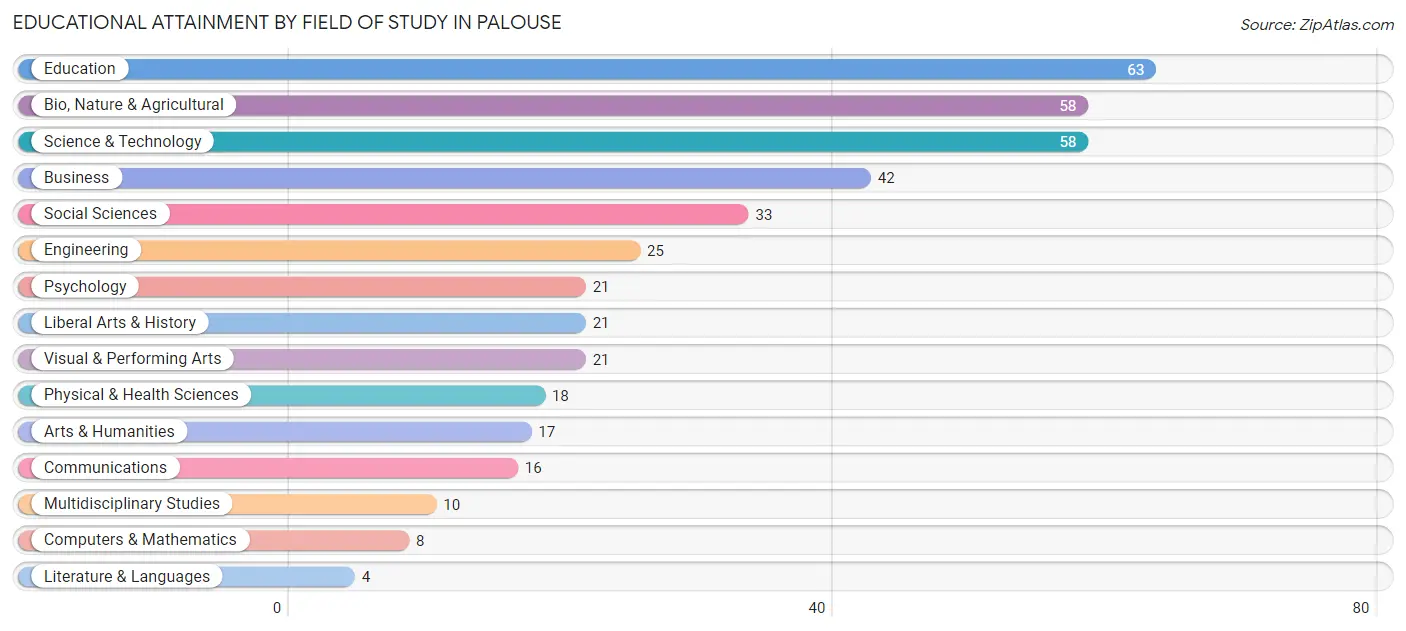
| Field of Study | # Graduates | % Graduates |
| Computers & Mathematics | 8 | 1.9% |
| Bio, Nature & Agricultural | 58 | 14.0% |
| Physical & Health Sciences | 18 | 4.3% |
| Psychology | 21 | 5.1% |
| Social Sciences | 33 | 8.0% |
| Engineering | 25 | 6.0% |
| Multidisciplinary Studies | 10 | 2.4% |
| Science & Technology | 58 | 14.0% |
| Business | 42 | 10.1% |
| Education | 63 | 15.2% |
| Literature & Languages | 4 | 1.0% |
| Liberal Arts & History | 21 | 5.1% |
| Visual & Performing Arts | 21 | 5.1% |
| Communications | 16 | 3.9% |
| Arts & Humanities | 17 | 4.1% |
| Total | 415 | 100.0% |
Transportation & Commute in Palouse
Vehicle Availability by Sex in Palouse
The most prevalent vehicle ownership categories in Palouse are males with 3 vehicles (90, accounting for 34.6%) and females with 3 vehicles (75, making up 41.3%).
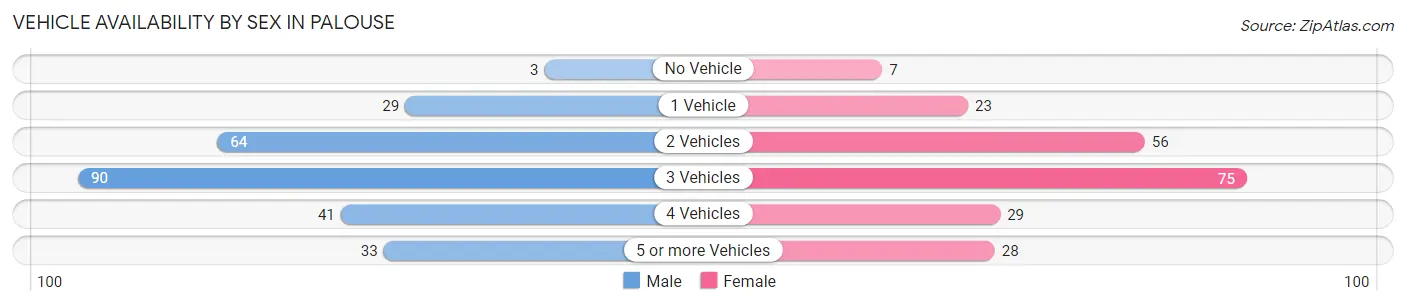
| Vehicles Available | Male | Female |
| No Vehicle | 3 (1.1%) | 7 (3.2%) |
| 1 Vehicle | 29 (11.2%) | 23 (10.5%) |
| 2 Vehicles | 64 (24.6%) | 56 (25.7%) |
| 3 Vehicles | 90 (34.6%) | 75 (34.4%) |
| 4 Vehicles | 41 (15.8%) | 29 (13.3%) |
| 5 or more Vehicles | 33 (12.7%) | 28 (12.8%) |
| Total | 260 (100.0%) | 218 (100.0%) |
Commute Time in Palouse
The most frequently occuring commute durations in Palouse are 20 to 24 minutes (142 commuters, 32.4%), 30 to 34 minutes (97 commuters, 22.2%), and 15 to 19 minutes (53 commuters, 12.1%).
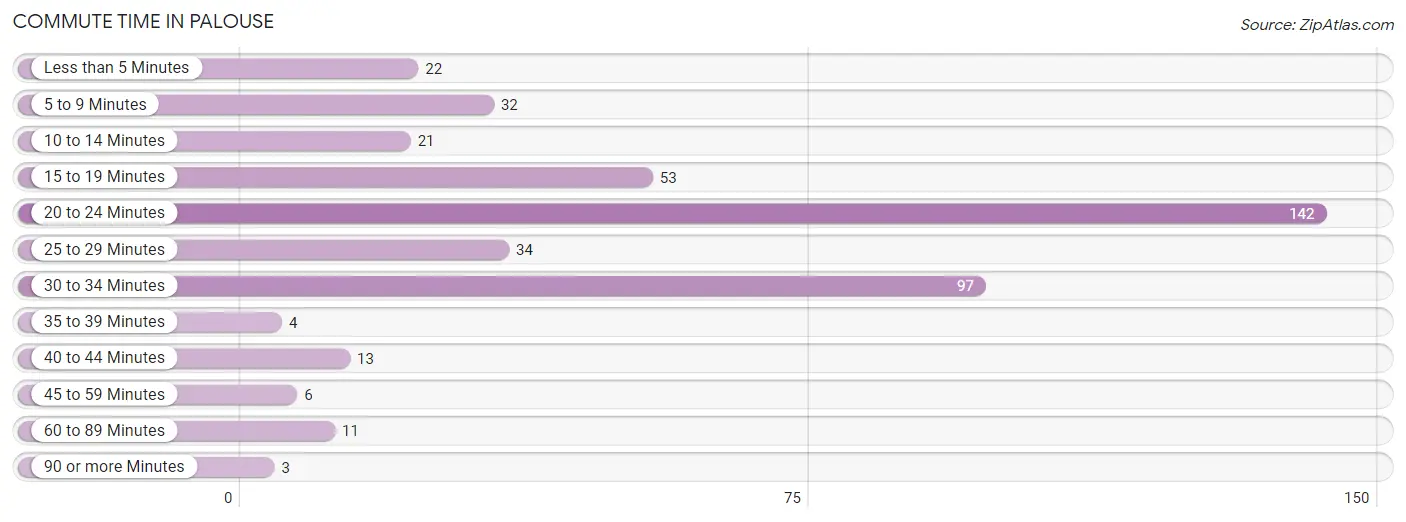
| Commute Time | # Commuters | % Commuters |
| Less than 5 Minutes | 22 | 5.0% |
| 5 to 9 Minutes | 32 | 7.3% |
| 10 to 14 Minutes | 21 | 4.8% |
| 15 to 19 Minutes | 53 | 12.1% |
| 20 to 24 Minutes | 142 | 32.4% |
| 25 to 29 Minutes | 34 | 7.8% |
| 30 to 34 Minutes | 97 | 22.2% |
| 35 to 39 Minutes | 4 | 0.9% |
| 40 to 44 Minutes | 13 | 3.0% |
| 45 to 59 Minutes | 6 | 1.4% |
| 60 to 89 Minutes | 11 | 2.5% |
| 90 or more Minutes | 3 | 0.7% |
Commute Time by Sex in Palouse
The most common commute times in Palouse are 20 to 24 minutes (73 commuters, 27.0%) for males and 20 to 24 minutes (69 commuters, 41.1%) for females.
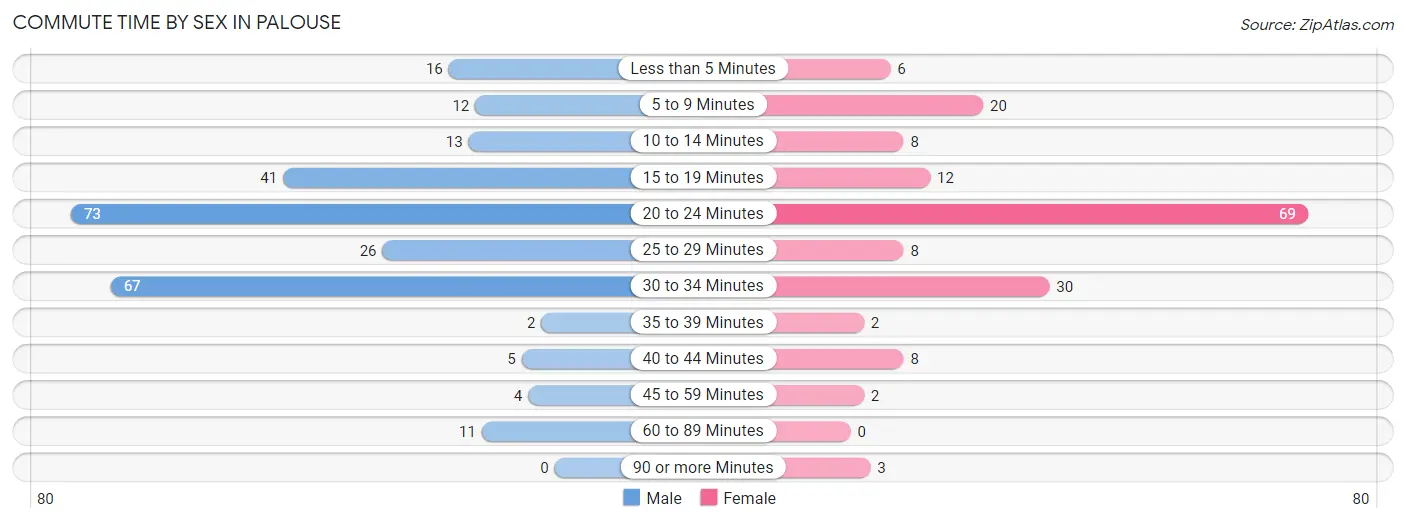
| Commute Time | Male | Female |
| Less than 5 Minutes | 16 (5.9%) | 6 (3.6%) |
| 5 to 9 Minutes | 12 (4.4%) | 20 (11.9%) |
| 10 to 14 Minutes | 13 (4.8%) | 8 (4.8%) |
| 15 to 19 Minutes | 41 (15.2%) | 12 (7.1%) |
| 20 to 24 Minutes | 73 (27.0%) | 69 (41.1%) |
| 25 to 29 Minutes | 26 (9.6%) | 8 (4.8%) |
| 30 to 34 Minutes | 67 (24.8%) | 30 (17.9%) |
| 35 to 39 Minutes | 2 (0.7%) | 2 (1.2%) |
| 40 to 44 Minutes | 5 (1.8%) | 8 (4.8%) |
| 45 to 59 Minutes | 4 (1.5%) | 2 (1.2%) |
| 60 to 89 Minutes | 11 (4.1%) | 0 (0.0%) |
| 90 or more Minutes | 0 (0.0%) | 3 (1.8%) |
Time of Departure to Work by Sex in Palouse
The most frequent times of departure to work in Palouse are 7:30 AM to 7:59 AM (53, 19.6%) for males and 8:00 AM to 8:29 AM (46, 27.4%) for females.
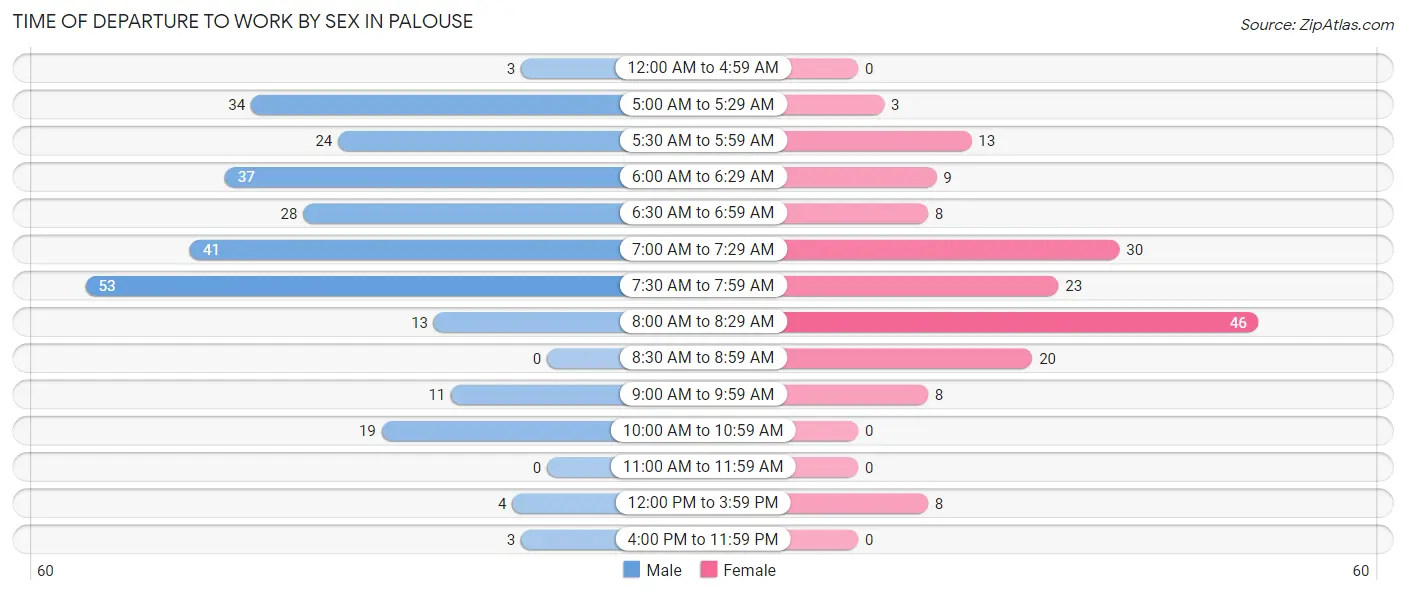
| Time of Departure | Male | Female |
| 12:00 AM to 4:59 AM | 3 (1.1%) | 0 (0.0%) |
| 5:00 AM to 5:29 AM | 34 (12.6%) | 3 (1.8%) |
| 5:30 AM to 5:59 AM | 24 (8.9%) | 13 (7.7%) |
| 6:00 AM to 6:29 AM | 37 (13.7%) | 9 (5.4%) |
| 6:30 AM to 6:59 AM | 28 (10.4%) | 8 (4.8%) |
| 7:00 AM to 7:29 AM | 41 (15.2%) | 30 (17.9%) |
| 7:30 AM to 7:59 AM | 53 (19.6%) | 23 (13.7%) |
| 8:00 AM to 8:29 AM | 13 (4.8%) | 46 (27.4%) |
| 8:30 AM to 8:59 AM | 0 (0.0%) | 20 (11.9%) |
| 9:00 AM to 9:59 AM | 11 (4.1%) | 8 (4.8%) |
| 10:00 AM to 10:59 AM | 19 (7.0%) | 0 (0.0%) |
| 11:00 AM to 11:59 AM | 0 (0.0%) | 0 (0.0%) |
| 12:00 PM to 3:59 PM | 4 (1.5%) | 8 (4.8%) |
| 4:00 PM to 11:59 PM | 3 (1.1%) | 0 (0.0%) |
| Total | 270 (100.0%) | 168 (100.0%) |
Housing Occupancy in Palouse
Occupancy by Ownership in Palouse
Of the total 407 dwellings in Palouse, owner-occupied units account for 358 (88.0%), while renter-occupied units make up 49 (12.0%).
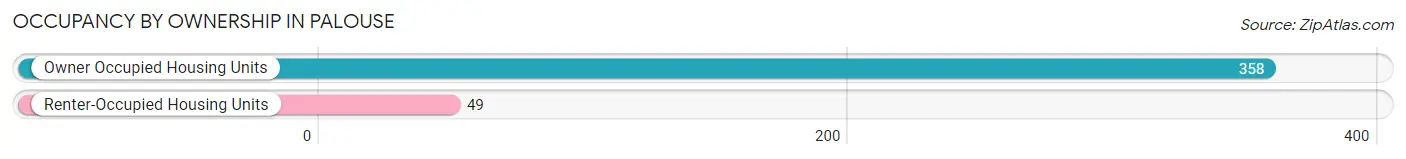
| Occupancy | # Housing Units | % Housing Units |
| Owner Occupied Housing Units | 358 | 88.0% |
| Renter-Occupied Housing Units | 49 | 12.0% |
| Total Occupied Housing Units | 407 | 100.0% |
Occupancy by Household Size in Palouse
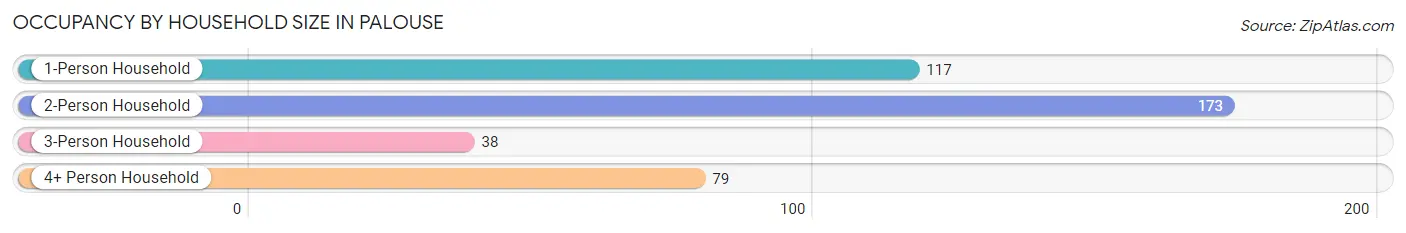
| Household Size | # Housing Units | % Housing Units |
| 1-Person Household | 117 | 28.7% |
| 2-Person Household | 173 | 42.5% |
| 3-Person Household | 38 | 9.3% |
| 4+ Person Household | 79 | 19.4% |
| Total Housing Units | 407 | 100.0% |
Occupancy by Ownership by Household Size in Palouse
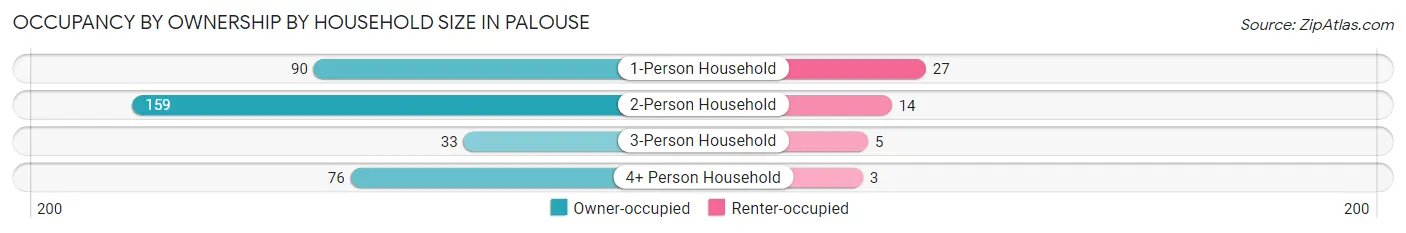
| Household Size | Owner-occupied | Renter-occupied |
| 1-Person Household | 90 (76.9%) | 27 (23.1%) |
| 2-Person Household | 159 (91.9%) | 14 (8.1%) |
| 3-Person Household | 33 (86.8%) | 5 (13.2%) |
| 4+ Person Household | 76 (96.2%) | 3 (3.8%) |
| Total Housing Units | 358 (88.0%) | 49 (12.0%) |
Occupancy by Educational Attainment in Palouse
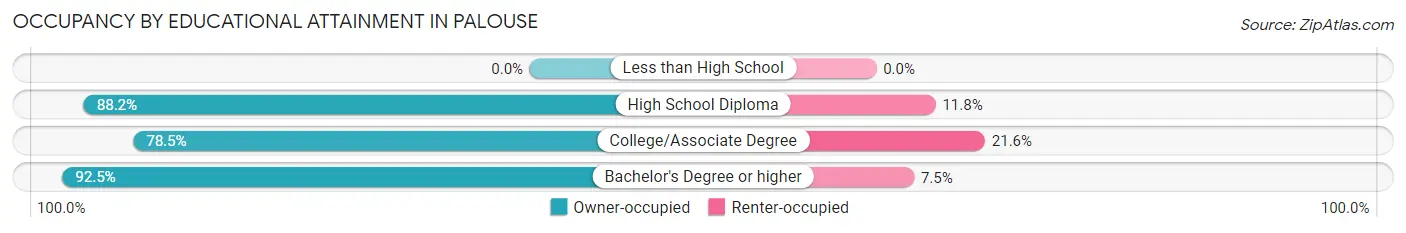
| Household Size | Owner-occupied | Renter-occupied |
| Less than High School | 0 (0.0%) | 0 (0.0%) |
| High School Diploma | 45 (88.2%) | 6 (11.8%) |
| College/Associate Degree | 91 (78.4%) | 25 (21.5%) |
| Bachelor's Degree or higher | 222 (92.5%) | 18 (7.5%) |
Occupancy by Age of Householder in Palouse
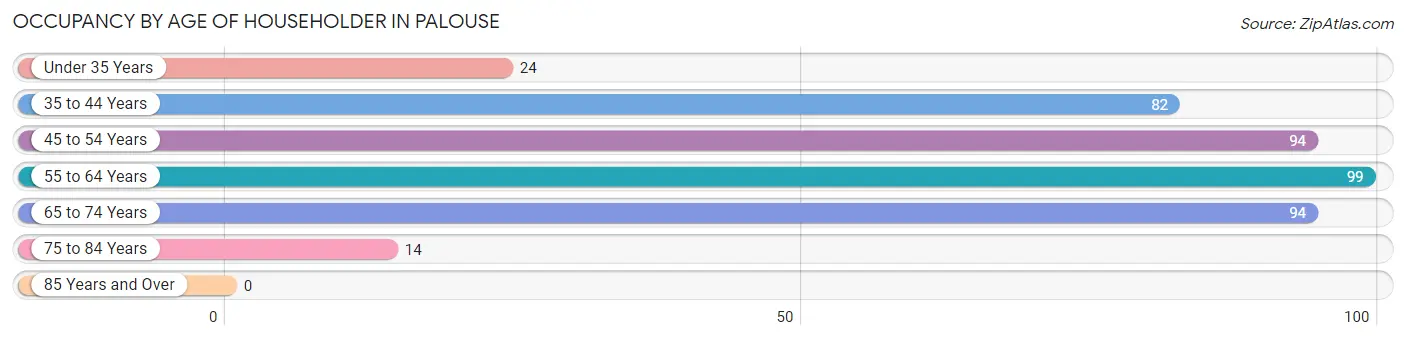
| Age Bracket | # Households | % Households |
| Under 35 Years | 24 | 5.9% |
| 35 to 44 Years | 82 | 20.2% |
| 45 to 54 Years | 94 | 23.1% |
| 55 to 64 Years | 99 | 24.3% |
| 65 to 74 Years | 94 | 23.1% |
| 75 to 84 Years | 14 | 3.4% |
| 85 Years and Over | 0 | 0.0% |
| Total | 407 | 100.0% |
Housing Finances in Palouse
Median Income by Occupancy in Palouse
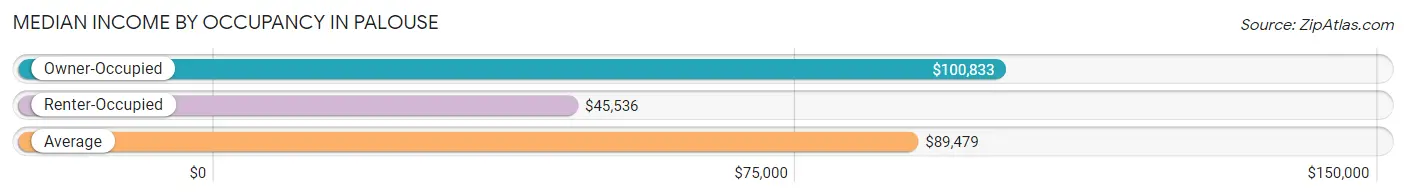
| Occupancy Type | # Households | Median Income |
| Owner-Occupied | 358 (88.0%) | $100,833 |
| Renter-Occupied | 49 (12.0%) | $45,536 |
| Average | 407 (100.0%) | $89,479 |
Occupancy by Householder Income Bracket in Palouse
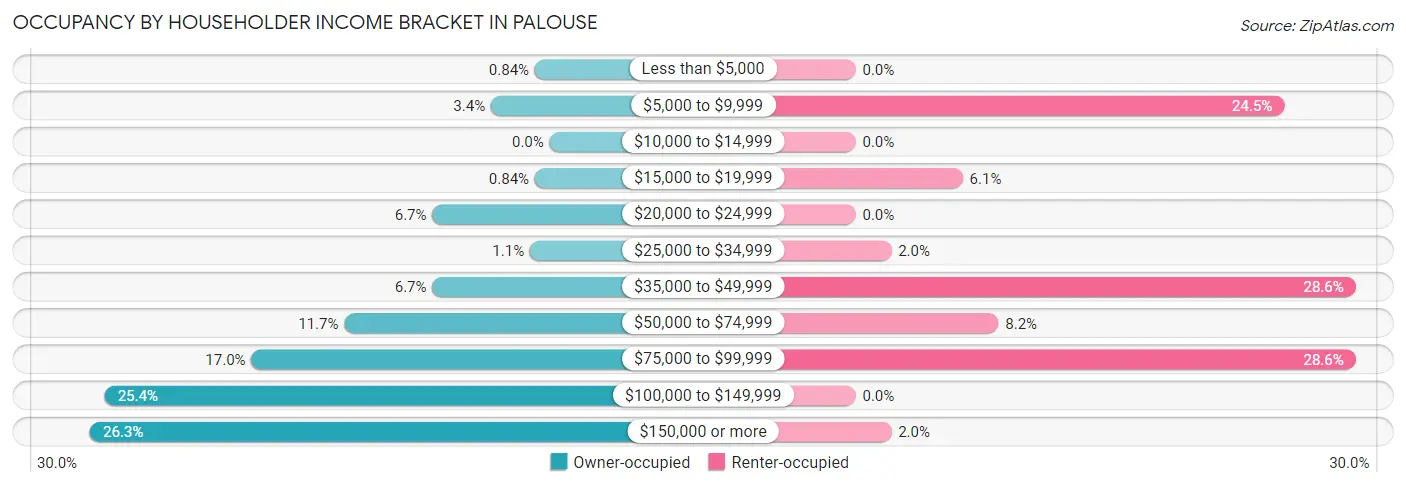
| Income Bracket | Owner-occupied | Renter-occupied |
| Less than $5,000 | 3 (0.8%) | 0 (0.0%) |
| $5,000 to $9,999 | 12 (3.4%) | 12 (24.5%) |
| $10,000 to $14,999 | 0 (0.0%) | 0 (0.0%) |
| $15,000 to $19,999 | 3 (0.8%) | 3 (6.1%) |
| $20,000 to $24,999 | 24 (6.7%) | 0 (0.0%) |
| $25,000 to $34,999 | 4 (1.1%) | 1 (2.0%) |
| $35,000 to $49,999 | 24 (6.7%) | 14 (28.6%) |
| $50,000 to $74,999 | 42 (11.7%) | 4 (8.2%) |
| $75,000 to $99,999 | 61 (17.0%) | 14 (28.6%) |
| $100,000 to $149,999 | 91 (25.4%) | 0 (0.0%) |
| $150,000 or more | 94 (26.3%) | 1 (2.0%) |
| Total | 358 (100.0%) | 49 (100.0%) |
Monthly Housing Cost Tiers in Palouse
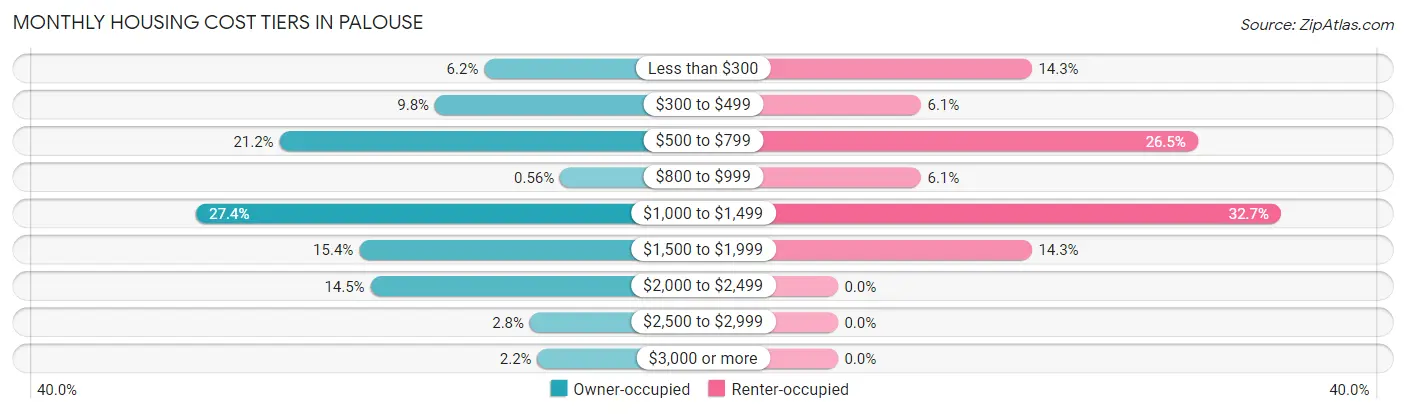
| Monthly Cost | Owner-occupied | Renter-occupied |
| Less than $300 | 22 (6.1%) | 7 (14.3%) |
| $300 to $499 | 35 (9.8%) | 3 (6.1%) |
| $500 to $799 | 76 (21.2%) | 13 (26.5%) |
| $800 to $999 | 2 (0.6%) | 3 (6.1%) |
| $1,000 to $1,499 | 98 (27.4%) | 16 (32.7%) |
| $1,500 to $1,999 | 55 (15.4%) | 7 (14.3%) |
| $2,000 to $2,499 | 52 (14.5%) | 0 (0.0%) |
| $2,500 to $2,999 | 10 (2.8%) | 0 (0.0%) |
| $3,000 or more | 8 (2.2%) | 0 (0.0%) |
| Total | 358 (100.0%) | 49 (100.0%) |
Physical Housing Characteristics in Palouse
Housing Structures in Palouse
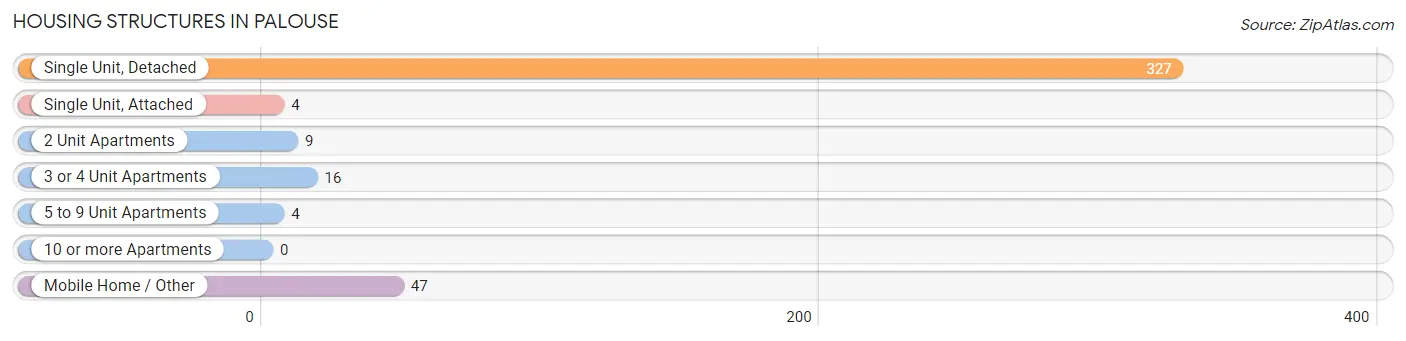
| Structure Type | # Housing Units | % Housing Units |
| Single Unit, Detached | 327 | 80.3% |
| Single Unit, Attached | 4 | 1.0% |
| 2 Unit Apartments | 9 | 2.2% |
| 3 or 4 Unit Apartments | 16 | 3.9% |
| 5 to 9 Unit Apartments | 4 | 1.0% |
| 10 or more Apartments | 0 | 0.0% |
| Mobile Home / Other | 47 | 11.6% |
| Total | 407 | 100.0% |
Housing Structures by Occupancy in Palouse
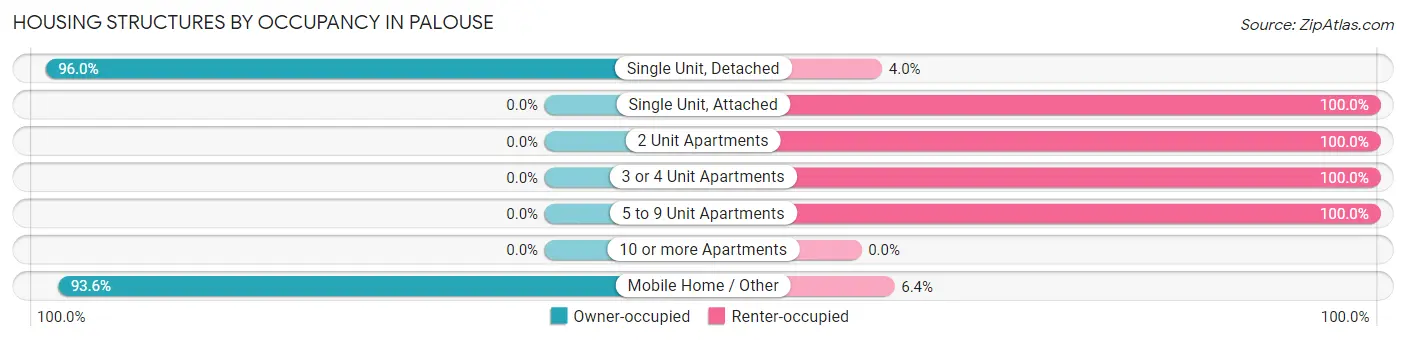
| Structure Type | Owner-occupied | Renter-occupied |
| Single Unit, Detached | 314 (96.0%) | 13 (4.0%) |
| Single Unit, Attached | 0 (0.0%) | 4 (100.0%) |
| 2 Unit Apartments | 0 (0.0%) | 9 (100.0%) |
| 3 or 4 Unit Apartments | 0 (0.0%) | 16 (100.0%) |
| 5 to 9 Unit Apartments | 0 (0.0%) | 4 (100.0%) |
| 10 or more Apartments | 0 (0.0%) | 0 (0.0%) |
| Mobile Home / Other | 44 (93.6%) | 3 (6.4%) |
| Total | 358 (88.0%) | 49 (12.0%) |
Housing Structures by Number of Rooms in Palouse
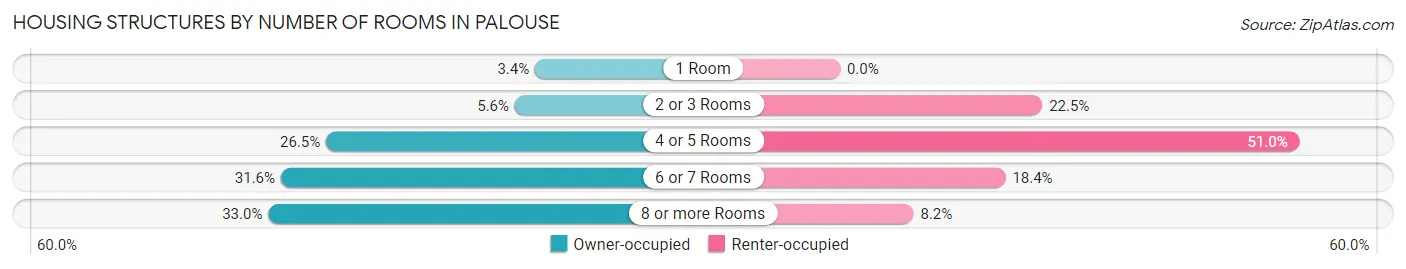
| Number of Rooms | Owner-occupied | Renter-occupied |
| 1 Room | 12 (3.4%) | 0 (0.0%) |
| 2 or 3 Rooms | 20 (5.6%) | 11 (22.5%) |
| 4 or 5 Rooms | 95 (26.5%) | 25 (51.0%) |
| 6 or 7 Rooms | 113 (31.6%) | 9 (18.4%) |
| 8 or more Rooms | 118 (33.0%) | 4 (8.2%) |
| Total | 358 (100.0%) | 49 (100.0%) |
Housing Structure by Heating Type in Palouse
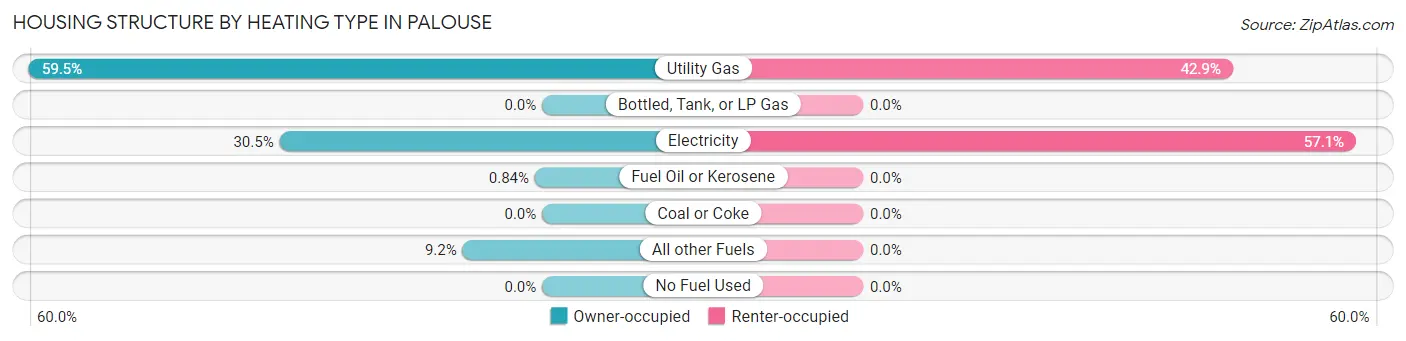
| Heating Type | Owner-occupied | Renter-occupied |
| Utility Gas | 213 (59.5%) | 21 (42.9%) |
| Bottled, Tank, or LP Gas | 0 (0.0%) | 0 (0.0%) |
| Electricity | 109 (30.4%) | 28 (57.1%) |
| Fuel Oil or Kerosene | 3 (0.8%) | 0 (0.0%) |
| Coal or Coke | 0 (0.0%) | 0 (0.0%) |
| All other Fuels | 33 (9.2%) | 0 (0.0%) |
| No Fuel Used | 0 (0.0%) | 0 (0.0%) |
| Total | 358 (100.0%) | 49 (100.0%) |
Household Vehicle Usage in Palouse
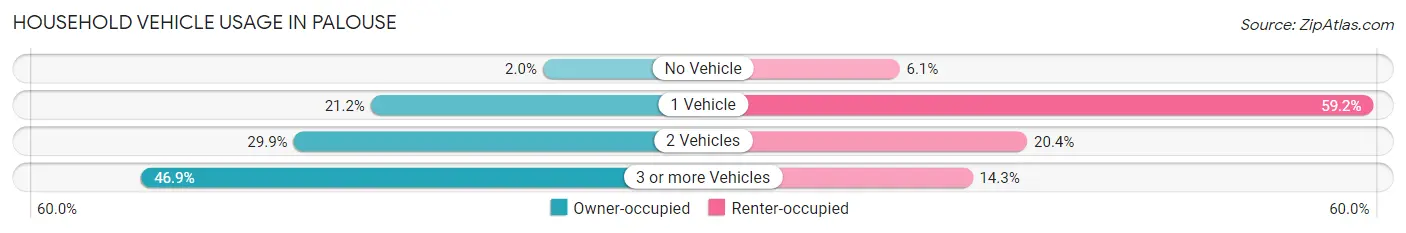
| Vehicles per Household | Owner-occupied | Renter-occupied |
| No Vehicle | 7 (2.0%) | 3 (6.1%) |
| 1 Vehicle | 76 (21.2%) | 29 (59.2%) |
| 2 Vehicles | 107 (29.9%) | 10 (20.4%) |
| 3 or more Vehicles | 168 (46.9%) | 7 (14.3%) |
| Total | 358 (100.0%) | 49 (100.0%) |
Real Estate & Mortgages in Palouse
Real Estate and Mortgage Overview in Palouse
| Characteristic | Without Mortgage | With Mortgage |
| Housing Units | 103 | 255 |
| Median Property Value | $185,900 | $245,600 |
| Median Household Income | $42,083 | $79 |
| Monthly Housing Costs | $481 | $8 |
| Real Estate Taxes | $1,583 | $0 |
Property Value by Mortgage Status in Palouse
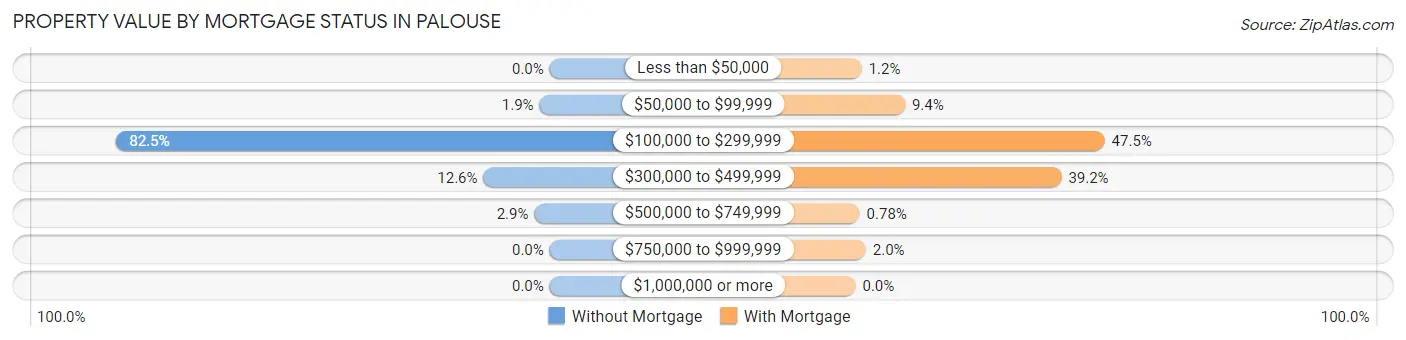
| Property Value | Without Mortgage | With Mortgage |
| Less than $50,000 | 0 (0.0%) | 3 (1.2%) |
| $50,000 to $99,999 | 2 (1.9%) | 24 (9.4%) |
| $100,000 to $299,999 | 85 (82.5%) | 121 (47.4%) |
| $300,000 to $499,999 | 13 (12.6%) | 100 (39.2%) |
| $500,000 to $749,999 | 3 (2.9%) | 2 (0.8%) |
| $750,000 to $999,999 | 0 (0.0%) | 5 (2.0%) |
| $1,000,000 or more | 0 (0.0%) | 0 (0.0%) |
| Total | 103 (100.0%) | 255 (100.0%) |
Household Income by Mortgage Status in Palouse
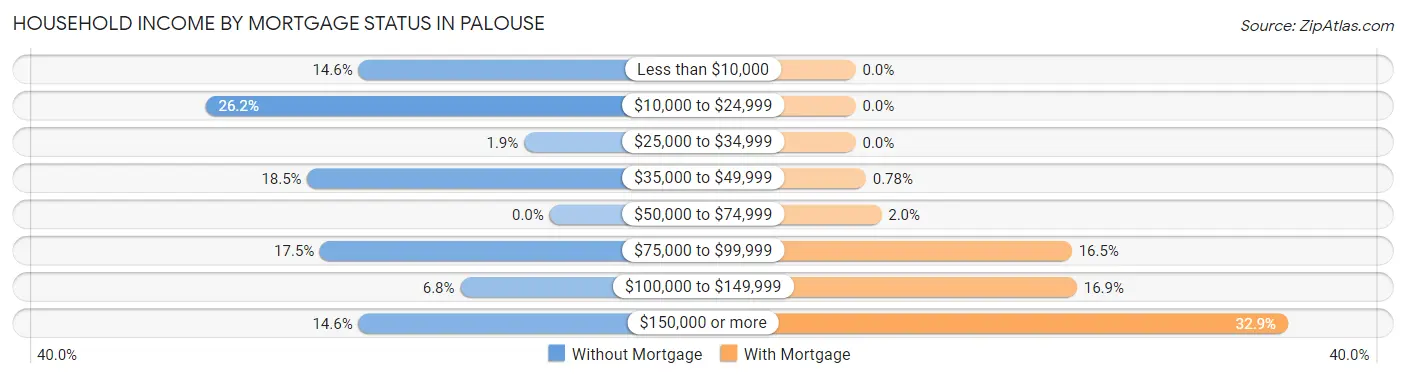
| Household Income | Without Mortgage | With Mortgage |
| Less than $10,000 | 15 (14.6%) | 0 (0.0%) |
| $10,000 to $24,999 | 27 (26.2%) | 0 (0.0%) |
| $25,000 to $34,999 | 2 (1.9%) | 0 (0.0%) |
| $35,000 to $49,999 | 19 (18.4%) | 2 (0.8%) |
| $50,000 to $74,999 | 0 (0.0%) | 5 (2.0%) |
| $75,000 to $99,999 | 18 (17.5%) | 42 (16.5%) |
| $100,000 to $149,999 | 7 (6.8%) | 43 (16.9%) |
| $150,000 or more | 15 (14.6%) | 84 (32.9%) |
| Total | 103 (100.0%) | 255 (100.0%) |
Property Value to Household Income Ratio in Palouse
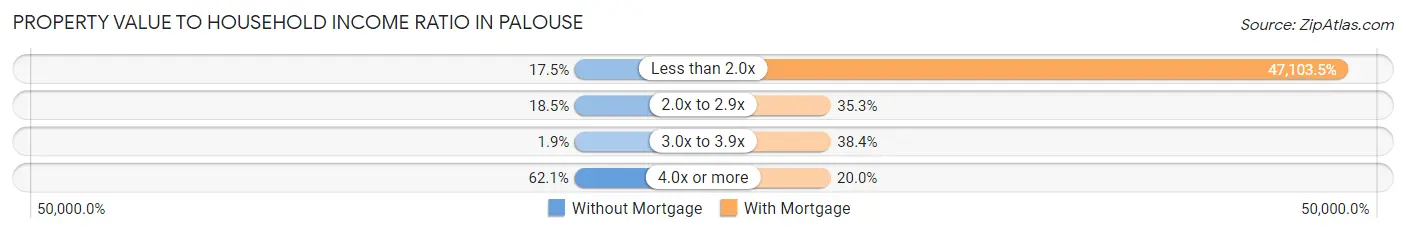
| Value-to-Income Ratio | Without Mortgage | With Mortgage |
| Less than 2.0x | 18 (17.5%) | 120,114 (47,103.5%) |
| 2.0x to 2.9x | 19 (18.4%) | 90 (35.3%) |
| 3.0x to 3.9x | 2 (1.9%) | 98 (38.4%) |
| 4.0x or more | 64 (62.1%) | 51 (20.0%) |
| Total | 103 (100.0%) | 255 (100.0%) |
Real Estate Taxes by Mortgage Status in Palouse
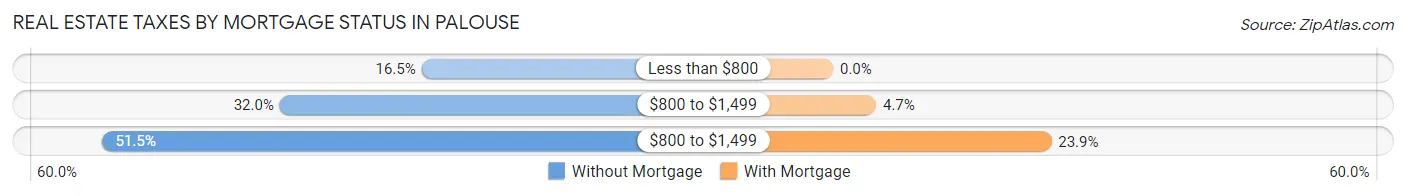
| Property Taxes | Without Mortgage | With Mortgage |
| Less than $800 | 17 (16.5%) | 0 (0.0%) |
| $800 to $1,499 | 33 (32.0%) | 12 (4.7%) |
| $800 to $1,499 | 53 (51.5%) | 61 (23.9%) |
| Total | 103 (100.0%) | 255 (100.0%) |
Health & Disability in Palouse
Health Insurance Coverage by Age in Palouse
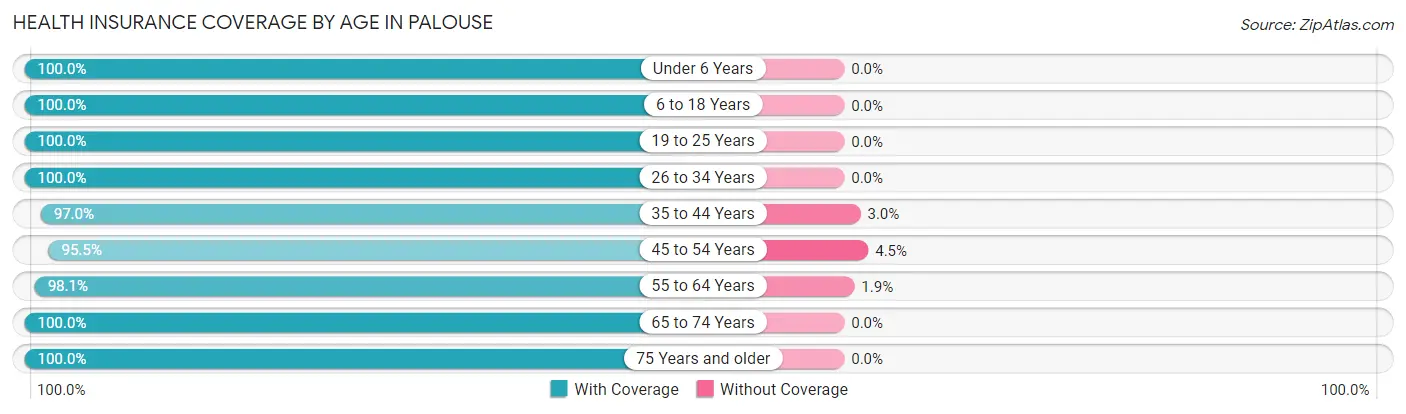
| Age Bracket | With Coverage | Without Coverage |
| Under 6 Years | 83 (100.0%) | 0 (0.0%) |
| 6 to 18 Years | 174 (100.0%) | 0 (0.0%) |
| 19 to 25 Years | 75 (100.0%) | 0 (0.0%) |
| 26 to 34 Years | 37 (100.0%) | 0 (0.0%) |
| 35 to 44 Years | 128 (97.0%) | 4 (3.0%) |
| 45 to 54 Years | 171 (95.5%) | 8 (4.5%) |
| 55 to 64 Years | 156 (98.1%) | 3 (1.9%) |
| 65 to 74 Years | 123 (100.0%) | 0 (0.0%) |
| 75 Years and older | 35 (100.0%) | 0 (0.0%) |
| Total | 982 (98.5%) | 15 (1.5%) |
Health Insurance Coverage by Citizenship Status in Palouse
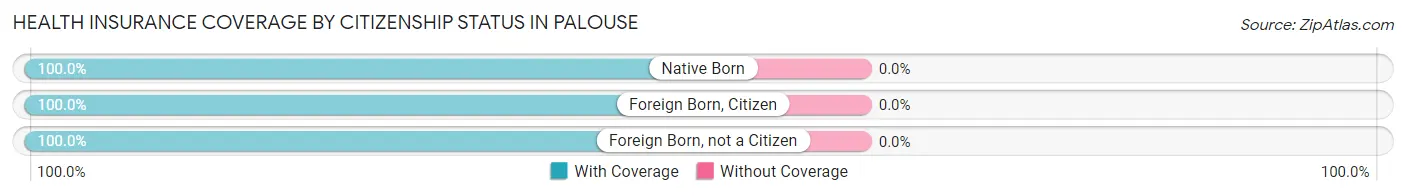
| Citizenship Status | With Coverage | Without Coverage |
| Native Born | 83 (100.0%) | 0 (0.0%) |
| Foreign Born, Citizen | 174 (100.0%) | 0 (0.0%) |
| Foreign Born, not a Citizen | 75 (100.0%) | 0 (0.0%) |
Health Insurance Coverage by Household Income in Palouse
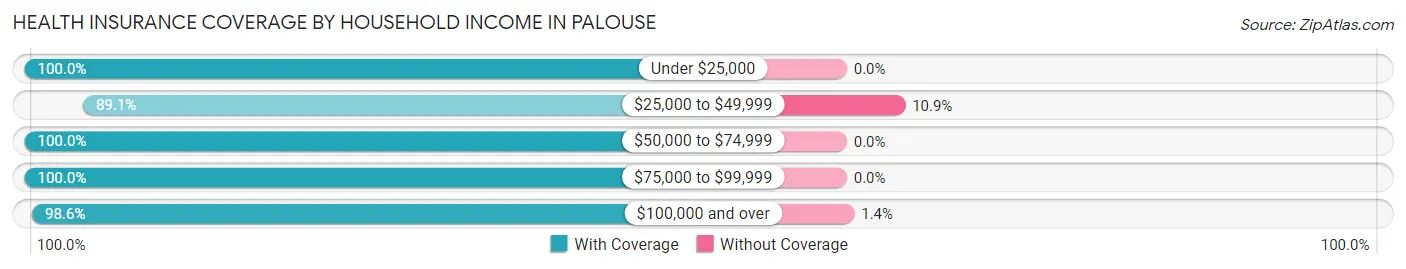
| Household Income | With Coverage | Without Coverage |
| Under $25,000 | 57 (100.0%) | 0 (0.0%) |
| $25,000 to $49,999 | 57 (89.1%) | 7 (10.9%) |
| $50,000 to $74,999 | 88 (100.0%) | 0 (0.0%) |
| $75,000 to $99,999 | 198 (100.0%) | 0 (0.0%) |
| $100,000 and over | 565 (98.6%) | 8 (1.4%) |
Public vs Private Health Insurance Coverage by Age in Palouse
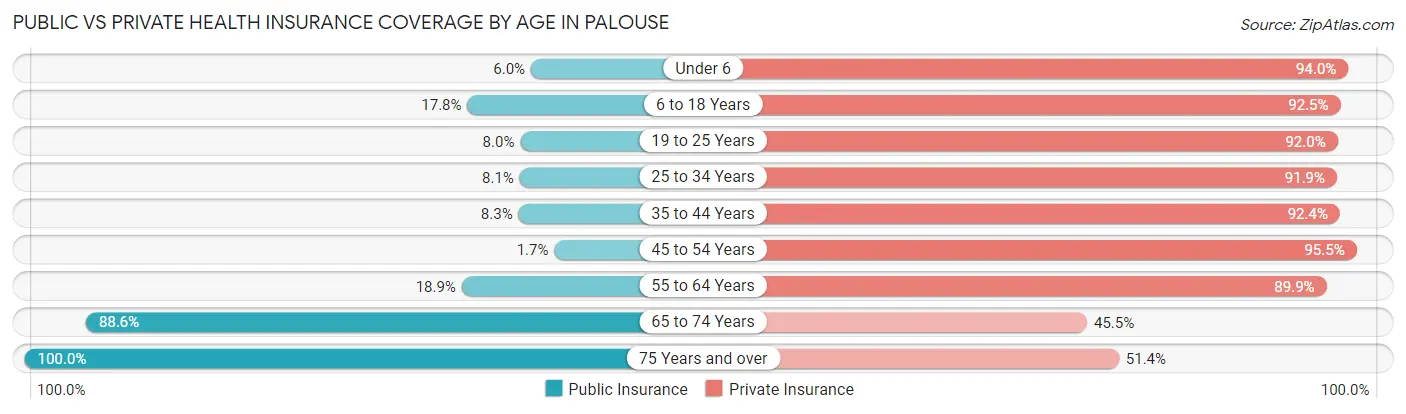
| Age Bracket | Public Insurance | Private Insurance |
| Under 6 | 5 (6.0%) | 78 (94.0%) |
| 6 to 18 Years | 31 (17.8%) | 161 (92.5%) |
| 19 to 25 Years | 6 (8.0%) | 69 (92.0%) |
| 25 to 34 Years | 3 (8.1%) | 34 (91.9%) |
| 35 to 44 Years | 11 (8.3%) | 122 (92.4%) |
| 45 to 54 Years | 3 (1.7%) | 171 (95.5%) |
| 55 to 64 Years | 30 (18.9%) | 143 (89.9%) |
| 65 to 74 Years | 109 (88.6%) | 56 (45.5%) |
| 75 Years and over | 35 (100.0%) | 18 (51.4%) |
| Total | 233 (23.4%) | 852 (85.5%) |
Disability Status by Sex by Age in Palouse
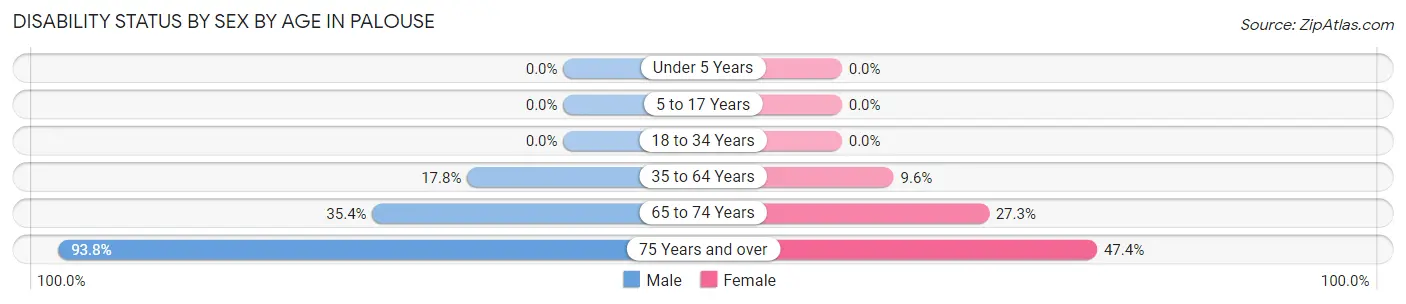
| Age Bracket | Male | Female |
| Under 5 Years | 0 (0.0%) | 0 (0.0%) |
| 5 to 17 Years | 0 (0.0%) | 0 (0.0%) |
| 18 to 34 Years | 0 (0.0%) | 0 (0.0%) |
| 35 to 64 Years | 43 (17.8%) | 22 (9.6%) |
| 65 to 74 Years | 28 (35.4%) | 12 (27.3%) |
| 75 Years and over | 15 (93.8%) | 9 (47.4%) |
Disability Class by Sex by Age in Palouse
Disability Class: Hearing Difficulty
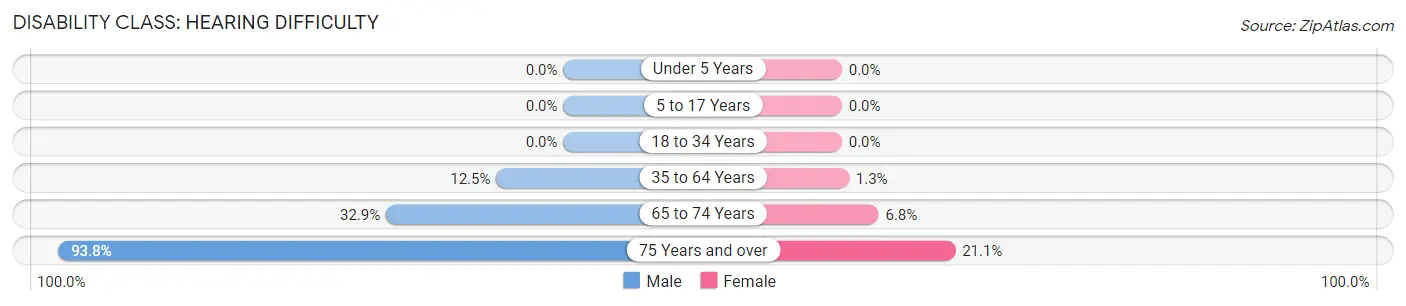
| Age Bracket | Male | Female |
| Under 5 Years | 0 (0.0%) | 0 (0.0%) |
| 5 to 17 Years | 0 (0.0%) | 0 (0.0%) |
| 18 to 34 Years | 0 (0.0%) | 0 (0.0%) |
| 35 to 64 Years | 30 (12.4%) | 3 (1.3%) |
| 65 to 74 Years | 26 (32.9%) | 3 (6.8%) |
| 75 Years and over | 15 (93.8%) | 4 (21.0%) |
Disability Class: Vision Difficulty
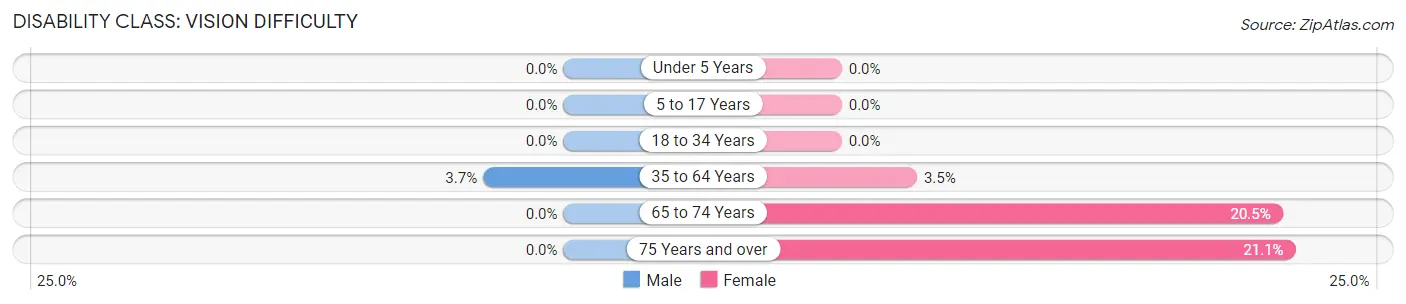
| Age Bracket | Male | Female |
| Under 5 Years | 0 (0.0%) | 0 (0.0%) |
| 5 to 17 Years | 0 (0.0%) | 0 (0.0%) |
| 18 to 34 Years | 0 (0.0%) | 0 (0.0%) |
| 35 to 64 Years | 9 (3.7%) | 8 (3.5%) |
| 65 to 74 Years | 0 (0.0%) | 9 (20.4%) |
| 75 Years and over | 0 (0.0%) | 4 (21.0%) |
Disability Class: Cognitive Difficulty
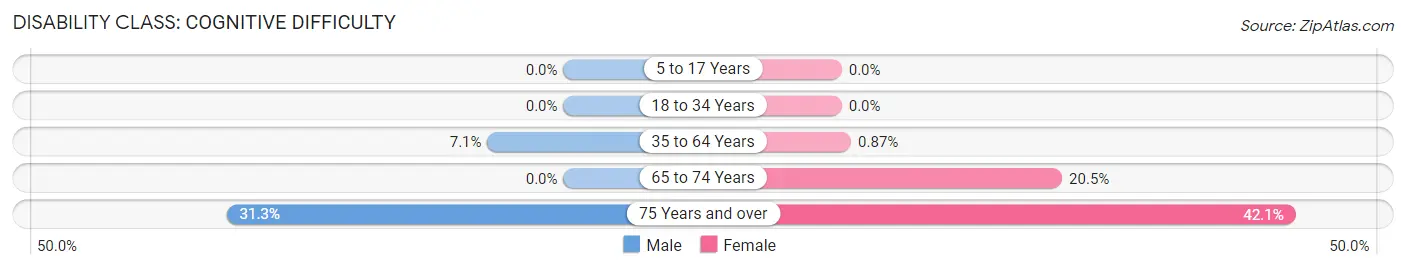
| Age Bracket | Male | Female |
| 5 to 17 Years | 0 (0.0%) | 0 (0.0%) |
| 18 to 34 Years | 0 (0.0%) | 0 (0.0%) |
| 35 to 64 Years | 17 (7.0%) | 2 (0.9%) |
| 65 to 74 Years | 0 (0.0%) | 9 (20.4%) |
| 75 Years and over | 5 (31.2%) | 8 (42.1%) |
Disability Class: Ambulatory Difficulty
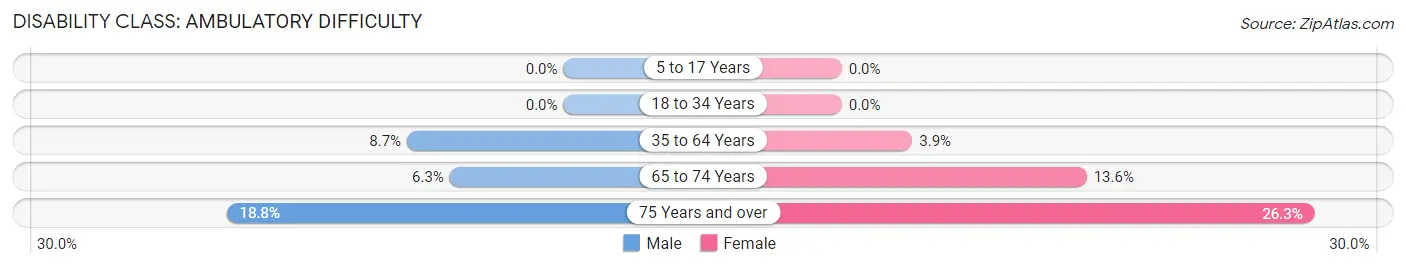
| Age Bracket | Male | Female |
| 5 to 17 Years | 0 (0.0%) | 0 (0.0%) |
| 18 to 34 Years | 0 (0.0%) | 0 (0.0%) |
| 35 to 64 Years | 21 (8.7%) | 9 (3.9%) |
| 65 to 74 Years | 5 (6.3%) | 6 (13.6%) |
| 75 Years and over | 3 (18.8%) | 5 (26.3%) |
Disability Class: Self-Care Difficulty
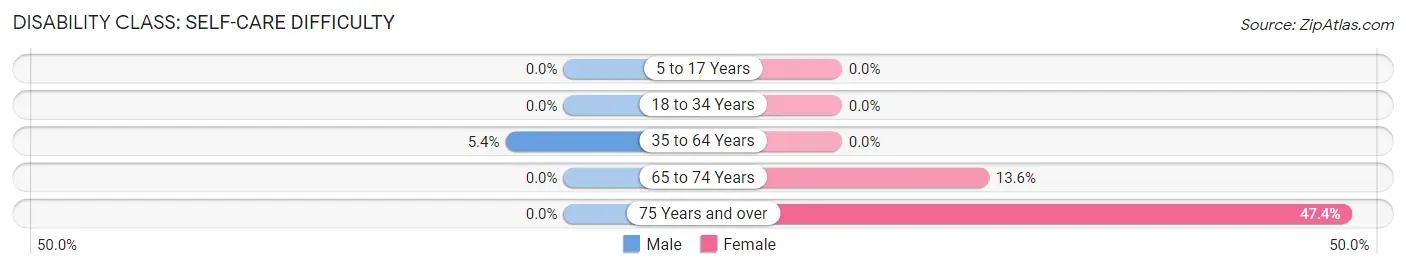
| Age Bracket | Male | Female |
| 5 to 17 Years | 0 (0.0%) | 0 (0.0%) |
| 18 to 34 Years | 0 (0.0%) | 0 (0.0%) |
| 35 to 64 Years | 13 (5.4%) | 0 (0.0%) |
| 65 to 74 Years | 0 (0.0%) | 6 (13.6%) |
| 75 Years and over | 0 (0.0%) | 9 (47.4%) |
Technology Access in Palouse
Computing Device Access in Palouse
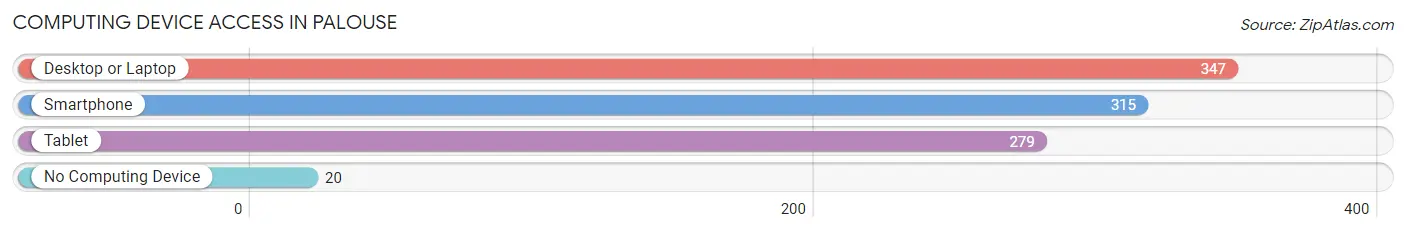
| Device Type | # Households | % Households |
| Desktop or Laptop | 347 | 85.3% |
| Smartphone | 315 | 77.4% |
| Tablet | 279 | 68.5% |
| No Computing Device | 20 | 4.9% |
| Total | 407 | 100.0% |
Internet Access in Palouse
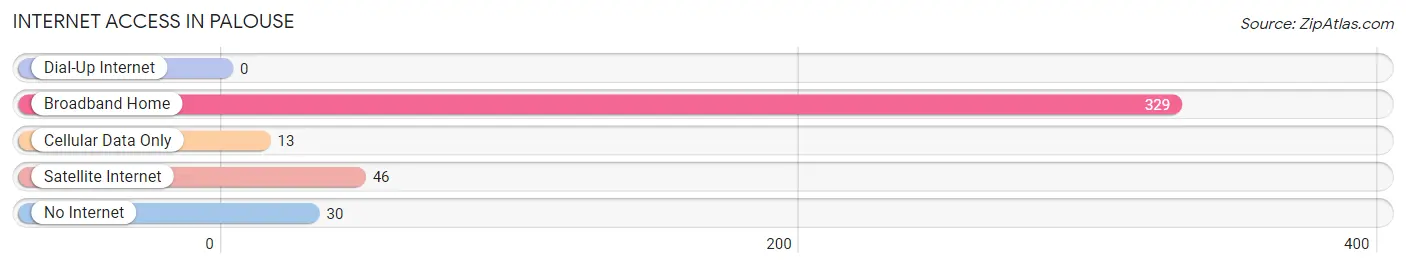
| Internet Type | # Households | % Households |
| Dial-Up Internet | 0 | 0.0% |
| Broadband Home | 329 | 80.8% |
| Cellular Data Only | 13 | 3.2% |
| Satellite Internet | 46 | 11.3% |
| No Internet | 30 | 7.4% |
| Total | 407 | 100.0% |
Palouse Summary
Palouse, Washington is a small city located in the southeastern corner of the state, near the Idaho border. It is part of the Palouse region, which is known for its rolling hills and fertile soil. The city is home to about 2,000 people and is the county seat of Whitman County.
History
The Palouse region was first inhabited by the Palus tribe of Native Americans. The tribe lived in the area for centuries before the arrival of European settlers in the late 1800s. The first settlers were mostly farmers and ranchers who were attracted to the area by its fertile soil and mild climate.
In 1871, the town of Palouse was founded and named after the Palus tribe. The town quickly grew and by the early 1900s, it had become a thriving agricultural center. The town was also home to several businesses, including a flour mill, a sawmill, and a brickyard.
In the early 1900s, the town was connected to the rest of the state by the Spokane, Portland and Seattle Railway. This allowed the town to become a major shipping center for the region.
Geography
Palouse is located in the southeastern corner of Washington, near the Idaho border. The city is situated in the Palouse region, which is known for its rolling hills and fertile soil. The region is also home to several rivers, including the Palouse River, which flows through the city.
The city has a total area of 1.7 square miles, all of which is land. The city is located at an elevation of 1,845 feet above sea level.
Economy
The economy of Palouse is largely based on agriculture. The city is home to several farms and ranches, which produce a variety of crops, including wheat, barley, oats, and hay. The city is also home to several food processing plants, which process the crops grown in the area.
In addition to agriculture, the city is also home to several businesses, including a lumber mill, a furniture factory, and a printing company. The city is also home to several retail stores, restaurants, and other businesses.
Demographics
As of the 2010 census, the population of Palouse was 2,000. The racial makeup of the city was 95.2% White, 0.7% African American, 0.7% Native American, 0.7% Asian, 0.3% Pacific Islander, and 1.7% from other races. The median household income was $37,500 and the median family income was $45,000.
Conclusion
Palouse, Washington is a small city located in the southeastern corner of the state, near the Idaho border. It is part of the Palouse region, which is known for its rolling hills and fertile soil. The city is home to about 2,000 people and is the county seat of Whitman County. The economy of Palouse is largely based on agriculture, with several farms and ranches producing a variety of crops. The city is also home to several businesses, including a lumber mill, a furniture factory, and a printing company. The population of Palouse is mostly White, with a small percentage of African American, Native American, Asian, and Pacific Islander residents.
Common Questions
What is Per Capita Income in Palouse?
Per Capita income in Palouse is $41,091.
What is the Median Family Income in Palouse?
Median Family Income in Palouse is $120,568.
What is the Median Household income in Palouse?
Median Household Income in Palouse is $89,479.
What is Income or Wage Gap in Palouse?
Income or Wage Gap in Palouse is 18.1%.
Women in Palouse earn 81.9 cents for every dollar earned by a man.
What is Inequality or Gini Index in Palouse?
Inequality or Gini Index in Palouse is 0.36.
What is the Total Population of Palouse?
Total Population of Palouse is 997.
What is the Total Male Population of Palouse?
Total Male Population of Palouse is 553.
What is the Total Female Population of Palouse?
Total Female Population of Palouse is 444.
What is the Ratio of Males per 100 Females in Palouse?
There are 124.55 Males per 100 Females in Palouse.
What is the Ratio of Females per 100 Males in Palouse?
There are 80.29 Females per 100 Males in Palouse.
What is the Median Population Age in Palouse?
Median Population Age in Palouse is 44.6 Years.
What is the Average Family Size in Palouse
Average Family Size in Palouse is 3.1 People.
What is the Average Household Size in Palouse
Average Household Size in Palouse is 2.4 People.
How Large is the Labor Force in Palouse?
There are 516 People in the Labor Forcein in Palouse.
What is the Percentage of People in the Labor Force in Palouse?
67.0% of People are in the Labor Force in Palouse.
What is the Unemployment Rate in Palouse?
Unemployment Rate in Palouse is 1.4%.