Odessa, WA Map & Demographics
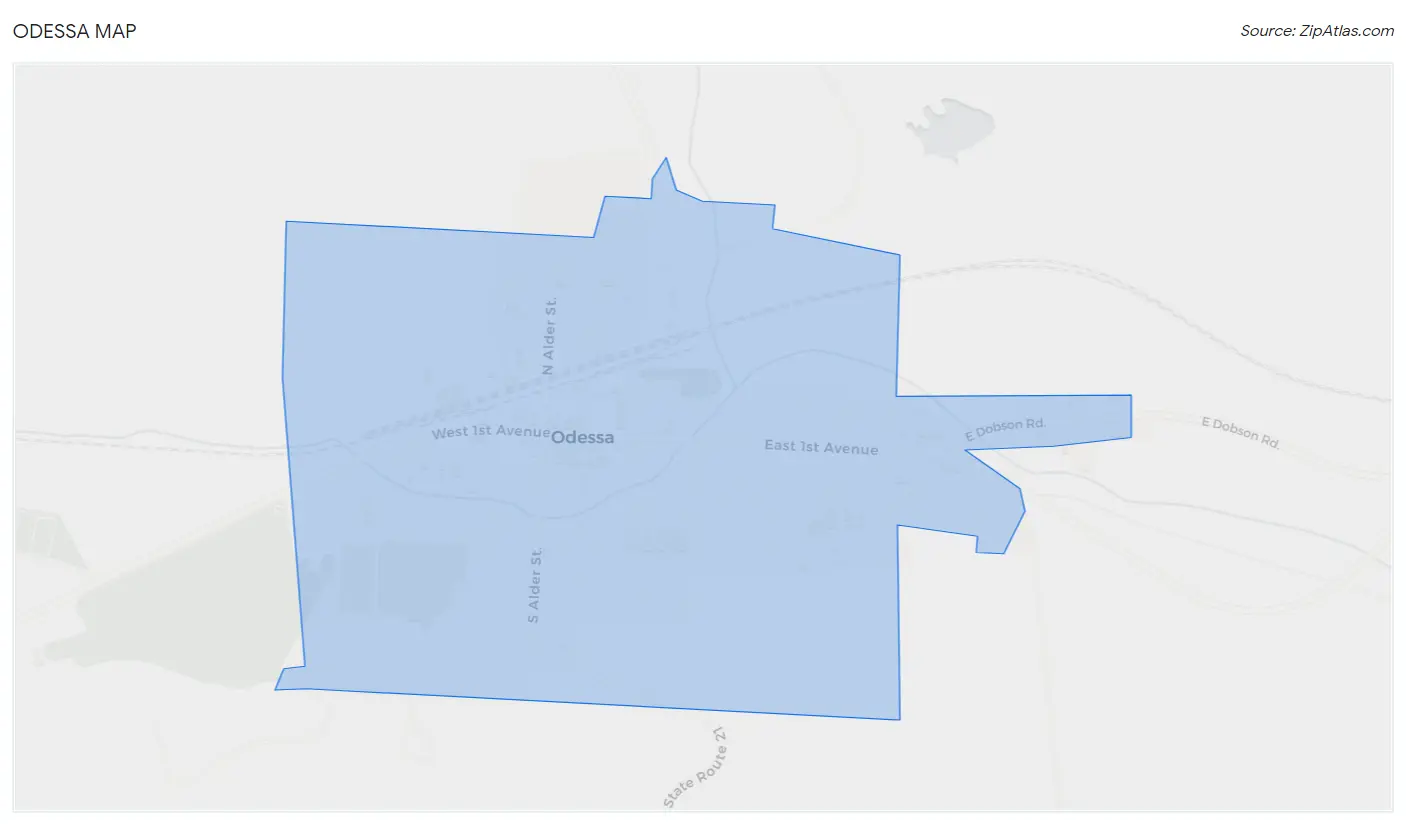
Odessa Map
Odessa Overview
$31,010
PER CAPITA INCOME
$49,583
AVG FAMILY INCOME
$46,607
AVG HOUSEHOLD INCOME
36.5%
WAGE / INCOME GAP [ % ]
63.5¢/ $1
WAGE / INCOME GAP [ $ ]
0.42
INEQUALITY / GINI INDEX
798
TOTAL POPULATION
379
MALE POPULATION
419
FEMALE POPULATION
90.45
MALES / 100 FEMALES
110.55
FEMALES / 100 MALES
57.8
MEDIAN AGE
2.5
AVG FAMILY SIZE
1.9
AVG HOUSEHOLD SIZE
323
LABOR FORCE [ PEOPLE ]
43.6%
PERCENT IN LABOR FORCE
5.3%
UNEMPLOYMENT RATE
Odessa Zip Codes
Odessa Area Codes
Income in Odessa
Income Overview in Odessa
Per Capita Income in Odessa is $31,010, while median incomes of families and households are $49,583 and $46,607 respectively.
| Characteristic | Number | Measure |
| Per Capita Income | 798 | $31,010 |
| Median Family Income | 182 | $49,583 |
| Mean Family Income | 182 | $65,198 |
| Median Household Income | 378 | $46,607 |
| Mean Household Income | 378 | $59,330 |
| Income Deficit | 182 | $0 |
| Wage / Income Gap (%) | 798 | 36.54% |
| Wage / Income Gap ($) | 798 | 63.46¢ per $1 |
| Gini / Inequality Index | 798 | 0.42 |
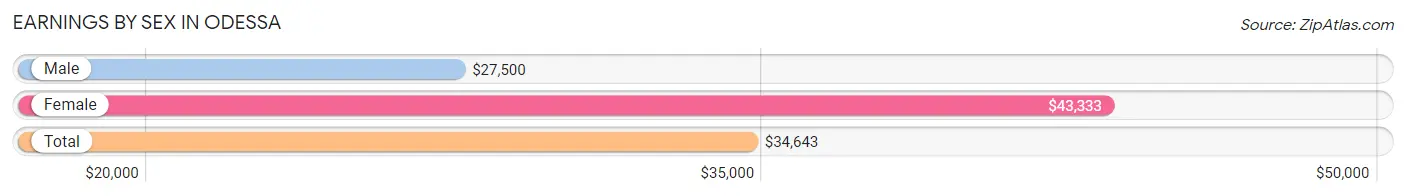
Earnings by Sex in Odessa
Average Earnings in Odessa are $34,643, $27,500 for men and $43,333 for women, a difference of 36.5%.
| Sex | Number | Average Earnings |
| Male | 136 (41.2%) | $27,500 |
| Female | 194 (58.8%) | $43,333 |
| Total | 330 (100.0%) | $34,643 |
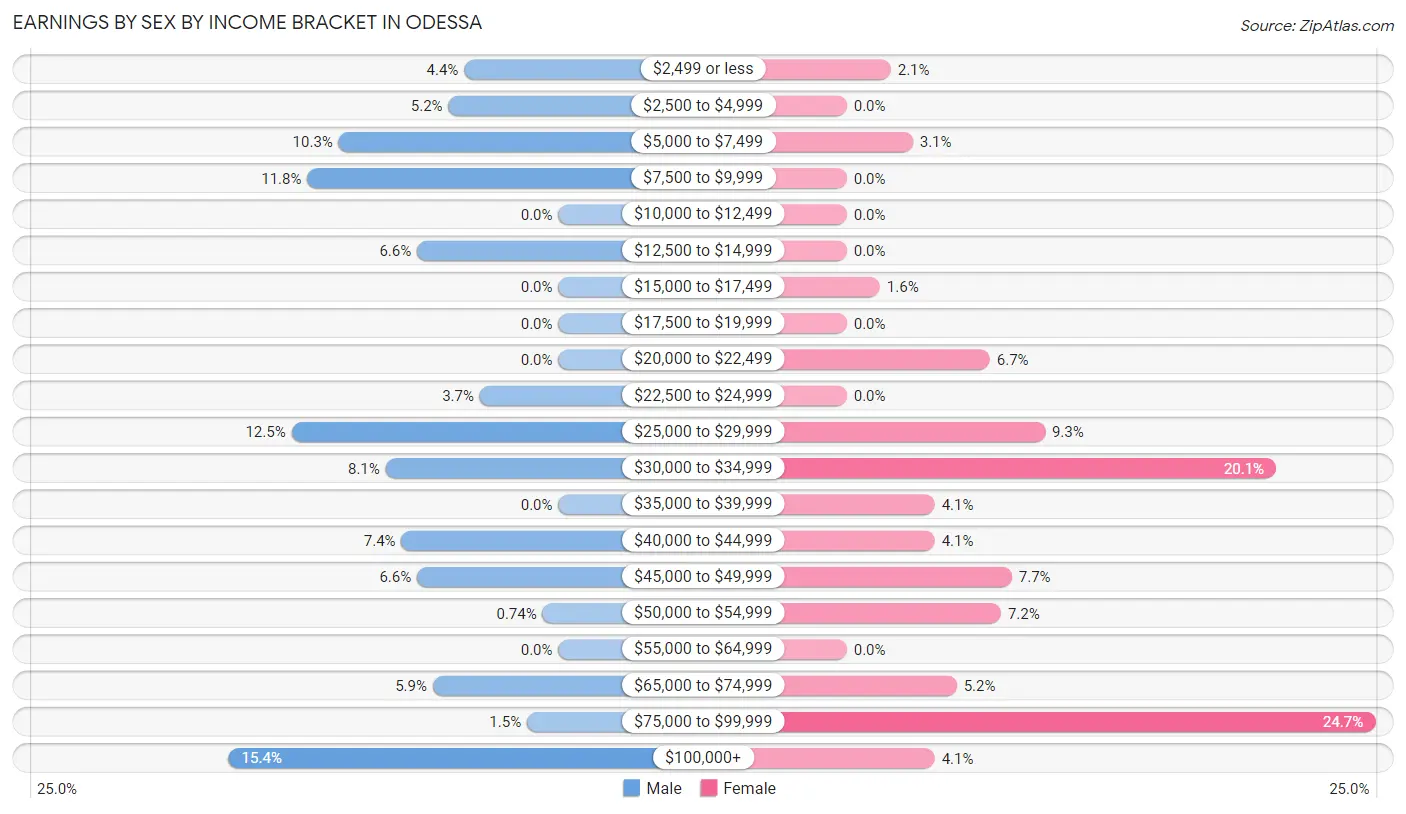
Earnings by Sex by Income Bracket in Odessa
The most common earnings brackets in Odessa are $100,000+ for men (21 | 15.4%) and $75,000 to $99,999 for women (48 | 24.7%).
| Income | Male | Female |
| $2,499 or less | 6 (4.4%) | 4 (2.1%) |
| $2,500 to $4,999 | 7 (5.1%) | 0 (0.0%) |
| $5,000 to $7,499 | 14 (10.3%) | 6 (3.1%) |
| $7,500 to $9,999 | 16 (11.8%) | 0 (0.0%) |
| $10,000 to $12,499 | 0 (0.0%) | 0 (0.0%) |
| $12,500 to $14,999 | 9 (6.6%) | 0 (0.0%) |
| $15,000 to $17,499 | 0 (0.0%) | 3 (1.5%) |
| $17,500 to $19,999 | 0 (0.0%) | 0 (0.0%) |
| $20,000 to $22,499 | 0 (0.0%) | 13 (6.7%) |
| $22,500 to $24,999 | 5 (3.7%) | 0 (0.0%) |
| $25,000 to $29,999 | 17 (12.5%) | 18 (9.3%) |
| $30,000 to $34,999 | 11 (8.1%) | 39 (20.1%) |
| $35,000 to $39,999 | 0 (0.0%) | 8 (4.1%) |
| $40,000 to $44,999 | 10 (7.3%) | 8 (4.1%) |
| $45,000 to $49,999 | 9 (6.6%) | 15 (7.7%) |
| $50,000 to $54,999 | 1 (0.7%) | 14 (7.2%) |
| $55,000 to $64,999 | 0 (0.0%) | 0 (0.0%) |
| $65,000 to $74,999 | 8 (5.9%) | 10 (5.1%) |
| $75,000 to $99,999 | 2 (1.5%) | 48 (24.7%) |
| $100,000+ | 21 (15.4%) | 8 (4.1%) |
| Total | 136 (100.0%) | 194 (100.0%) |
Earnings by Sex by Educational Attainment in Odessa
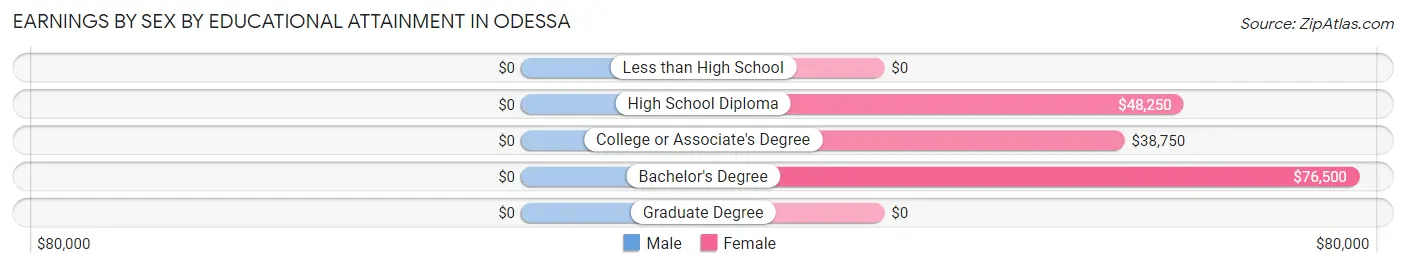
| Educational Attainment | Male Income | Female Income |
| Less than High School | - | - |
| High School Diploma | - | - |
| College or Associate's Degree | - | - |
| Bachelor's Degree | - | - |
| Graduate Degree | - | - |
| Total | $27,045 | $48,583 |
Family Income in Odessa
Family Income Brackets in Odessa
According to the Odessa family income data, there are 54 families falling into the $35,000 to $49,999 income range, which is the most common income bracket and makes up 29.7% of all families.
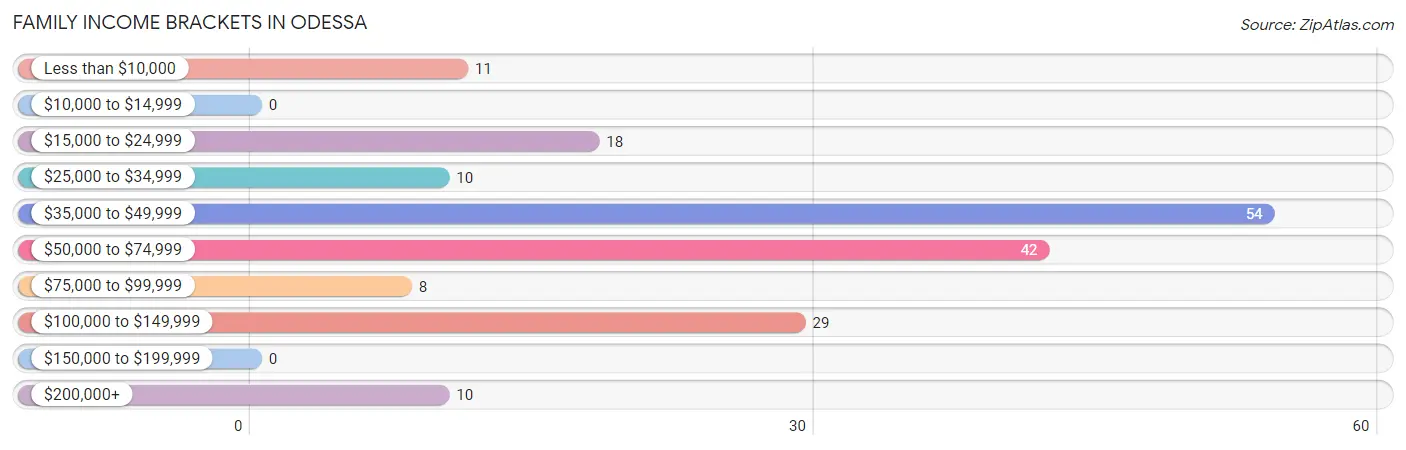
| Income Bracket | # Families | % Families |
| Less than $10,000 | 11 | 6.0% |
| $10,000 to $14,999 | 0 | 0.0% |
| $15,000 to $24,999 | 18 | 9.9% |
| $25,000 to $34,999 | 10 | 5.5% |
| $35,000 to $49,999 | 54 | 29.7% |
| $50,000 to $74,999 | 42 | 23.1% |
| $75,000 to $99,999 | 8 | 4.4% |
| $100,000 to $149,999 | 29 | 15.9% |
| $150,000 to $199,999 | 0 | 0.0% |
| $200,000+ | 10 | 5.5% |
Family Income by Famaliy Size in Odessa
4-person families (10 | 5.5%) account for the highest median family income in Odessa with $145,417 per family, while 4-person families (10 | 5.5%) have the highest median income of $36,354 per family member.
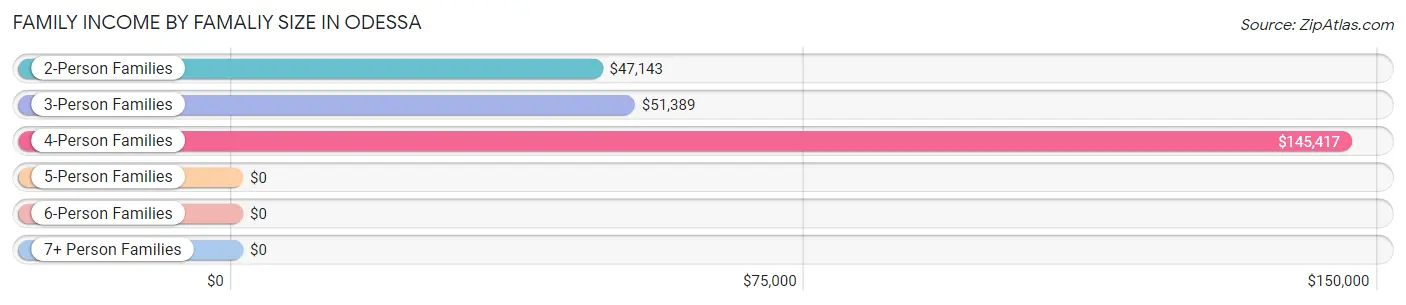
| Income Bracket | # Families | Median Income |
| 2-Person Families | 144 (79.1%) | $47,143 |
| 3-Person Families | 18 (9.9%) | $51,389 |
| 4-Person Families | 10 (5.5%) | $145,417 |
| 5-Person Families | 4 (2.2%) | $0 |
| 6-Person Families | 6 (3.3%) | $0 |
| 7+ Person Families | 0 (0.0%) | $0 |
| Total | 182 (100.0%) | $49,583 |
Family Income by Number of Earners in Odessa
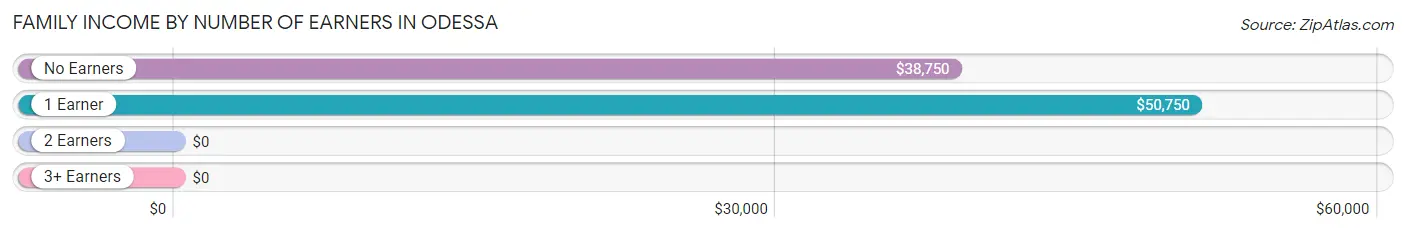
| Number of Earners | # Families | Median Income |
| No Earners | 66 (36.3%) | $38,750 |
| 1 Earner | 71 (39.0%) | $50,750 |
| 2 Earners | 33 (18.1%) | $0 |
| 3+ Earners | 12 (6.6%) | $0 |
| Total | 182 (100.0%) | $49,583 |
Household Income in Odessa
Household Income Brackets in Odessa
With 78 households falling in the category, the $35,000 to $49,999 income range is the most frequent in Odessa, accounting for 20.6% of all households. In contrast, only 10 households (2.6%) fall into the $200,000+ income bracket, making it the least populous group.
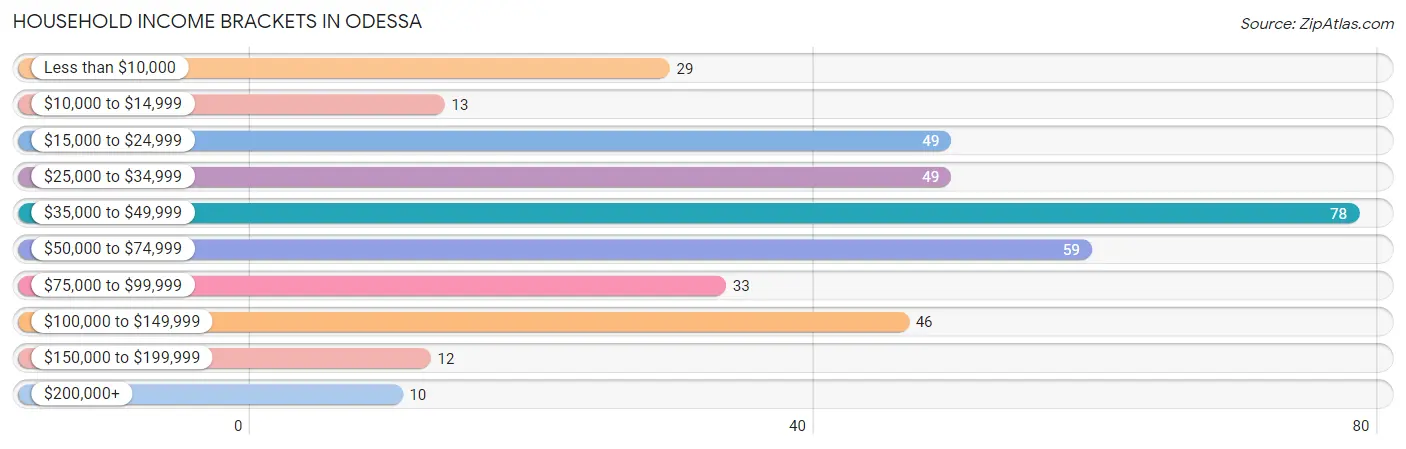
| Income Bracket | # Households | % Households |
| Less than $10,000 | 29 | 7.7% |
| $10,000 to $14,999 | 13 | 3.4% |
| $15,000 to $24,999 | 49 | 13.0% |
| $25,000 to $34,999 | 49 | 13.0% |
| $35,000 to $49,999 | 78 | 20.6% |
| $50,000 to $74,999 | 59 | 15.6% |
| $75,000 to $99,999 | 33 | 8.7% |
| $100,000 to $149,999 | 46 | 12.2% |
| $150,000 to $199,999 | 12 | 3.2% |
| $200,000+ | 10 | 2.6% |
Household Income by Householder Age in Odessa
The median household income in Odessa is $46,607, with the highest median household income of $71,250 found in the 25 to 44 years age bracket for the primary householder. A total of 52 households (13.8%) fall into this category. Meanwhile, the 15 to 24 years age bracket for the primary householder has the lowest median household income of $0, with 3 households (0.8%) in this group.
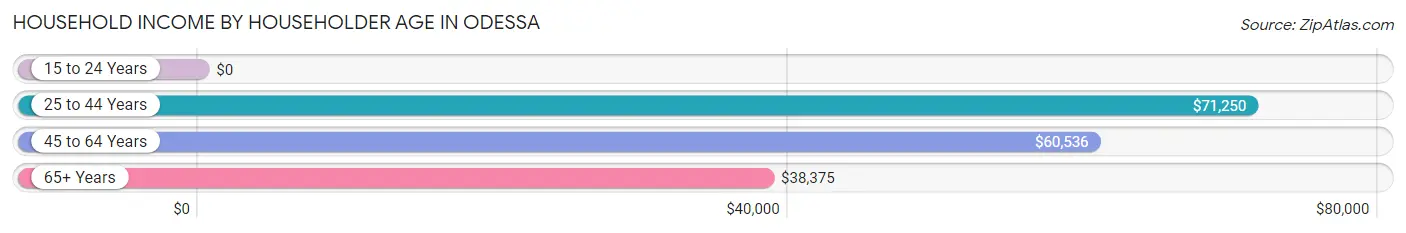
| Income Bracket | # Households | Median Income |
| 15 to 24 Years | 3 (0.8%) | $0 |
| 25 to 44 Years | 52 (13.8%) | $71,250 |
| 45 to 64 Years | 154 (40.7%) | $60,536 |
| 65+ Years | 169 (44.7%) | $38,375 |
| Total | 378 (100.0%) | $46,607 |
Poverty in Odessa
Income Below Poverty by Sex and Age in Odessa
With 14.4% poverty level for males and 11.8% for females among the residents of Odessa, 18 to 24 year old males and under 5 year old females are the most vulnerable to poverty, with 13 males (76.5%) and 4 females (80.0%) in their respective age groups living below the poverty level.
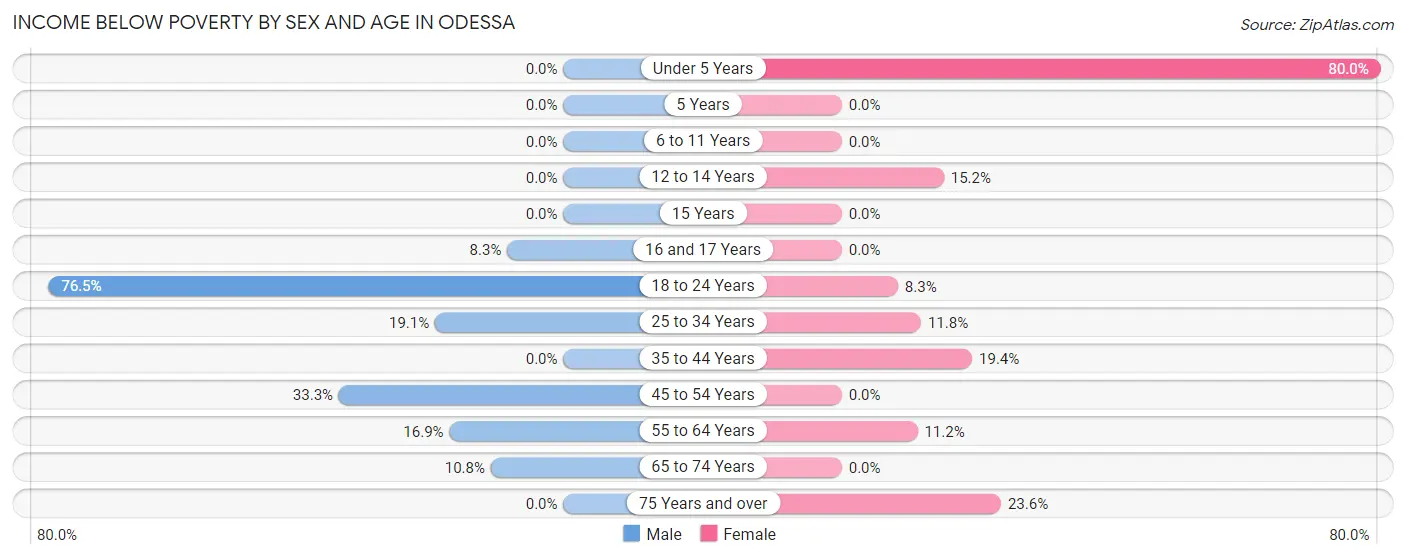
| Age Bracket | Male | Female |
| Under 5 Years | 0 (0.0%) | 4 (80.0%) |
| 5 Years | 0 (0.0%) | 0 (0.0%) |
| 6 to 11 Years | 0 (0.0%) | 0 (0.0%) |
| 12 to 14 Years | 0 (0.0%) | 5 (15.1%) |
| 15 Years | 0 (0.0%) | 0 (0.0%) |
| 16 and 17 Years | 2 (8.3%) | 0 (0.0%) |
| 18 to 24 Years | 13 (76.5%) | 2 (8.3%) |
| 25 to 34 Years | 8 (19.1%) | 4 (11.8%) |
| 35 to 44 Years | 0 (0.0%) | 6 (19.4%) |
| 45 to 54 Years | 9 (33.3%) | 0 (0.0%) |
| 55 to 64 Years | 11 (16.9%) | 10 (11.2%) |
| 65 to 74 Years | 7 (10.8%) | 0 (0.0%) |
| 75 Years and over | 0 (0.0%) | 13 (23.6%) |
| Total | 50 (14.4%) | 44 (11.8%) |
Income Above Poverty by Sex and Age in Odessa
According to the poverty statistics in Odessa, males aged 6 to 11 years and females aged 6 to 11 years are the age groups that are most secure financially, with 100.0% of males and 100.0% of females in these age groups living above the poverty line.
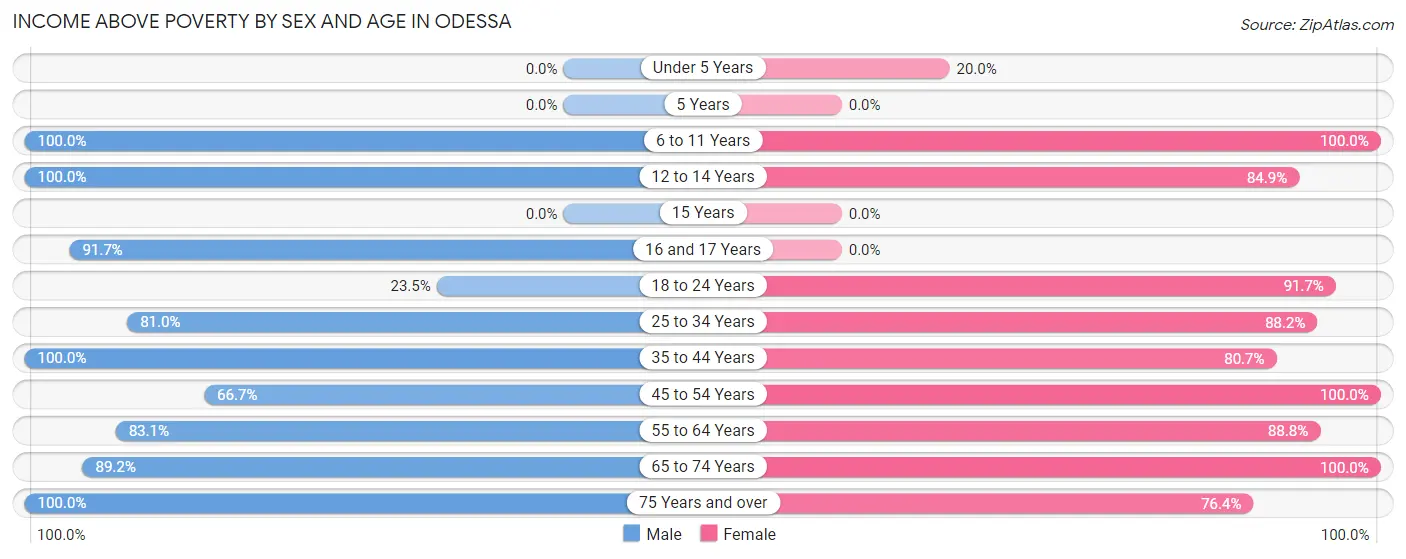
| Age Bracket | Male | Female |
| Under 5 Years | 0 (0.0%) | 1 (20.0%) |
| 5 Years | 0 (0.0%) | 0 (0.0%) |
| 6 to 11 Years | 10 (100.0%) | 1 (100.0%) |
| 12 to 14 Years | 5 (100.0%) | 28 (84.9%) |
| 15 Years | 0 (0.0%) | 0 (0.0%) |
| 16 and 17 Years | 22 (91.7%) | 0 (0.0%) |
| 18 to 24 Years | 4 (23.5%) | 22 (91.7%) |
| 25 to 34 Years | 34 (80.9%) | 30 (88.2%) |
| 35 to 44 Years | 12 (100.0%) | 25 (80.6%) |
| 45 to 54 Years | 18 (66.7%) | 66 (100.0%) |
| 55 to 64 Years | 54 (83.1%) | 79 (88.8%) |
| 65 to 74 Years | 58 (89.2%) | 36 (100.0%) |
| 75 Years and over | 79 (100.0%) | 42 (76.4%) |
| Total | 296 (85.6%) | 330 (88.2%) |
Income Below Poverty Among Married-Couple Families in Odessa
The poverty statistics for married-couple families in Odessa show that 6.4% or 9 of the total 140 families live below the poverty line. Families with 1 or 2 children have the highest poverty rate of 66.7%, comprising of 2 families. On the other hand, families with 3 or 4 children have the lowest poverty rate of 0.0%, which includes 0 families.
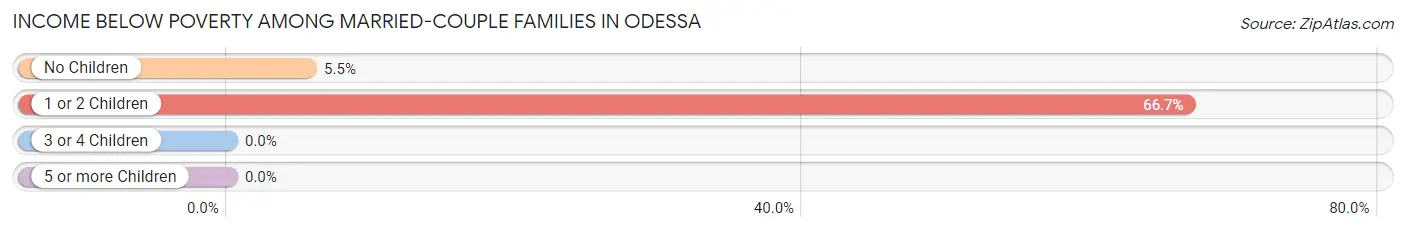
| Children | Above Poverty | Below Poverty |
| No Children | 120 (94.5%) | 7 (5.5%) |
| 1 or 2 Children | 1 (33.3%) | 2 (66.7%) |
| 3 or 4 Children | 10 (100.0%) | 0 (0.0%) |
| 5 or more Children | 0 (0.0%) | 0 (0.0%) |
| Total | 131 (93.6%) | 9 (6.4%) |
Income Below Poverty Among Single-Parent Households in Odessa
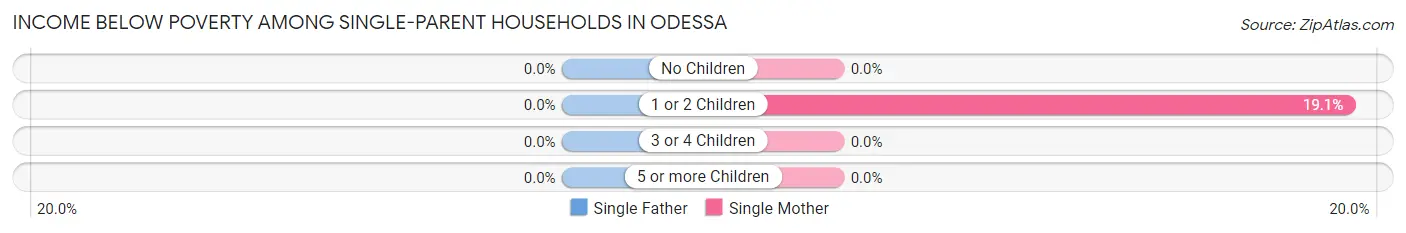
| Children | Single Father | Single Mother |
| No Children | 0 (0.0%) | 0 (0.0%) |
| 1 or 2 Children | 0 (0.0%) | 4 (19.1%) |
| 3 or 4 Children | 0 (0.0%) | 0 (0.0%) |
| 5 or more Children | 0 (0.0%) | 0 (0.0%) |
| Total | 0 (0.0%) | 4 (9.5%) |
Income Below Poverty Among Married-Couple vs Single-Parent Households in Odessa
The poverty data for Odessa shows that 9 of the married-couple family households (6.4%) and 4 of the single-parent households (9.5%) are living below the poverty level. Within the married-couple family households, those with 1 or 2 children have the highest poverty rate, with 2 households (66.7%) falling below the poverty line. Among the single-parent households, those with 1 or 2 children have the highest poverty rate, with 4 household (19.1%) living below poverty.
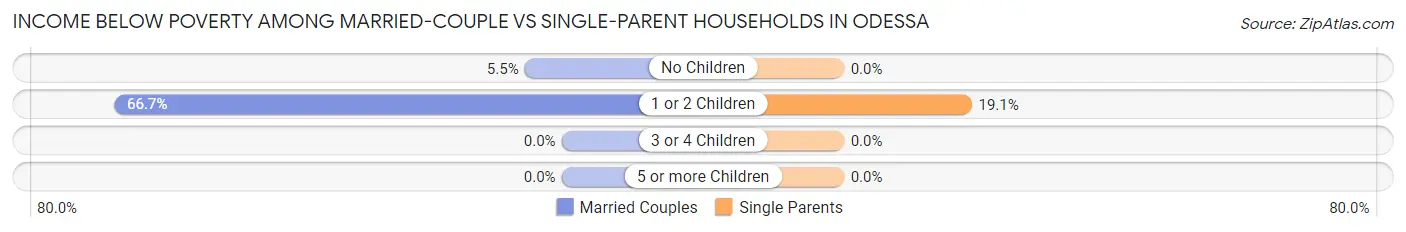
| Children | Married-Couple Families | Single-Parent Households |
| No Children | 7 (5.5%) | 0 (0.0%) |
| 1 or 2 Children | 2 (66.7%) | 4 (19.1%) |
| 3 or 4 Children | 0 (0.0%) | 0 (0.0%) |
| 5 or more Children | 0 (0.0%) | 0 (0.0%) |
| Total | 9 (6.4%) | 4 (9.5%) |
Race in Odessa
The most populous races in Odessa are White / Caucasian (762 | 95.5%), Hispanic or Latino (30 | 3.8%), and Asian (14 | 1.8%).
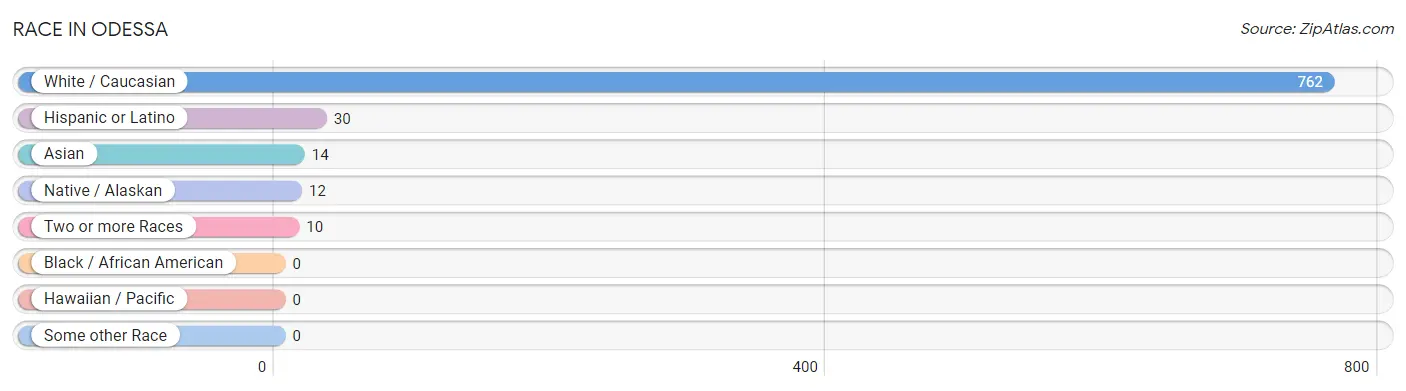
| Race | # Population | % Population |
| Asian | 14 | 1.8% |
| Black / African American | 0 | 0.0% |
| Hawaiian / Pacific | 0 | 0.0% |
| Hispanic or Latino | 30 | 3.8% |
| Native / Alaskan | 12 | 1.5% |
| White / Caucasian | 762 | 95.5% |
| Two or more Races | 10 | 1.3% |
| Some other Race | 0 | 0.0% |
| Total | 798 | 100.0% |
Ancestry in Odessa
The most populous ancestries reported in Odessa are American (329 | 41.2%), German (150 | 18.8%), Irish (89 | 11.2%), English (68 | 8.5%), and French (33 | 4.1%), together accounting for 83.8% of all Odessa residents.
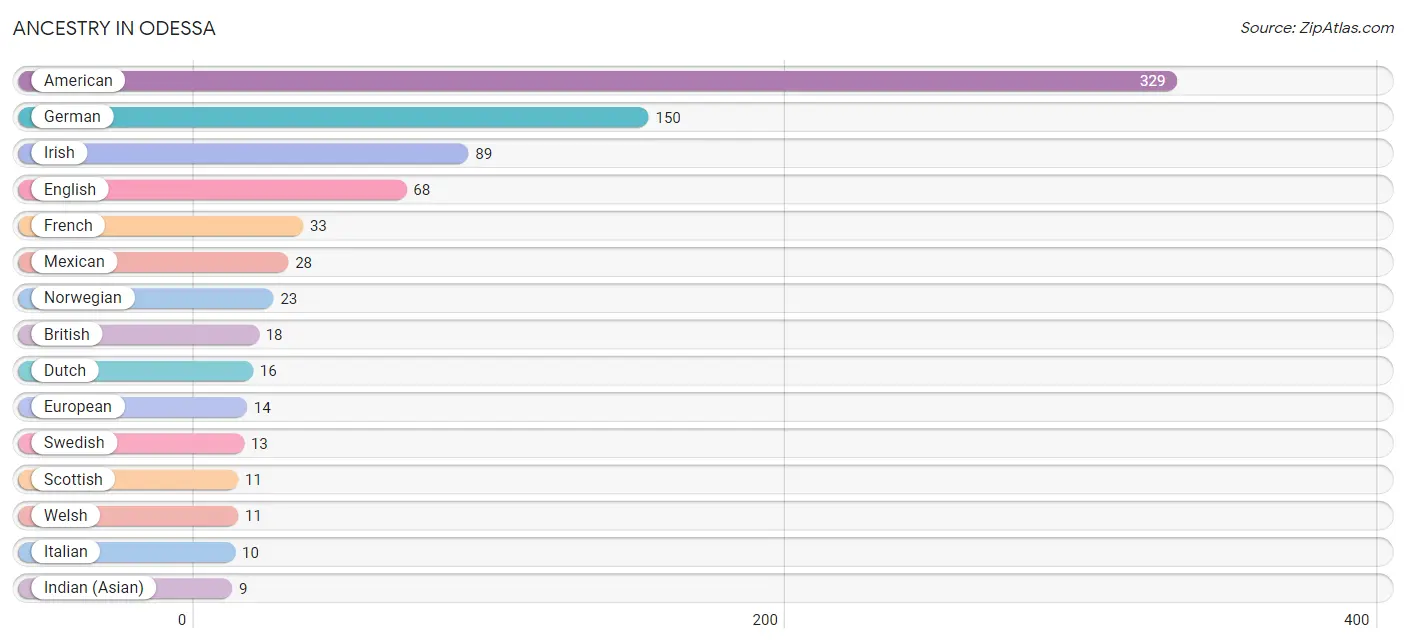
| Ancestry | # Population | % Population |
| Aleut | 8 | 1.0% |
| American | 329 | 41.2% |
| Arab | 2 | 0.3% |
| Belgian | 4 | 0.5% |
| Bhutanese | 1 | 0.1% |
| British | 18 | 2.3% |
| Canadian | 3 | 0.4% |
| Czech | 8 | 1.0% |
| Dutch | 16 | 2.0% |
| English | 68 | 8.5% |
| European | 14 | 1.8% |
| French | 33 | 4.1% |
| German | 150 | 18.8% |
| Indian (Asian) | 9 | 1.1% |
| Iraqi | 2 | 0.3% |
| Irish | 89 | 11.2% |
| Israeli | 2 | 0.3% |
| Italian | 10 | 1.3% |
| Mexican | 28 | 3.5% |
| Norwegian | 23 | 2.9% |
| Osage | 4 | 0.5% |
| Scotch-Irish | 8 | 1.0% |
| Scottish | 11 | 1.4% |
| Sri Lankan | 4 | 0.5% |
| Swedish | 13 | 1.6% |
| Welsh | 11 | 1.4% | View All 26 Rows |
Immigrants in Odessa
The most numerous immigrant groups reported in Odessa came from Europe (18 | 2.3%), Western Europe (14 | 1.8%), Asia (13 | 1.6%), Eastern Asia (10 | 1.3%), and China (9 | 1.1%), together accounting for 8.0% of all Odessa residents.
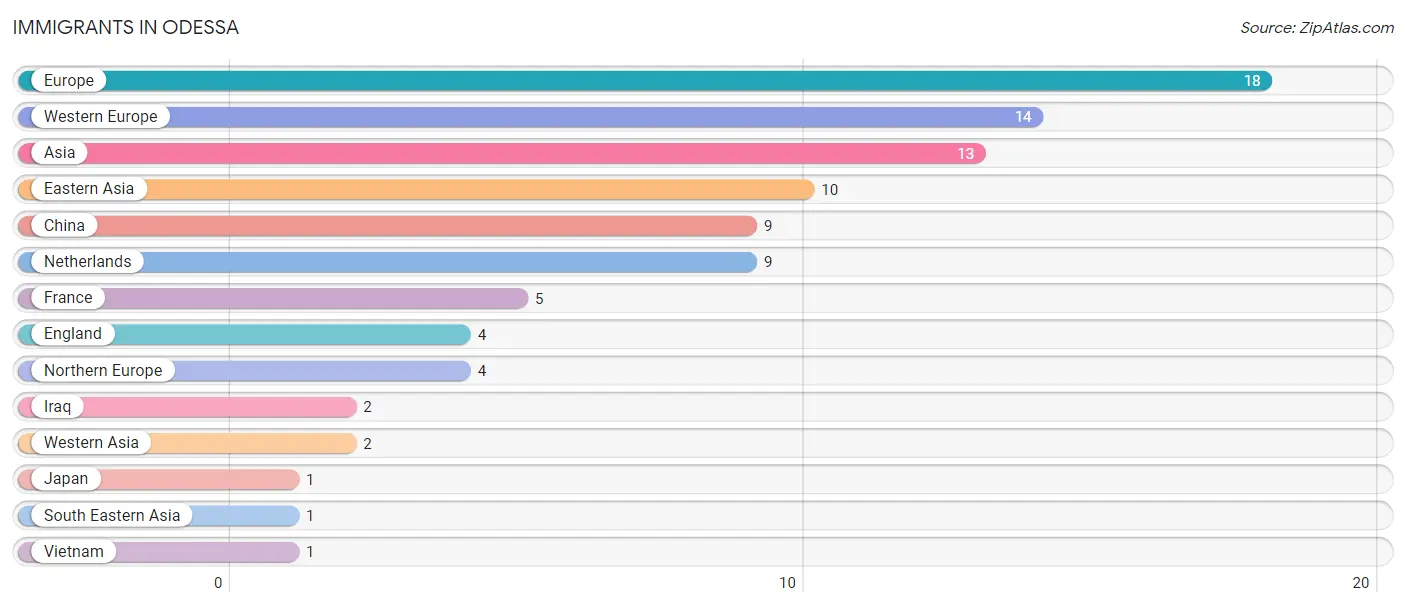
| Immigration Origin | # Population | % Population |
| Asia | 13 | 1.6% |
| China | 9 | 1.1% |
| Eastern Asia | 10 | 1.3% |
| England | 4 | 0.5% |
| Europe | 18 | 2.3% |
| France | 5 | 0.6% |
| Iraq | 2 | 0.3% |
| Japan | 1 | 0.1% |
| Netherlands | 9 | 1.1% |
| Northern Europe | 4 | 0.5% |
| South Eastern Asia | 1 | 0.1% |
| Vietnam | 1 | 0.1% |
| Western Asia | 2 | 0.3% |
| Western Europe | 14 | 1.8% | View All 14 Rows |
Sex and Age in Odessa
Sex and Age in Odessa
The most populous age groups in Odessa are 65 to 69 Years (57 | 15.0%) for men and 60 to 64 Years (55 | 13.1%) for women.
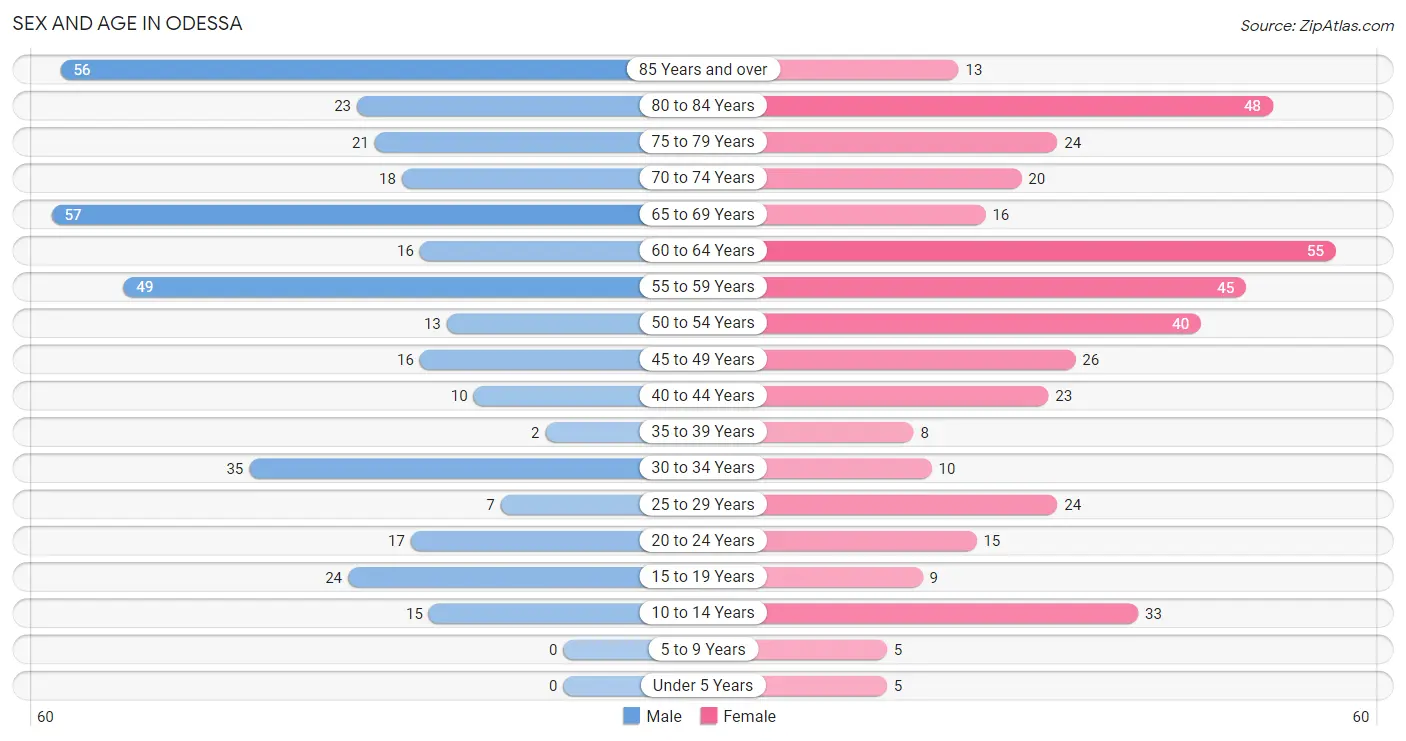
| Age Bracket | Male | Female |
| Under 5 Years | 0 (0.0%) | 5 (1.2%) |
| 5 to 9 Years | 0 (0.0%) | 5 (1.2%) |
| 10 to 14 Years | 15 (4.0%) | 33 (7.9%) |
| 15 to 19 Years | 24 (6.3%) | 9 (2.1%) |
| 20 to 24 Years | 17 (4.5%) | 15 (3.6%) |
| 25 to 29 Years | 7 (1.8%) | 24 (5.7%) |
| 30 to 34 Years | 35 (9.2%) | 10 (2.4%) |
| 35 to 39 Years | 2 (0.5%) | 8 (1.9%) |
| 40 to 44 Years | 10 (2.6%) | 23 (5.5%) |
| 45 to 49 Years | 16 (4.2%) | 26 (6.2%) |
| 50 to 54 Years | 13 (3.4%) | 40 (9.6%) |
| 55 to 59 Years | 49 (12.9%) | 45 (10.7%) |
| 60 to 64 Years | 16 (4.2%) | 55 (13.1%) |
| 65 to 69 Years | 57 (15.0%) | 16 (3.8%) |
| 70 to 74 Years | 18 (4.8%) | 20 (4.8%) |
| 75 to 79 Years | 21 (5.5%) | 24 (5.7%) |
| 80 to 84 Years | 23 (6.1%) | 48 (11.5%) |
| 85 Years and over | 56 (14.8%) | 13 (3.1%) |
| Total | 379 (100.0%) | 419 (100.0%) |
Families and Households in Odessa
Median Family Size in Odessa
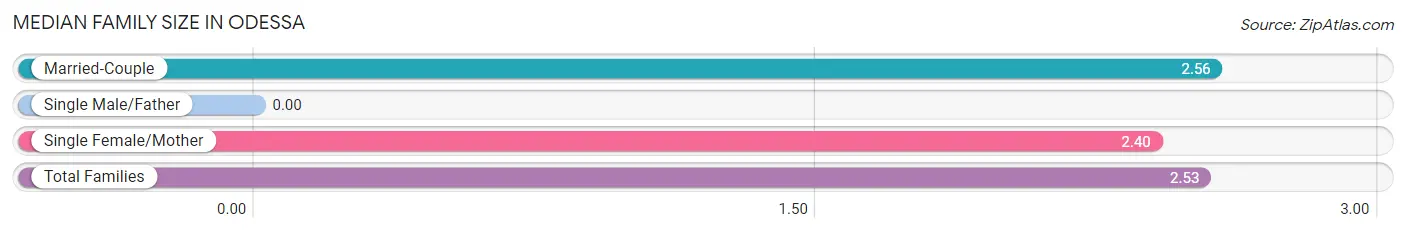
| Family Type | # Families | Family Size |
| Married-Couple | 140 (76.9%) | 2.56 |
| Single Male/Father | 0 (0.0%) | - |
| Single Female/Mother | 42 (23.1%) | 2.40 |
| Total Families | 182 (100.0%) | 2.53 |
Median Household Size in Odessa
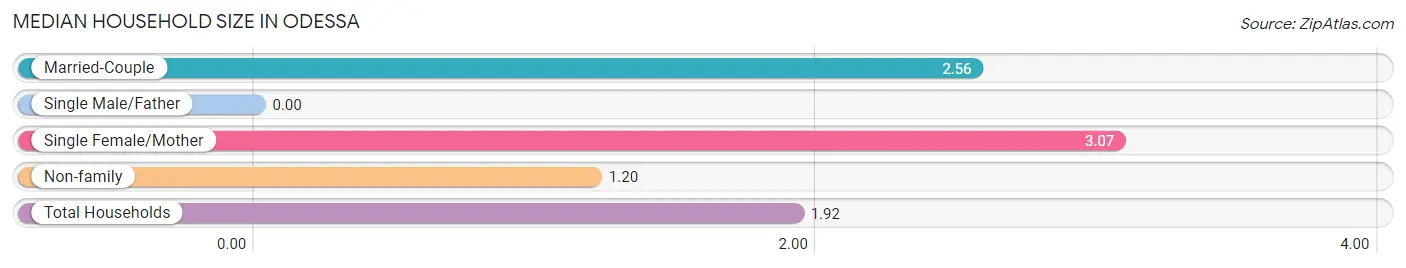
| Household Type | # Households | Household Size |
| Married-Couple | 140 (37.0%) | 2.56 |
| Single Male/Father | 0 (0.0%) | - |
| Single Female/Mother | 42 (11.1%) | 3.07 |
| Non-family | 196 (51.8%) | 1.20 |
| Total Households | 378 (100.0%) | 1.92 |
Household Size by Marriage Status in Odessa
Out of a total of 378 households in Odessa, 182 (48.1%) are family households, while 196 (51.8%) are nonfamily households. The most numerous type of family households are 2-person households, comprising 122, and the most common type of nonfamily households are 1-person households, comprising 167.
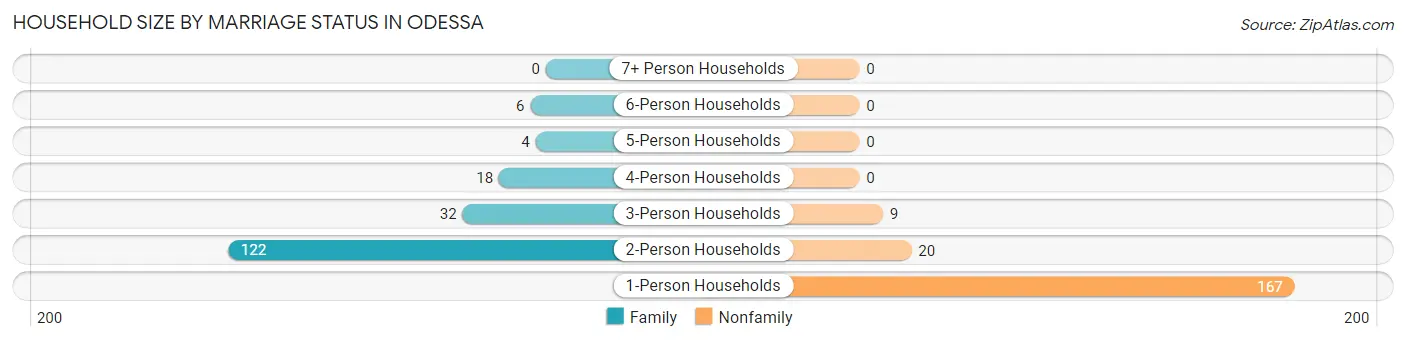
| Household Size | Family Households | Nonfamily Households |
| 1-Person Households | - | 167 (44.2%) |
| 2-Person Households | 122 (32.3%) | 20 (5.3%) |
| 3-Person Households | 32 (8.5%) | 9 (2.4%) |
| 4-Person Households | 18 (4.8%) | 0 (0.0%) |
| 5-Person Households | 4 (1.1%) | 0 (0.0%) |
| 6-Person Households | 6 (1.6%) | 0 (0.0%) |
| 7+ Person Households | 0 (0.0%) | 0 (0.0%) |
| Total | 182 (48.1%) | 196 (51.8%) |
Female Fertility in Odessa
Fertility by Age in Odessa
Average fertility rate in Odessa is 113.0 births per 1,000 women. Women in the age bracket of 20 to 34 years have the highest fertility rate with 265.0 births per 1,000 women. Women in the age bracket of 20 to 34 years acount for 100.0% of all women with births.
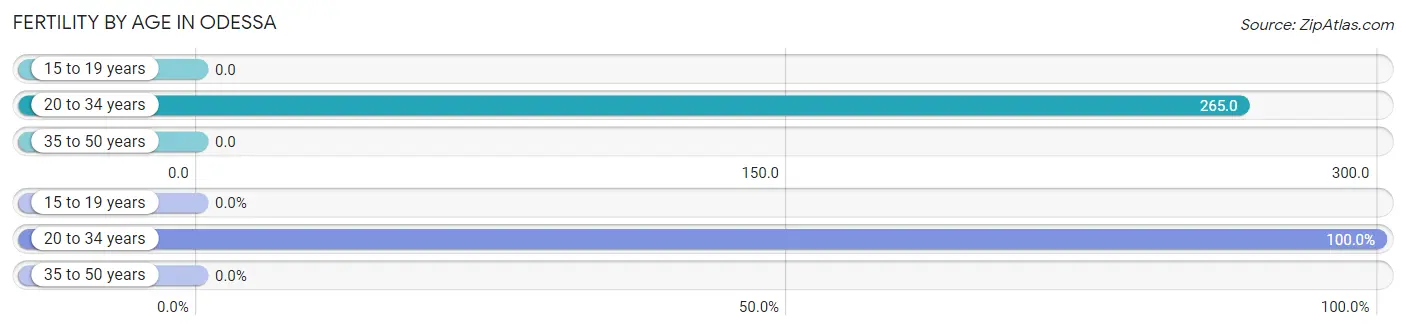
| Age Bracket | Women with Births | Births / 1,000 Women |
| 15 to 19 years | 0 (0.0%) | 0.0 |
| 20 to 34 years | 13 (100.0%) | 265.0 |
| 35 to 50 years | 0 (0.0%) | 0.0 |
| Total | 13 (100.0%) | 113.0 |
Fertility by Age by Marriage Status in Odessa
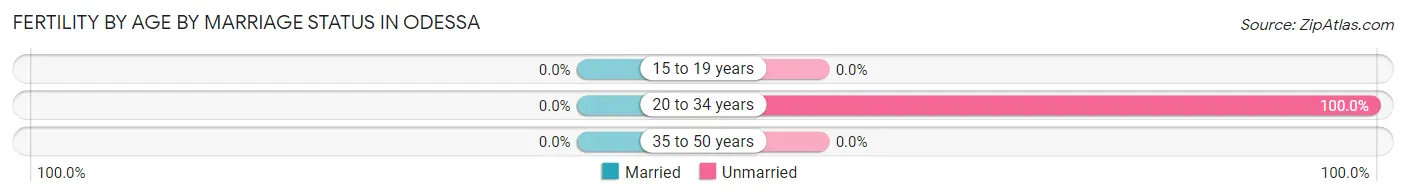
| Age Bracket | Married | Unmarried |
| 15 to 19 years | 0 (0.0%) | 0 (0.0%) |
| 20 to 34 years | 0 (0.0%) | 13 (100.0%) |
| 35 to 50 years | 0 (0.0%) | 0 (0.0%) |
| Total | 0 (0.0%) | 13 (100.0%) |
Fertility by Education in Odessa
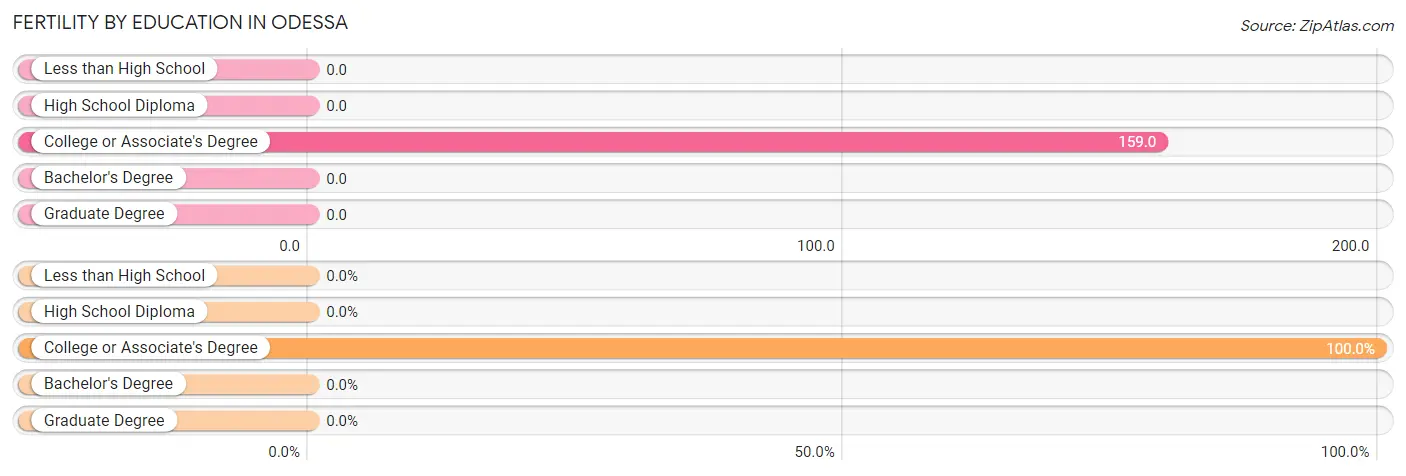
| Educational Attainment | Women with Births | Births / 1,000 Women |
| Less than High School | 0 (0.0%) | 0.0 |
| High School Diploma | 0 (0.0%) | 0.0 |
| College or Associate's Degree | 13 (100.0%) | 159.0 |
| Bachelor's Degree | 0 (0.0%) | 0.0 |
| Graduate Degree | 0 (0.0%) | 0.0 |
| Total | 13 (100.0%) | 113.0 |
Fertility by Education by Marriage Status in Odessa
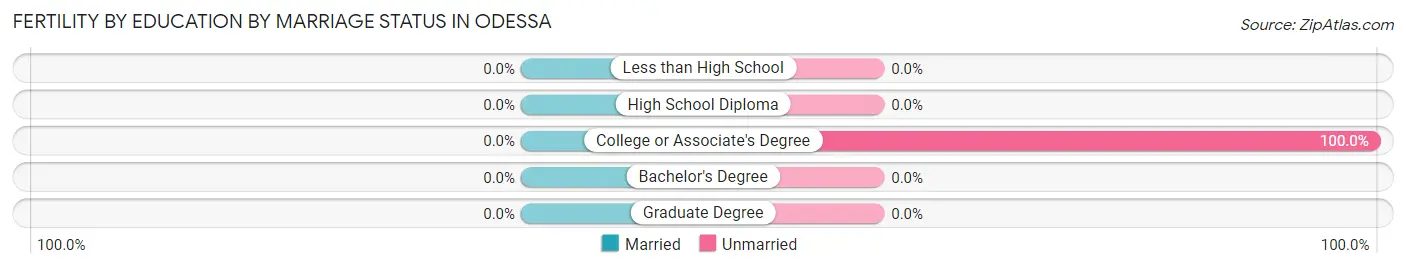
| Educational Attainment | Married | Unmarried |
| Less than High School | 0 (0.0%) | 0 (0.0%) |
| High School Diploma | 0 (0.0%) | 0 (0.0%) |
| College or Associate's Degree | 0 (0.0%) | 13 (100.0%) |
| Bachelor's Degree | 0 (0.0%) | 0 (0.0%) |
| Graduate Degree | 0 (0.0%) | 0 (0.0%) |
| Total | 0 (0.0%) | 13 (100.0%) |
Employment Characteristics in Odessa
Employment by Class of Employer in Odessa
Among the 306 employed individuals in Odessa, private company employees (193 | 63.1%), local government employees (50 | 16.3%), and state government employees (38 | 12.4%) make up the most common classes of employment.
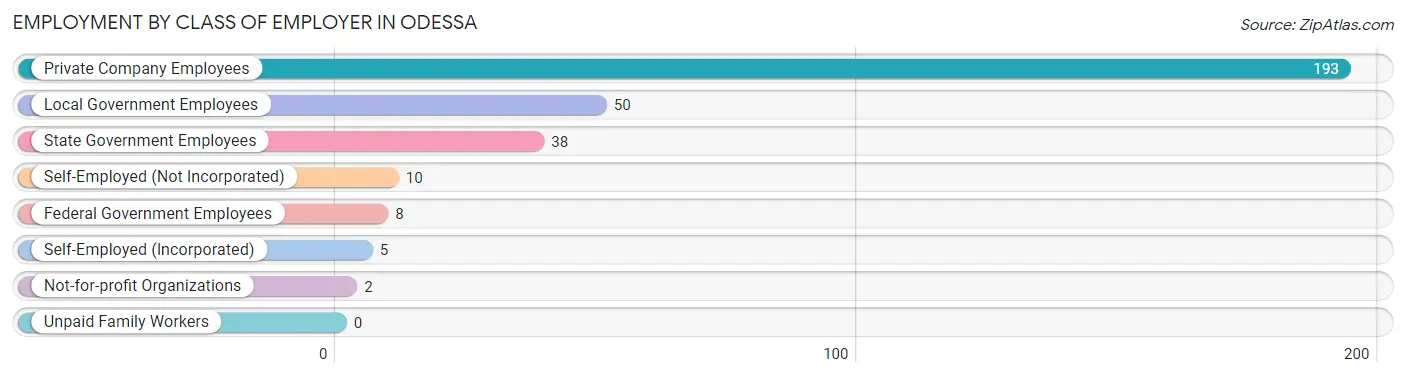
| Employer Class | # Employees | % Employees |
| Private Company Employees | 193 | 63.1% |
| Self-Employed (Incorporated) | 5 | 1.6% |
| Self-Employed (Not Incorporated) | 10 | 3.3% |
| Not-for-profit Organizations | 2 | 0.6% |
| Local Government Employees | 50 | 16.3% |
| State Government Employees | 38 | 12.4% |
| Federal Government Employees | 8 | 2.6% |
| Unpaid Family Workers | 0 | 0.0% |
| Total | 306 | 100.0% |
Employment Status by Age in Odessa
According to the labor force statistics for Odessa, out of the total population over 16 years of age (740), 43.6% or 323 individuals are in the labor force, with 5.3% or 17 of them unemployed. The age group with the highest labor force participation rate is 45 to 54 years, with 96.8% or 92 individuals in the labor force. Within the labor force, the 25 to 29 years age range has the highest percentage of unemployed individuals, with 50.0% or 9 of them being unemployed.
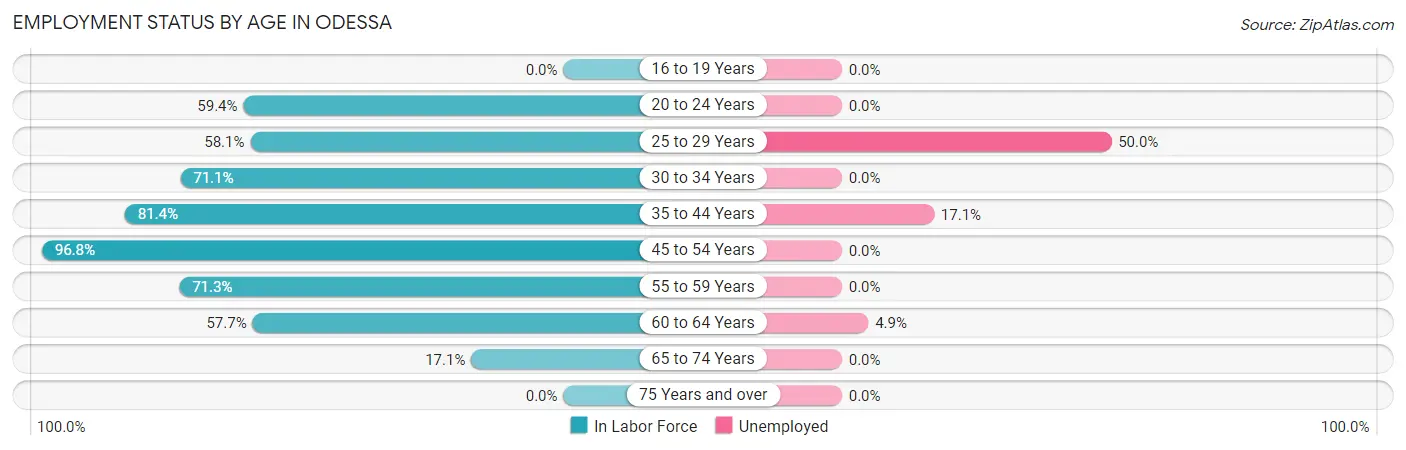
| Age Bracket | In Labor Force | Unemployed |
| 16 to 19 Years | 0 (0.0%) | 0 (0.0%) |
| 20 to 24 Years | 19 (59.4%) | 0 (0.0%) |
| 25 to 29 Years | 18 (58.1%) | 9 (50.0%) |
| 30 to 34 Years | 32 (71.1%) | 0 (0.0%) |
| 35 to 44 Years | 35 (81.4%) | 6 (17.1%) |
| 45 to 54 Years | 92 (96.8%) | 0 (0.0%) |
| 55 to 59 Years | 67 (71.3%) | 0 (0.0%) |
| 60 to 64 Years | 41 (57.7%) | 2 (4.9%) |
| 65 to 74 Years | 19 (17.1%) | 0 (0.0%) |
| 75 Years and over | 0 (0.0%) | 0 (0.0%) |
| Total | 323 (43.6%) | 17 (5.3%) |
Employment Status by Educational Attainment in Odessa
According to labor force statistics for Odessa, 75.2% of individuals (285) out of the total population between 25 and 64 years of age (379) are in the labor force, with 6.0% or 17 of them being unemployed. The group with the highest labor force participation rate are those with the educational attainment of bachelor's degree or higher, with 98.2% or 56 individuals in the labor force. Within the labor force, individuals with high school diploma education have the highest percentage of unemployment, with 10.2% or 9 of them being unemployed.
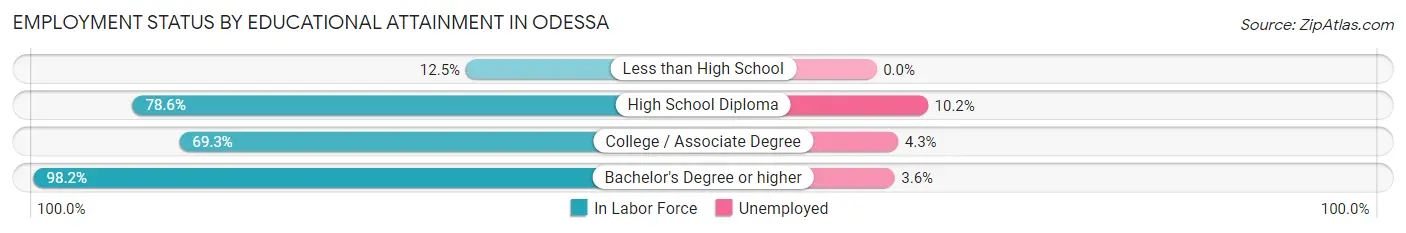
| Educational Attainment | In Labor Force | Unemployed |
| Less than High School | 1 (12.5%) | 0 (0.0%) |
| High School Diploma | 88 (78.6%) | 11 (10.2%) |
| College / Associate Degree | 140 (69.3%) | 9 (4.3%) |
| Bachelor's Degree or higher | 56 (98.2%) | 2 (3.6%) |
| Total | 285 (75.2%) | 23 (6.0%) |
Employment Occupations by Sex in Odessa
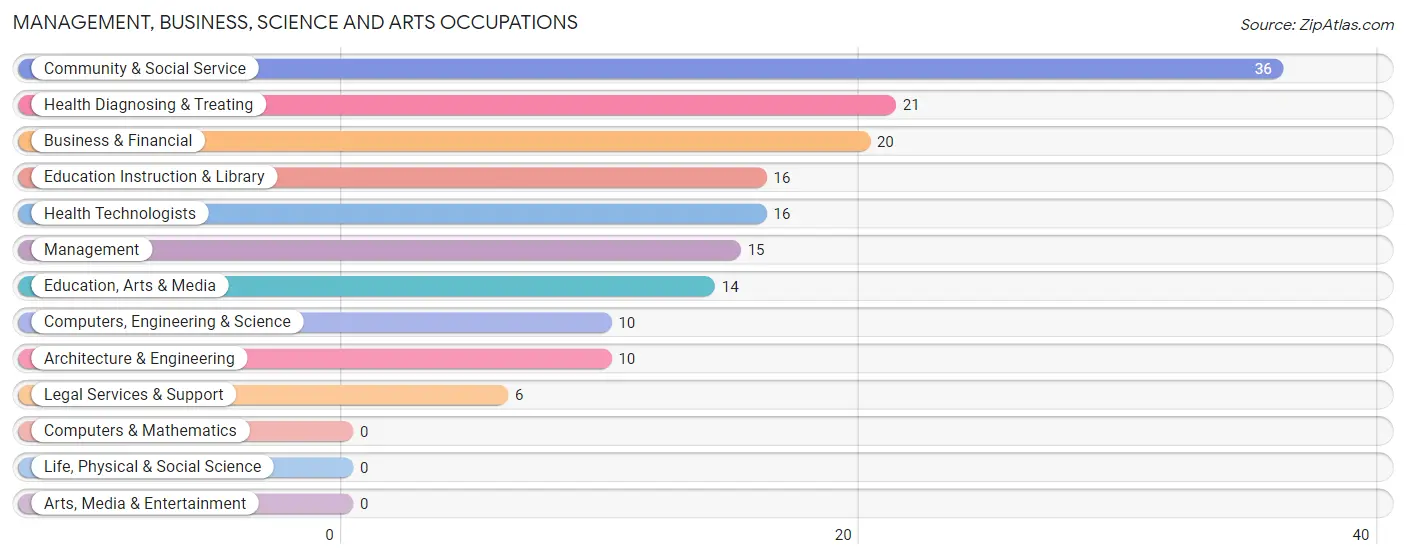
Management, Business, Science and Arts Occupations
The most common Management, Business, Science and Arts occupations in Odessa are Community & Social Service (36 | 11.8%), Health Diagnosing & Treating (21 | 6.9%), Business & Financial (20 | 6.5%), Education Instruction & Library (16 | 5.2%), and Health Technologists (16 | 5.2%).
Management, Business, Science and Arts Occupations by Sex
Within the Management, Business, Science and Arts occupations in Odessa, the most male-oriented occupations are Legal Services & Support (100.0%), Management (86.7%), and Education Instruction & Library (50.0%), while the most female-oriented occupations are Business & Financial (100.0%), Computers, Engineering & Science (100.0%), and Architecture & Engineering (100.0%).
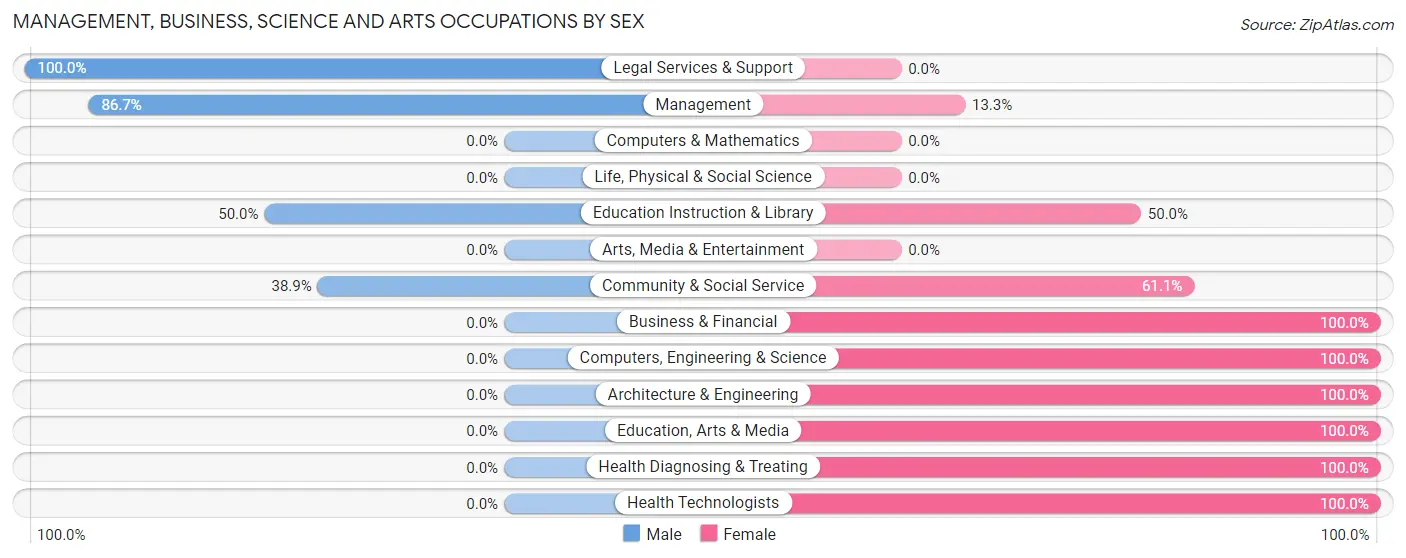
| Occupation | Male | Female |
| Management | 13 (86.7%) | 2 (13.3%) |
| Business & Financial | 0 (0.0%) | 20 (100.0%) |
| Computers, Engineering & Science | 0 (0.0%) | 10 (100.0%) |
| Computers & Mathematics | 0 (0.0%) | 0 (0.0%) |
| Architecture & Engineering | 0 (0.0%) | 10 (100.0%) |
| Life, Physical & Social Science | 0 (0.0%) | 0 (0.0%) |
| Community & Social Service | 14 (38.9%) | 22 (61.1%) |
| Education, Arts & Media | 0 (0.0%) | 14 (100.0%) |
| Legal Services & Support | 6 (100.0%) | 0 (0.0%) |
| Education Instruction & Library | 8 (50.0%) | 8 (50.0%) |
| Arts, Media & Entertainment | 0 (0.0%) | 0 (0.0%) |
| Health Diagnosing & Treating | 0 (0.0%) | 21 (100.0%) |
| Health Technologists | 0 (0.0%) | 16 (100.0%) |
| Total (Category) | 27 (26.5%) | 75 (73.5%) |
| Total (Overall) | 129 (42.2%) | 177 (57.8%) |
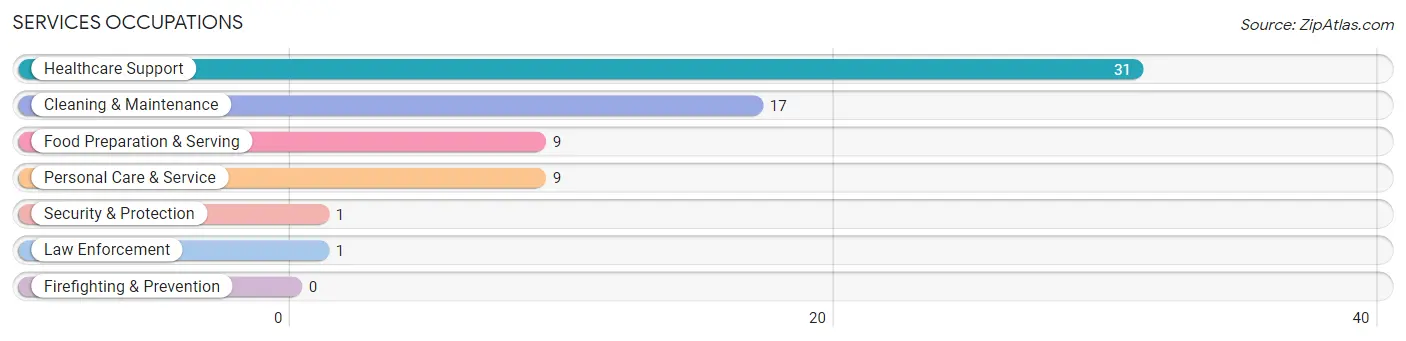
Services Occupations
The most common Services occupations in Odessa are Healthcare Support (31 | 10.1%), Cleaning & Maintenance (17 | 5.6%), Food Preparation & Serving (9 | 2.9%), Personal Care & Service (9 | 2.9%), and Security & Protection (1 | 0.3%).
Services Occupations by Sex
Within the Services occupations in Odessa, the most male-oriented occupations are Security & Protection (100.0%), Law Enforcement (100.0%), and Cleaning & Maintenance (47.1%), while the most female-oriented occupations are Food Preparation & Serving (100.0%), Personal Care & Service (100.0%), and Healthcare Support (77.4%).
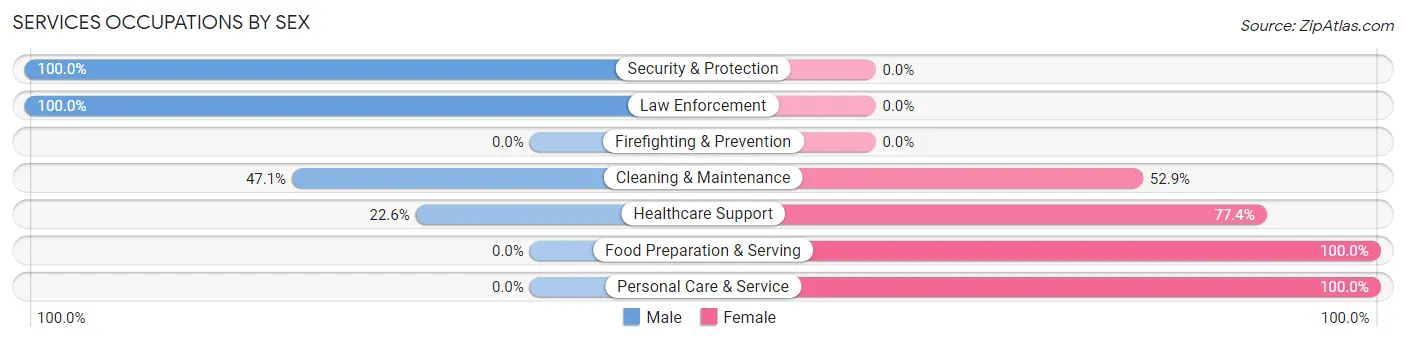
| Occupation | Male | Female |
| Healthcare Support | 7 (22.6%) | 24 (77.4%) |
| Security & Protection | 1 (100.0%) | 0 (0.0%) |
| Firefighting & Prevention | 0 (0.0%) | 0 (0.0%) |
| Law Enforcement | 1 (100.0%) | 0 (0.0%) |
| Food Preparation & Serving | 0 (0.0%) | 9 (100.0%) |
| Cleaning & Maintenance | 8 (47.1%) | 9 (52.9%) |
| Personal Care & Service | 0 (0.0%) | 9 (100.0%) |
| Total (Category) | 16 (23.9%) | 51 (76.1%) |
| Total (Overall) | 129 (42.2%) | 177 (57.8%) |
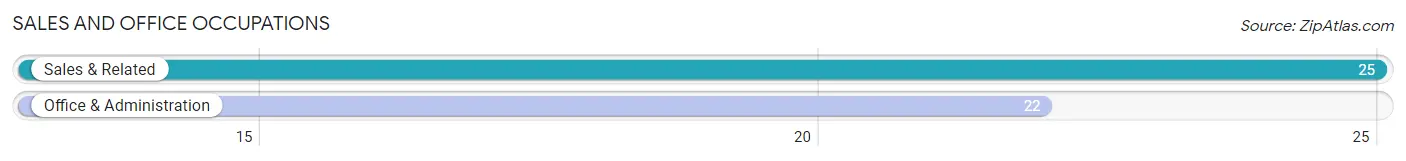
Sales and Office Occupations
The most common Sales and Office occupations in Odessa are Sales & Related (25 | 8.2%), and Office & Administration (22 | 7.2%).
Sales and Office Occupations by Sex
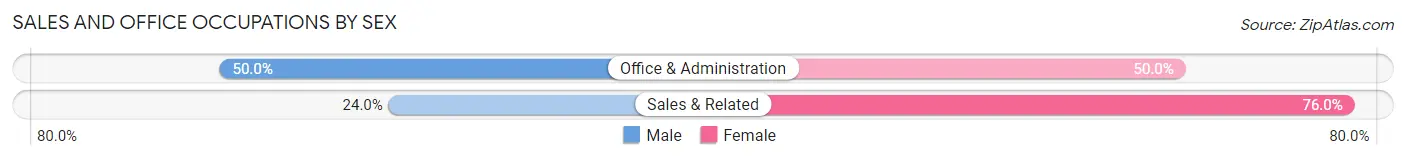
| Occupation | Male | Female |
| Sales & Related | 6 (24.0%) | 19 (76.0%) |
| Office & Administration | 11 (50.0%) | 11 (50.0%) |
| Total (Category) | 17 (36.2%) | 30 (63.8%) |
| Total (Overall) | 129 (42.2%) | 177 (57.8%) |
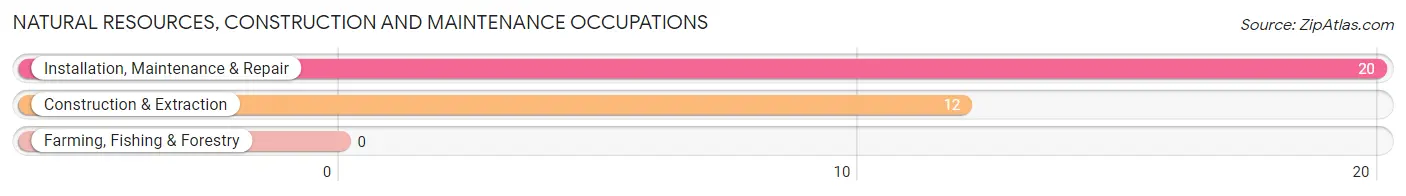
Natural Resources, Construction and Maintenance Occupations
The most common Natural Resources, Construction and Maintenance occupations in Odessa are Installation, Maintenance & Repair (20 | 6.5%), and Construction & Extraction (12 | 3.9%).
Natural Resources, Construction and Maintenance Occupations by Sex
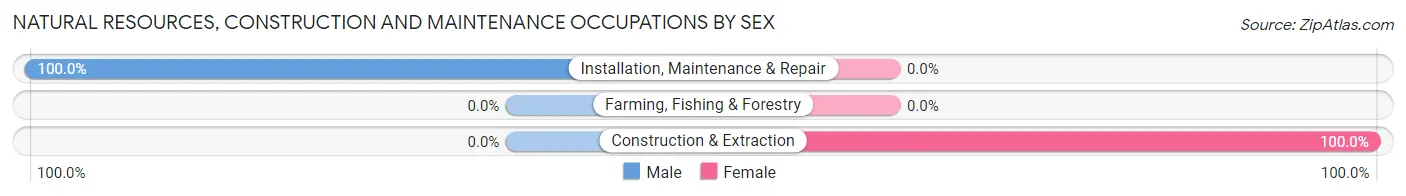
| Occupation | Male | Female |
| Farming, Fishing & Forestry | 0 (0.0%) | 0 (0.0%) |
| Construction & Extraction | 0 (0.0%) | 12 (100.0%) |
| Installation, Maintenance & Repair | 20 (100.0%) | 0 (0.0%) |
| Total (Category) | 20 (62.5%) | 12 (37.5%) |
| Total (Overall) | 129 (42.2%) | 177 (57.8%) |
Production, Transportation and Moving Occupations
The most common Production, Transportation and Moving occupations in Odessa are Production (46 | 15.0%), Transportation (9 | 2.9%), and Material Moving (3 | 1.0%).
Production, Transportation and Moving Occupations by Sex
| Occupation | Male | Female |
| Production | 43 (93.5%) | 3 (6.5%) |
| Transportation | 3 (33.3%) | 6 (66.7%) |
| Material Moving | 3 (100.0%) | 0 (0.0%) |
| Total (Category) | 49 (84.5%) | 9 (15.5%) |
| Total (Overall) | 129 (42.2%) | 177 (57.8%) |
Employment Industries by Sex in Odessa
Employment Industries in Odessa
The major employment industries in Odessa include Health Care & Social Assistance (65 | 21.2%), Manufacturing (43 | 14.1%), Retail Trade (41 | 13.4%), Construction (29 | 9.5%), and Public Administration (28 | 9.1%).
Employment Industries by Sex in Odessa
The Odessa industries that see more men than women are Agriculture, Fishing & Hunting (100.0%), Transportation & Warehousing (100.0%), and Educational Services (100.0%), whereas the industries that tend to have a higher number of women are Information (100.0%), Administrative & Support (100.0%), and Health Care & Social Assistance (100.0%).
| Industry | Male | Female |
| Agriculture, Fishing & Hunting | 9 (100.0%) | 0 (0.0%) |
| Mining, Quarrying, & Extraction | 0 (0.0%) | 0 (0.0%) |
| Construction | 17 (58.6%) | 12 (41.4%) |
| Manufacturing | 40 (93.0%) | 3 (7.0%) |
| Wholesale Trade | 2 (25.0%) | 6 (75.0%) |
| Retail Trade | 22 (53.7%) | 19 (46.3%) |
| Transportation & Warehousing | 3 (100.0%) | 0 (0.0%) |
| Utilities | 9 (47.4%) | 10 (52.6%) |
| Information | 0 (0.0%) | 13 (100.0%) |
| Finance & Insurance | 0 (0.0%) | 0 (0.0%) |
| Real Estate, Rental & Leasing | 0 (0.0%) | 0 (0.0%) |
| Professional & Scientific | 4 (20.0%) | 16 (80.0%) |
| Enterprise Management | 0 (0.0%) | 0 (0.0%) |
| Administrative & Support | 0 (0.0%) | 5 (100.0%) |
| Educational Services | 11 (100.0%) | 0 (0.0%) |
| Health Care & Social Assistance | 0 (0.0%) | 65 (100.0%) |
| Arts, Entertainment & Recreation | 2 (100.0%) | 0 (0.0%) |
| Accommodation & Food Services | 0 (0.0%) | 7 (100.0%) |
| Public Administration | 10 (35.7%) | 18 (64.3%) |
| Total | 129 (42.2%) | 177 (57.8%) |
Education in Odessa
School Enrollment in Odessa
The most common levels of schooling among the 86 students in Odessa are high school (40 | 46.5%), middle school (22 | 25.6%), and elementary school (15 | 17.4%).
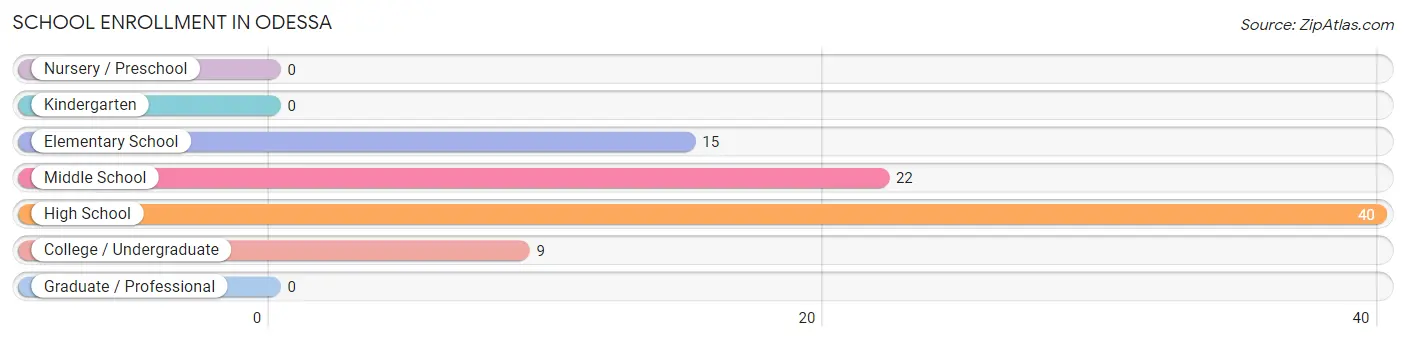
| School Level | # Students | % Students |
| Nursery / Preschool | 0 | 0.0% |
| Kindergarten | 0 | 0.0% |
| Elementary School | 15 | 17.4% |
| Middle School | 22 | 25.6% |
| High School | 40 | 46.5% |
| College / Undergraduate | 9 | 10.5% |
| Graduate / Professional | 0 | 0.0% |
| Total | 86 | 100.0% |
School Enrollment by Age by Funding Source in Odessa
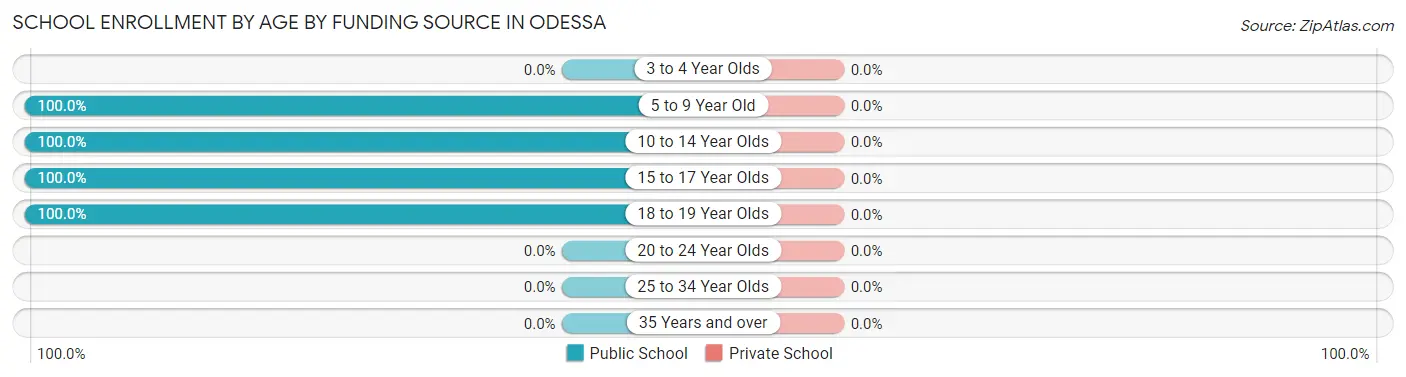
| Age Bracket | Public School | Private School |
| 3 to 4 Year Olds | 0 (0.0%) | 0 (0.0%) |
| 5 to 9 Year Old | 5 (100.0%) | 0 (0.0%) |
| 10 to 14 Year Olds | 48 (100.0%) | 0 (0.0%) |
| 15 to 17 Year Olds | 24 (100.0%) | 0 (0.0%) |
| 18 to 19 Year Olds | 9 (100.0%) | 0 (0.0%) |
| 20 to 24 Year Olds | 0 (0.0%) | 0 (0.0%) |
| 25 to 34 Year Olds | 0 (0.0%) | 0 (0.0%) |
| 35 Years and over | 0 (0.0%) | 0 (0.0%) |
| Total | 86 (100.0%) | 0 (0.0%) |
Educational Attainment by Field of Study in Odessa
Business (26 | 31.3%), science & technology (21 | 25.3%), liberal arts & history (12 | 14.5%), bio, nature & agricultural (8 | 9.6%), and engineering (4 | 4.8%) are the most common fields of study among 83 individuals in Odessa who have obtained a bachelor's degree or higher.
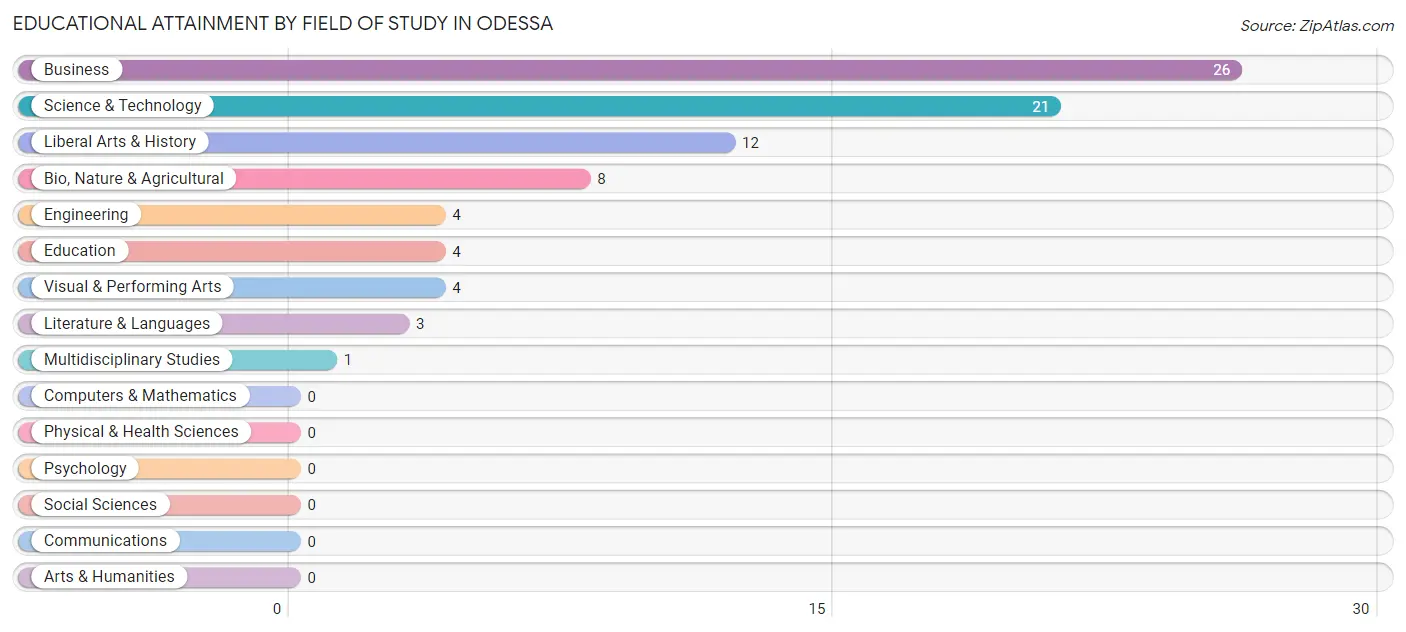
| Field of Study | # Graduates | % Graduates |
| Computers & Mathematics | 0 | 0.0% |
| Bio, Nature & Agricultural | 8 | 9.6% |
| Physical & Health Sciences | 0 | 0.0% |
| Psychology | 0 | 0.0% |
| Social Sciences | 0 | 0.0% |
| Engineering | 4 | 4.8% |
| Multidisciplinary Studies | 1 | 1.2% |
| Science & Technology | 21 | 25.3% |
| Business | 26 | 31.3% |
| Education | 4 | 4.8% |
| Literature & Languages | 3 | 3.6% |
| Liberal Arts & History | 12 | 14.5% |
| Visual & Performing Arts | 4 | 4.8% |
| Communications | 0 | 0.0% |
| Arts & Humanities | 0 | 0.0% |
| Total | 83 | 100.0% |
Transportation & Commute in Odessa
Vehicle Availability by Sex in Odessa
The most prevalent vehicle ownership categories in Odessa are males with 3 vehicles (51, accounting for 39.5%) and females with 3 vehicles (51, making up 28.8%).
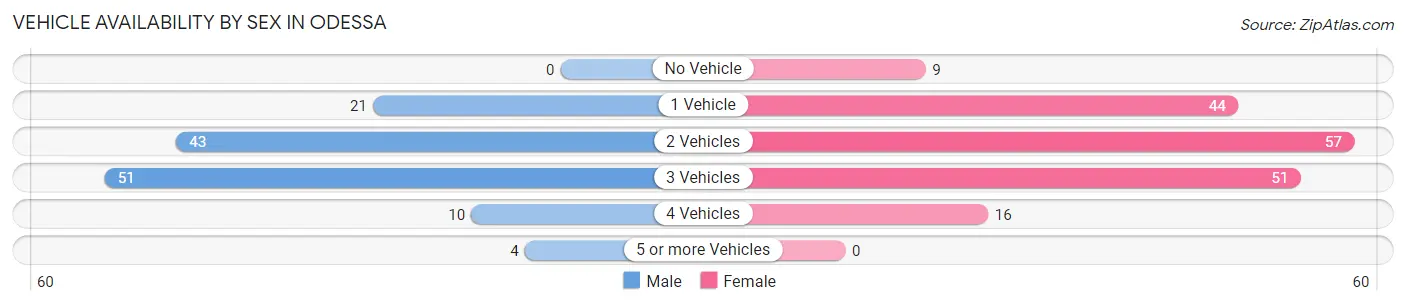
| Vehicles Available | Male | Female |
| No Vehicle | 0 (0.0%) | 9 (5.1%) |
| 1 Vehicle | 21 (16.3%) | 44 (24.9%) |
| 2 Vehicles | 43 (33.3%) | 57 (32.2%) |
| 3 Vehicles | 51 (39.5%) | 51 (28.8%) |
| 4 Vehicles | 10 (7.7%) | 16 (9.0%) |
| 5 or more Vehicles | 4 (3.1%) | 0 (0.0%) |
| Total | 129 (100.0%) | 177 (100.0%) |
Commute Time in Odessa
The most frequently occuring commute durations in Odessa are 5 to 9 minutes (104 commuters, 39.3%), less than 5 minutes (78 commuters, 29.4%), and 45 to 59 minutes (25 commuters, 9.4%).
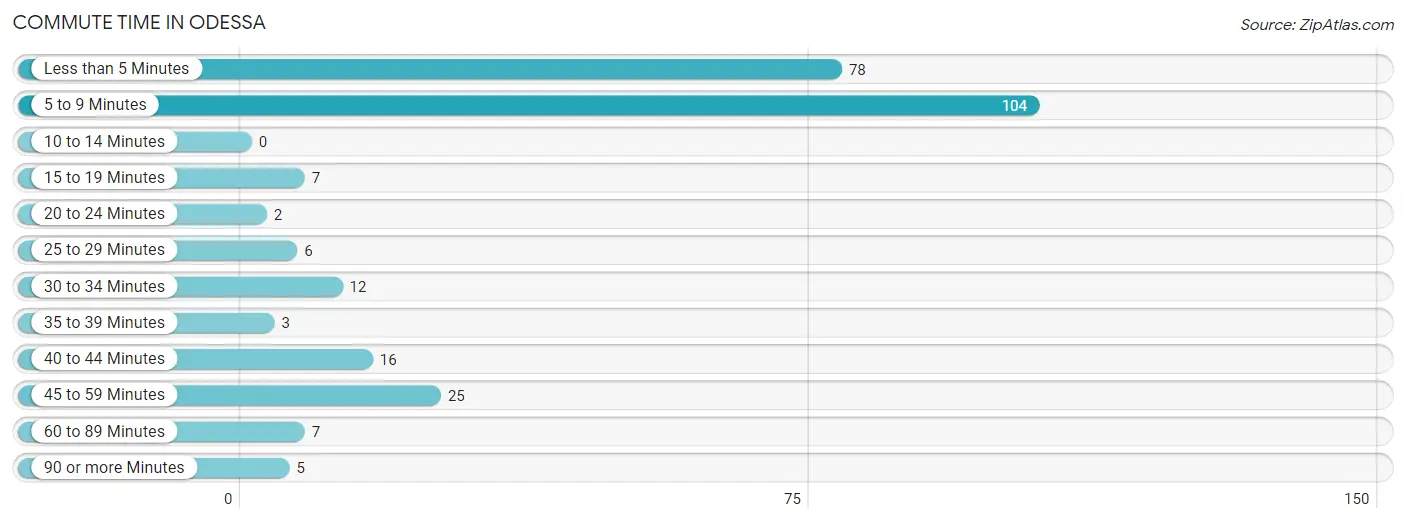
| Commute Time | # Commuters | % Commuters |
| Less than 5 Minutes | 78 | 29.4% |
| 5 to 9 Minutes | 104 | 39.3% |
| 10 to 14 Minutes | 0 | 0.0% |
| 15 to 19 Minutes | 7 | 2.6% |
| 20 to 24 Minutes | 2 | 0.7% |
| 25 to 29 Minutes | 6 | 2.3% |
| 30 to 34 Minutes | 12 | 4.5% |
| 35 to 39 Minutes | 3 | 1.1% |
| 40 to 44 Minutes | 16 | 6.0% |
| 45 to 59 Minutes | 25 | 9.4% |
| 60 to 89 Minutes | 7 | 2.6% |
| 90 or more Minutes | 5 | 1.9% |
Commute Time by Sex in Odessa
The most common commute times in Odessa are 5 to 9 minutes (51 commuters, 51.0%) for males and less than 5 minutes (64 commuters, 38.8%) for females.
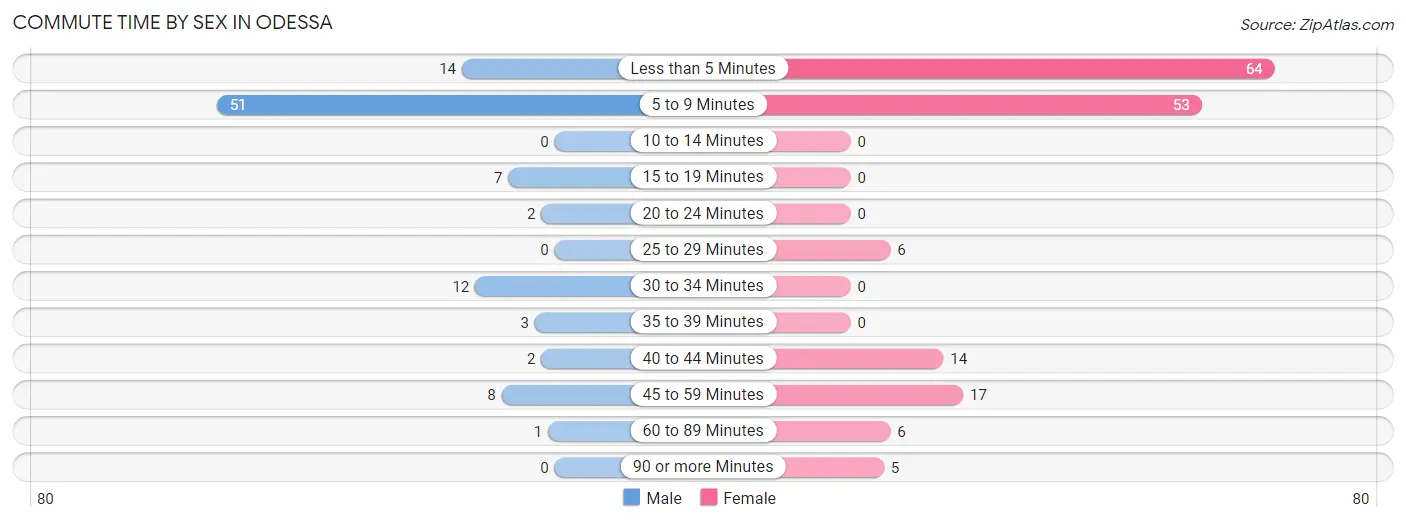
| Commute Time | Male | Female |
| Less than 5 Minutes | 14 (14.0%) | 64 (38.8%) |
| 5 to 9 Minutes | 51 (51.0%) | 53 (32.1%) |
| 10 to 14 Minutes | 0 (0.0%) | 0 (0.0%) |
| 15 to 19 Minutes | 7 (7.0%) | 0 (0.0%) |
| 20 to 24 Minutes | 2 (2.0%) | 0 (0.0%) |
| 25 to 29 Minutes | 0 (0.0%) | 6 (3.6%) |
| 30 to 34 Minutes | 12 (12.0%) | 0 (0.0%) |
| 35 to 39 Minutes | 3 (3.0%) | 0 (0.0%) |
| 40 to 44 Minutes | 2 (2.0%) | 14 (8.5%) |
| 45 to 59 Minutes | 8 (8.0%) | 17 (10.3%) |
| 60 to 89 Minutes | 1 (1.0%) | 6 (3.6%) |
| 90 or more Minutes | 0 (0.0%) | 5 (3.0%) |
Time of Departure to Work by Sex in Odessa
The most frequent times of departure to work in Odessa are 7:00 AM to 7:29 AM (38, 38.0%) for males and 7:30 AM to 7:59 AM (70, 42.4%) for females.
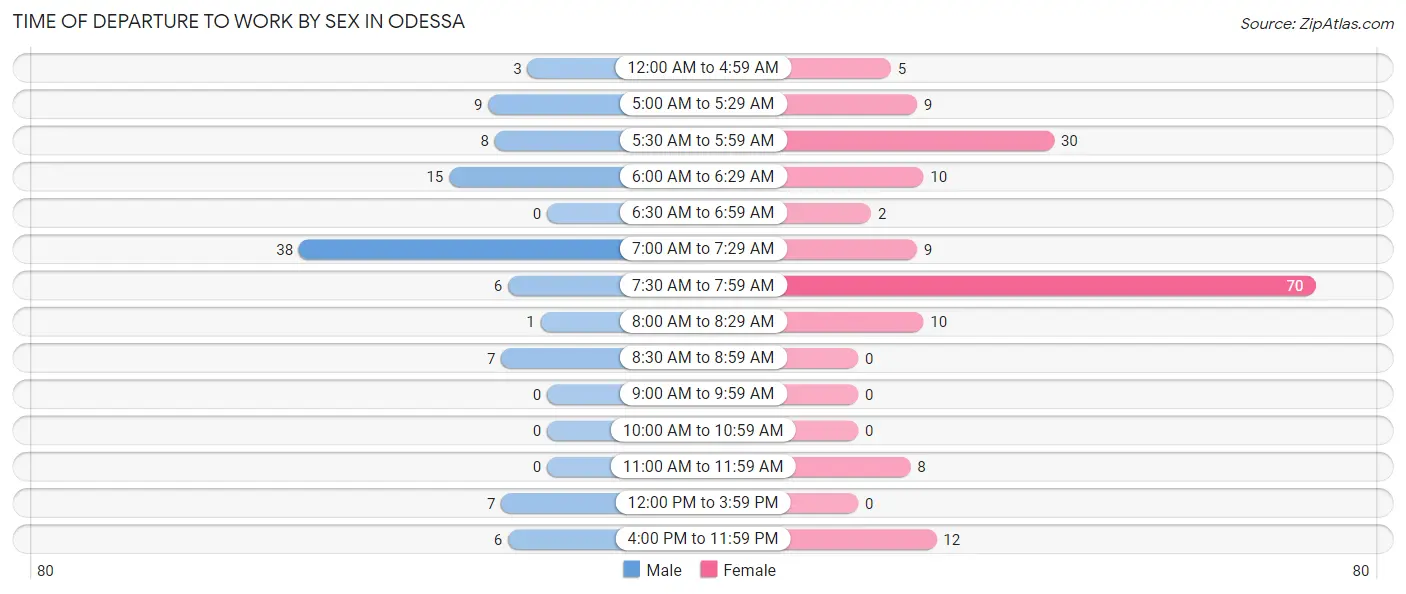
| Time of Departure | Male | Female |
| 12:00 AM to 4:59 AM | 3 (3.0%) | 5 (3.0%) |
| 5:00 AM to 5:29 AM | 9 (9.0%) | 9 (5.4%) |
| 5:30 AM to 5:59 AM | 8 (8.0%) | 30 (18.2%) |
| 6:00 AM to 6:29 AM | 15 (15.0%) | 10 (6.1%) |
| 6:30 AM to 6:59 AM | 0 (0.0%) | 2 (1.2%) |
| 7:00 AM to 7:29 AM | 38 (38.0%) | 9 (5.4%) |
| 7:30 AM to 7:59 AM | 6 (6.0%) | 70 (42.4%) |
| 8:00 AM to 8:29 AM | 1 (1.0%) | 10 (6.1%) |
| 8:30 AM to 8:59 AM | 7 (7.0%) | 0 (0.0%) |
| 9:00 AM to 9:59 AM | 0 (0.0%) | 0 (0.0%) |
| 10:00 AM to 10:59 AM | 0 (0.0%) | 0 (0.0%) |
| 11:00 AM to 11:59 AM | 0 (0.0%) | 8 (4.9%) |
| 12:00 PM to 3:59 PM | 7 (7.0%) | 0 (0.0%) |
| 4:00 PM to 11:59 PM | 6 (6.0%) | 12 (7.3%) |
| Total | 100 (100.0%) | 165 (100.0%) |
Housing Occupancy in Odessa
Occupancy by Ownership in Odessa
Of the total 378 dwellings in Odessa, owner-occupied units account for 277 (73.3%), while renter-occupied units make up 101 (26.7%).
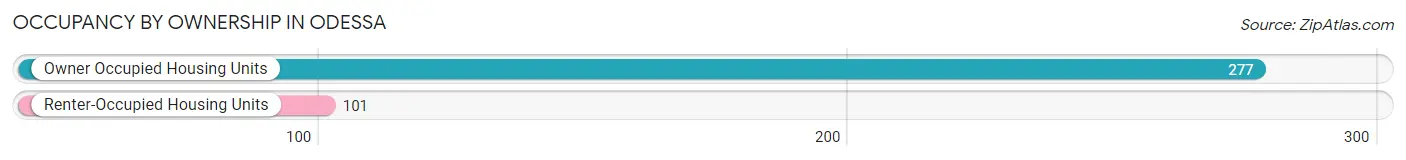
| Occupancy | # Housing Units | % Housing Units |
| Owner Occupied Housing Units | 277 | 73.3% |
| Renter-Occupied Housing Units | 101 | 26.7% |
| Total Occupied Housing Units | 378 | 100.0% |
Occupancy by Household Size in Odessa
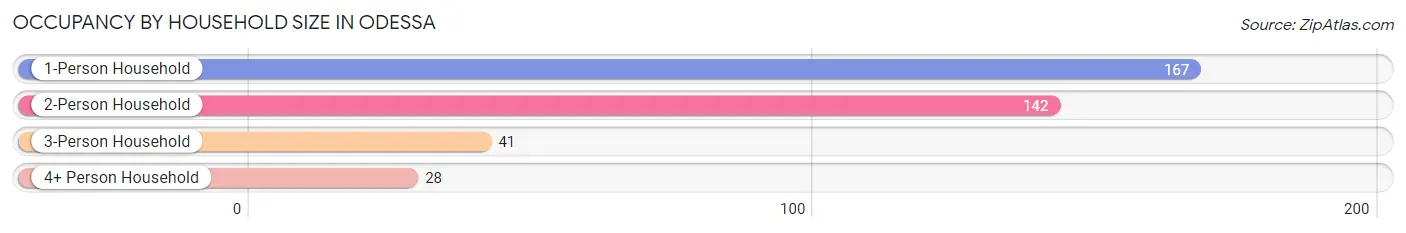
| Household Size | # Housing Units | % Housing Units |
| 1-Person Household | 167 | 44.2% |
| 2-Person Household | 142 | 37.6% |
| 3-Person Household | 41 | 10.8% |
| 4+ Person Household | 28 | 7.4% |
| Total Housing Units | 378 | 100.0% |
Occupancy by Ownership by Household Size in Odessa
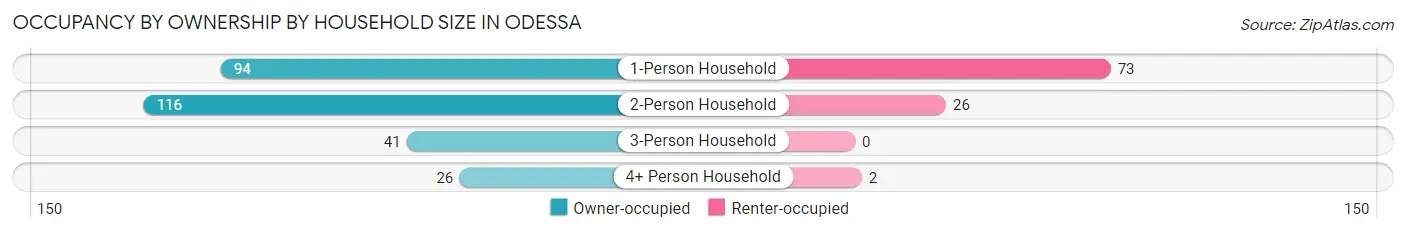
| Household Size | Owner-occupied | Renter-occupied |
| 1-Person Household | 94 (56.3%) | 73 (43.7%) |
| 2-Person Household | 116 (81.7%) | 26 (18.3%) |
| 3-Person Household | 41 (100.0%) | 0 (0.0%) |
| 4+ Person Household | 26 (92.9%) | 2 (7.1%) |
| Total Housing Units | 277 (73.3%) | 101 (26.7%) |
Occupancy by Educational Attainment in Odessa
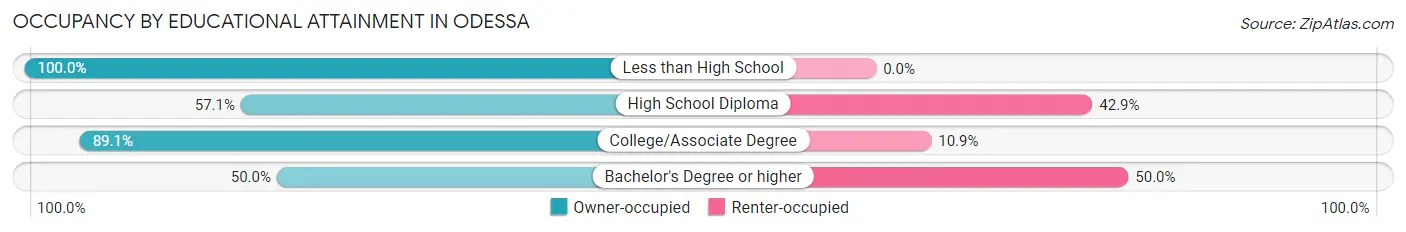
| Household Size | Owner-occupied | Renter-occupied |
| Less than High School | 16 (100.0%) | 0 (0.0%) |
| High School Diploma | 68 (57.1%) | 51 (42.9%) |
| College/Associate Degree | 163 (89.1%) | 20 (10.9%) |
| Bachelor's Degree or higher | 30 (50.0%) | 30 (50.0%) |
Occupancy by Age of Householder in Odessa
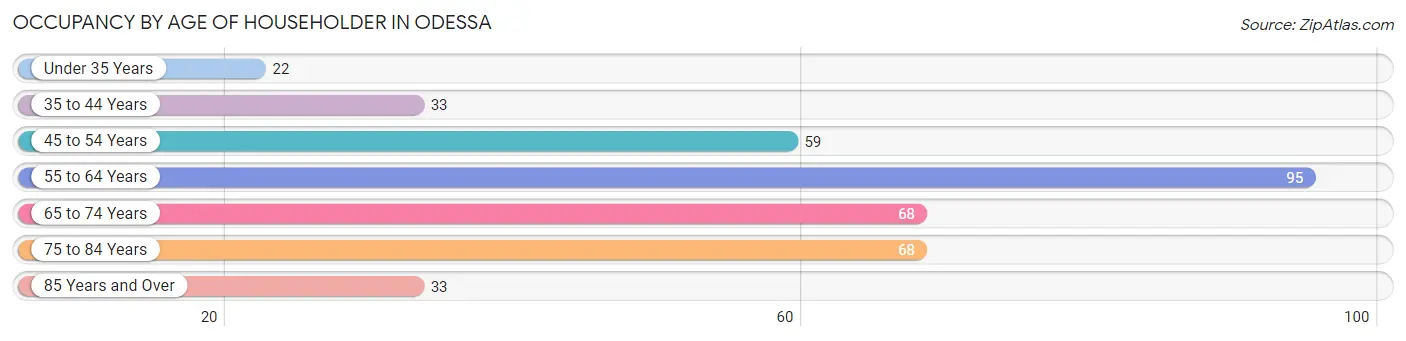
| Age Bracket | # Households | % Households |
| Under 35 Years | 22 | 5.8% |
| 35 to 44 Years | 33 | 8.7% |
| 45 to 54 Years | 59 | 15.6% |
| 55 to 64 Years | 95 | 25.1% |
| 65 to 74 Years | 68 | 18.0% |
| 75 to 84 Years | 68 | 18.0% |
| 85 Years and Over | 33 | 8.7% |
| Total | 378 | 100.0% |
Housing Finances in Odessa
Median Income by Occupancy in Odessa
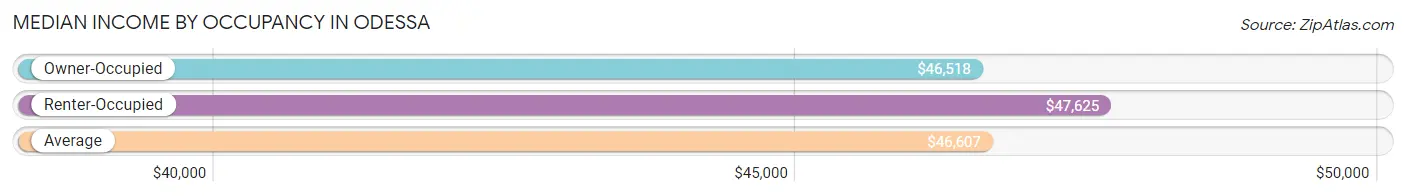
| Occupancy Type | # Households | Median Income |
| Owner-Occupied | 277 (73.3%) | $46,518 |
| Renter-Occupied | 101 (26.7%) | $47,625 |
| Average | 378 (100.0%) | $46,607 |
Occupancy by Householder Income Bracket in Odessa
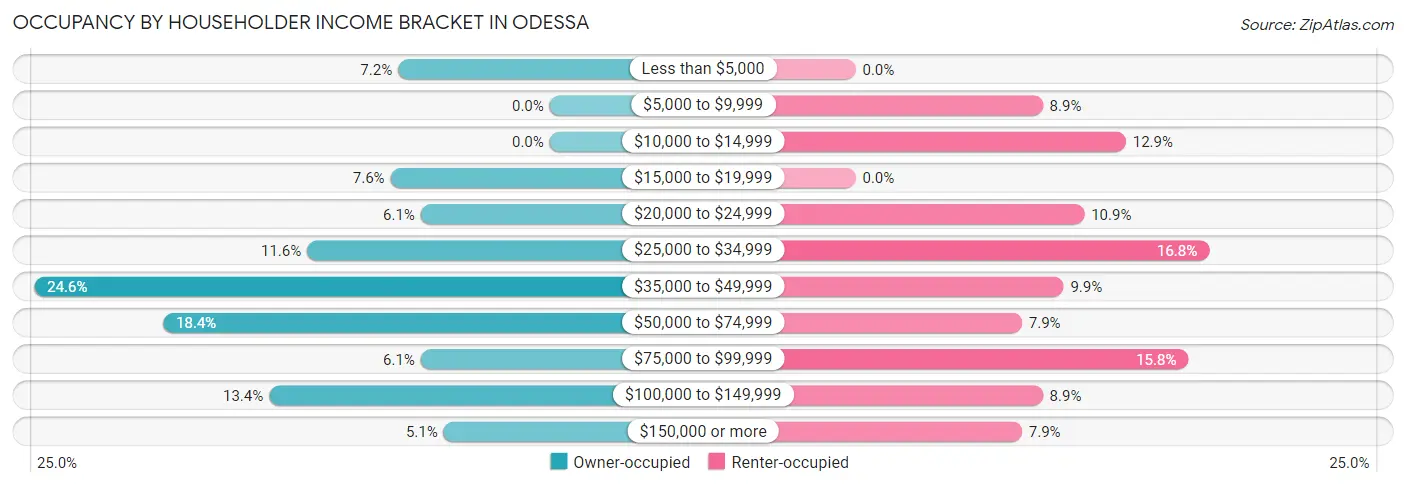
| Income Bracket | Owner-occupied | Renter-occupied |
| Less than $5,000 | 20 (7.2%) | 0 (0.0%) |
| $5,000 to $9,999 | 0 (0.0%) | 9 (8.9%) |
| $10,000 to $14,999 | 0 (0.0%) | 13 (12.9%) |
| $15,000 to $19,999 | 21 (7.6%) | 0 (0.0%) |
| $20,000 to $24,999 | 17 (6.1%) | 11 (10.9%) |
| $25,000 to $34,999 | 32 (11.6%) | 17 (16.8%) |
| $35,000 to $49,999 | 68 (24.5%) | 10 (9.9%) |
| $50,000 to $74,999 | 51 (18.4%) | 8 (7.9%) |
| $75,000 to $99,999 | 17 (6.1%) | 16 (15.8%) |
| $100,000 to $149,999 | 37 (13.4%) | 9 (8.9%) |
| $150,000 or more | 14 (5.1%) | 8 (7.9%) |
| Total | 277 (100.0%) | 101 (100.0%) |
Monthly Housing Cost Tiers in Odessa
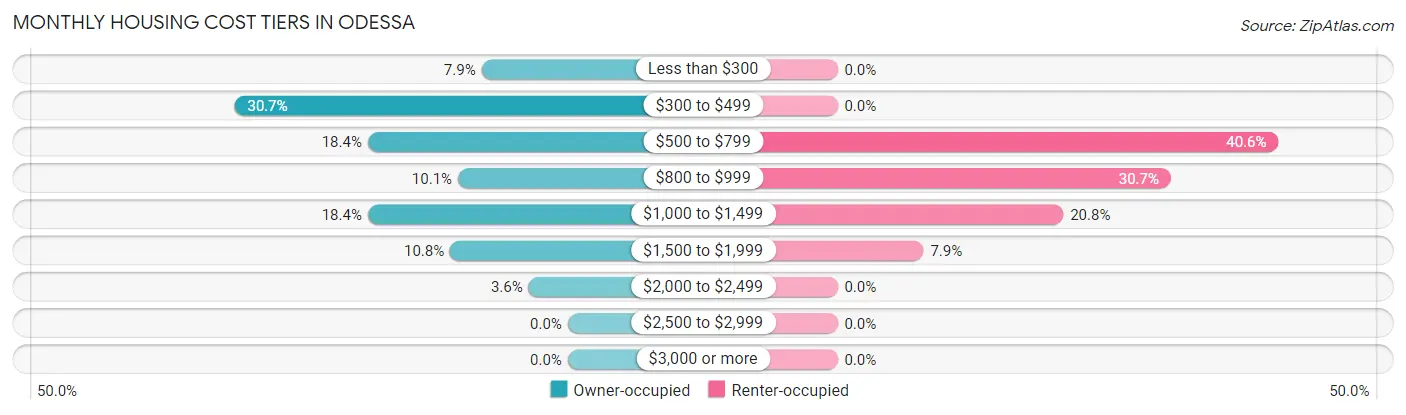
| Monthly Cost | Owner-occupied | Renter-occupied |
| Less than $300 | 22 (7.9%) | 0 (0.0%) |
| $300 to $499 | 85 (30.7%) | 0 (0.0%) |
| $500 to $799 | 51 (18.4%) | 41 (40.6%) |
| $800 to $999 | 28 (10.1%) | 31 (30.7%) |
| $1,000 to $1,499 | 51 (18.4%) | 21 (20.8%) |
| $1,500 to $1,999 | 30 (10.8%) | 8 (7.9%) |
| $2,000 to $2,499 | 10 (3.6%) | 0 (0.0%) |
| $2,500 to $2,999 | 0 (0.0%) | 0 (0.0%) |
| $3,000 or more | 0 (0.0%) | 0 (0.0%) |
| Total | 277 (100.0%) | 101 (100.0%) |
Physical Housing Characteristics in Odessa
Housing Structures in Odessa
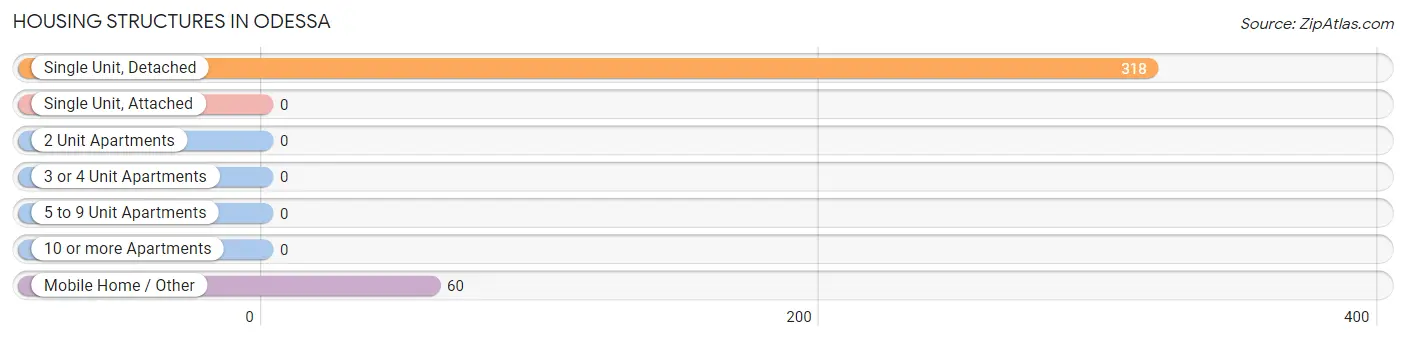
| Structure Type | # Housing Units | % Housing Units |
| Single Unit, Detached | 318 | 84.1% |
| Single Unit, Attached | 0 | 0.0% |
| 2 Unit Apartments | 0 | 0.0% |
| 3 or 4 Unit Apartments | 0 | 0.0% |
| 5 to 9 Unit Apartments | 0 | 0.0% |
| 10 or more Apartments | 0 | 0.0% |
| Mobile Home / Other | 60 | 15.9% |
| Total | 378 | 100.0% |
Housing Structures by Occupancy in Odessa
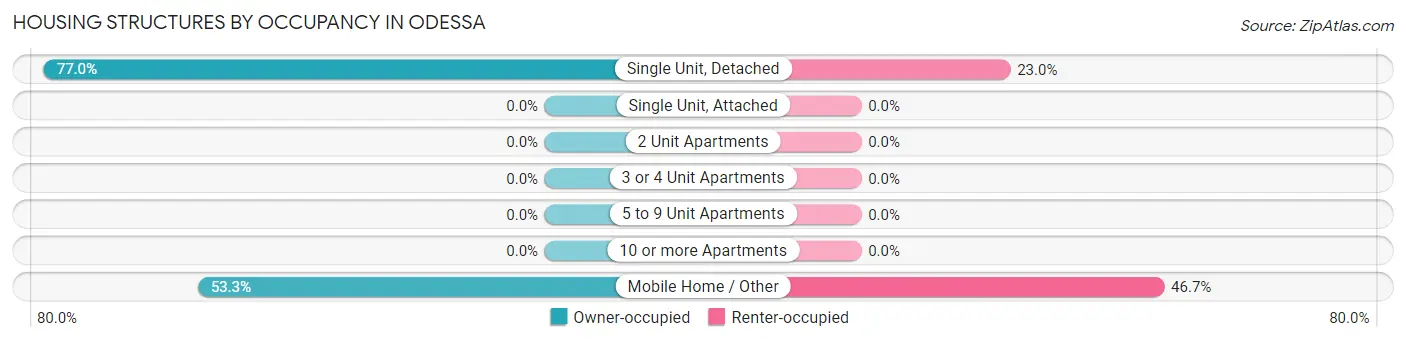
| Structure Type | Owner-occupied | Renter-occupied |
| Single Unit, Detached | 245 (77.0%) | 73 (23.0%) |
| Single Unit, Attached | 0 (0.0%) | 0 (0.0%) |
| 2 Unit Apartments | 0 (0.0%) | 0 (0.0%) |
| 3 or 4 Unit Apartments | 0 (0.0%) | 0 (0.0%) |
| 5 to 9 Unit Apartments | 0 (0.0%) | 0 (0.0%) |
| 10 or more Apartments | 0 (0.0%) | 0 (0.0%) |
| Mobile Home / Other | 32 (53.3%) | 28 (46.7%) |
| Total | 277 (73.3%) | 101 (26.7%) |
Housing Structures by Number of Rooms in Odessa
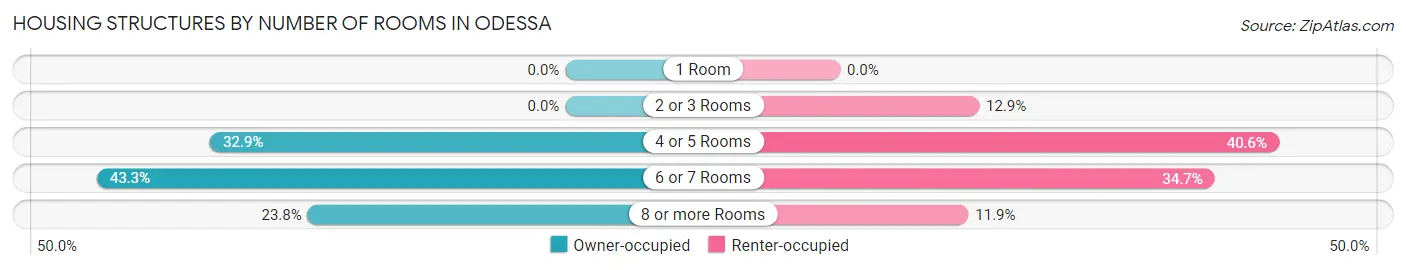
| Number of Rooms | Owner-occupied | Renter-occupied |
| 1 Room | 0 (0.0%) | 0 (0.0%) |
| 2 or 3 Rooms | 0 (0.0%) | 13 (12.9%) |
| 4 or 5 Rooms | 91 (32.9%) | 41 (40.6%) |
| 6 or 7 Rooms | 120 (43.3%) | 35 (34.6%) |
| 8 or more Rooms | 66 (23.8%) | 12 (11.9%) |
| Total | 277 (100.0%) | 101 (100.0%) |
Housing Structure by Heating Type in Odessa
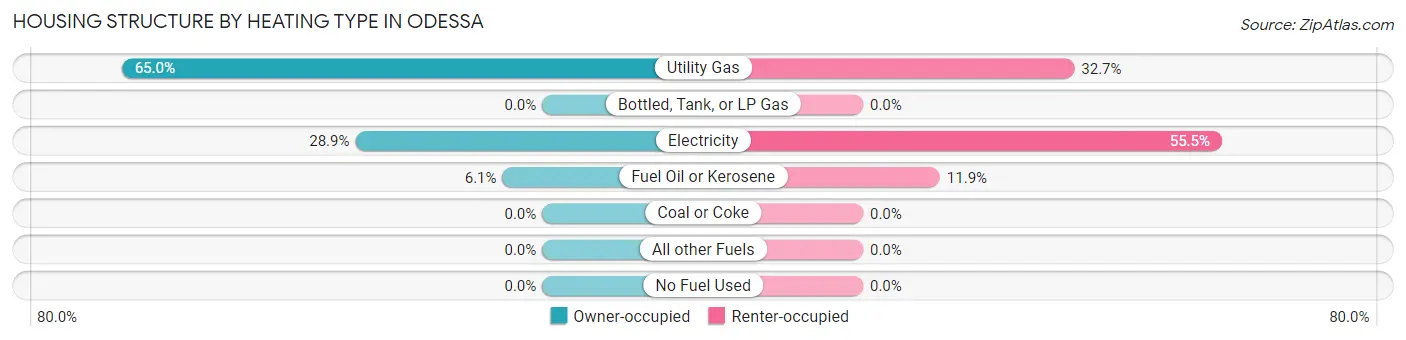
| Heating Type | Owner-occupied | Renter-occupied |
| Utility Gas | 180 (65.0%) | 33 (32.7%) |
| Bottled, Tank, or LP Gas | 0 (0.0%) | 0 (0.0%) |
| Electricity | 80 (28.9%) | 56 (55.4%) |
| Fuel Oil or Kerosene | 17 (6.1%) | 12 (11.9%) |
| Coal or Coke | 0 (0.0%) | 0 (0.0%) |
| All other Fuels | 0 (0.0%) | 0 (0.0%) |
| No Fuel Used | 0 (0.0%) | 0 (0.0%) |
| Total | 277 (100.0%) | 101 (100.0%) |
Household Vehicle Usage in Odessa
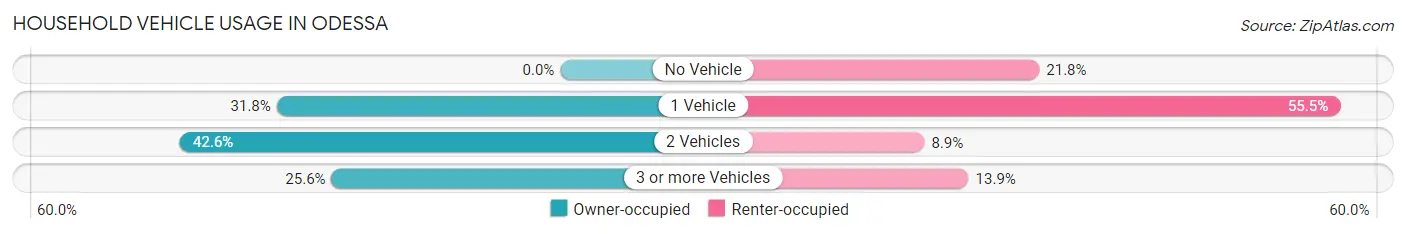
| Vehicles per Household | Owner-occupied | Renter-occupied |
| No Vehicle | 0 (0.0%) | 22 (21.8%) |
| 1 Vehicle | 88 (31.8%) | 56 (55.4%) |
| 2 Vehicles | 118 (42.6%) | 9 (8.9%) |
| 3 or more Vehicles | 71 (25.6%) | 14 (13.9%) |
| Total | 277 (100.0%) | 101 (100.0%) |
Real Estate & Mortgages in Odessa
Real Estate and Mortgage Overview in Odessa
| Characteristic | Without Mortgage | With Mortgage |
| Housing Units | 150 | 127 |
| Median Property Value | $94,400 | $161,500 |
| Median Household Income | $40,294 | $14 |
| Monthly Housing Costs | $417 | $0 |
| Real Estate Taxes | $843 | $14 |
Property Value by Mortgage Status in Odessa
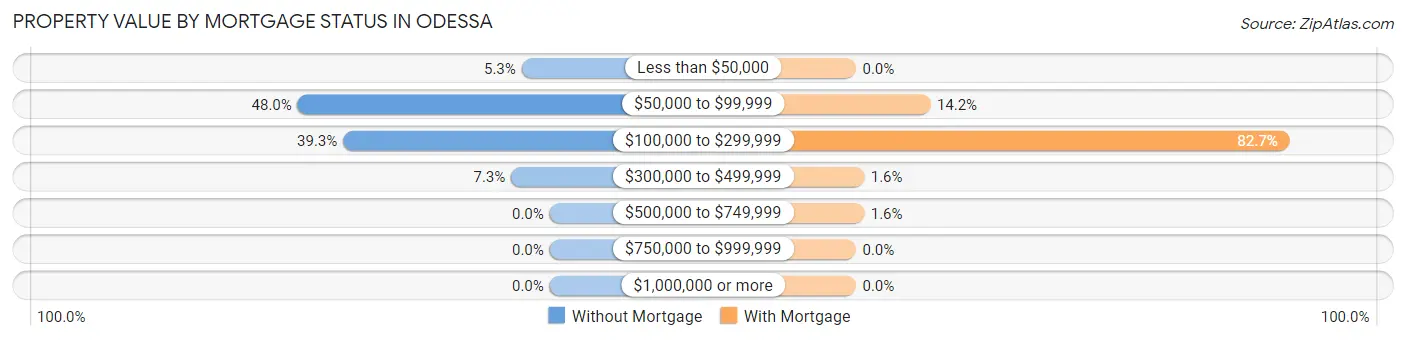
| Property Value | Without Mortgage | With Mortgage |
| Less than $50,000 | 8 (5.3%) | 0 (0.0%) |
| $50,000 to $99,999 | 72 (48.0%) | 18 (14.2%) |
| $100,000 to $299,999 | 59 (39.3%) | 105 (82.7%) |
| $300,000 to $499,999 | 11 (7.3%) | 2 (1.6%) |
| $500,000 to $749,999 | 0 (0.0%) | 2 (1.6%) |
| $750,000 to $999,999 | 0 (0.0%) | 0 (0.0%) |
| $1,000,000 or more | 0 (0.0%) | 0 (0.0%) |
| Total | 150 (100.0%) | 127 (100.0%) |
Household Income by Mortgage Status in Odessa
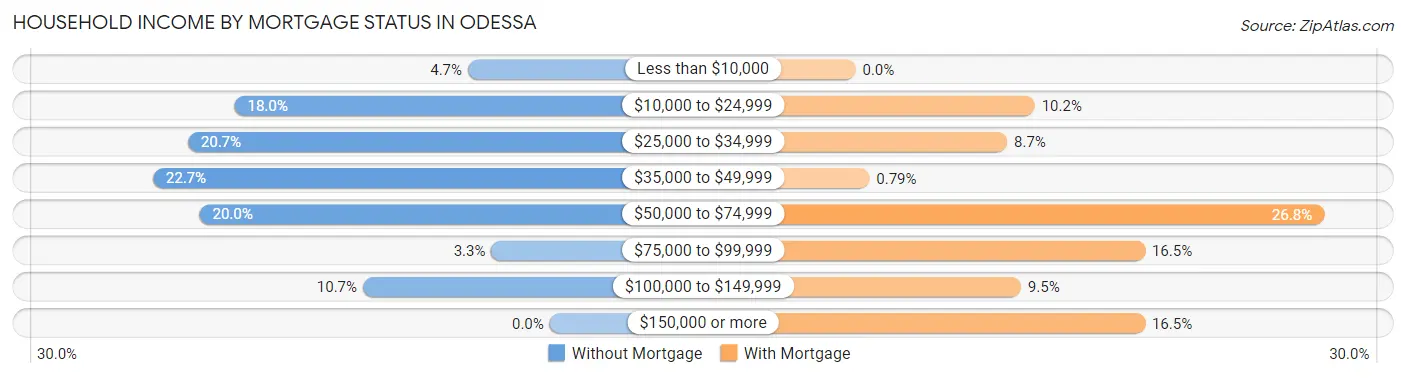
| Household Income | Without Mortgage | With Mortgage |
| Less than $10,000 | 7 (4.7%) | 0 (0.0%) |
| $10,000 to $24,999 | 27 (18.0%) | 13 (10.2%) |
| $25,000 to $34,999 | 31 (20.7%) | 11 (8.7%) |
| $35,000 to $49,999 | 34 (22.7%) | 1 (0.8%) |
| $50,000 to $74,999 | 30 (20.0%) | 34 (26.8%) |
| $75,000 to $99,999 | 5 (3.3%) | 21 (16.5%) |
| $100,000 to $149,999 | 16 (10.7%) | 12 (9.5%) |
| $150,000 or more | 0 (0.0%) | 21 (16.5%) |
| Total | 150 (100.0%) | 127 (100.0%) |
Property Value to Household Income Ratio in Odessa
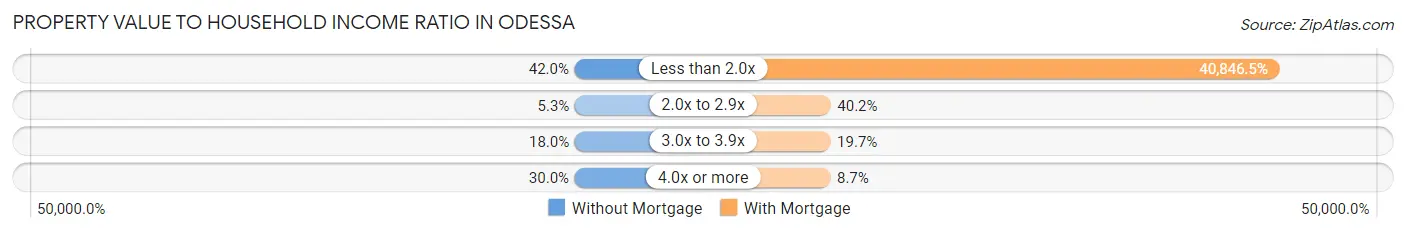
| Value-to-Income Ratio | Without Mortgage | With Mortgage |
| Less than 2.0x | 63 (42.0%) | 51,875 (40,846.5%) |
| 2.0x to 2.9x | 8 (5.3%) | 51 (40.2%) |
| 3.0x to 3.9x | 27 (18.0%) | 25 (19.7%) |
| 4.0x or more | 45 (30.0%) | 11 (8.7%) |
| Total | 150 (100.0%) | 127 (100.0%) |
Real Estate Taxes by Mortgage Status in Odessa
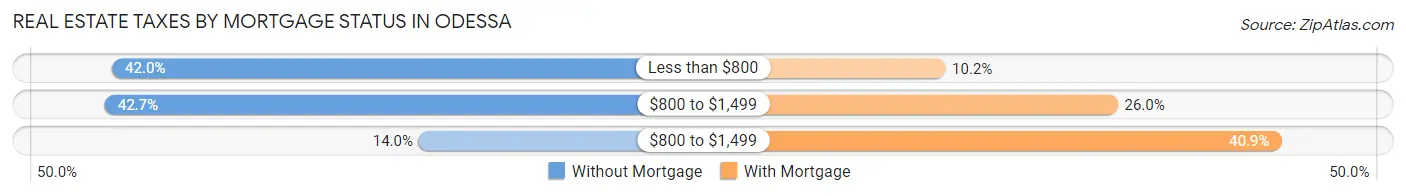
| Property Taxes | Without Mortgage | With Mortgage |
| Less than $800 | 63 (42.0%) | 13 (10.2%) |
| $800 to $1,499 | 64 (42.7%) | 33 (26.0%) |
| $800 to $1,499 | 21 (14.0%) | 52 (40.9%) |
| Total | 150 (100.0%) | 127 (100.0%) |
Health & Disability in Odessa
Health Insurance Coverage by Age in Odessa
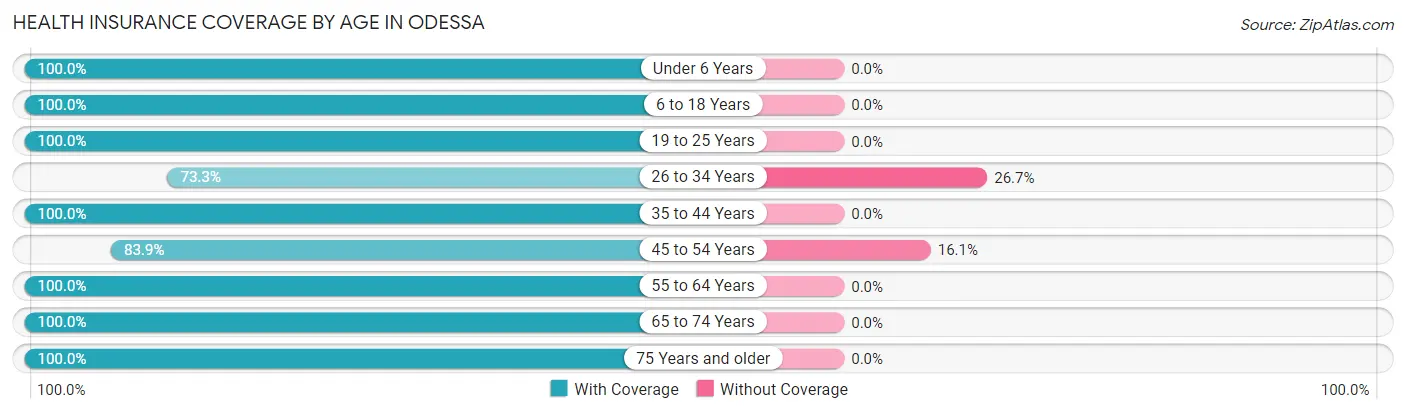
| Age Bracket | With Coverage | Without Coverage |
| Under 6 Years | 5 (100.0%) | 0 (0.0%) |
| 6 to 18 Years | 77 (100.0%) | 0 (0.0%) |
| 19 to 25 Years | 42 (100.0%) | 0 (0.0%) |
| 26 to 34 Years | 55 (73.3%) | 20 (26.7%) |
| 35 to 44 Years | 43 (100.0%) | 0 (0.0%) |
| 45 to 54 Years | 78 (83.9%) | 15 (16.1%) |
| 55 to 64 Years | 154 (100.0%) | 0 (0.0%) |
| 65 to 74 Years | 101 (100.0%) | 0 (0.0%) |
| 75 Years and older | 134 (100.0%) | 0 (0.0%) |
| Total | 689 (95.2%) | 35 (4.8%) |
Health Insurance Coverage by Citizenship Status in Odessa
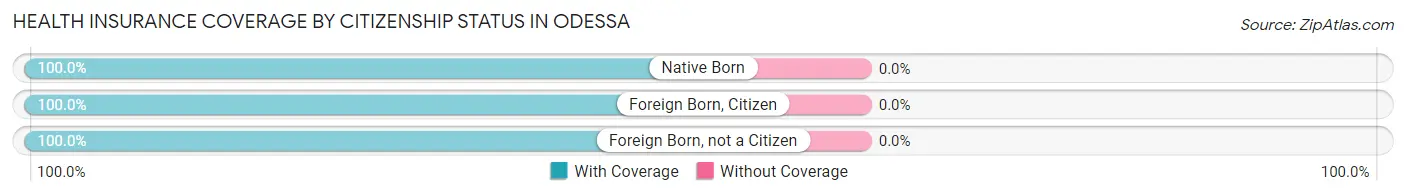
| Citizenship Status | With Coverage | Without Coverage |
| Native Born | 5 (100.0%) | 0 (0.0%) |
| Foreign Born, Citizen | 77 (100.0%) | 0 (0.0%) |
| Foreign Born, not a Citizen | 42 (100.0%) | 0 (0.0%) |
Health Insurance Coverage by Household Income in Odessa
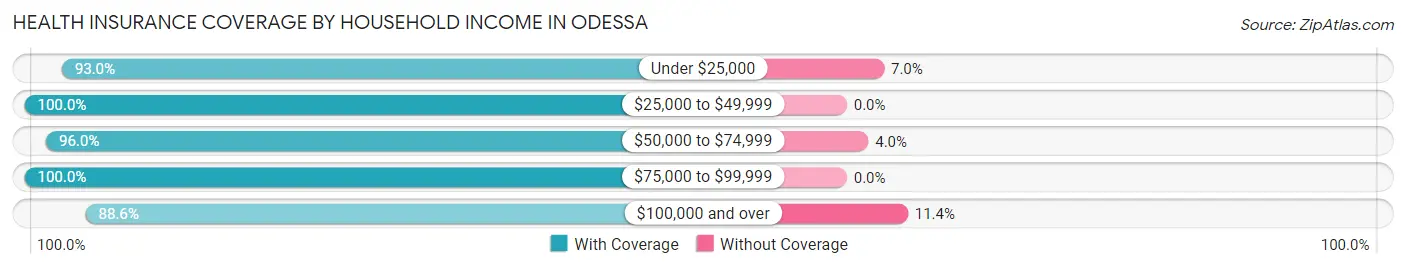
| Household Income | With Coverage | Without Coverage |
| Under $25,000 | 120 (93.0%) | 9 (7.0%) |
| $25,000 to $49,999 | 211 (100.0%) | 0 (0.0%) |
| $50,000 to $74,999 | 143 (96.0%) | 6 (4.0%) |
| $75,000 to $99,999 | 60 (100.0%) | 0 (0.0%) |
| $100,000 and over | 155 (88.6%) | 20 (11.4%) |
Public vs Private Health Insurance Coverage by Age in Odessa
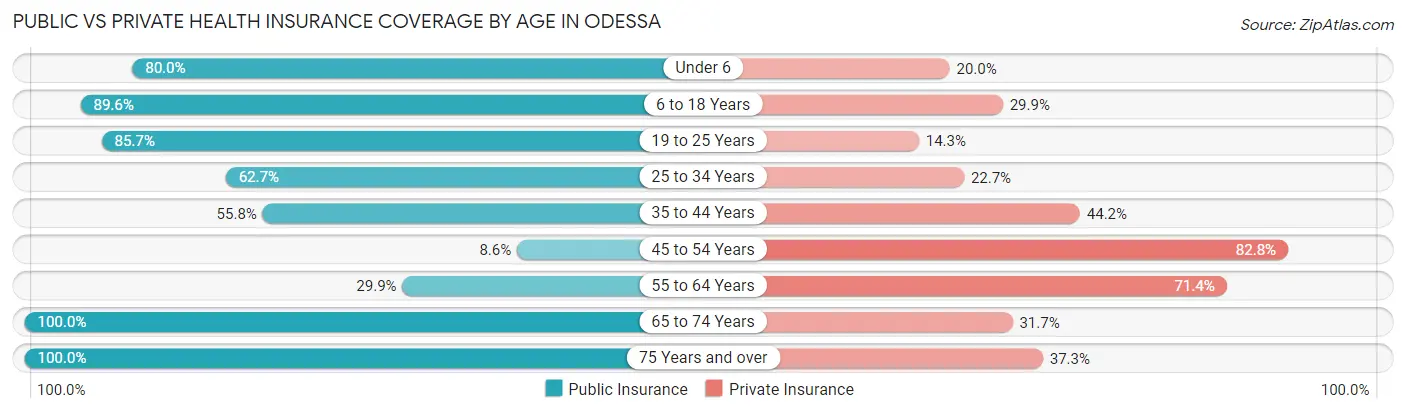
| Age Bracket | Public Insurance | Private Insurance |
| Under 6 | 4 (80.0%) | 1 (20.0%) |
| 6 to 18 Years | 69 (89.6%) | 23 (29.9%) |
| 19 to 25 Years | 36 (85.7%) | 6 (14.3%) |
| 25 to 34 Years | 47 (62.7%) | 17 (22.7%) |
| 35 to 44 Years | 24 (55.8%) | 19 (44.2%) |
| 45 to 54 Years | 8 (8.6%) | 77 (82.8%) |
| 55 to 64 Years | 46 (29.9%) | 110 (71.4%) |
| 65 to 74 Years | 101 (100.0%) | 32 (31.7%) |
| 75 Years and over | 134 (100.0%) | 50 (37.3%) |
| Total | 469 (64.8%) | 335 (46.3%) |
Disability Status by Sex by Age in Odessa
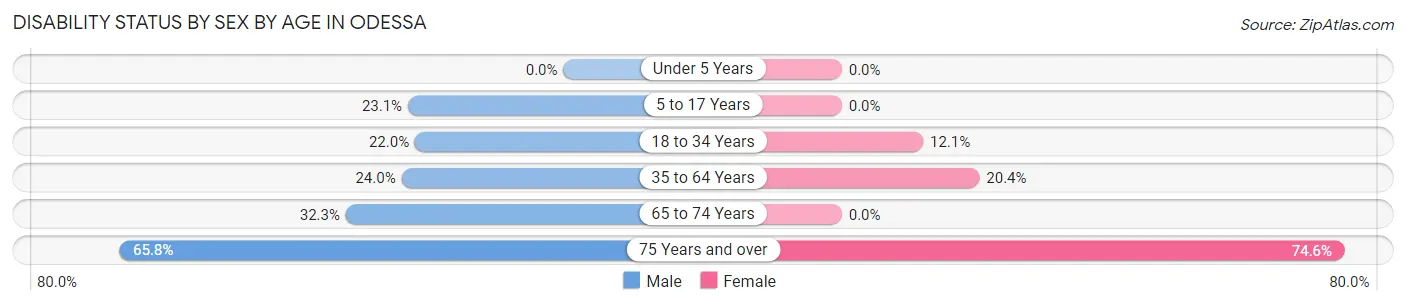
| Age Bracket | Male | Female |
| Under 5 Years | 0 (0.0%) | 0 (0.0%) |
| 5 to 17 Years | 9 (23.1%) | 0 (0.0%) |
| 18 to 34 Years | 13 (22.0%) | 7 (12.1%) |
| 35 to 64 Years | 25 (24.0%) | 38 (20.4%) |
| 65 to 74 Years | 21 (32.3%) | 0 (0.0%) |
| 75 Years and over | 52 (65.8%) | 41 (74.6%) |
Disability Class by Sex by Age in Odessa
Disability Class: Hearing Difficulty
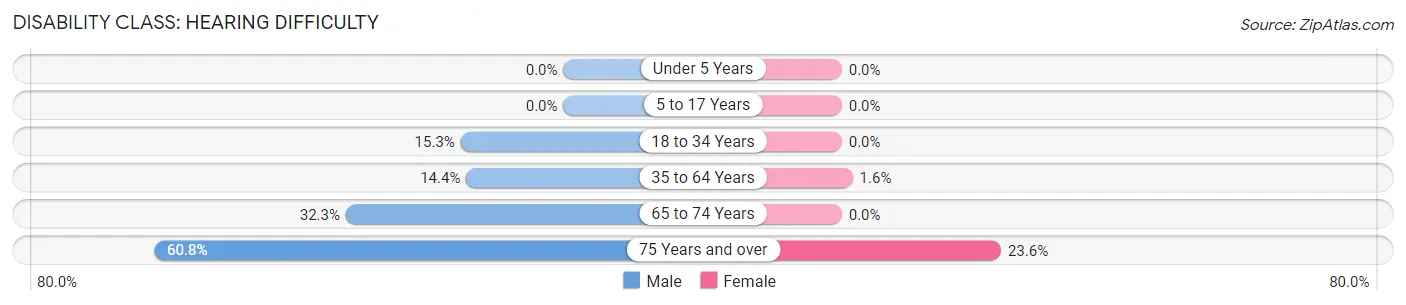
| Age Bracket | Male | Female |
| Under 5 Years | 0 (0.0%) | 0 (0.0%) |
| 5 to 17 Years | 0 (0.0%) | 0 (0.0%) |
| 18 to 34 Years | 9 (15.2%) | 0 (0.0%) |
| 35 to 64 Years | 15 (14.4%) | 3 (1.6%) |
| 65 to 74 Years | 21 (32.3%) | 0 (0.0%) |
| 75 Years and over | 48 (60.8%) | 13 (23.6%) |
Disability Class: Vision Difficulty
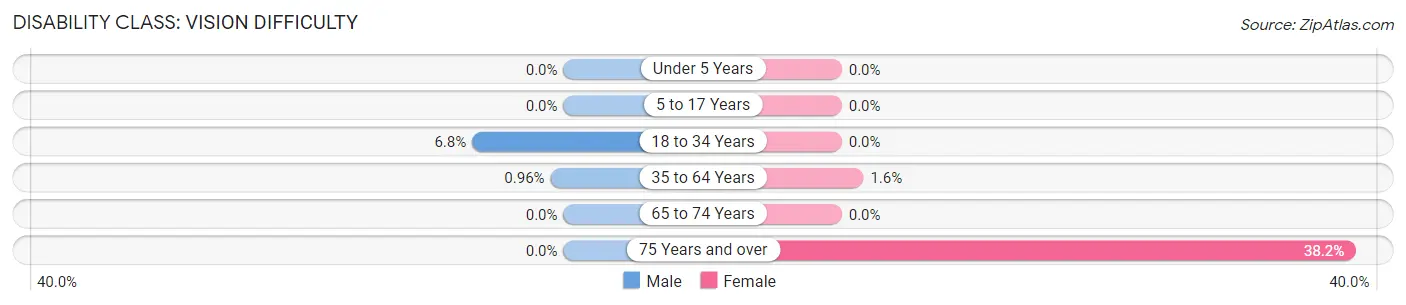
| Age Bracket | Male | Female |
| Under 5 Years | 0 (0.0%) | 0 (0.0%) |
| 5 to 17 Years | 0 (0.0%) | 0 (0.0%) |
| 18 to 34 Years | 4 (6.8%) | 0 (0.0%) |
| 35 to 64 Years | 1 (1.0%) | 3 (1.6%) |
| 65 to 74 Years | 0 (0.0%) | 0 (0.0%) |
| 75 Years and over | 0 (0.0%) | 21 (38.2%) |
Disability Class: Cognitive Difficulty
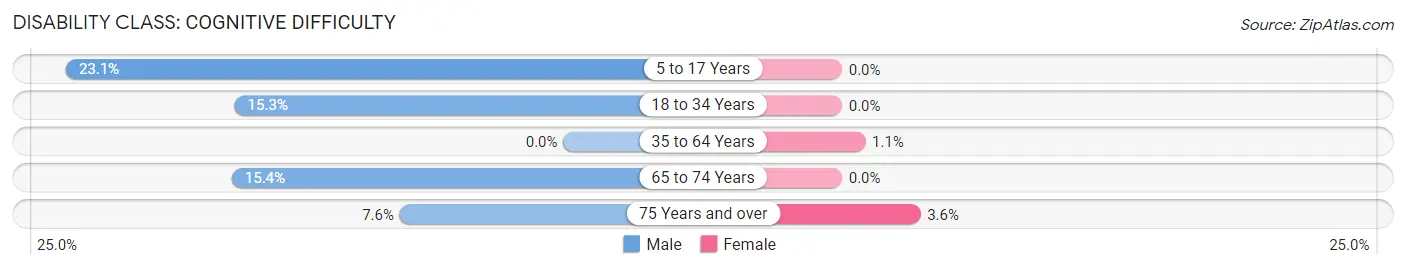
| Age Bracket | Male | Female |
| 5 to 17 Years | 9 (23.1%) | 0 (0.0%) |
| 18 to 34 Years | 9 (15.2%) | 0 (0.0%) |
| 35 to 64 Years | 0 (0.0%) | 2 (1.1%) |
| 65 to 74 Years | 10 (15.4%) | 0 (0.0%) |
| 75 Years and over | 6 (7.6%) | 2 (3.6%) |
Disability Class: Ambulatory Difficulty
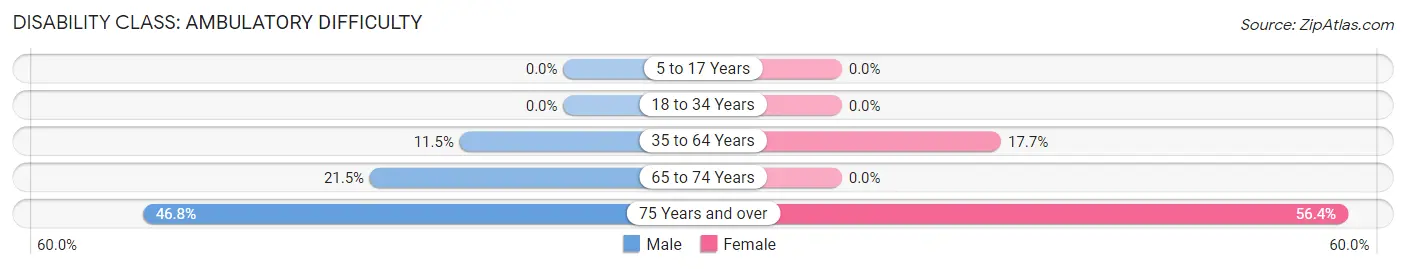
| Age Bracket | Male | Female |
| 5 to 17 Years | 0 (0.0%) | 0 (0.0%) |
| 18 to 34 Years | 0 (0.0%) | 0 (0.0%) |
| 35 to 64 Years | 12 (11.5%) | 33 (17.7%) |
| 65 to 74 Years | 14 (21.5%) | 0 (0.0%) |
| 75 Years and over | 37 (46.8%) | 31 (56.4%) |
Disability Class: Self-Care Difficulty
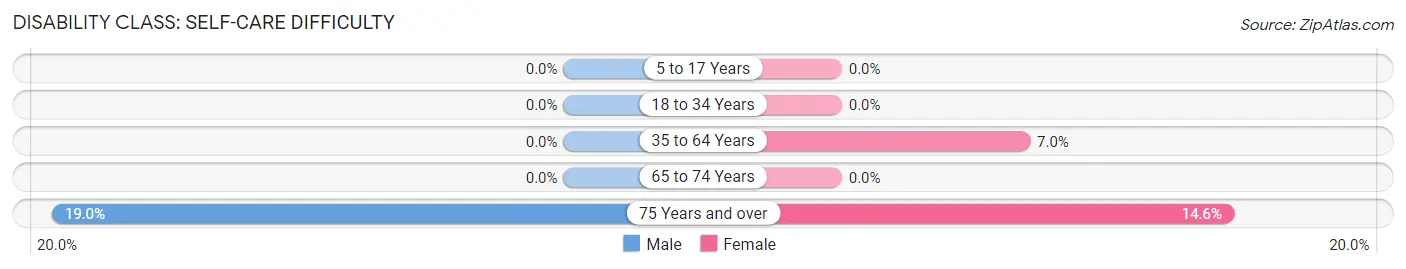
| Age Bracket | Male | Female |
| 5 to 17 Years | 0 (0.0%) | 0 (0.0%) |
| 18 to 34 Years | 0 (0.0%) | 0 (0.0%) |
| 35 to 64 Years | 0 (0.0%) | 13 (7.0%) |
| 65 to 74 Years | 0 (0.0%) | 0 (0.0%) |
| 75 Years and over | 15 (19.0%) | 8 (14.5%) |
Technology Access in Odessa
Computing Device Access in Odessa
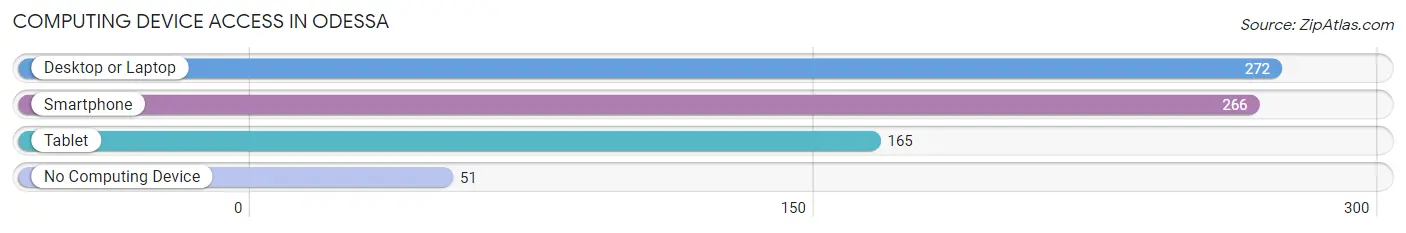
| Device Type | # Households | % Households |
| Desktop or Laptop | 272 | 72.0% |
| Smartphone | 266 | 70.4% |
| Tablet | 165 | 43.6% |
| No Computing Device | 51 | 13.5% |
| Total | 378 | 100.0% |
Internet Access in Odessa
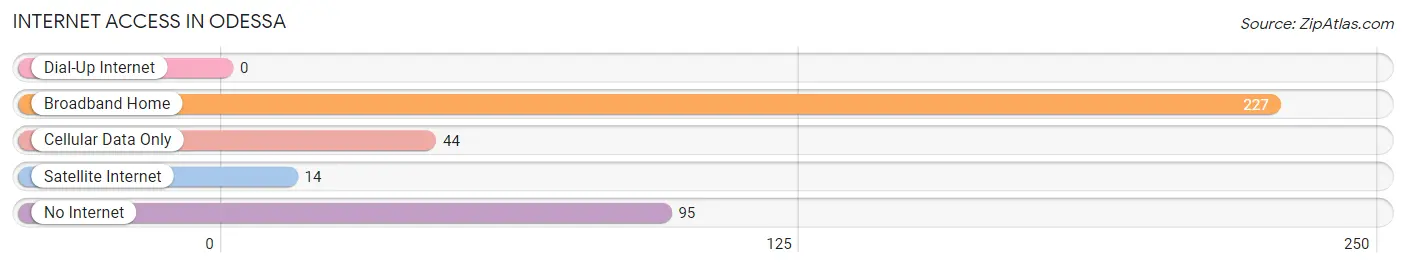
| Internet Type | # Households | % Households |
| Dial-Up Internet | 0 | 0.0% |
| Broadband Home | 227 | 60.1% |
| Cellular Data Only | 44 | 11.6% |
| Satellite Internet | 14 | 3.7% |
| No Internet | 95 | 25.1% |
| Total | 378 | 100.0% |
Odessa Summary
Odessa is a small town located in Lincoln County, Washington, United States. It is situated on the banks of the Columbia River, about 25 miles east of Spokane. The town was founded in 1883 and was named after the city of Odessa in Ukraine. The population of Odessa was 1,717 at the 2010 census.
History
Odessa was founded in 1883 by a group of German-Russian immigrants who had come to the area to farm. The town was named after the city of Odessa in Ukraine, which was the birthplace of many of the settlers. The town was incorporated in 1891 and was the first incorporated town in Lincoln County.
The town grew rapidly in the early 1900s, and by 1910, it had a population of over 1,000. The town was home to a variety of businesses, including a flour mill, a creamery, a brewery, a hotel, and several stores.
In the 1920s, Odessa was a popular tourist destination, with many visitors coming to enjoy the town's natural beauty and recreational activities. The town was also home to a number of cultural events, including the annual Odessa Days celebration.
Geography
Odessa is located in Lincoln County, Washington, at an elevation of 1,845 feet (562 m). The town is situated on the banks of the Columbia River, about 25 miles east of Spokane. The town is surrounded by rolling hills and is located in a semi-arid climate zone.
The town covers an area of 1.3 square miles (3.4 km2), all of which is land. The nearest major cities are Spokane, Washington (25 miles to the west) and Coeur d'Alene, Idaho (50 miles to the east).
Economy
Odessa's economy is largely based on agriculture and tourism. The town is home to several farms, which produce a variety of crops, including wheat, barley, and alfalfa. The town is also home to several wineries, which produce a variety of wines.
Tourism is an important part of the town's economy. The town is home to several attractions, including the Odessa Historical Museum, the Odessa Rodeo, and the Odessa Days celebration. The town is also home to several outdoor recreational activities, including fishing, hunting, and camping.
Demographics
As of the 2010 census, the population of Odessa was 1,717. The racial makeup of the town was 94.2% White, 0.3% African American, 0.7% Native American, 0.3% Asian, 0.1% Pacific Islander, 0.7% from other races, and 3.7% from two or more races. Hispanic or Latino of any race were 3.2% of the population.
The median income for a household in Odessa was $37,500, and the median income for a family was $45,000. The per capita income for the town was $18,845. About 11.2% of families and 14.2% of the population were below the poverty line, including 18.2% of those under age 18 and 8.3% of those age 65 or over.
Common Questions
What is Per Capita Income in Odessa?
Per Capita income in Odessa is $31,010.
What is the Median Family Income in Odessa?
Median Family Income in Odessa is $49,583.
What is the Median Household income in Odessa?
Median Household Income in Odessa is $46,607.
What is Income or Wage Gap in Odessa?
Income or Wage Gap in Odessa is 36.5%.
Women in Odessa earn 63.5 cents for every dollar earned by a man.
What is Inequality or Gini Index in Odessa?
Inequality or Gini Index in Odessa is 0.42.
What is the Total Population of Odessa?
Total Population of Odessa is 798.
What is the Total Male Population of Odessa?
Total Male Population of Odessa is 379.
What is the Total Female Population of Odessa?
Total Female Population of Odessa is 419.
What is the Ratio of Males per 100 Females in Odessa?
There are 90.45 Males per 100 Females in Odessa.
What is the Ratio of Females per 100 Males in Odessa?
There are 110.55 Females per 100 Males in Odessa.
What is the Median Population Age in Odessa?
Median Population Age in Odessa is 57.8 Years.
What is the Average Family Size in Odessa
Average Family Size in Odessa is 2.5 People.
What is the Average Household Size in Odessa
Average Household Size in Odessa is 1.9 People.
How Large is the Labor Force in Odessa?
There are 323 People in the Labor Forcein in Odessa.
What is the Percentage of People in the Labor Force in Odessa?
43.6% of People are in the Labor Force in Odessa.
What is the Unemployment Rate in Odessa?
Unemployment Rate in Odessa is 5.3%.