Nespelem, WA Map & Demographics
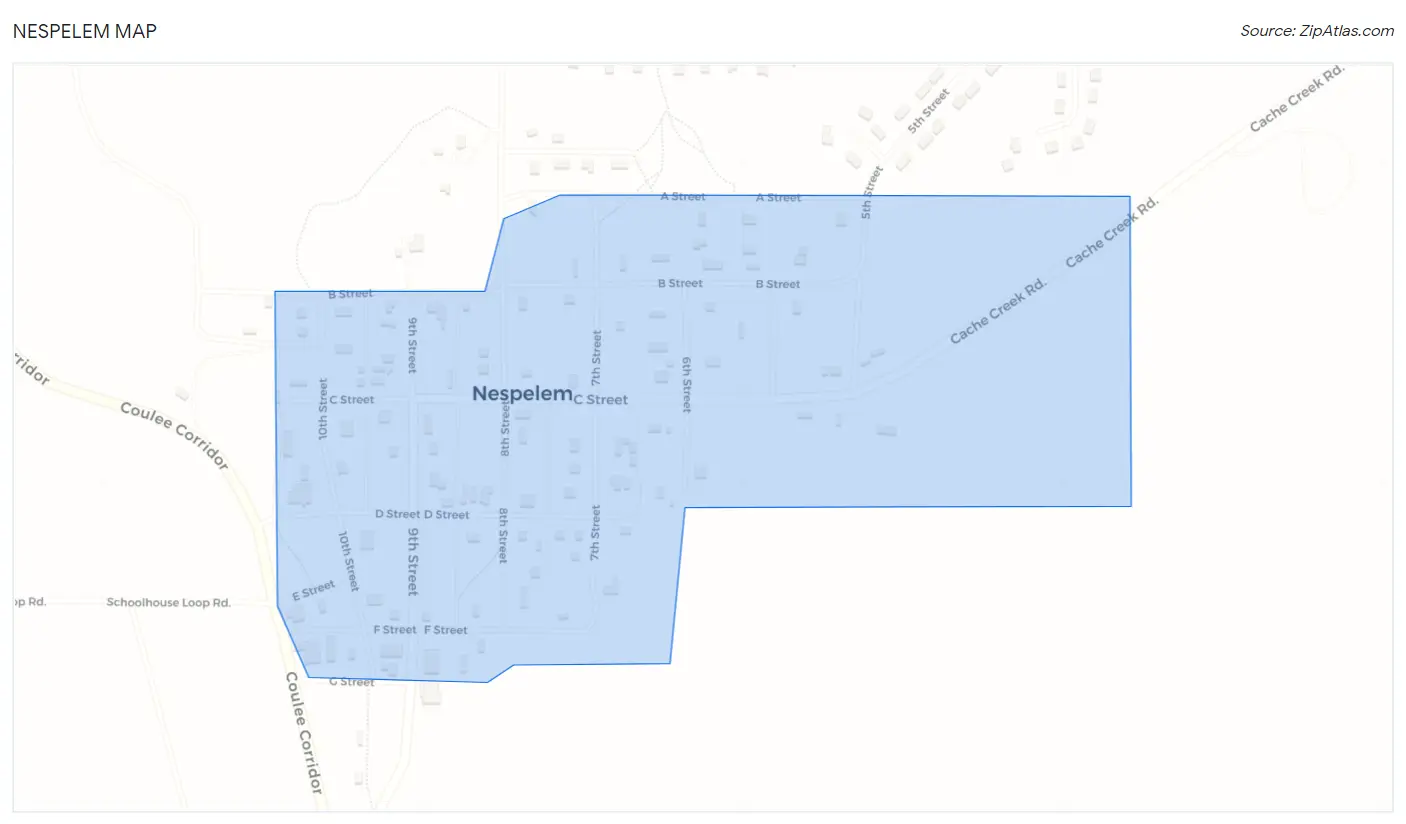
Nespelem Map
Nespelem Overview
$26,637
PER CAPITA INCOME
$50,000
AVG FAMILY INCOME
$45,625
AVG HOUSEHOLD INCOME
6.6%
WAGE / INCOME GAP [ % ]
93.4¢/ $1
WAGE / INCOME GAP [ $ ]
0.52
INEQUALITY / GINI INDEX
155
TOTAL POPULATION
68
MALE POPULATION
87
FEMALE POPULATION
78.16
MALES / 100 FEMALES
127.94
FEMALES / 100 MALES
33.9
MEDIAN AGE
2.9
AVG FAMILY SIZE
2.4
AVG HOUSEHOLD SIZE
49
LABOR FORCE [ PEOPLE ]
38.0%
PERCENT IN LABOR FORCE
6.1%
UNEMPLOYMENT RATE
Nespelem Zip Codes
Nespelem Area Codes
Income in Nespelem
Income Overview in Nespelem
Per Capita Income in Nespelem is $26,637, while median incomes of families and households are $50,000 and $45,625 respectively.
| Characteristic | Number | Measure |
| Per Capita Income | 155 | $26,637 |
| Median Family Income | 42 | $50,000 |
| Mean Family Income | 42 | $72,681 |
| Median Household Income | 65 | $45,625 |
| Mean Household Income | 65 | $63,542 |
| Income Deficit | 42 | $0 |
| Wage / Income Gap (%) | 155 | 6.58% |
| Wage / Income Gap ($) | 155 | 93.42¢ per $1 |
| Gini / Inequality Index | 155 | 0.52 |
Earnings by Sex in Nespelem
Average Earnings in Nespelem are $46,250, $47,500 for men and $44,375 for women, a difference of 6.6%.
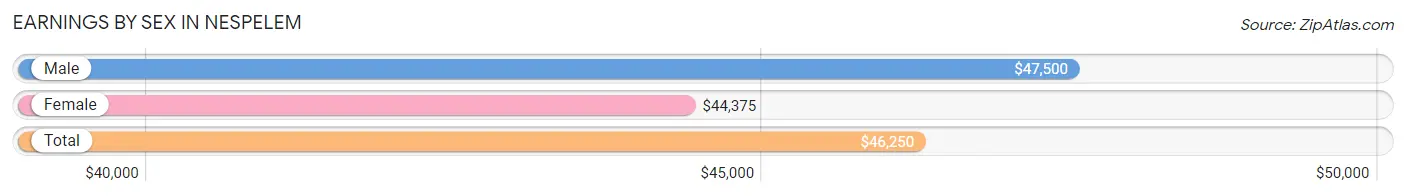
| Sex | Number | Average Earnings |
| Male | 32 (56.1%) | $47,500 |
| Female | 25 (43.9%) | $44,375 |
| Total | 57 (100.0%) | $46,250 |
Earnings by Sex by Income Bracket in Nespelem
The most common earnings brackets in Nespelem are $10,000 to $12,499 for men (7 | 21.9%) and $55,000 to $64,999 for women (6 | 24.0%).
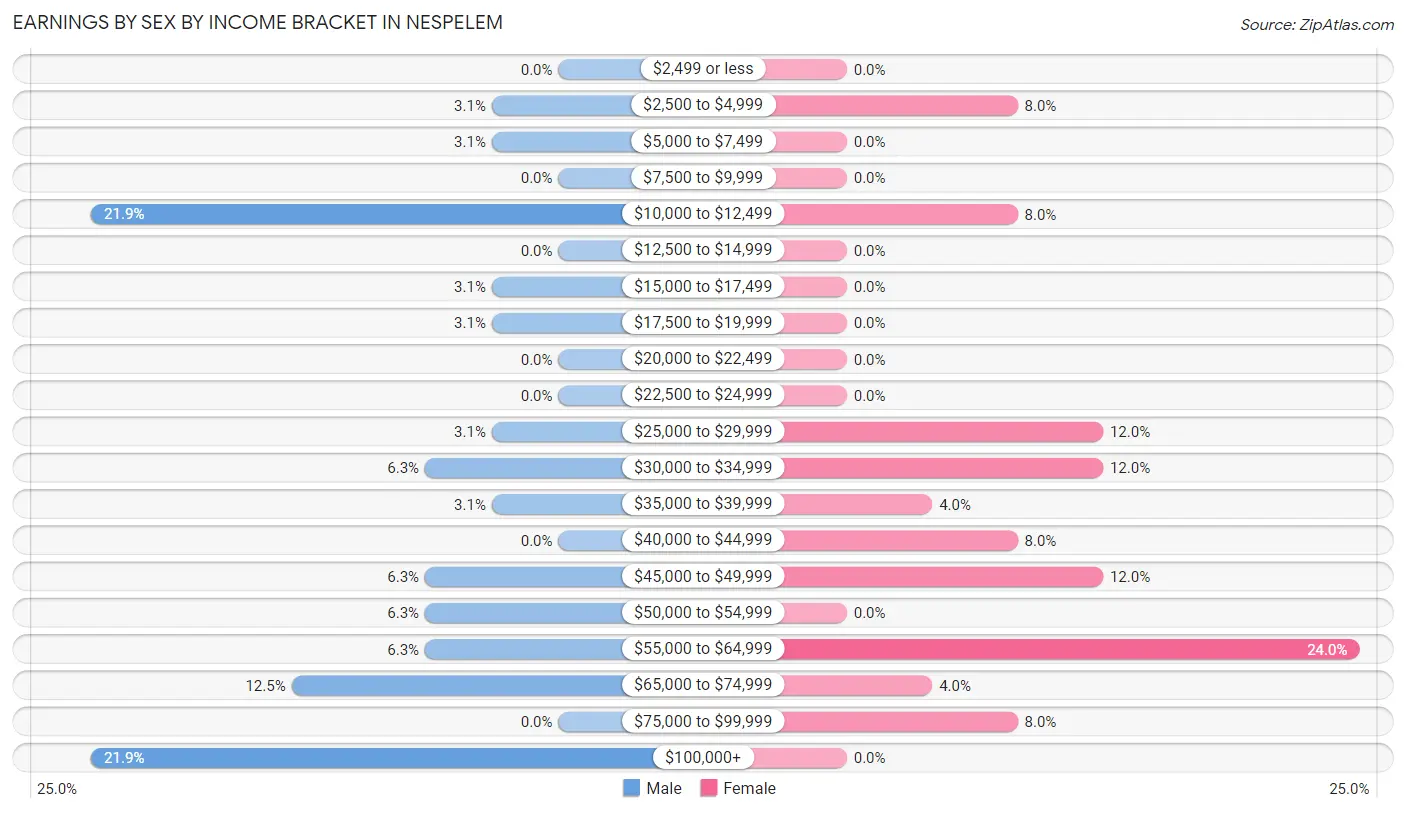
| Income | Male | Female |
| $2,499 or less | 0 (0.0%) | 0 (0.0%) |
| $2,500 to $4,999 | 1 (3.1%) | 2 (8.0%) |
| $5,000 to $7,499 | 1 (3.1%) | 0 (0.0%) |
| $7,500 to $9,999 | 0 (0.0%) | 0 (0.0%) |
| $10,000 to $12,499 | 7 (21.9%) | 2 (8.0%) |
| $12,500 to $14,999 | 0 (0.0%) | 0 (0.0%) |
| $15,000 to $17,499 | 1 (3.1%) | 0 (0.0%) |
| $17,500 to $19,999 | 1 (3.1%) | 0 (0.0%) |
| $20,000 to $22,499 | 0 (0.0%) | 0 (0.0%) |
| $22,500 to $24,999 | 0 (0.0%) | 0 (0.0%) |
| $25,000 to $29,999 | 1 (3.1%) | 3 (12.0%) |
| $30,000 to $34,999 | 2 (6.2%) | 3 (12.0%) |
| $35,000 to $39,999 | 1 (3.1%) | 1 (4.0%) |
| $40,000 to $44,999 | 0 (0.0%) | 2 (8.0%) |
| $45,000 to $49,999 | 2 (6.2%) | 3 (12.0%) |
| $50,000 to $54,999 | 2 (6.2%) | 0 (0.0%) |
| $55,000 to $64,999 | 2 (6.2%) | 6 (24.0%) |
| $65,000 to $74,999 | 4 (12.5%) | 1 (4.0%) |
| $75,000 to $99,999 | 0 (0.0%) | 2 (8.0%) |
| $100,000+ | 7 (21.9%) | 0 (0.0%) |
| Total | 32 (100.0%) | 25 (100.0%) |
Earnings by Sex by Educational Attainment in Nespelem
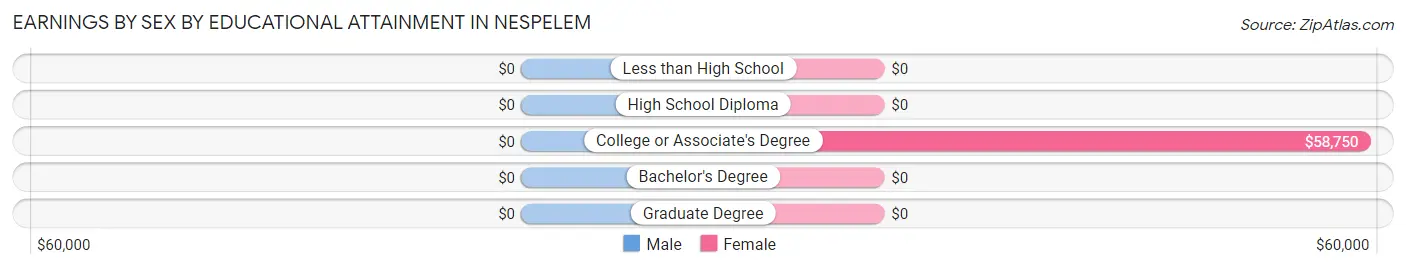
| Educational Attainment | Male Income | Female Income |
| Less than High School | - | - |
| High School Diploma | - | - |
| College or Associate's Degree | - | - |
| Bachelor's Degree | - | - |
| Graduate Degree | - | - |
| Total | $46,250 | $48,333 |
Family Income in Nespelem
Family Income Brackets in Nespelem
According to the Nespelem family income data, there are 11 families falling into the less than $10,000 income range, which is the most common income bracket and makes up 26.2% of all families.
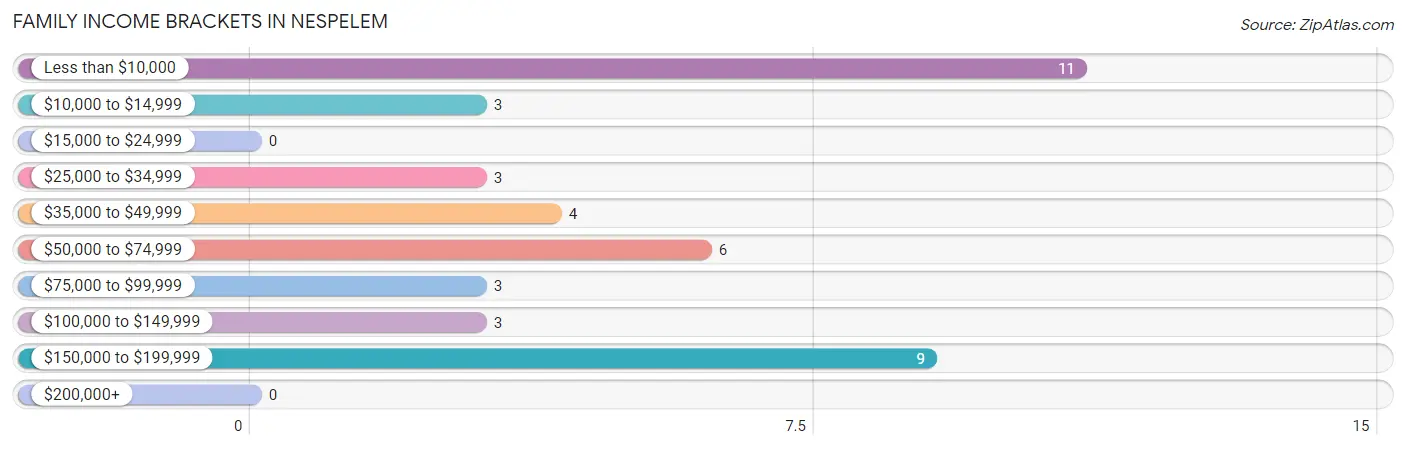
| Income Bracket | # Families | % Families |
| Less than $10,000 | 11 | 26.2% |
| $10,000 to $14,999 | 3 | 7.1% |
| $15,000 to $24,999 | 0 | 0.0% |
| $25,000 to $34,999 | 3 | 7.1% |
| $35,000 to $49,999 | 4 | 9.5% |
| $50,000 to $74,999 | 6 | 14.3% |
| $75,000 to $99,999 | 3 | 7.1% |
| $100,000 to $149,999 | 3 | 7.1% |
| $150,000 to $199,999 | 9 | 21.4% |
| $200,000+ | 0 | 0.0% |
Family Income by Famaliy Size in Nespelem
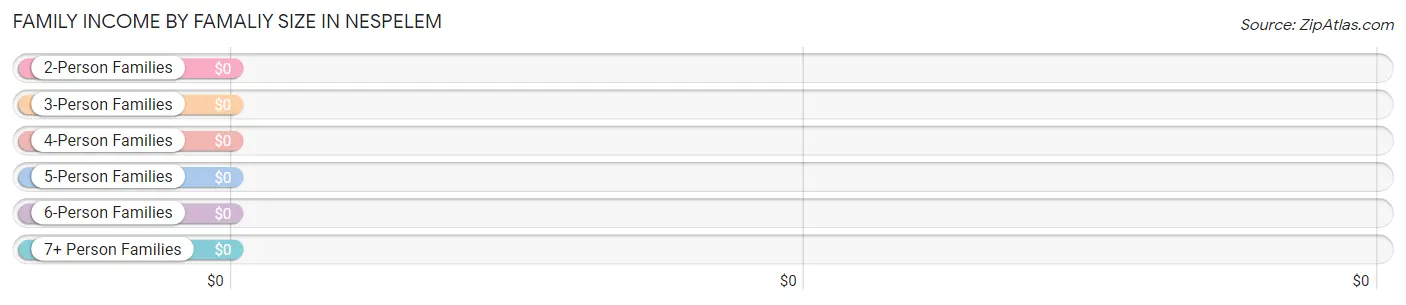
| Income Bracket | # Families | Median Income |
| 2-Person Families | 23 (54.8%) | $0 |
| 3-Person Families | 6 (14.3%) | $0 |
| 4-Person Families | 11 (26.2%) | $0 |
| 5-Person Families | 2 (4.8%) | $0 |
| 6-Person Families | 0 (0.0%) | $0 |
| 7+ Person Families | 0 (0.0%) | $0 |
| Total | 42 (100.0%) | $50,000 |
Family Income by Number of Earners in Nespelem
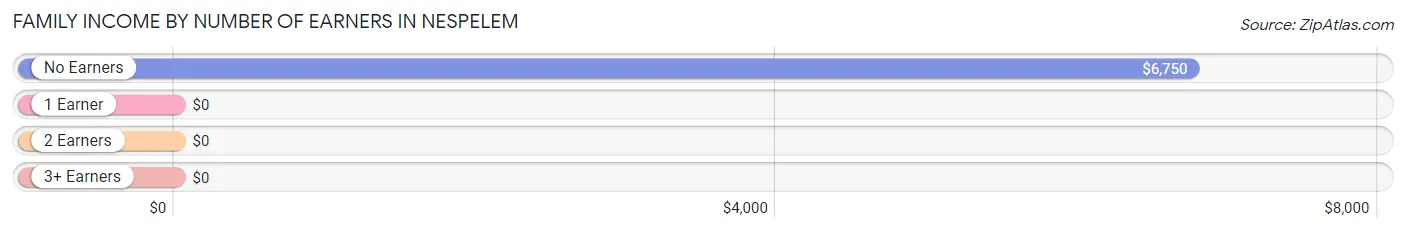
| Number of Earners | # Families | Median Income |
| No Earners | 15 (35.7%) | $6,750 |
| 1 Earner | 21 (50.0%) | $0 |
| 2 Earners | 4 (9.5%) | $0 |
| 3+ Earners | 2 (4.8%) | $0 |
| Total | 42 (100.0%) | $50,000 |
Household Income in Nespelem
Household Income Brackets in Nespelem
With 13 households falling in the category, the less than $10,000 income range is the most frequent in Nespelem, accounting for 20.0% of all households. In contrast, only 1 households (1.5%) fall into the $200,000+ income bracket, making it the least populous group.
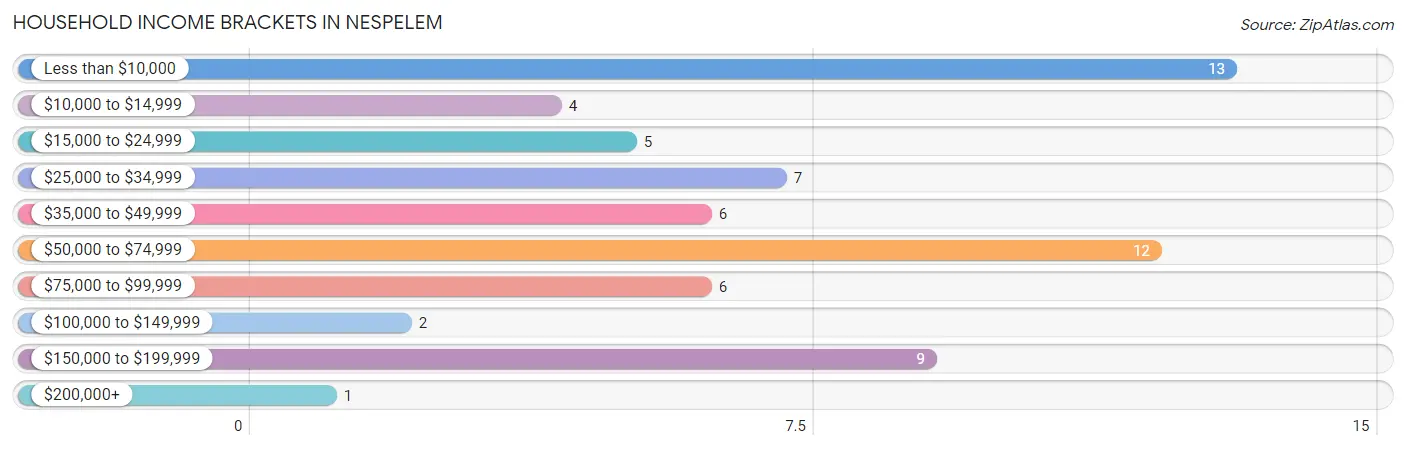
| Income Bracket | # Households | % Households |
| Less than $10,000 | 13 | 20.0% |
| $10,000 to $14,999 | 4 | 6.2% |
| $15,000 to $24,999 | 5 | 7.7% |
| $25,000 to $34,999 | 7 | 10.8% |
| $35,000 to $49,999 | 6 | 9.2% |
| $50,000 to $74,999 | 12 | 18.5% |
| $75,000 to $99,999 | 6 | 9.2% |
| $100,000 to $149,999 | 2 | 3.1% |
| $150,000 to $199,999 | 9 | 13.8% |
| $200,000+ | 1 | 1.5% |
Household Income by Householder Age in Nespelem
The median household income in Nespelem is $45,625, with the highest median household income of $58,750 found in the 45 to 64 years age bracket for the primary householder. A total of 28 households (43.1%) fall into this category.
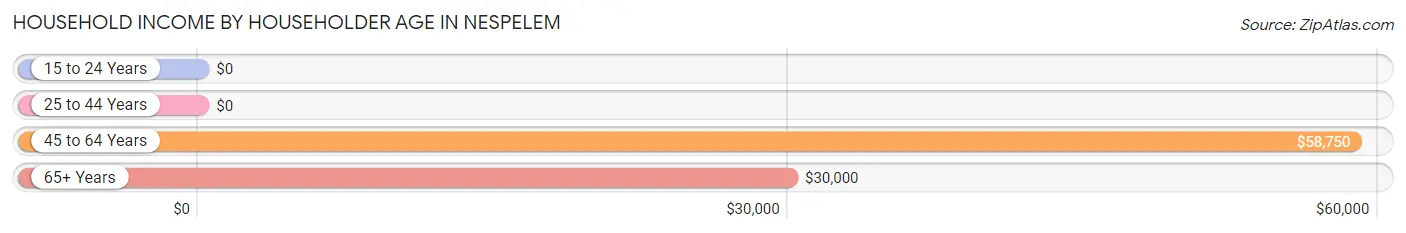
| Income Bracket | # Households | Median Income |
| 15 to 24 Years | 0 (0.0%) | $0 |
| 25 to 44 Years | 19 (29.2%) | $0 |
| 45 to 64 Years | 28 (43.1%) | $58,750 |
| 65+ Years | 18 (27.7%) | $30,000 |
| Total | 65 (100.0%) | $45,625 |
Poverty in Nespelem
Income Below Poverty by Sex and Age in Nespelem
With 29.4% poverty level for males and 25.3% for females among the residents of Nespelem, 12 to 14 year old males and 16 and 17 year old females are the most vulnerable to poverty, with 1 males (100.0%) and 2 females (100.0%) in their respective age groups living below the poverty level.
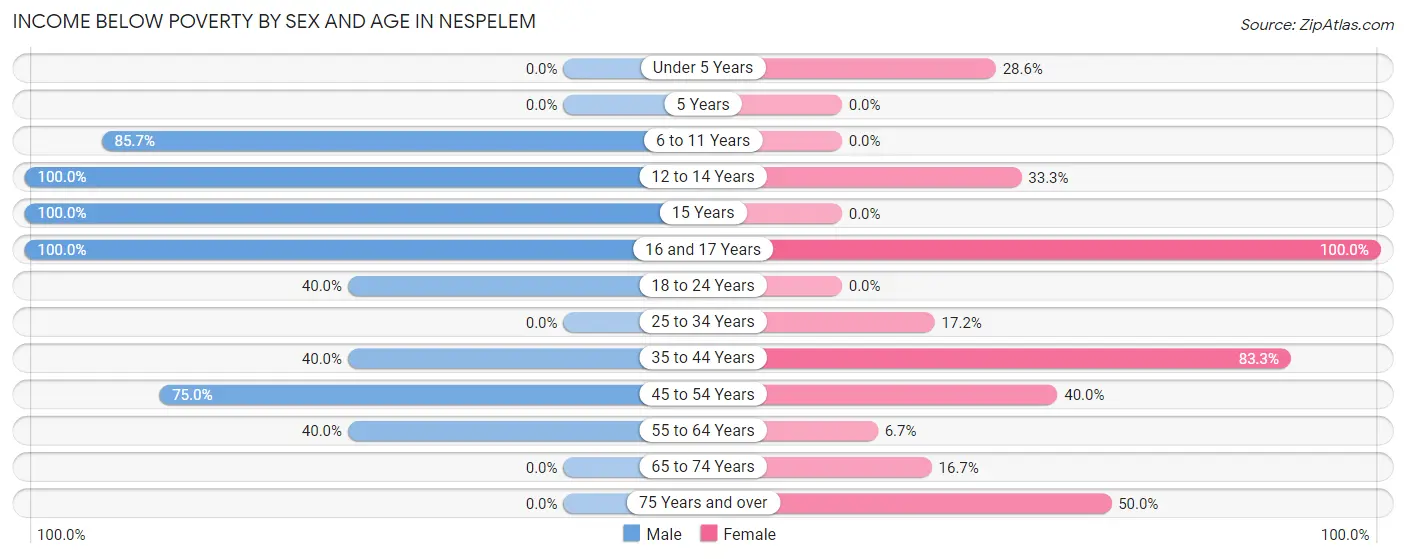
| Age Bracket | Male | Female |
| Under 5 Years | 0 (0.0%) | 2 (28.6%) |
| 5 Years | 0 (0.0%) | 0 (0.0%) |
| 6 to 11 Years | 6 (85.7%) | 0 (0.0%) |
| 12 to 14 Years | 1 (100.0%) | 1 (33.3%) |
| 15 Years | 1 (100.0%) | 0 (0.0%) |
| 16 and 17 Years | 1 (100.0%) | 2 (100.0%) |
| 18 to 24 Years | 2 (40.0%) | 0 (0.0%) |
| 25 to 34 Years | 0 (0.0%) | 5 (17.2%) |
| 35 to 44 Years | 2 (40.0%) | 5 (83.3%) |
| 45 to 54 Years | 3 (75.0%) | 4 (40.0%) |
| 55 to 64 Years | 4 (40.0%) | 1 (6.7%) |
| 65 to 74 Years | 0 (0.0%) | 1 (16.7%) |
| 75 Years and over | 0 (0.0%) | 1 (50.0%) |
| Total | 20 (29.4%) | 22 (25.3%) |
Income Above Poverty by Sex and Age in Nespelem
According to the poverty statistics in Nespelem, males aged under 5 years and females aged 5 years are the age groups that are most secure financially, with 100.0% of males and 100.0% of females in these age groups living above the poverty line.
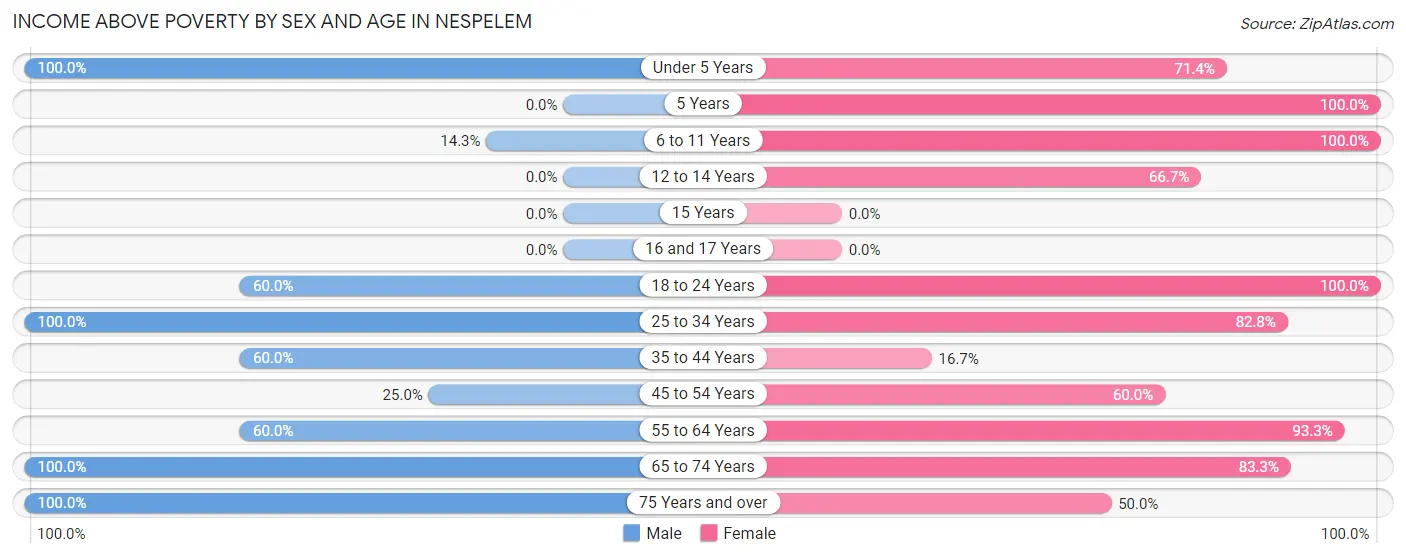
| Age Bracket | Male | Female |
| Under 5 Years | 1 (100.0%) | 5 (71.4%) |
| 5 Years | 0 (0.0%) | 1 (100.0%) |
| 6 to 11 Years | 1 (14.3%) | 5 (100.0%) |
| 12 to 14 Years | 0 (0.0%) | 2 (66.7%) |
| 15 Years | 0 (0.0%) | 0 (0.0%) |
| 16 and 17 Years | 0 (0.0%) | 0 (0.0%) |
| 18 to 24 Years | 3 (60.0%) | 1 (100.0%) |
| 25 to 34 Years | 15 (100.0%) | 24 (82.8%) |
| 35 to 44 Years | 3 (60.0%) | 1 (16.7%) |
| 45 to 54 Years | 1 (25.0%) | 6 (60.0%) |
| 55 to 64 Years | 6 (60.0%) | 14 (93.3%) |
| 65 to 74 Years | 12 (100.0%) | 5 (83.3%) |
| 75 Years and over | 6 (100.0%) | 1 (50.0%) |
| Total | 48 (70.6%) | 65 (74.7%) |
Income Below Poverty Among Married-Couple Families in Nespelem
The poverty statistics for married-couple families in Nespelem show that 15.8% or 3 of the total 19 families live below the poverty line. Families with 3 or 4 children have the highest poverty rate of 100.0%, comprising of 1 families. On the other hand, families with 1 or 2 children have the lowest poverty rate of 0.0%, which includes 0 families.
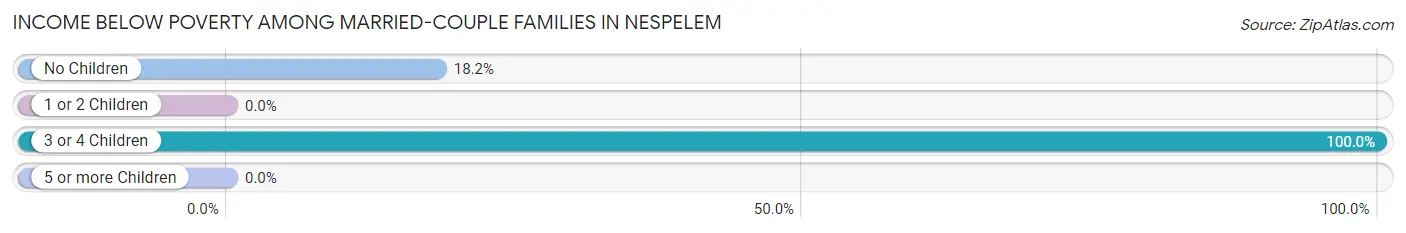
| Children | Above Poverty | Below Poverty |
| No Children | 9 (81.8%) | 2 (18.2%) |
| 1 or 2 Children | 7 (100.0%) | 0 (0.0%) |
| 3 or 4 Children | 0 (0.0%) | 1 (100.0%) |
| 5 or more Children | 0 (0.0%) | 0 (0.0%) |
| Total | 16 (84.2%) | 3 (15.8%) |
Income Below Poverty Among Single-Parent Households in Nespelem
According to the poverty data in Nespelem, 66.7% or 2 single-father households and 50.0% or 10 single-mother households are living below the poverty line. Among single-father households, those with no children have the highest poverty rate, with 1 households (100.0%) experiencing poverty. Likewise, among single-mother households, those with 3 or 4 children have the highest poverty rate, with 1 households (100.0%) falling below the poverty line.
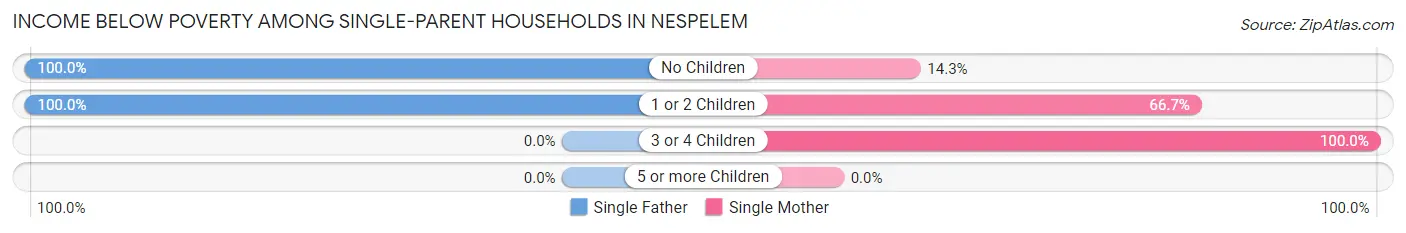
| Children | Single Father | Single Mother |
| No Children | 1 (100.0%) | 1 (14.3%) |
| 1 or 2 Children | 1 (100.0%) | 8 (66.7%) |
| 3 or 4 Children | 0 (0.0%) | 1 (100.0%) |
| 5 or more Children | 0 (0.0%) | 0 (0.0%) |
| Total | 2 (66.7%) | 10 (50.0%) |
Income Below Poverty Among Married-Couple vs Single-Parent Households in Nespelem
The poverty data for Nespelem shows that 3 of the married-couple family households (15.8%) and 12 of the single-parent households (52.2%) are living below the poverty level. Within the married-couple family households, those with 3 or 4 children have the highest poverty rate, with 1 households (100.0%) falling below the poverty line. Among the single-parent households, those with 1 or 2 children have the highest poverty rate, with 9 household (69.2%) living below poverty.
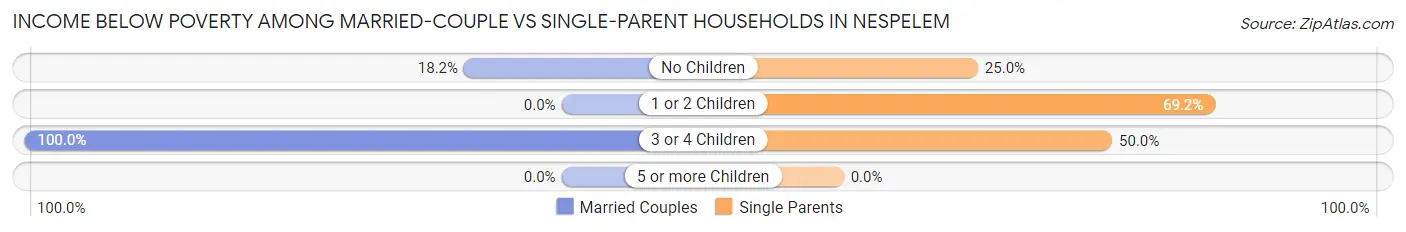
| Children | Married-Couple Families | Single-Parent Households |
| No Children | 2 (18.2%) | 2 (25.0%) |
| 1 or 2 Children | 0 (0.0%) | 9 (69.2%) |
| 3 or 4 Children | 1 (100.0%) | 1 (50.0%) |
| 5 or more Children | 0 (0.0%) | 0 (0.0%) |
| Total | 3 (15.8%) | 12 (52.2%) |
Race in Nespelem
The most populous races in Nespelem are Native / Alaskan (126 | 81.3%), Two or more Races (14 | 9.0%), and White / Caucasian (12 | 7.7%).
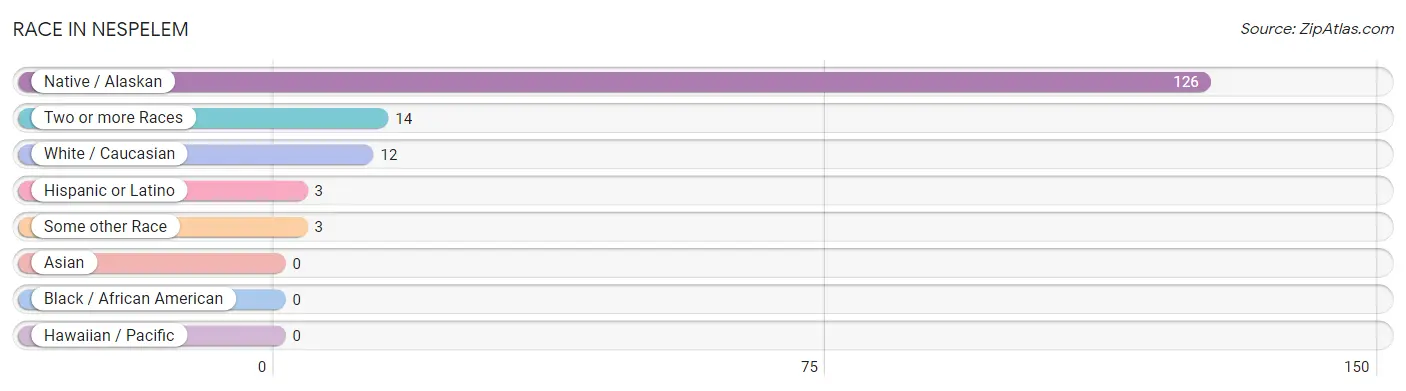
| Race | # Population | % Population |
| Asian | 0 | 0.0% |
| Black / African American | 0 | 0.0% |
| Hawaiian / Pacific | 0 | 0.0% |
| Hispanic or Latino | 3 | 1.9% |
| Native / Alaskan | 126 | 81.3% |
| White / Caucasian | 12 | 7.7% |
| Two or more Races | 14 | 9.0% |
| Some other Race | 3 | 1.9% |
| Total | 155 | 100.0% |
Ancestry in Nespelem
The most populous ancestries reported in Nespelem are Colville (110 | 71.0%), American (12 | 7.7%), Apache (6 | 3.9%), Puget Sound Salish (5 | 3.2%), and Indian (Asian) (4 | 2.6%), together accounting for 88.4% of all Nespelem residents.
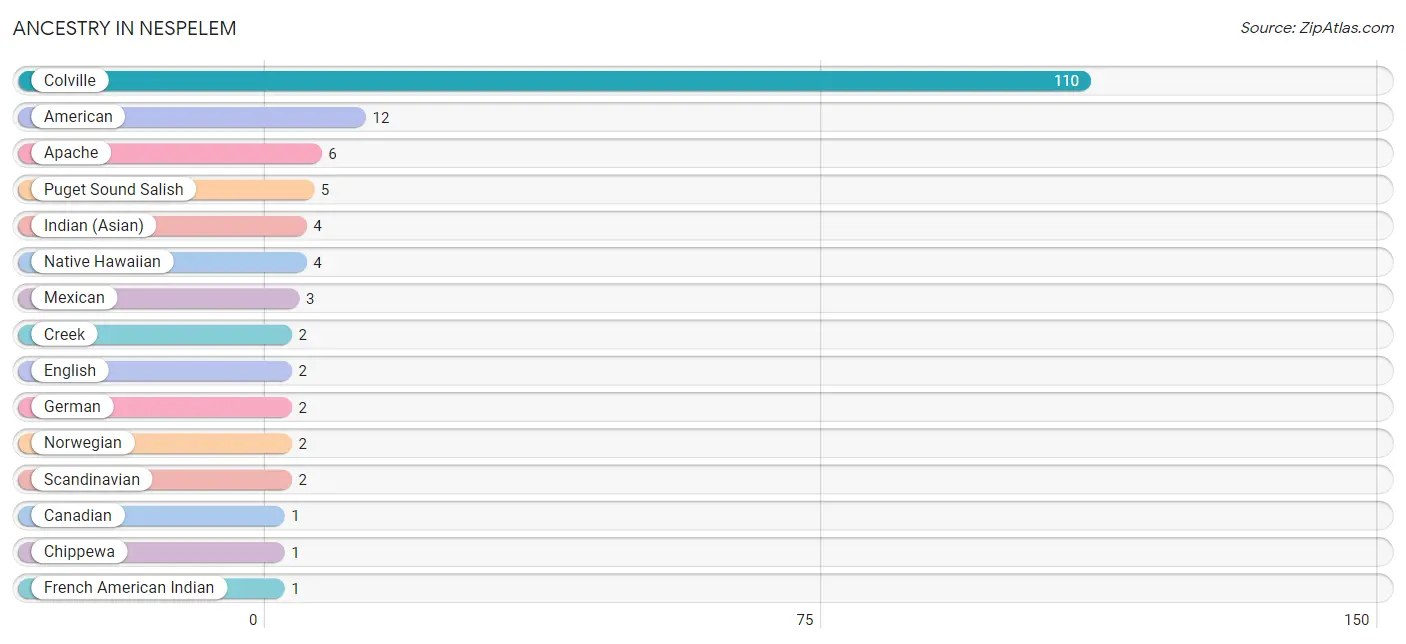
| Ancestry | # Population | % Population |
| American | 12 | 7.7% |
| Apache | 6 | 3.9% |
| Canadian | 1 | 0.6% |
| Chippewa | 1 | 0.6% |
| Colville | 110 | 71.0% |
| Creek | 2 | 1.3% |
| English | 2 | 1.3% |
| French American Indian | 1 | 0.6% |
| German | 2 | 1.3% |
| Indian (Asian) | 4 | 2.6% |
| Mexican | 3 | 1.9% |
| Native Hawaiian | 4 | 2.6% |
| Norwegian | 2 | 1.3% |
| Puget Sound Salish | 5 | 3.2% |
| Scandinavian | 2 | 1.3% |
| Yakama | 1 | 0.6% | View All 16 Rows |
Immigrants in Nespelem
The most numerous immigrant groups reported in Nespelem came from , and Canada (1 | 0.6%), together accounting for 0.6% of all Nespelem residents.

| Immigration Origin | # Population | % Population |
| Canada | 1 | 0.6% | View All 1 Rows |
Sex and Age in Nespelem
Sex and Age in Nespelem
The most populous age groups in Nespelem are 30 to 34 Years (9 | 13.2%) for men and 30 to 34 Years (25 | 28.7%) for women.
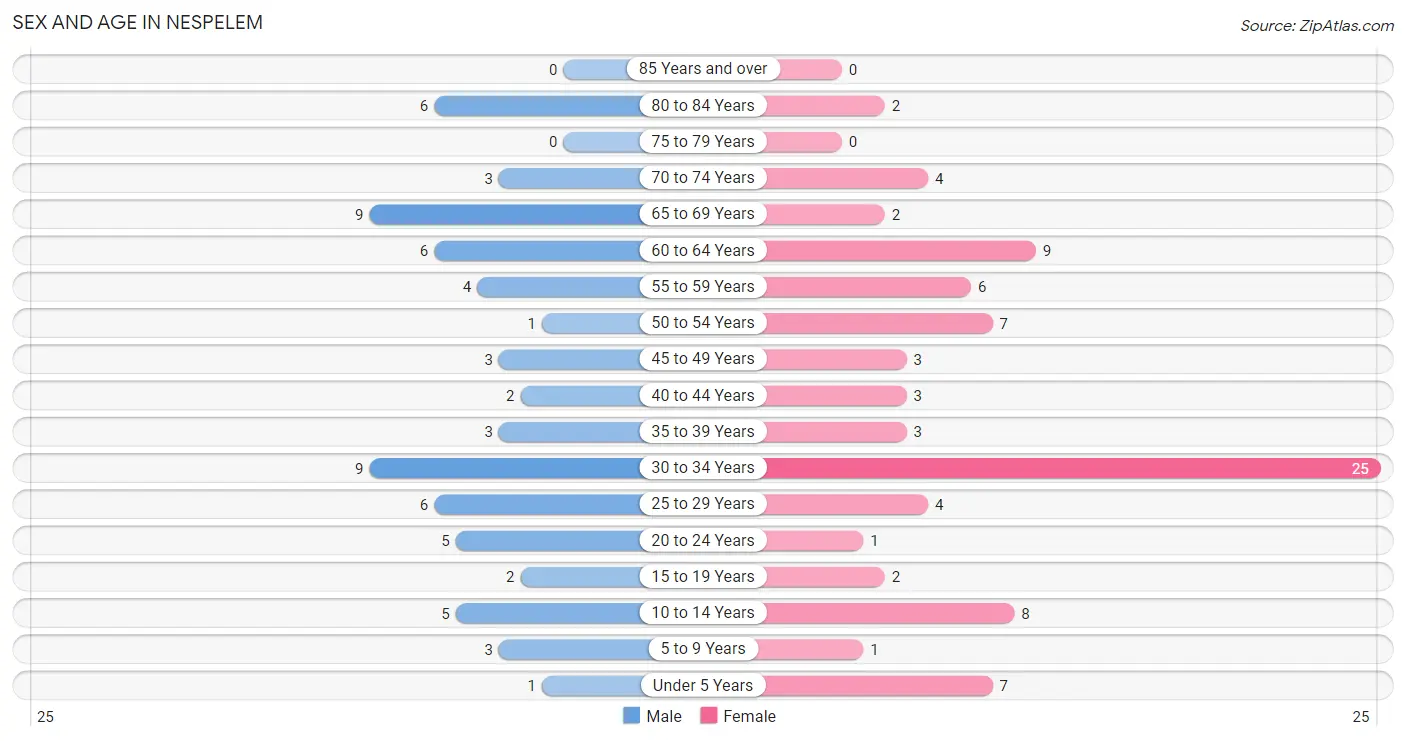
| Age Bracket | Male | Female |
| Under 5 Years | 1 (1.5%) | 7 (8.1%) |
| 5 to 9 Years | 3 (4.4%) | 1 (1.1%) |
| 10 to 14 Years | 5 (7.3%) | 8 (9.2%) |
| 15 to 19 Years | 2 (2.9%) | 2 (2.3%) |
| 20 to 24 Years | 5 (7.3%) | 1 (1.1%) |
| 25 to 29 Years | 6 (8.8%) | 4 (4.6%) |
| 30 to 34 Years | 9 (13.2%) | 25 (28.7%) |
| 35 to 39 Years | 3 (4.4%) | 3 (3.5%) |
| 40 to 44 Years | 2 (2.9%) | 3 (3.5%) |
| 45 to 49 Years | 3 (4.4%) | 3 (3.5%) |
| 50 to 54 Years | 1 (1.5%) | 7 (8.1%) |
| 55 to 59 Years | 4 (5.9%) | 6 (6.9%) |
| 60 to 64 Years | 6 (8.8%) | 9 (10.3%) |
| 65 to 69 Years | 9 (13.2%) | 2 (2.3%) |
| 70 to 74 Years | 3 (4.4%) | 4 (4.6%) |
| 75 to 79 Years | 0 (0.0%) | 0 (0.0%) |
| 80 to 84 Years | 6 (8.8%) | 2 (2.3%) |
| 85 Years and over | 0 (0.0%) | 0 (0.0%) |
| Total | 68 (100.0%) | 87 (100.0%) |
Families and Households in Nespelem
Median Family Size in Nespelem
The median family size in Nespelem is 2.90 persons per family, with single female/mother families (20 | 47.6%) accounting for the largest median family size of 3.15 persons per family. On the other hand, married-couple families (19 | 45.2%) represent the smallest median family size with 2.63 persons per family.
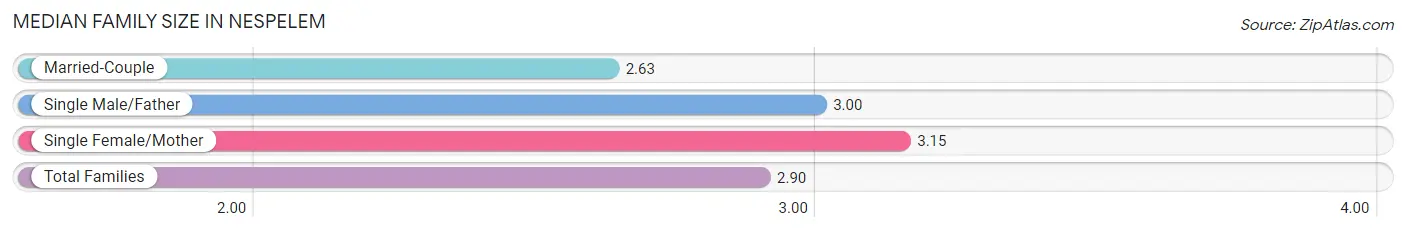
| Family Type | # Families | Family Size |
| Married-Couple | 19 (45.2%) | 2.63 |
| Single Male/Father | 3 (7.1%) | 3.00 |
| Single Female/Mother | 20 (47.6%) | 3.15 |
| Total Families | 42 (100.0%) | 2.90 |
Median Household Size in Nespelem
The median household size in Nespelem is 2.38 persons per household, with single male/father households (3 | 4.6%) accounting for the largest median household size of 3.67 persons per household. non-family households (23 | 35.4%) represent the smallest median household size with 1.26 persons per household.
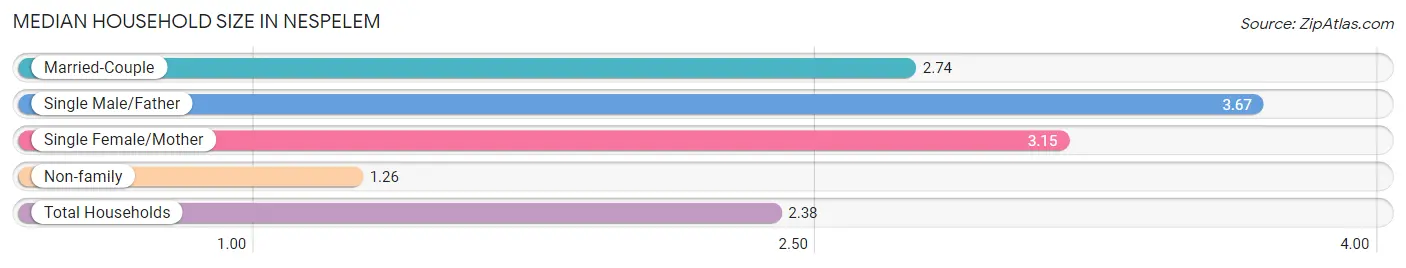
| Household Type | # Households | Household Size |
| Married-Couple | 19 (29.2%) | 2.74 |
| Single Male/Father | 3 (4.6%) | 3.67 |
| Single Female/Mother | 20 (30.8%) | 3.15 |
| Non-family | 23 (35.4%) | 1.26 |
| Total Households | 65 (100.0%) | 2.38 |
Household Size by Marriage Status in Nespelem
Out of a total of 65 households in Nespelem, 42 (64.6%) are family households, while 23 (35.4%) are nonfamily households. The most numerous type of family households are 2-person households, comprising 23, and the most common type of nonfamily households are 1-person households, comprising 16.
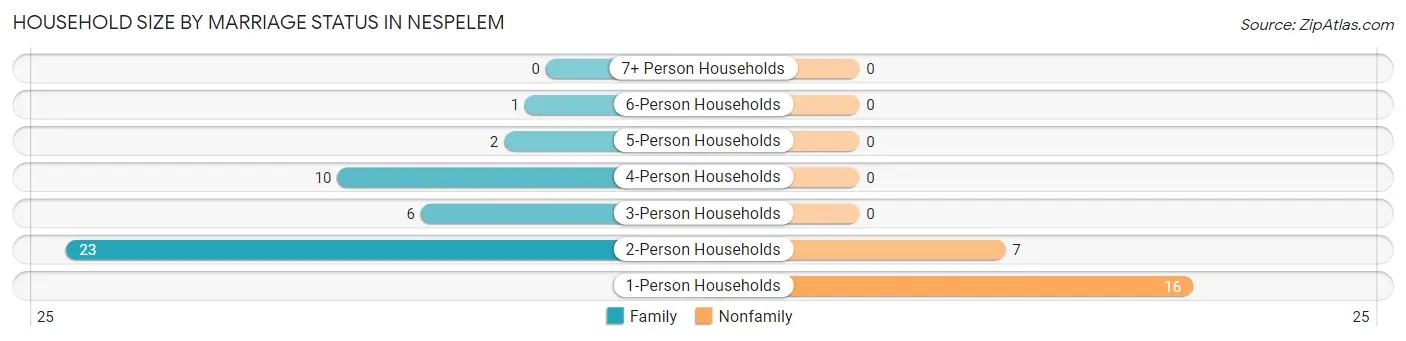
| Household Size | Family Households | Nonfamily Households |
| 1-Person Households | - | 16 (24.6%) |
| 2-Person Households | 23 (35.4%) | 7 (10.8%) |
| 3-Person Households | 6 (9.2%) | 0 (0.0%) |
| 4-Person Households | 10 (15.4%) | 0 (0.0%) |
| 5-Person Households | 2 (3.1%) | 0 (0.0%) |
| 6-Person Households | 1 (1.5%) | 0 (0.0%) |
| 7+ Person Households | 0 (0.0%) | 0 (0.0%) |
| Total | 42 (64.6%) | 23 (35.4%) |
Female Fertility in Nespelem
Fertility by Age in Nespelem
| Age Bracket | Women with Births | Births / 1,000 Women |
| 15 to 19 years | 0 (0.0%) | 0.0 |
| 20 to 34 years | 0 (0.0%) | 0.0 |
| 35 to 50 years | 0 (0.0%) | 0.0 |
| Total | 0 (0.0%) | 0.0 |
Fertility by Age by Marriage Status in Nespelem
| Age Bracket | Married | Unmarried |
| 15 to 19 years | 0 (0.0%) | 0 (0.0%) |
| 20 to 34 years | 0 (0.0%) | 0 (0.0%) |
| 35 to 50 years | 0 (0.0%) | 0 (0.0%) |
| Total | 0 (0.0%) | 0 (0.0%) |
Fertility by Education in Nespelem
| Educational Attainment | Women with Births | Births / 1,000 Women |
| Less than High School | 0 (0.0%) | 0.0 |
| High School Diploma | 0 (0.0%) | 0.0 |
| College or Associate's Degree | 0 (0.0%) | 0.0 |
| Bachelor's Degree | 0 (0.0%) | 0.0 |
| Graduate Degree | 0 (0.0%) | 0.0 |
| Total | 0 (0.0%) | 0.0 |
Fertility by Education by Marriage Status in Nespelem
| Educational Attainment | Married | Unmarried |
| Less than High School | 0 (0.0%) | 0 (0.0%) |
| High School Diploma | 0 (0.0%) | 0 (0.0%) |
| College or Associate's Degree | 0 (0.0%) | 0 (0.0%) |
| Bachelor's Degree | 0 (0.0%) | 0 (0.0%) |
| Graduate Degree | 0 (0.0%) | 0 (0.0%) |
| Total | 0 (0.0%) | 0 (0.0%) |
Employment Characteristics in Nespelem
Employment by Class of Employer in Nespelem
Among the 45 employed individuals in Nespelem, private company employees (15 | 33.3%), local government employees (13 | 28.9%), and federal government employees (8 | 17.8%) make up the most common classes of employment.
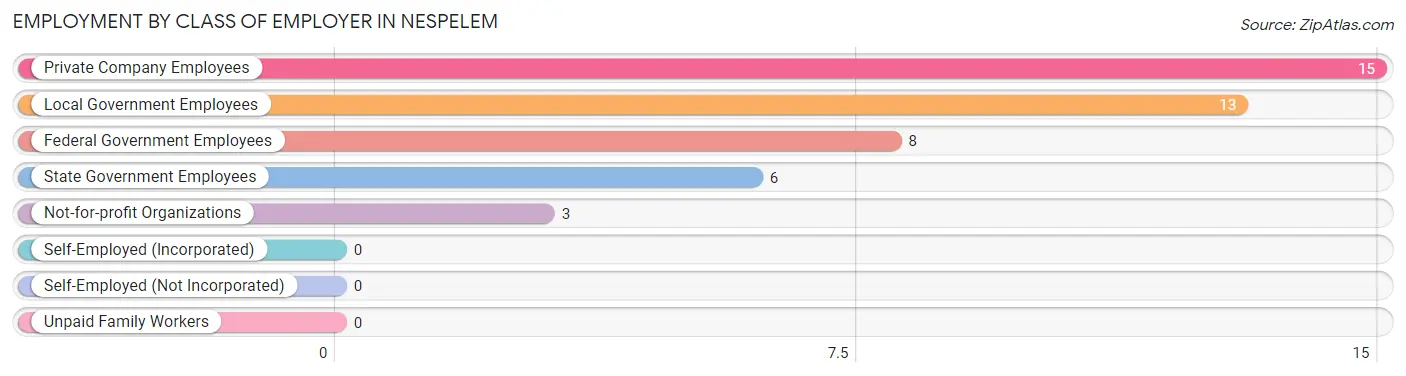
| Employer Class | # Employees | % Employees |
| Private Company Employees | 15 | 33.3% |
| Self-Employed (Incorporated) | 0 | 0.0% |
| Self-Employed (Not Incorporated) | 0 | 0.0% |
| Not-for-profit Organizations | 3 | 6.7% |
| Local Government Employees | 13 | 28.9% |
| State Government Employees | 6 | 13.3% |
| Federal Government Employees | 8 | 17.8% |
| Unpaid Family Workers | 0 | 0.0% |
| Total | 45 | 100.0% |
Employment Status by Age in Nespelem
According to the labor force statistics for Nespelem, out of the total population over 16 years of age (129), 38.0% or 49 individuals are in the labor force, with 6.1% or 3 of them unemployed. The age group with the highest labor force participation rate is 25 to 29 years, with 100.0% or 10 individuals in the labor force. Within the labor force, the 55 to 59 years age range has the highest percentage of unemployed individuals, with 28.6% or 2 of them being unemployed.
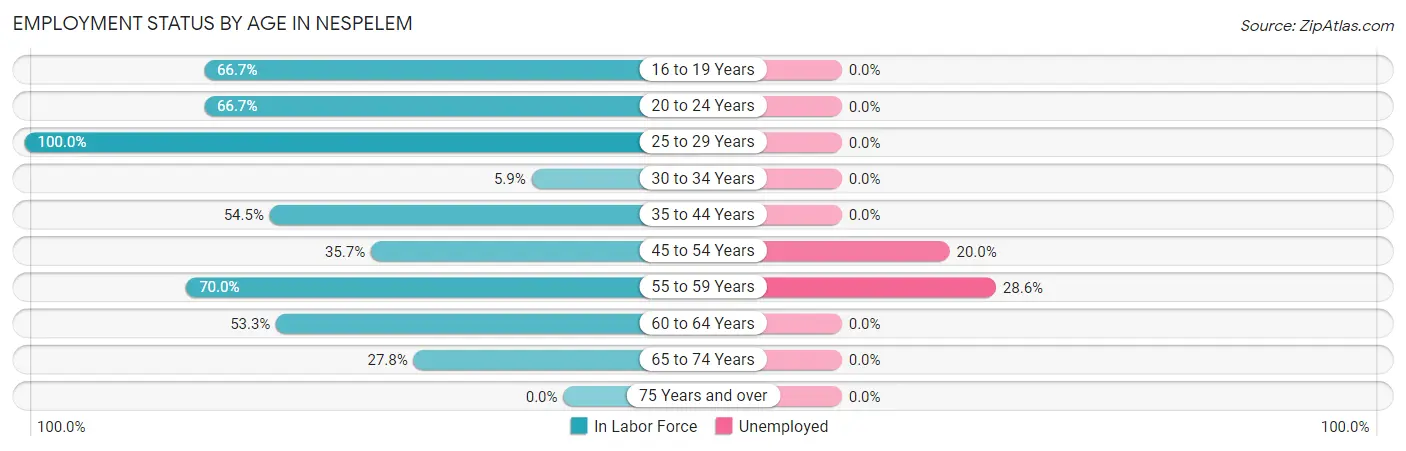
| Age Bracket | In Labor Force | Unemployed |
| 16 to 19 Years | 2 (66.7%) | 0 (0.0%) |
| 20 to 24 Years | 4 (66.7%) | 0 (0.0%) |
| 25 to 29 Years | 10 (100.0%) | 0 (0.0%) |
| 30 to 34 Years | 2 (5.9%) | 0 (0.0%) |
| 35 to 44 Years | 6 (54.5%) | 0 (0.0%) |
| 45 to 54 Years | 5 (35.7%) | 1 (20.0%) |
| 55 to 59 Years | 7 (70.0%) | 2 (28.6%) |
| 60 to 64 Years | 8 (53.3%) | 0 (0.0%) |
| 65 to 74 Years | 5 (27.8%) | 0 (0.0%) |
| 75 Years and over | 0 (0.0%) | 0 (0.0%) |
| Total | 49 (38.0%) | 3 (6.1%) |
Employment Status by Educational Attainment in Nespelem
According to labor force statistics for Nespelem, 40.4% of individuals (38) out of the total population between 25 and 64 years of age (94) are in the labor force, with 7.9% or 3 of them being unemployed. The group with the highest labor force participation rate are those with the educational attainment of bachelor's degree or higher, with 85.7% or 6 individuals in the labor force. Within the labor force, individuals with bachelor's degree or higher education have the highest percentage of unemployment, with 33.3% or 2 of them being unemployed.
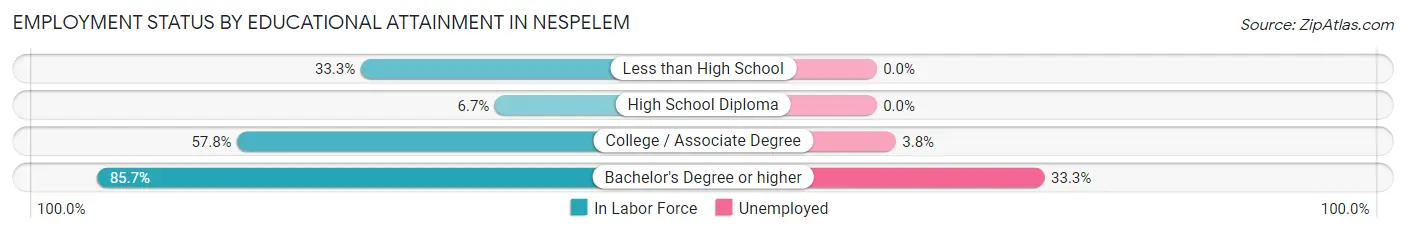
| Educational Attainment | In Labor Force | Unemployed |
| Less than High School | 4 (33.3%) | 0 (0.0%) |
| High School Diploma | 2 (6.7%) | 0 (0.0%) |
| College / Associate Degree | 26 (57.8%) | 2 (3.8%) |
| Bachelor's Degree or higher | 6 (85.7%) | 2 (33.3%) |
| Total | 38 (40.4%) | 7 (7.9%) |
Employment Occupations by Sex in Nespelem
Management, Business, Science and Arts Occupations
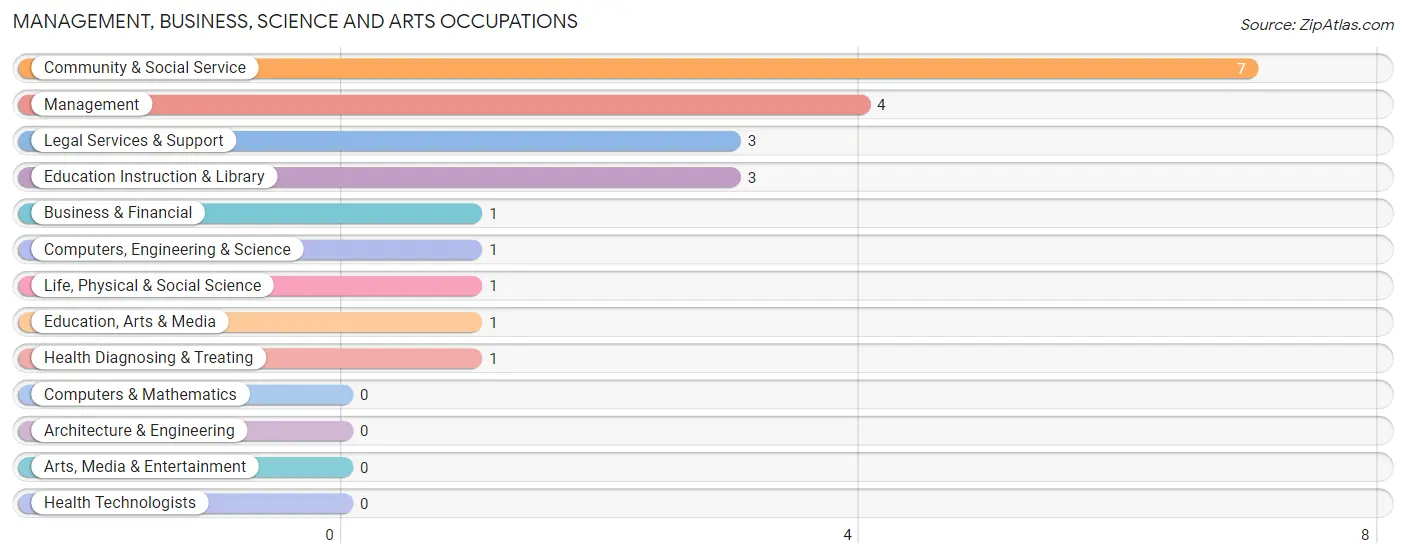
The most common Management, Business, Science and Arts occupations in Nespelem are Community & Social Service (7 | 15.2%), Management (4 | 8.7%), Legal Services & Support (3 | 6.5%), Education Instruction & Library (3 | 6.5%), and Business & Financial (1 | 2.2%).
Management, Business, Science and Arts Occupations by Sex
Within the Management, Business, Science and Arts occupations in Nespelem, the most male-oriented occupations are Business & Financial (100.0%), Computers, Engineering & Science (100.0%), and Life, Physical & Social Science (100.0%), while the most female-oriented occupations are Management (100.0%), Legal Services & Support (100.0%), and Education Instruction & Library (100.0%).
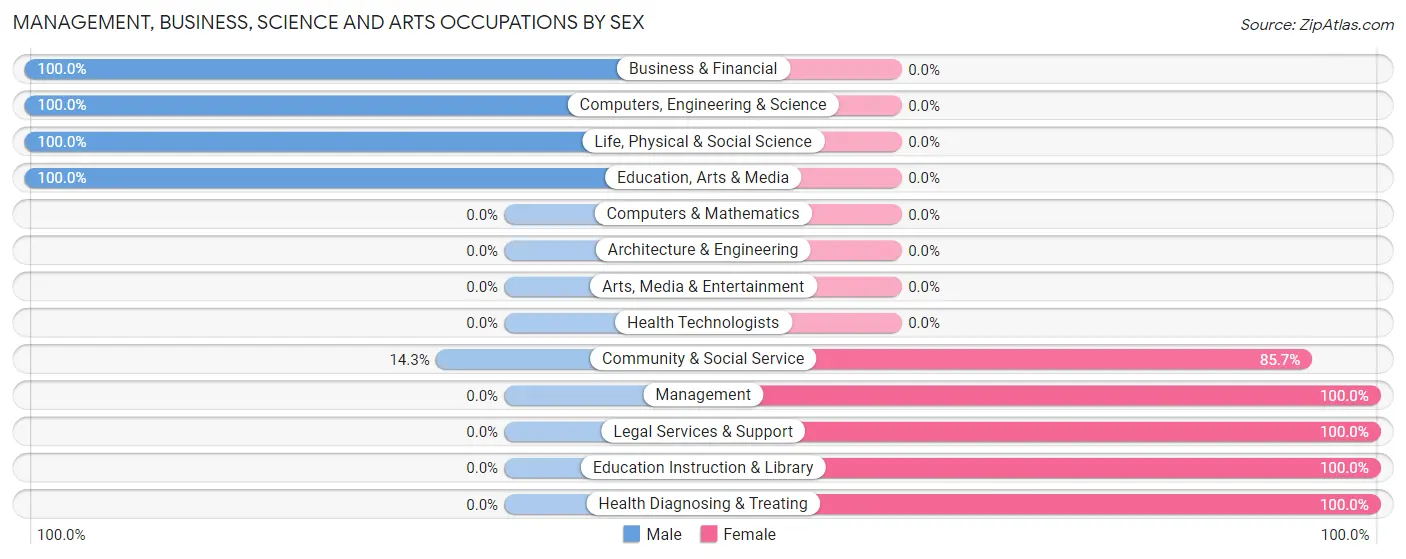
| Occupation | Male | Female |
| Management | 0 (0.0%) | 4 (100.0%) |
| Business & Financial | 1 (100.0%) | 0 (0.0%) |
| Computers, Engineering & Science | 1 (100.0%) | 0 (0.0%) |
| Computers & Mathematics | 0 (0.0%) | 0 (0.0%) |
| Architecture & Engineering | 0 (0.0%) | 0 (0.0%) |
| Life, Physical & Social Science | 1 (100.0%) | 0 (0.0%) |
| Community & Social Service | 1 (14.3%) | 6 (85.7%) |
| Education, Arts & Media | 1 (100.0%) | 0 (0.0%) |
| Legal Services & Support | 0 (0.0%) | 3 (100.0%) |
| Education Instruction & Library | 0 (0.0%) | 3 (100.0%) |
| Arts, Media & Entertainment | 0 (0.0%) | 0 (0.0%) |
| Health Diagnosing & Treating | 0 (0.0%) | 1 (100.0%) |
| Health Technologists | 0 (0.0%) | 0 (0.0%) |
| Total (Category) | 3 (21.4%) | 11 (78.6%) |
| Total (Overall) | 24 (52.2%) | 22 (47.8%) |
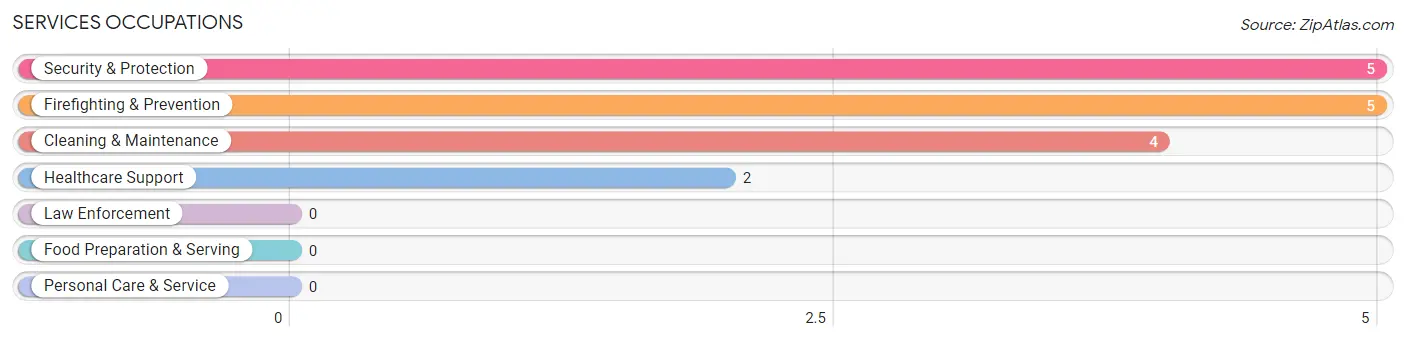
Services Occupations
The most common Services occupations in Nespelem are Security & Protection (5 | 10.9%), Firefighting & Prevention (5 | 10.9%), Cleaning & Maintenance (4 | 8.7%), and Healthcare Support (2 | 4.3%).
Services Occupations by Sex
Within the Services occupations in Nespelem, the most male-oriented occupations are Healthcare Support (100.0%), Security & Protection (60.0%), and Firefighting & Prevention (60.0%), while the most female-oriented occupations are Cleaning & Maintenance (50.0%), Security & Protection (40.0%), and Firefighting & Prevention (40.0%).
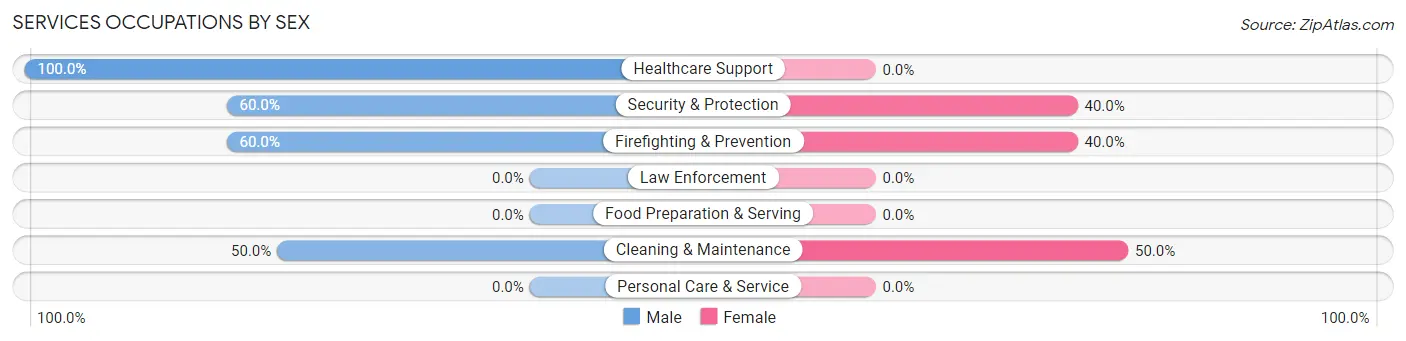
| Occupation | Male | Female |
| Healthcare Support | 2 (100.0%) | 0 (0.0%) |
| Security & Protection | 3 (60.0%) | 2 (40.0%) |
| Firefighting & Prevention | 3 (60.0%) | 2 (40.0%) |
| Law Enforcement | 0 (0.0%) | 0 (0.0%) |
| Food Preparation & Serving | 0 (0.0%) | 0 (0.0%) |
| Cleaning & Maintenance | 2 (50.0%) | 2 (50.0%) |
| Personal Care & Service | 0 (0.0%) | 0 (0.0%) |
| Total (Category) | 7 (63.6%) | 4 (36.4%) |
| Total (Overall) | 24 (52.2%) | 22 (47.8%) |
Sales and Office Occupations
The most common Sales and Office occupations in Nespelem are , and Office & Administration (7 | 15.2%).
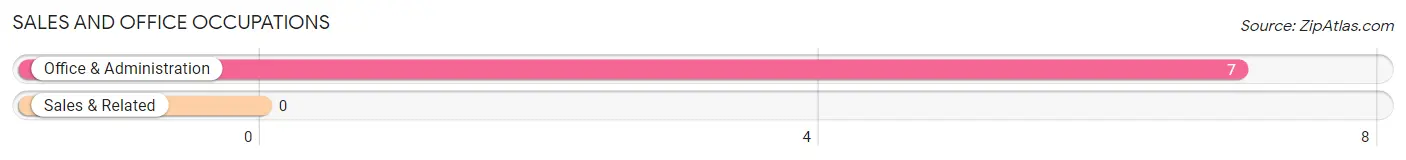
Sales and Office Occupations by Sex
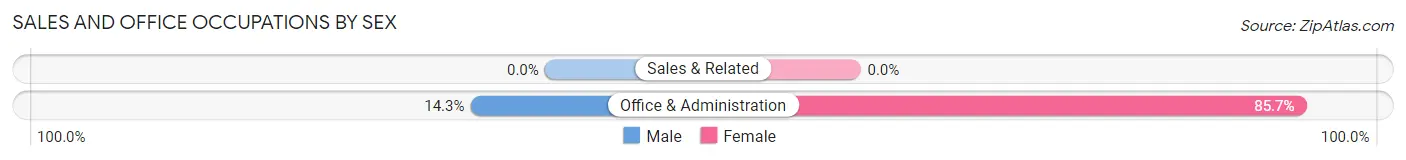
| Occupation | Male | Female |
| Sales & Related | 0 (0.0%) | 0 (0.0%) |
| Office & Administration | 1 (14.3%) | 6 (85.7%) |
| Total (Category) | 1 (14.3%) | 6 (85.7%) |
| Total (Overall) | 24 (52.2%) | 22 (47.8%) |
Natural Resources, Construction and Maintenance Occupations
The most common Natural Resources, Construction and Maintenance occupations in Nespelem are Installation, Maintenance & Repair (8 | 17.4%), and Construction & Extraction (1 | 2.2%).
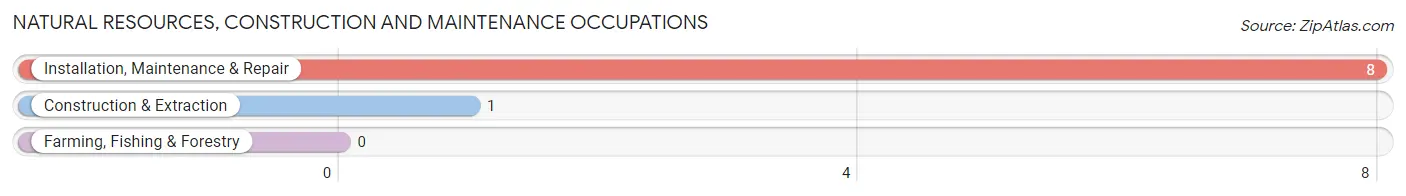
Natural Resources, Construction and Maintenance Occupations by Sex
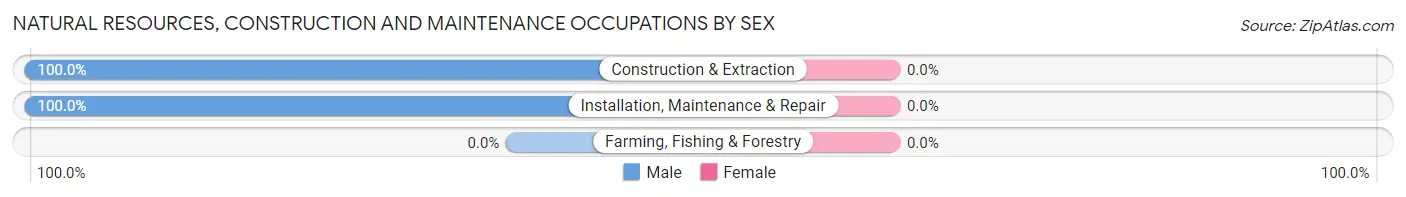
| Occupation | Male | Female |
| Farming, Fishing & Forestry | 0 (0.0%) | 0 (0.0%) |
| Construction & Extraction | 1 (100.0%) | 0 (0.0%) |
| Installation, Maintenance & Repair | 8 (100.0%) | 0 (0.0%) |
| Total (Category) | 9 (100.0%) | 0 (0.0%) |
| Total (Overall) | 24 (52.2%) | 22 (47.8%) |
Production, Transportation and Moving Occupations
The most common Production, Transportation and Moving occupations in Nespelem are Transportation (3 | 6.5%), Production (1 | 2.2%), and Material Moving (1 | 2.2%).
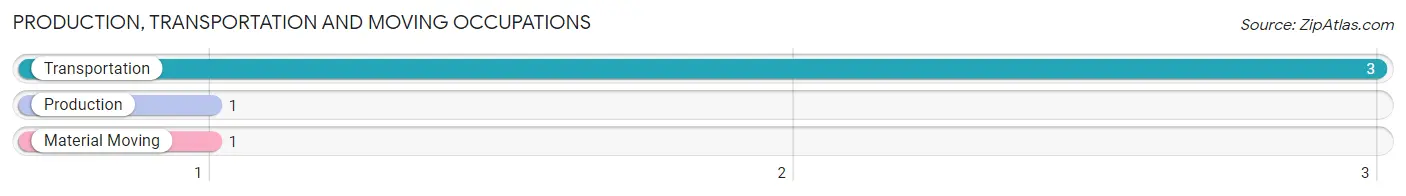
Production, Transportation and Moving Occupations by Sex
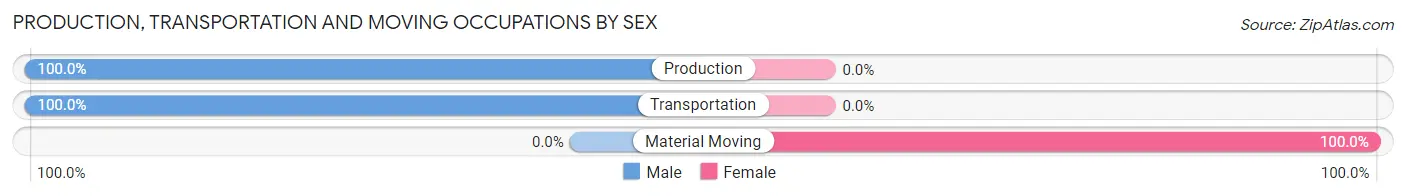
| Occupation | Male | Female |
| Production | 1 (100.0%) | 0 (0.0%) |
| Transportation | 3 (100.0%) | 0 (0.0%) |
| Material Moving | 0 (0.0%) | 1 (100.0%) |
| Total (Category) | 4 (80.0%) | 1 (20.0%) |
| Total (Overall) | 24 (52.2%) | 22 (47.8%) |
Employment Industries by Sex in Nespelem
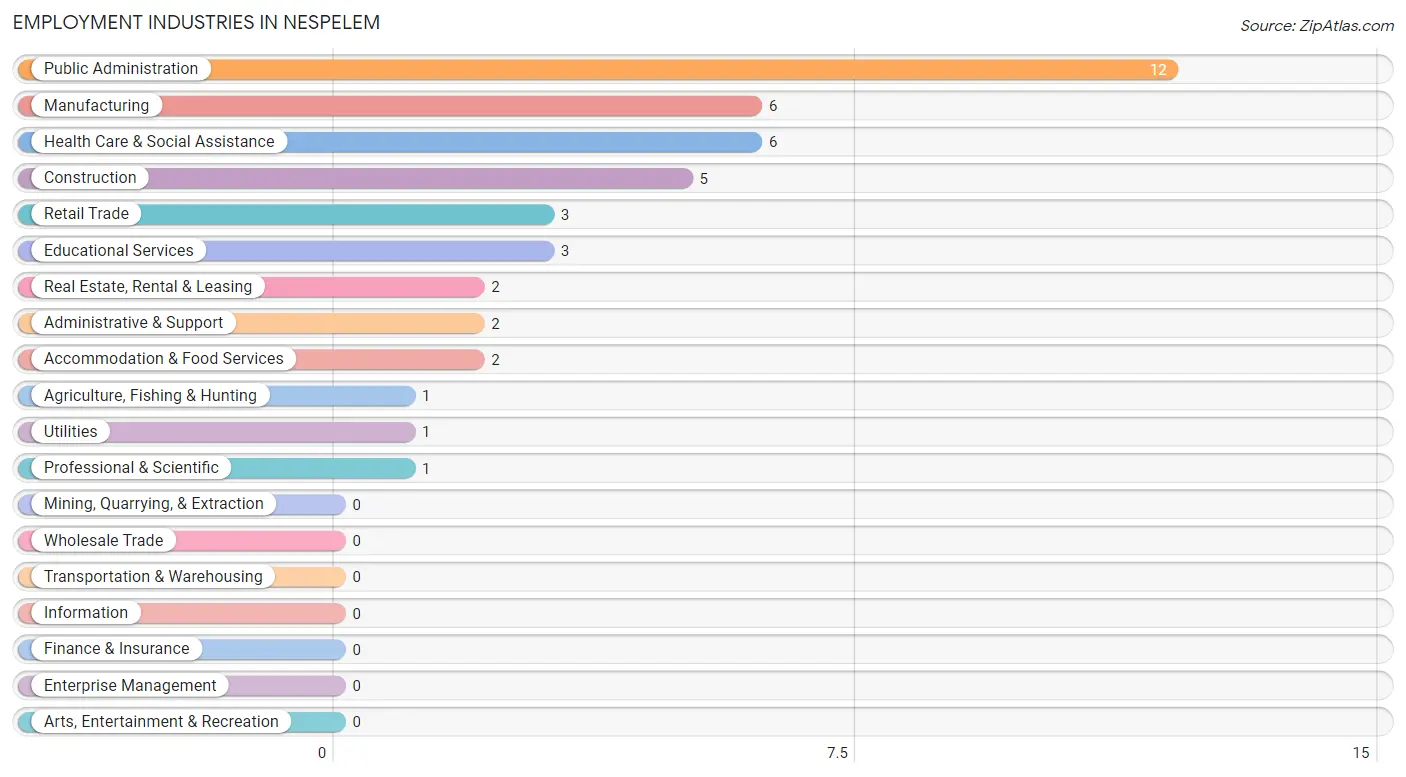
Employment Industries in Nespelem
The major employment industries in Nespelem include Public Administration (12 | 26.1%), Manufacturing (6 | 13.0%), Health Care & Social Assistance (6 | 13.0%), Construction (5 | 10.9%), and Retail Trade (3 | 6.5%).
Employment Industries by Sex in Nespelem
The Nespelem industries that see more men than women are Construction (100.0%), Manufacturing (100.0%), and Utilities (100.0%), whereas the industries that tend to have a higher number of women are Agriculture, Fishing & Hunting (100.0%), Retail Trade (100.0%), and Real Estate, Rental & Leasing (100.0%).
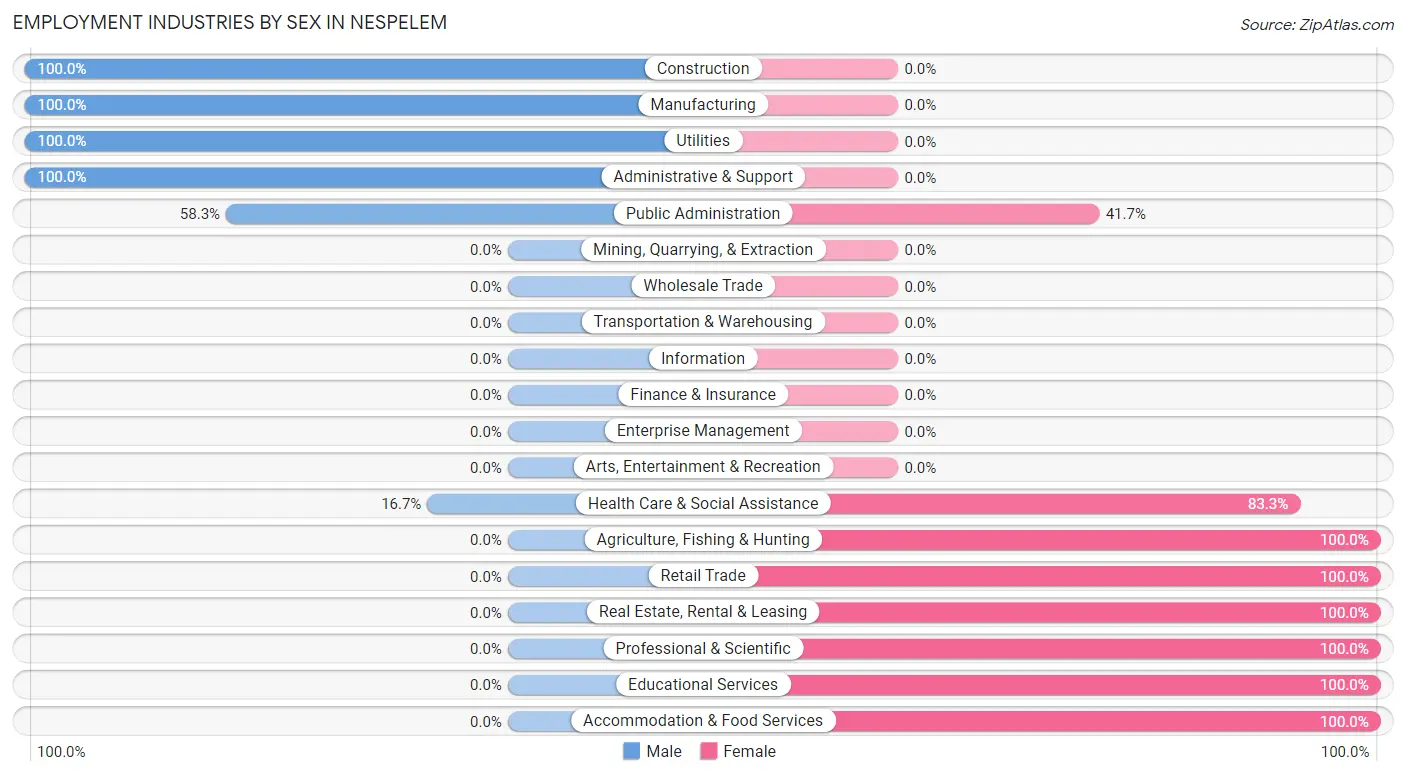
| Industry | Male | Female |
| Agriculture, Fishing & Hunting | 0 (0.0%) | 1 (100.0%) |
| Mining, Quarrying, & Extraction | 0 (0.0%) | 0 (0.0%) |
| Construction | 5 (100.0%) | 0 (0.0%) |
| Manufacturing | 6 (100.0%) | 0 (0.0%) |
| Wholesale Trade | 0 (0.0%) | 0 (0.0%) |
| Retail Trade | 0 (0.0%) | 3 (100.0%) |
| Transportation & Warehousing | 0 (0.0%) | 0 (0.0%) |
| Utilities | 1 (100.0%) | 0 (0.0%) |
| Information | 0 (0.0%) | 0 (0.0%) |
| Finance & Insurance | 0 (0.0%) | 0 (0.0%) |
| Real Estate, Rental & Leasing | 0 (0.0%) | 2 (100.0%) |
| Professional & Scientific | 0 (0.0%) | 1 (100.0%) |
| Enterprise Management | 0 (0.0%) | 0 (0.0%) |
| Administrative & Support | 2 (100.0%) | 0 (0.0%) |
| Educational Services | 0 (0.0%) | 3 (100.0%) |
| Health Care & Social Assistance | 1 (16.7%) | 5 (83.3%) |
| Arts, Entertainment & Recreation | 0 (0.0%) | 0 (0.0%) |
| Accommodation & Food Services | 0 (0.0%) | 2 (100.0%) |
| Public Administration | 7 (58.3%) | 5 (41.7%) |
| Total | 24 (52.2%) | 22 (47.8%) |
Education in Nespelem
School Enrollment in Nespelem
The most common levels of schooling among the 36 students in Nespelem are elementary school (9 | 25.0%), high school (9 | 25.0%), and middle school (6 | 16.7%).
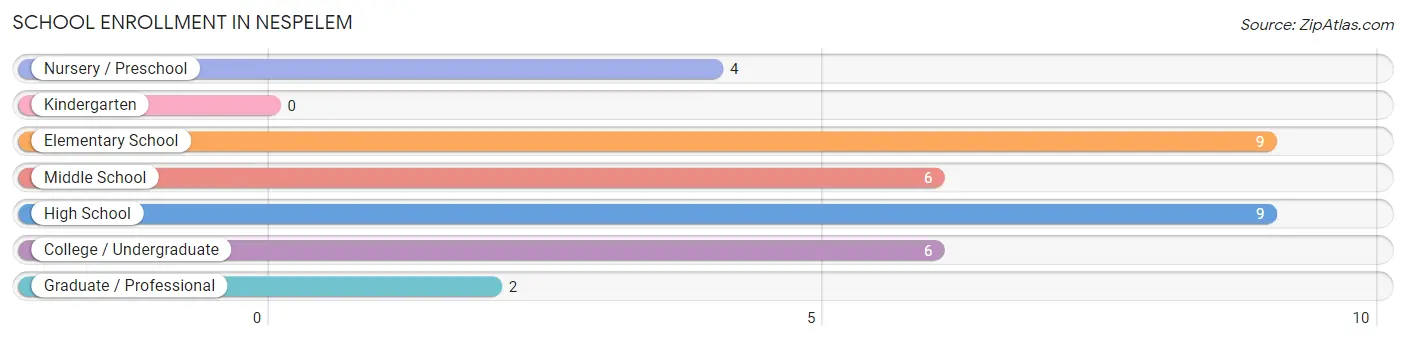
| School Level | # Students | % Students |
| Nursery / Preschool | 4 | 11.1% |
| Kindergarten | 0 | 0.0% |
| Elementary School | 9 | 25.0% |
| Middle School | 6 | 16.7% |
| High School | 9 | 25.0% |
| College / Undergraduate | 6 | 16.7% |
| Graduate / Professional | 2 | 5.6% |
| Total | 36 | 100.0% |
School Enrollment by Age by Funding Source in Nespelem
Out of a total of 36 students who are enrolled in schools in Nespelem, 8 (22.2%) attend a private institution, while the remaining 28 (77.8%) are enrolled in public schools. The age group of 25 to 34 year olds has the highest likelihood of being enrolled in private schools, with 6 (100.0% in the age bracket) enrolled. Conversely, the age group of 3 to 4 year olds has the lowest likelihood of being enrolled in a private school, with 3 (100.0% in the age bracket) attending a public institution.
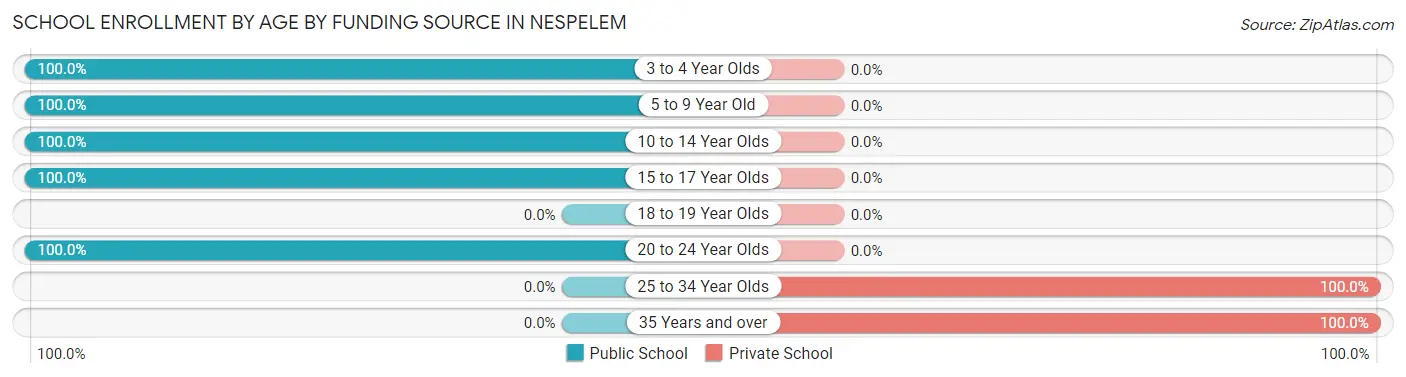
| Age Bracket | Public School | Private School |
| 3 to 4 Year Olds | 3 (100.0%) | 0 (0.0%) |
| 5 to 9 Year Old | 4 (100.0%) | 0 (0.0%) |
| 10 to 14 Year Olds | 13 (100.0%) | 0 (0.0%) |
| 15 to 17 Year Olds | 4 (100.0%) | 0 (0.0%) |
| 18 to 19 Year Olds | 0 (0.0%) | 0 (0.0%) |
| 20 to 24 Year Olds | 4 (100.0%) | 0 (0.0%) |
| 25 to 34 Year Olds | 0 (0.0%) | 6 (100.0%) |
| 35 Years and over | 0 (0.0%) | 2 (100.0%) |
| Total | 28 (77.8%) | 8 (22.2%) |
Educational Attainment by Field of Study in Nespelem
Education (5 | 41.7%), literature & languages (3 | 25.0%), bio, nature & agricultural (2 | 16.7%), physical & health sciences (1 | 8.3%), and visual & performing arts (1 | 8.3%) are the most common fields of study among 12 individuals in Nespelem who have obtained a bachelor's degree or higher.
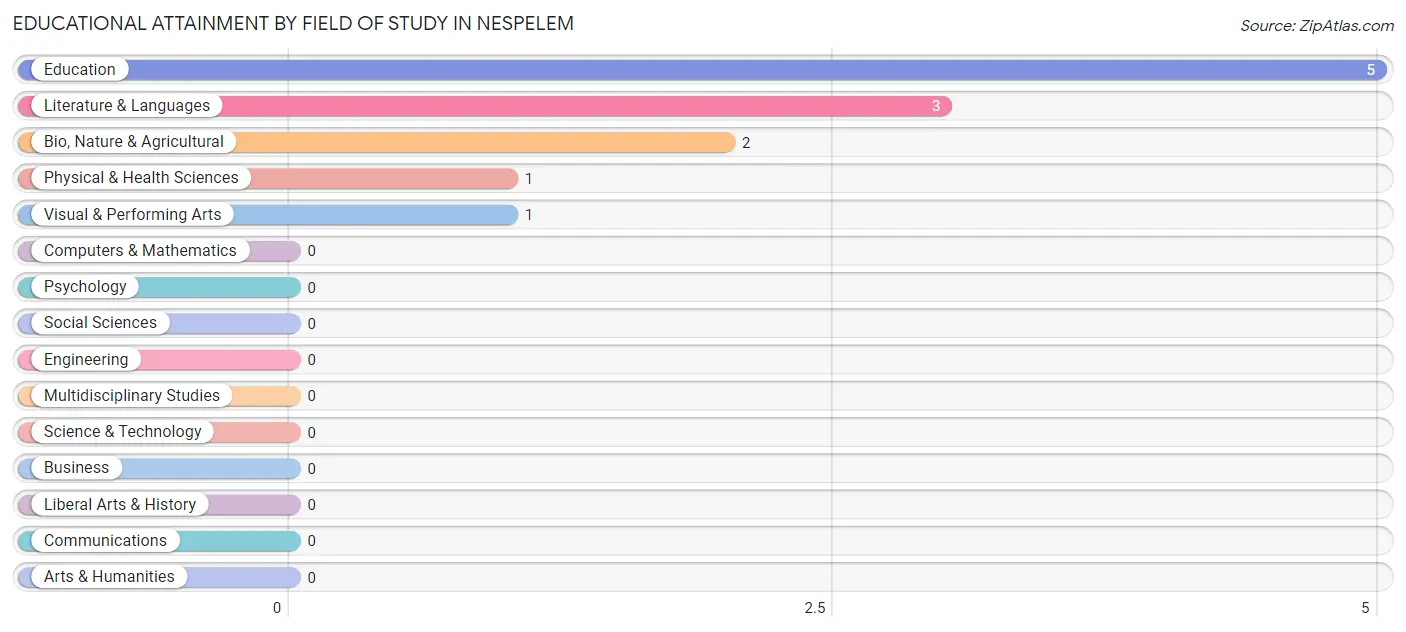
| Field of Study | # Graduates | % Graduates |
| Computers & Mathematics | 0 | 0.0% |
| Bio, Nature & Agricultural | 2 | 16.7% |
| Physical & Health Sciences | 1 | 8.3% |
| Psychology | 0 | 0.0% |
| Social Sciences | 0 | 0.0% |
| Engineering | 0 | 0.0% |
| Multidisciplinary Studies | 0 | 0.0% |
| Science & Technology | 0 | 0.0% |
| Business | 0 | 0.0% |
| Education | 5 | 41.7% |
| Literature & Languages | 3 | 25.0% |
| Liberal Arts & History | 0 | 0.0% |
| Visual & Performing Arts | 1 | 8.3% |
| Communications | 0 | 0.0% |
| Arts & Humanities | 0 | 0.0% |
| Total | 12 | 100.0% |
Transportation & Commute in Nespelem
Vehicle Availability by Sex in Nespelem
The most prevalent vehicle ownership categories in Nespelem are males with 3 vehicles (13, accounting for 56.5%) and females with 3 vehicles (6, making up 59.1%).
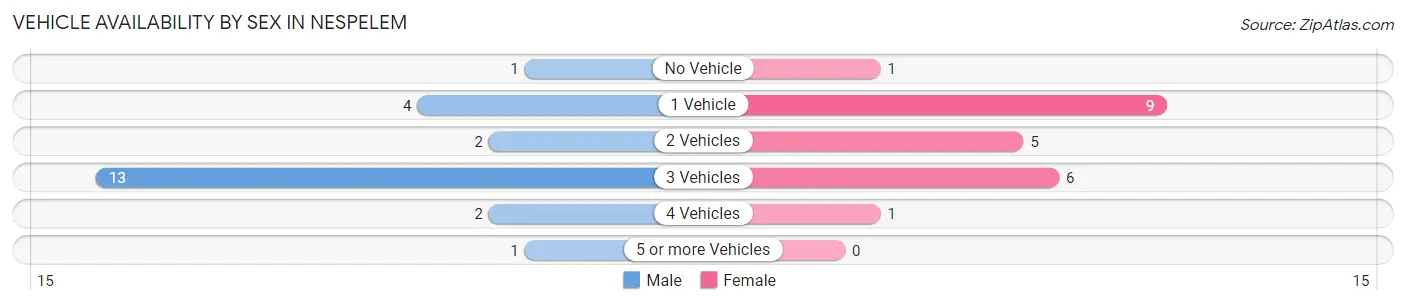
| Vehicles Available | Male | Female |
| No Vehicle | 1 (4.3%) | 1 (4.5%) |
| 1 Vehicle | 4 (17.4%) | 9 (40.9%) |
| 2 Vehicles | 2 (8.7%) | 5 (22.7%) |
| 3 Vehicles | 13 (56.5%) | 6 (27.3%) |
| 4 Vehicles | 2 (8.7%) | 1 (4.5%) |
| 5 or more Vehicles | 1 (4.3%) | 0 (0.0%) |
| Total | 23 (100.0%) | 22 (100.0%) |
Commute Time in Nespelem
The most frequently occuring commute durations in Nespelem are 5 to 9 minutes (17 commuters, 40.5%), 45 to 59 minutes (8 commuters, 19.1%), and less than 5 minutes (6 commuters, 14.3%).
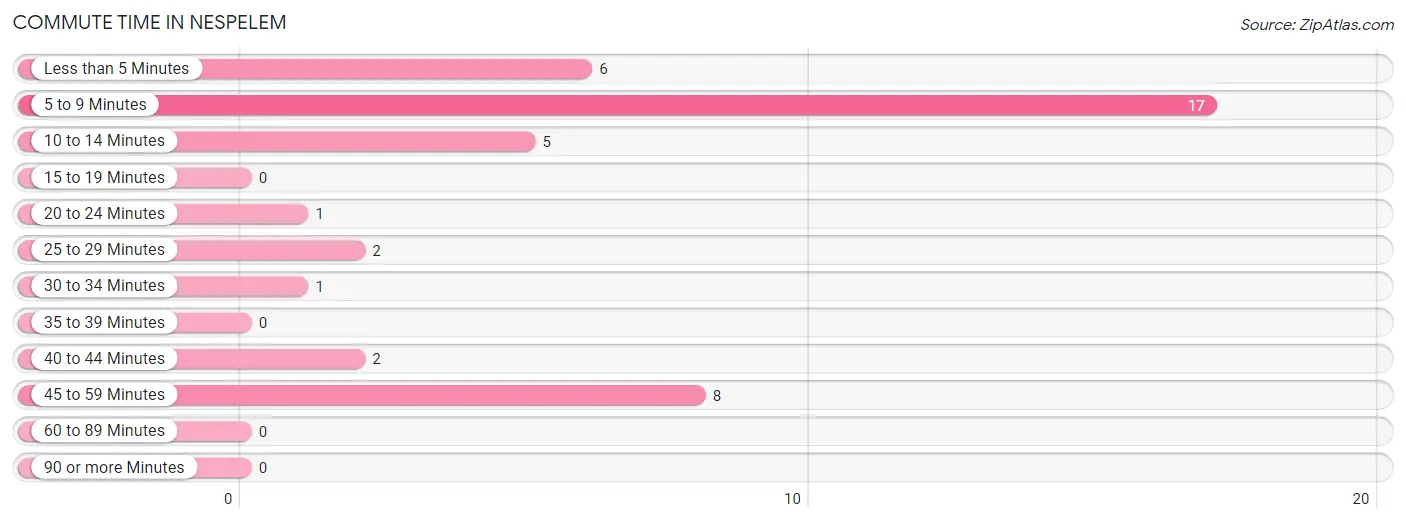
| Commute Time | # Commuters | % Commuters |
| Less than 5 Minutes | 6 | 14.3% |
| 5 to 9 Minutes | 17 | 40.5% |
| 10 to 14 Minutes | 5 | 11.9% |
| 15 to 19 Minutes | 0 | 0.0% |
| 20 to 24 Minutes | 1 | 2.4% |
| 25 to 29 Minutes | 2 | 4.8% |
| 30 to 34 Minutes | 1 | 2.4% |
| 35 to 39 Minutes | 0 | 0.0% |
| 40 to 44 Minutes | 2 | 4.8% |
| 45 to 59 Minutes | 8 | 19.1% |
| 60 to 89 Minutes | 0 | 0.0% |
| 90 or more Minutes | 0 | 0.0% |
Commute Time by Sex in Nespelem
The most common commute times in Nespelem are 5 to 9 minutes (10 commuters, 47.6%) for males and 5 to 9 minutes (7 commuters, 33.3%) for females.
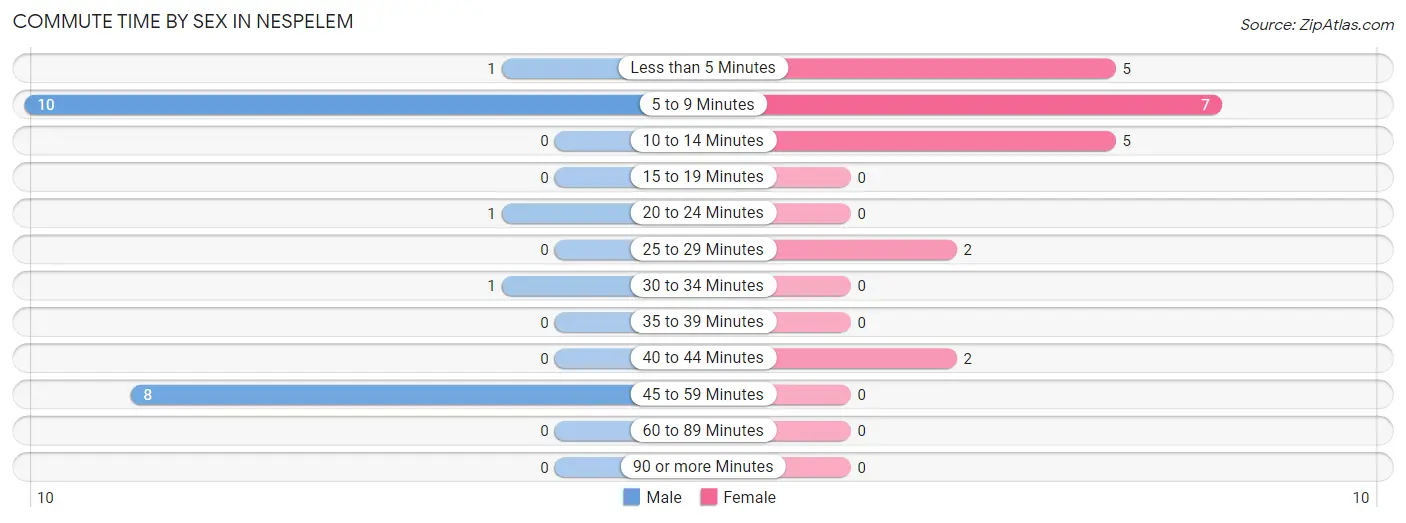
| Commute Time | Male | Female |
| Less than 5 Minutes | 1 (4.8%) | 5 (23.8%) |
| 5 to 9 Minutes | 10 (47.6%) | 7 (33.3%) |
| 10 to 14 Minutes | 0 (0.0%) | 5 (23.8%) |
| 15 to 19 Minutes | 0 (0.0%) | 0 (0.0%) |
| 20 to 24 Minutes | 1 (4.8%) | 0 (0.0%) |
| 25 to 29 Minutes | 0 (0.0%) | 2 (9.5%) |
| 30 to 34 Minutes | 1 (4.8%) | 0 (0.0%) |
| 35 to 39 Minutes | 0 (0.0%) | 0 (0.0%) |
| 40 to 44 Minutes | 0 (0.0%) | 2 (9.5%) |
| 45 to 59 Minutes | 8 (38.1%) | 0 (0.0%) |
| 60 to 89 Minutes | 0 (0.0%) | 0 (0.0%) |
| 90 or more Minutes | 0 (0.0%) | 0 (0.0%) |
Time of Departure to Work by Sex in Nespelem
The most frequent times of departure to work in Nespelem are 6:00 AM to 6:29 AM (8, 38.1%) for males and 7:30 AM to 7:59 AM (7, 33.3%) for females.
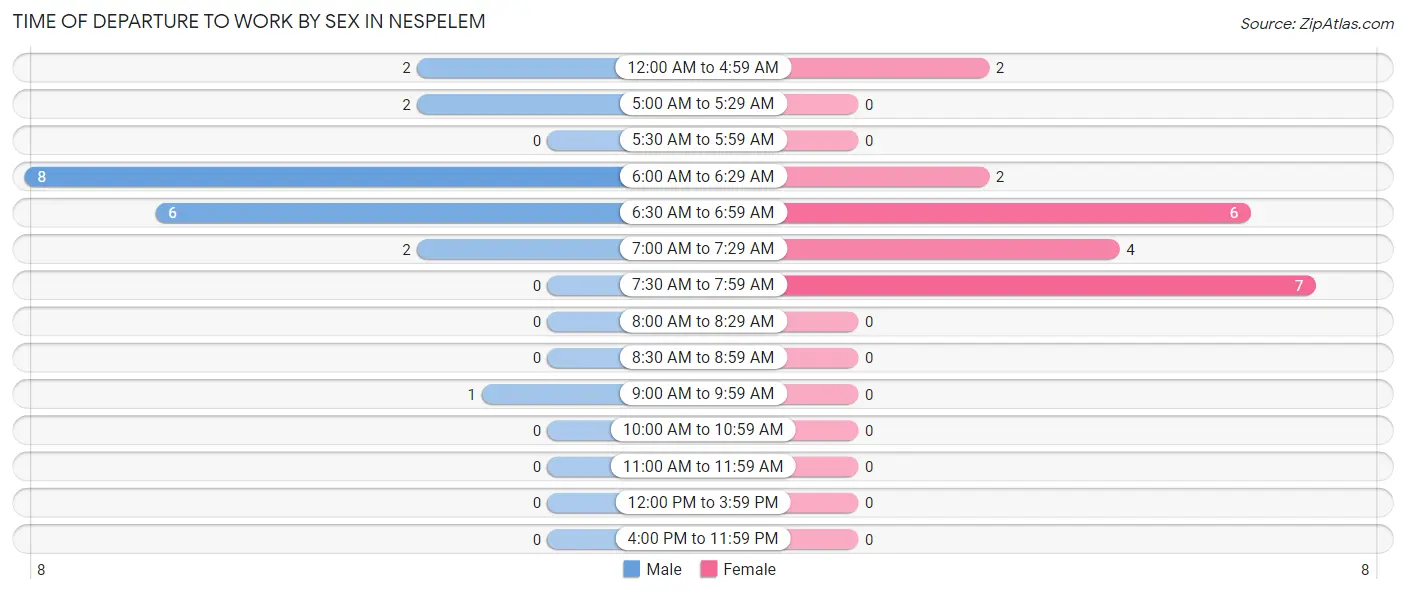
| Time of Departure | Male | Female |
| 12:00 AM to 4:59 AM | 2 (9.5%) | 2 (9.5%) |
| 5:00 AM to 5:29 AM | 2 (9.5%) | 0 (0.0%) |
| 5:30 AM to 5:59 AM | 0 (0.0%) | 0 (0.0%) |
| 6:00 AM to 6:29 AM | 8 (38.1%) | 2 (9.5%) |
| 6:30 AM to 6:59 AM | 6 (28.6%) | 6 (28.6%) |
| 7:00 AM to 7:29 AM | 2 (9.5%) | 4 (19.1%) |
| 7:30 AM to 7:59 AM | 0 (0.0%) | 7 (33.3%) |
| 8:00 AM to 8:29 AM | 0 (0.0%) | 0 (0.0%) |
| 8:30 AM to 8:59 AM | 0 (0.0%) | 0 (0.0%) |
| 9:00 AM to 9:59 AM | 1 (4.8%) | 0 (0.0%) |
| 10:00 AM to 10:59 AM | 0 (0.0%) | 0 (0.0%) |
| 11:00 AM to 11:59 AM | 0 (0.0%) | 0 (0.0%) |
| 12:00 PM to 3:59 PM | 0 (0.0%) | 0 (0.0%) |
| 4:00 PM to 11:59 PM | 0 (0.0%) | 0 (0.0%) |
| Total | 21 (100.0%) | 21 (100.0%) |
Housing Occupancy in Nespelem
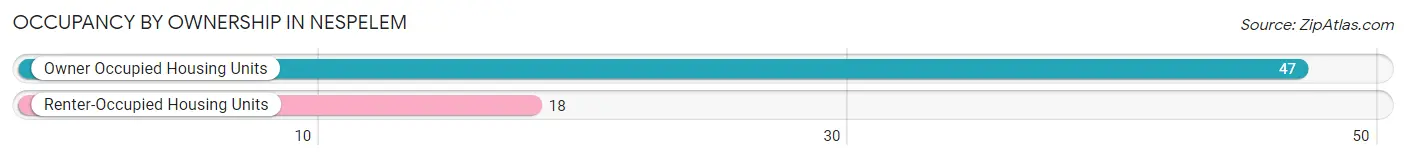
Occupancy by Ownership in Nespelem
Of the total 65 dwellings in Nespelem, owner-occupied units account for 47 (72.3%), while renter-occupied units make up 18 (27.7%).
| Occupancy | # Housing Units | % Housing Units |
| Owner Occupied Housing Units | 47 | 72.3% |
| Renter-Occupied Housing Units | 18 | 27.7% |
| Total Occupied Housing Units | 65 | 100.0% |
Occupancy by Household Size in Nespelem
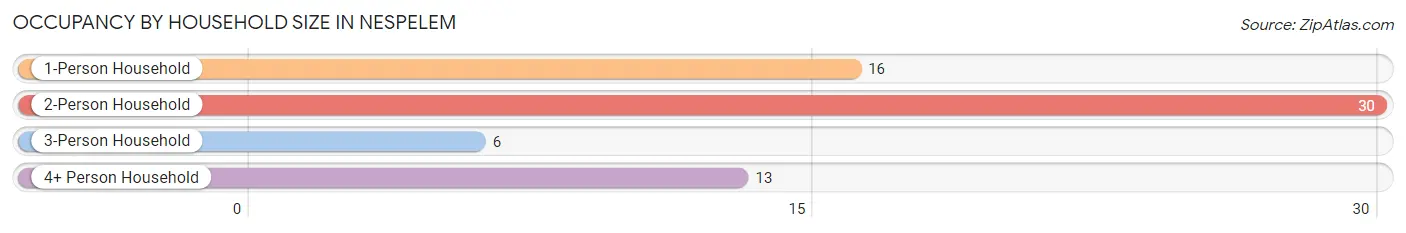
| Household Size | # Housing Units | % Housing Units |
| 1-Person Household | 16 | 24.6% |
| 2-Person Household | 30 | 46.2% |
| 3-Person Household | 6 | 9.2% |
| 4+ Person Household | 13 | 20.0% |
| Total Housing Units | 65 | 100.0% |
Occupancy by Ownership by Household Size in Nespelem

| Household Size | Owner-occupied | Renter-occupied |
| 1-Person Household | 14 (87.5%) | 2 (12.5%) |
| 2-Person Household | 22 (73.3%) | 8 (26.7%) |
| 3-Person Household | 5 (83.3%) | 1 (16.7%) |
| 4+ Person Household | 6 (46.2%) | 7 (53.8%) |
| Total Housing Units | 47 (72.3%) | 18 (27.7%) |
Occupancy by Educational Attainment in Nespelem
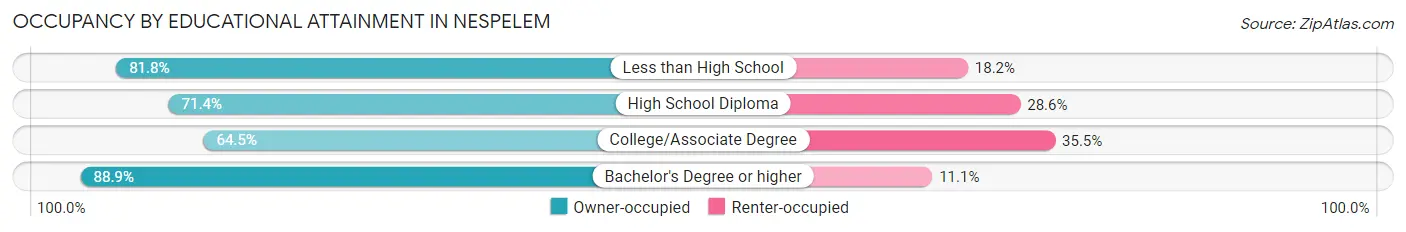
| Household Size | Owner-occupied | Renter-occupied |
| Less than High School | 9 (81.8%) | 2 (18.2%) |
| High School Diploma | 10 (71.4%) | 4 (28.6%) |
| College/Associate Degree | 20 (64.5%) | 11 (35.5%) |
| Bachelor's Degree or higher | 8 (88.9%) | 1 (11.1%) |
Occupancy by Age of Householder in Nespelem
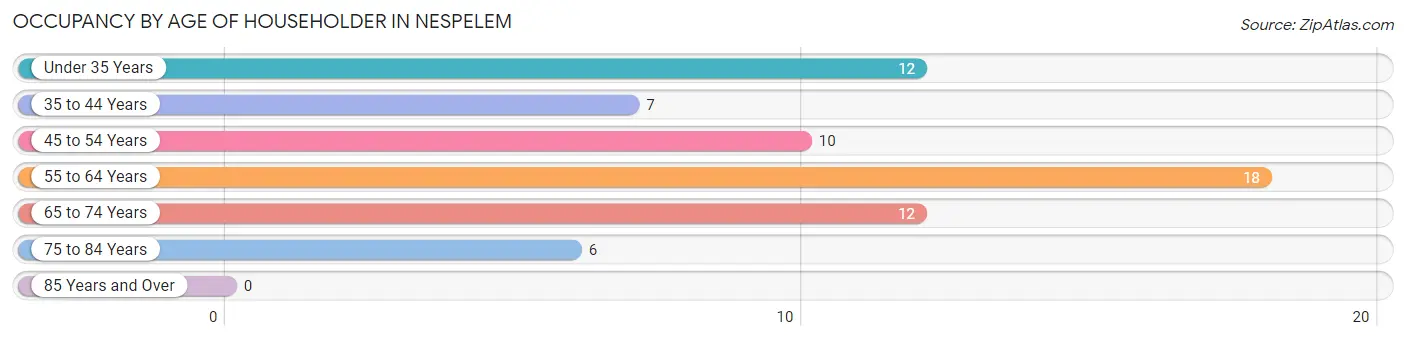
| Age Bracket | # Households | % Households |
| Under 35 Years | 12 | 18.5% |
| 35 to 44 Years | 7 | 10.8% |
| 45 to 54 Years | 10 | 15.4% |
| 55 to 64 Years | 18 | 27.7% |
| 65 to 74 Years | 12 | 18.5% |
| 75 to 84 Years | 6 | 9.2% |
| 85 Years and Over | 0 | 0.0% |
| Total | 65 | 100.0% |
Housing Finances in Nespelem
Median Income by Occupancy in Nespelem
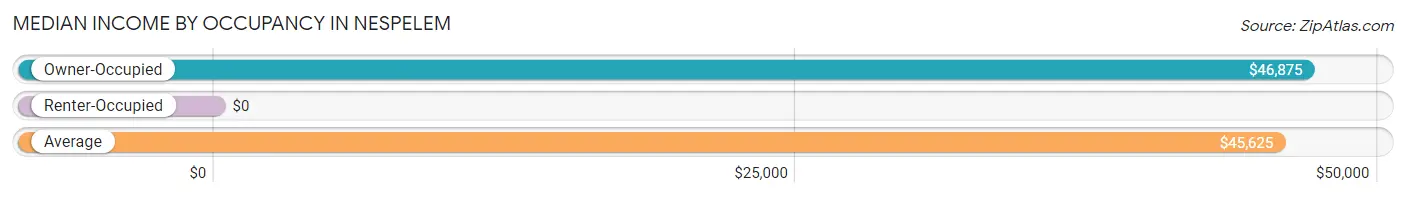
| Occupancy Type | # Households | Median Income |
| Owner-Occupied | 47 (72.3%) | $46,875 |
| Renter-Occupied | 18 (27.7%) | $0 |
| Average | 65 (100.0%) | $45,625 |
Occupancy by Householder Income Bracket in Nespelem
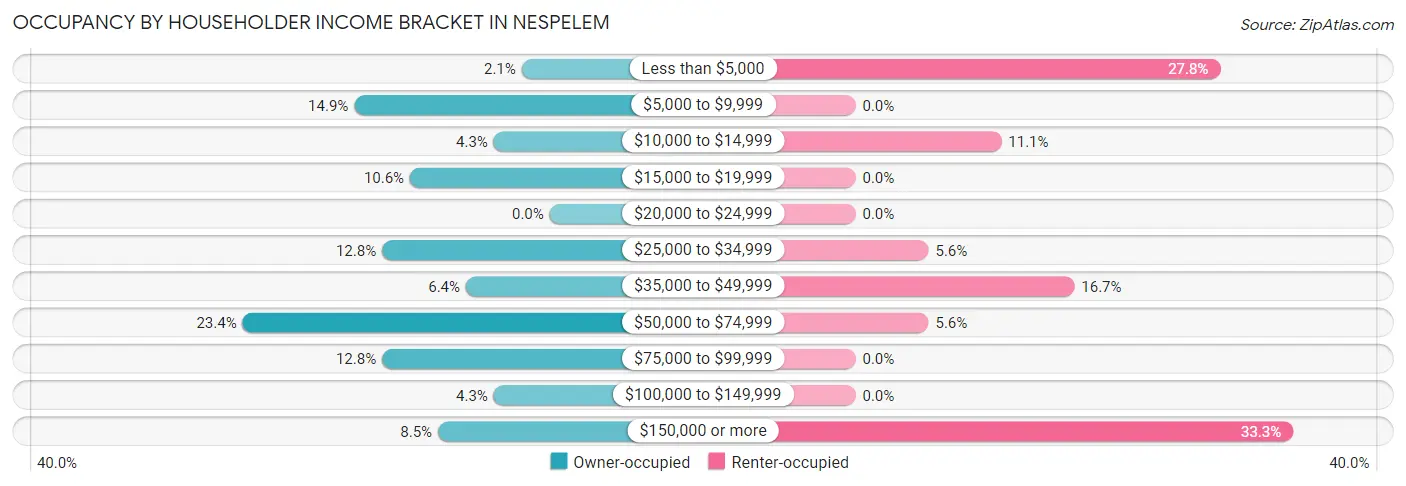
| Income Bracket | Owner-occupied | Renter-occupied |
| Less than $5,000 | 1 (2.1%) | 5 (27.8%) |
| $5,000 to $9,999 | 7 (14.9%) | 0 (0.0%) |
| $10,000 to $14,999 | 2 (4.3%) | 2 (11.1%) |
| $15,000 to $19,999 | 5 (10.6%) | 0 (0.0%) |
| $20,000 to $24,999 | 0 (0.0%) | 0 (0.0%) |
| $25,000 to $34,999 | 6 (12.8%) | 1 (5.6%) |
| $35,000 to $49,999 | 3 (6.4%) | 3 (16.7%) |
| $50,000 to $74,999 | 11 (23.4%) | 1 (5.6%) |
| $75,000 to $99,999 | 6 (12.8%) | 0 (0.0%) |
| $100,000 to $149,999 | 2 (4.3%) | 0 (0.0%) |
| $150,000 or more | 4 (8.5%) | 6 (33.3%) |
| Total | 47 (100.0%) | 18 (100.0%) |
Monthly Housing Cost Tiers in Nespelem
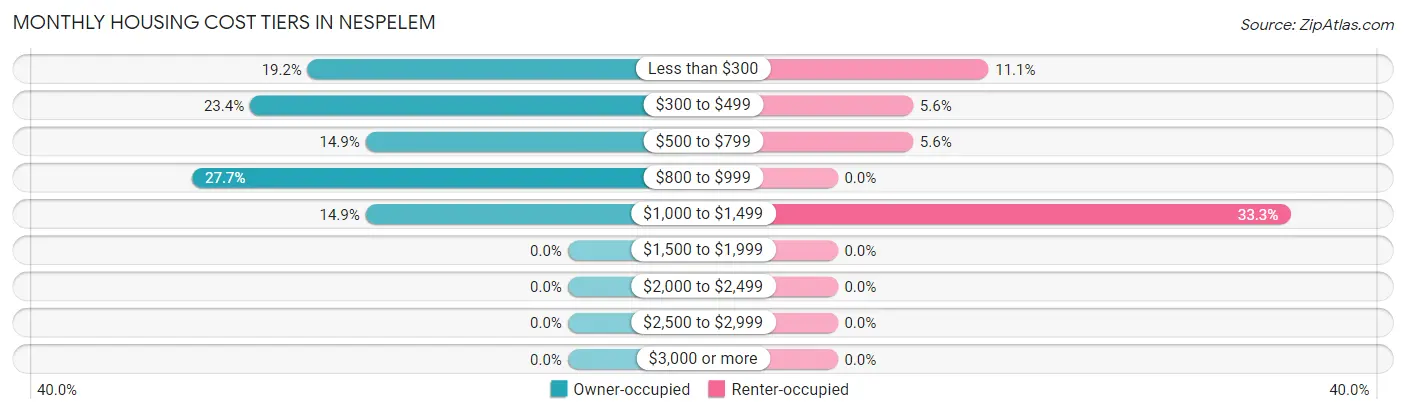
| Monthly Cost | Owner-occupied | Renter-occupied |
| Less than $300 | 9 (19.2%) | 2 (11.1%) |
| $300 to $499 | 11 (23.4%) | 1 (5.6%) |
| $500 to $799 | 7 (14.9%) | 1 (5.6%) |
| $800 to $999 | 13 (27.7%) | 0 (0.0%) |
| $1,000 to $1,499 | 7 (14.9%) | 6 (33.3%) |
| $1,500 to $1,999 | 0 (0.0%) | 0 (0.0%) |
| $2,000 to $2,499 | 0 (0.0%) | 0 (0.0%) |
| $2,500 to $2,999 | 0 (0.0%) | 0 (0.0%) |
| $3,000 or more | 0 (0.0%) | 0 (0.0%) |
| Total | 47 (100.0%) | 18 (100.0%) |
Physical Housing Characteristics in Nespelem
Housing Structures in Nespelem
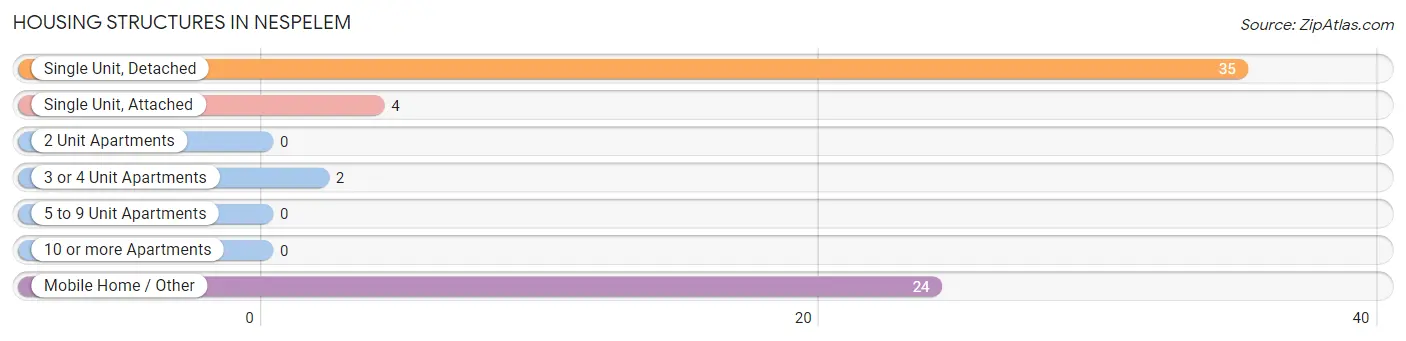
| Structure Type | # Housing Units | % Housing Units |
| Single Unit, Detached | 35 | 53.8% |
| Single Unit, Attached | 4 | 6.1% |
| 2 Unit Apartments | 0 | 0.0% |
| 3 or 4 Unit Apartments | 2 | 3.1% |
| 5 to 9 Unit Apartments | 0 | 0.0% |
| 10 or more Apartments | 0 | 0.0% |
| Mobile Home / Other | 24 | 36.9% |
| Total | 65 | 100.0% |
Housing Structures by Occupancy in Nespelem
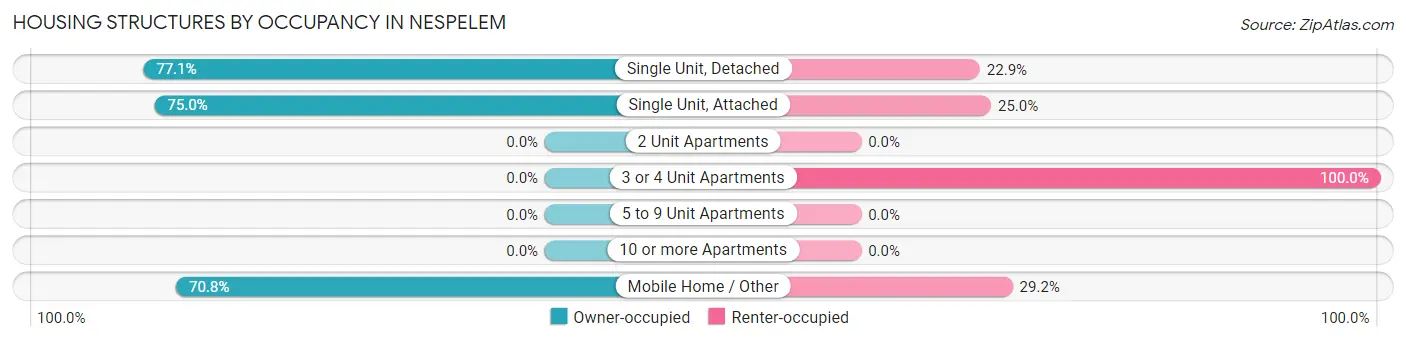
| Structure Type | Owner-occupied | Renter-occupied |
| Single Unit, Detached | 27 (77.1%) | 8 (22.9%) |
| Single Unit, Attached | 3 (75.0%) | 1 (25.0%) |
| 2 Unit Apartments | 0 (0.0%) | 0 (0.0%) |
| 3 or 4 Unit Apartments | 0 (0.0%) | 2 (100.0%) |
| 5 to 9 Unit Apartments | 0 (0.0%) | 0 (0.0%) |
| 10 or more Apartments | 0 (0.0%) | 0 (0.0%) |
| Mobile Home / Other | 17 (70.8%) | 7 (29.2%) |
| Total | 47 (72.3%) | 18 (27.7%) |
Housing Structures by Number of Rooms in Nespelem
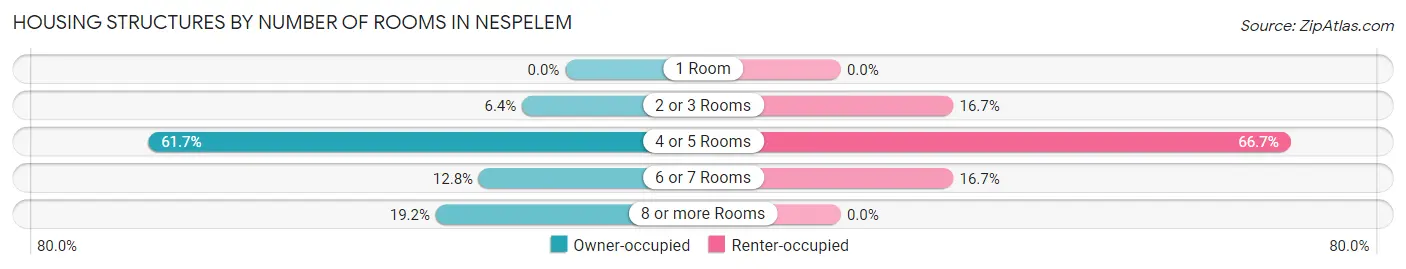
| Number of Rooms | Owner-occupied | Renter-occupied |
| 1 Room | 0 (0.0%) | 0 (0.0%) |
| 2 or 3 Rooms | 3 (6.4%) | 3 (16.7%) |
| 4 or 5 Rooms | 29 (61.7%) | 12 (66.7%) |
| 6 or 7 Rooms | 6 (12.8%) | 3 (16.7%) |
| 8 or more Rooms | 9 (19.2%) | 0 (0.0%) |
| Total | 47 (100.0%) | 18 (100.0%) |
Housing Structure by Heating Type in Nespelem
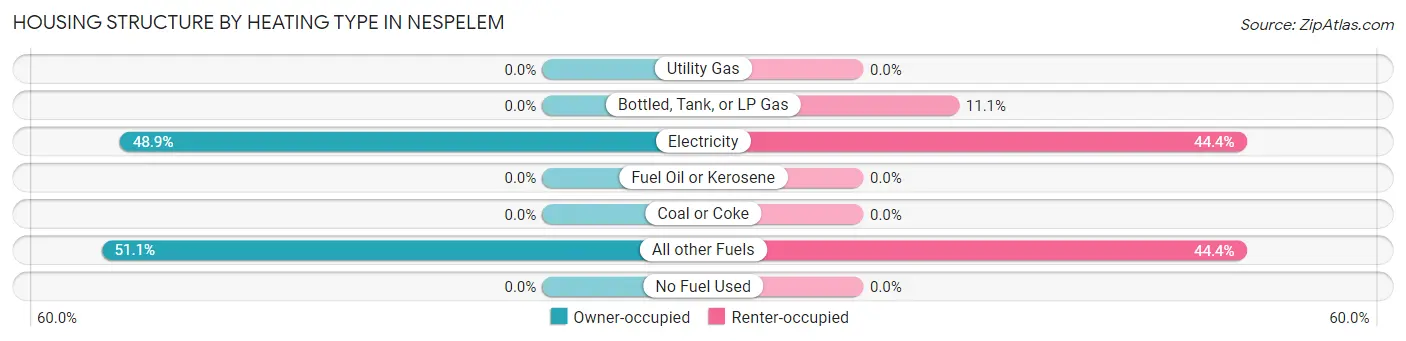
| Heating Type | Owner-occupied | Renter-occupied |
| Utility Gas | 0 (0.0%) | 0 (0.0%) |
| Bottled, Tank, or LP Gas | 0 (0.0%) | 2 (11.1%) |
| Electricity | 23 (48.9%) | 8 (44.4%) |
| Fuel Oil or Kerosene | 0 (0.0%) | 0 (0.0%) |
| Coal or Coke | 0 (0.0%) | 0 (0.0%) |
| All other Fuels | 24 (51.1%) | 8 (44.4%) |
| No Fuel Used | 0 (0.0%) | 0 (0.0%) |
| Total | 47 (100.0%) | 18 (100.0%) |
Household Vehicle Usage in Nespelem
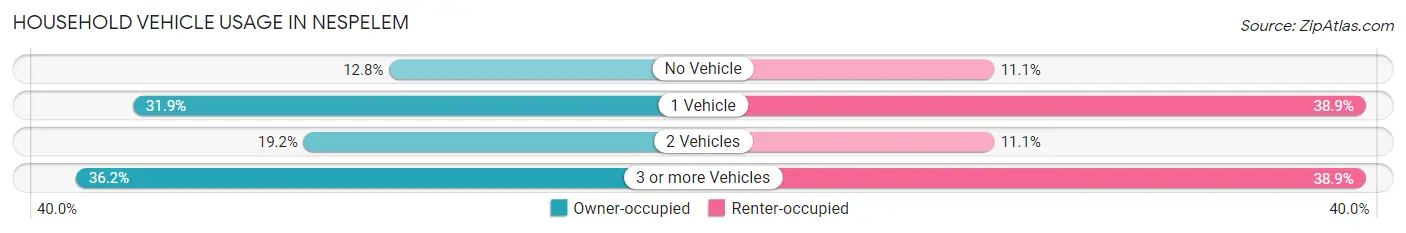
| Vehicles per Household | Owner-occupied | Renter-occupied |
| No Vehicle | 6 (12.8%) | 2 (11.1%) |
| 1 Vehicle | 15 (31.9%) | 7 (38.9%) |
| 2 Vehicles | 9 (19.2%) | 2 (11.1%) |
| 3 or more Vehicles | 17 (36.2%) | 7 (38.9%) |
| Total | 47 (100.0%) | 18 (100.0%) |
Real Estate & Mortgages in Nespelem
Real Estate and Mortgage Overview in Nespelem
| Characteristic | Without Mortgage | With Mortgage |
| Housing Units | 31 | 16 |
| Median Property Value | - | - |
| Median Household Income | $26,750 | $2 |
| Monthly Housing Costs | $442 | $0 |
| Real Estate Taxes | - | - |
Property Value by Mortgage Status in Nespelem
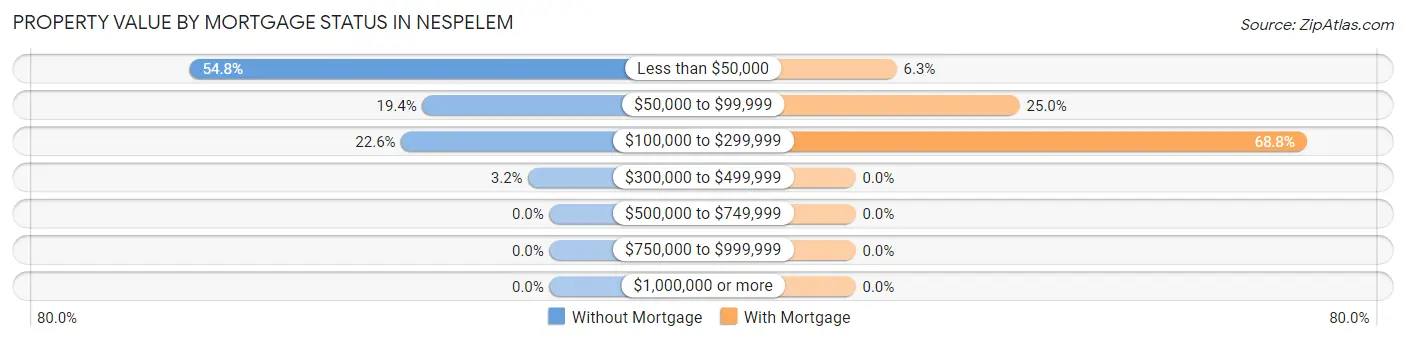
| Property Value | Without Mortgage | With Mortgage |
| Less than $50,000 | 17 (54.8%) | 1 (6.2%) |
| $50,000 to $99,999 | 6 (19.4%) | 4 (25.0%) |
| $100,000 to $299,999 | 7 (22.6%) | 11 (68.8%) |
| $300,000 to $499,999 | 1 (3.2%) | 0 (0.0%) |
| $500,000 to $749,999 | 0 (0.0%) | 0 (0.0%) |
| $750,000 to $999,999 | 0 (0.0%) | 0 (0.0%) |
| $1,000,000 or more | 0 (0.0%) | 0 (0.0%) |
| Total | 31 (100.0%) | 16 (100.0%) |
Household Income by Mortgage Status in Nespelem
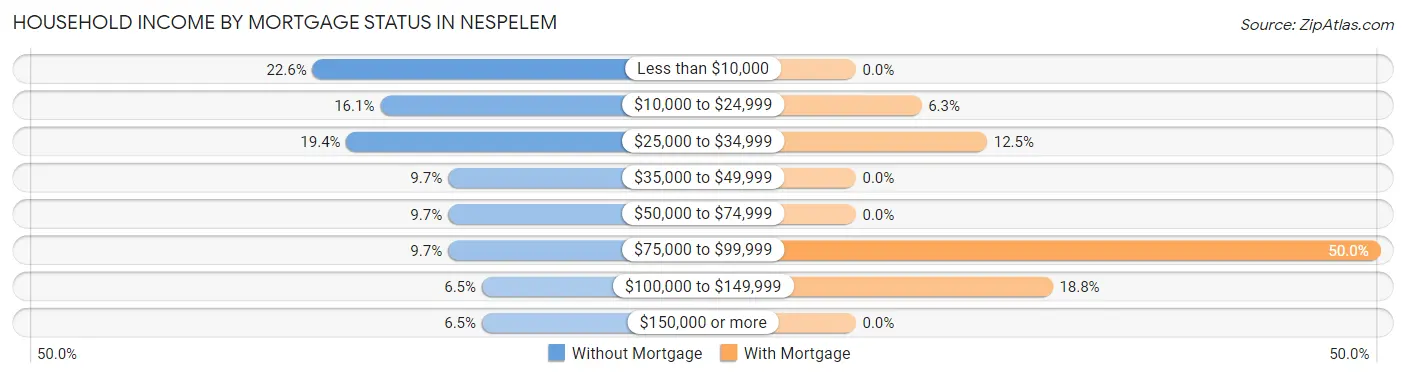
| Household Income | Without Mortgage | With Mortgage |
| Less than $10,000 | 7 (22.6%) | 0 (0.0%) |
| $10,000 to $24,999 | 5 (16.1%) | 1 (6.2%) |
| $25,000 to $34,999 | 6 (19.4%) | 2 (12.5%) |
| $35,000 to $49,999 | 3 (9.7%) | 0 (0.0%) |
| $50,000 to $74,999 | 3 (9.7%) | 0 (0.0%) |
| $75,000 to $99,999 | 3 (9.7%) | 8 (50.0%) |
| $100,000 to $149,999 | 2 (6.5%) | 3 (18.8%) |
| $150,000 or more | 2 (6.5%) | 0 (0.0%) |
| Total | 31 (100.0%) | 16 (100.0%) |
Property Value to Household Income Ratio in Nespelem
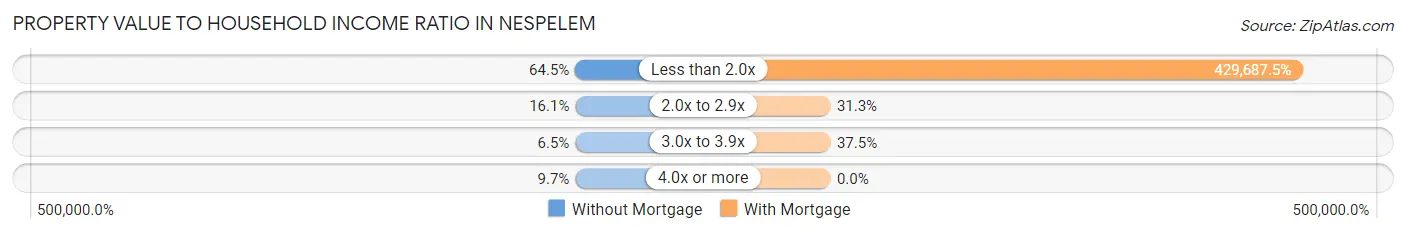
| Value-to-Income Ratio | Without Mortgage | With Mortgage |
| Less than 2.0x | 20 (64.5%) | 68,750 (429,687.5%) |
| 2.0x to 2.9x | 5 (16.1%) | 5 (31.2%) |
| 3.0x to 3.9x | 2 (6.5%) | 6 (37.5%) |
| 4.0x or more | 3 (9.7%) | 0 (0.0%) |
| Total | 31 (100.0%) | 16 (100.0%) |
Real Estate Taxes by Mortgage Status in Nespelem
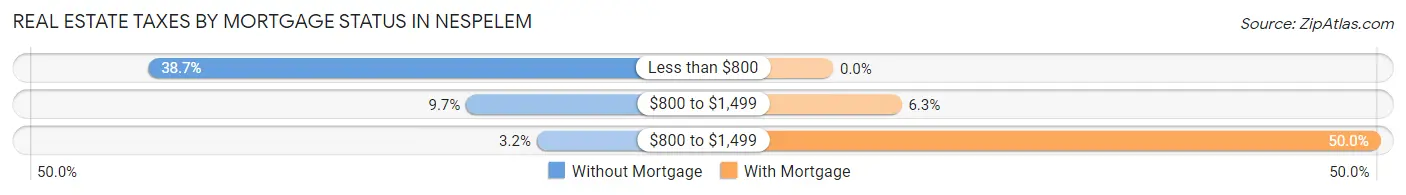
| Property Taxes | Without Mortgage | With Mortgage |
| Less than $800 | 12 (38.7%) | 0 (0.0%) |
| $800 to $1,499 | 3 (9.7%) | 1 (6.2%) |
| $800 to $1,499 | 1 (3.2%) | 8 (50.0%) |
| Total | 31 (100.0%) | 16 (100.0%) |
Health & Disability in Nespelem
Health Insurance Coverage by Age in Nespelem
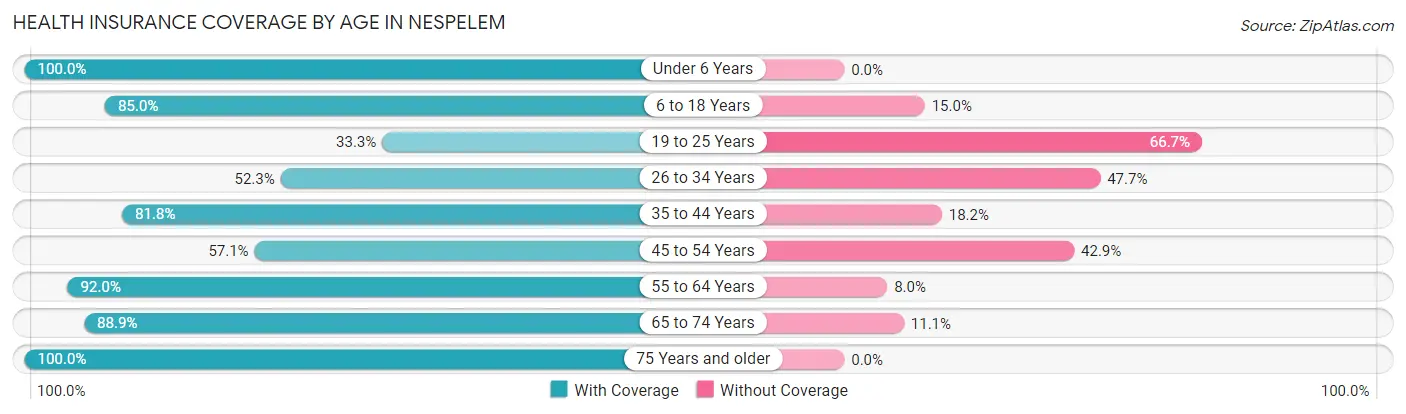
| Age Bracket | With Coverage | Without Coverage |
| Under 6 Years | 9 (100.0%) | 0 (0.0%) |
| 6 to 18 Years | 17 (85.0%) | 3 (15.0%) |
| 19 to 25 Years | 2 (33.3%) | 4 (66.7%) |
| 26 to 34 Years | 23 (52.3%) | 21 (47.7%) |
| 35 to 44 Years | 9 (81.8%) | 2 (18.2%) |
| 45 to 54 Years | 8 (57.1%) | 6 (42.9%) |
| 55 to 64 Years | 23 (92.0%) | 2 (8.0%) |
| 65 to 74 Years | 16 (88.9%) | 2 (11.1%) |
| 75 Years and older | 8 (100.0%) | 0 (0.0%) |
| Total | 115 (74.2%) | 40 (25.8%) |
Health Insurance Coverage by Citizenship Status in Nespelem
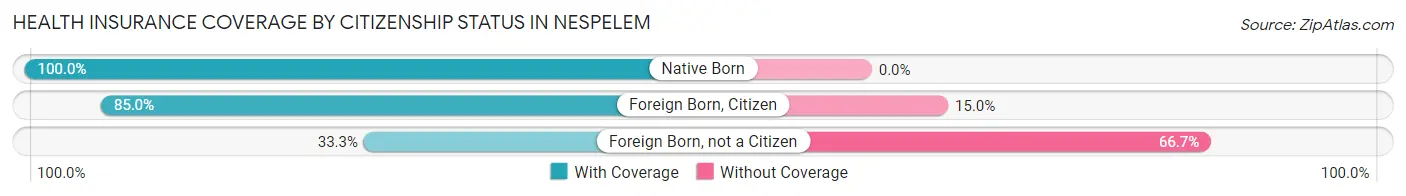
| Citizenship Status | With Coverage | Without Coverage |
| Native Born | 9 (100.0%) | 0 (0.0%) |
| Foreign Born, Citizen | 17 (85.0%) | 3 (15.0%) |
| Foreign Born, not a Citizen | 2 (33.3%) | 4 (66.7%) |
Health Insurance Coverage by Household Income in Nespelem
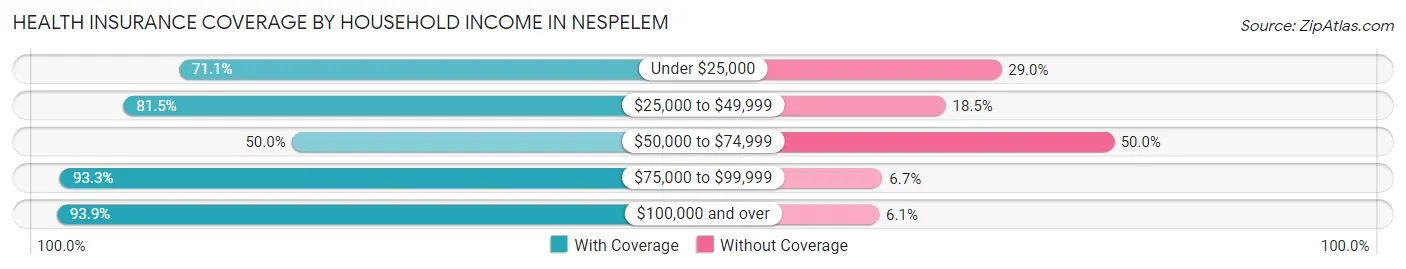
| Household Income | With Coverage | Without Coverage |
| Under $25,000 | 27 (71.1%) | 11 (28.9%) |
| $25,000 to $49,999 | 22 (81.5%) | 5 (18.5%) |
| $50,000 to $74,999 | 21 (50.0%) | 21 (50.0%) |
| $75,000 to $99,999 | 14 (93.3%) | 1 (6.7%) |
| $100,000 and over | 31 (93.9%) | 2 (6.1%) |
Public vs Private Health Insurance Coverage by Age in Nespelem
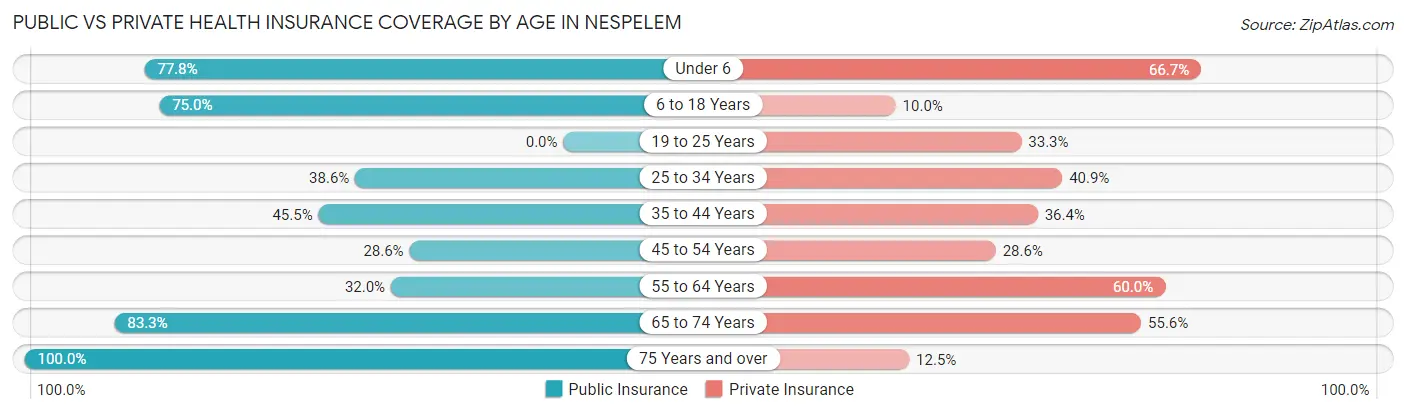
| Age Bracket | Public Insurance | Private Insurance |
| Under 6 | 7 (77.8%) | 6 (66.7%) |
| 6 to 18 Years | 15 (75.0%) | 2 (10.0%) |
| 19 to 25 Years | 0 (0.0%) | 2 (33.3%) |
| 25 to 34 Years | 17 (38.6%) | 18 (40.9%) |
| 35 to 44 Years | 5 (45.5%) | 4 (36.4%) |
| 45 to 54 Years | 4 (28.6%) | 4 (28.6%) |
| 55 to 64 Years | 8 (32.0%) | 15 (60.0%) |
| 65 to 74 Years | 15 (83.3%) | 10 (55.6%) |
| 75 Years and over | 8 (100.0%) | 1 (12.5%) |
| Total | 79 (51.0%) | 62 (40.0%) |
Disability Status by Sex by Age in Nespelem
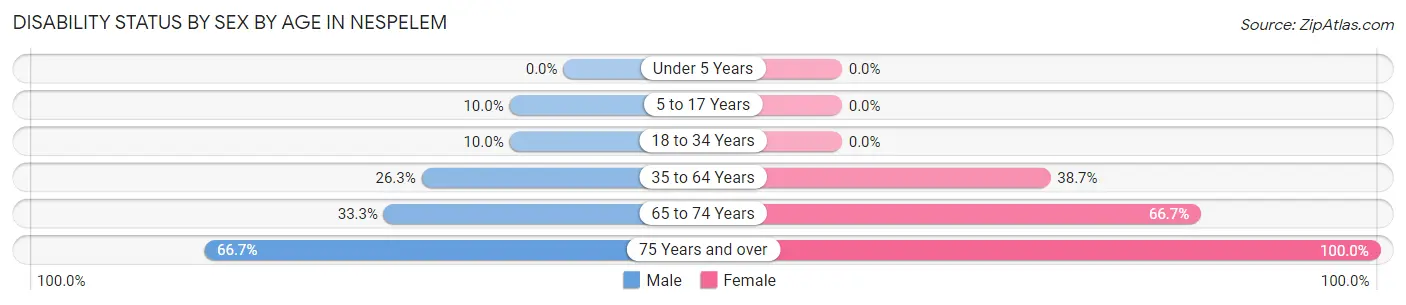
| Age Bracket | Male | Female |
| Under 5 Years | 0 (0.0%) | 0 (0.0%) |
| 5 to 17 Years | 1 (10.0%) | 0 (0.0%) |
| 18 to 34 Years | 2 (10.0%) | 0 (0.0%) |
| 35 to 64 Years | 5 (26.3%) | 12 (38.7%) |
| 65 to 74 Years | 4 (33.3%) | 4 (66.7%) |
| 75 Years and over | 4 (66.7%) | 2 (100.0%) |
Disability Class by Sex by Age in Nespelem
Disability Class: Hearing Difficulty
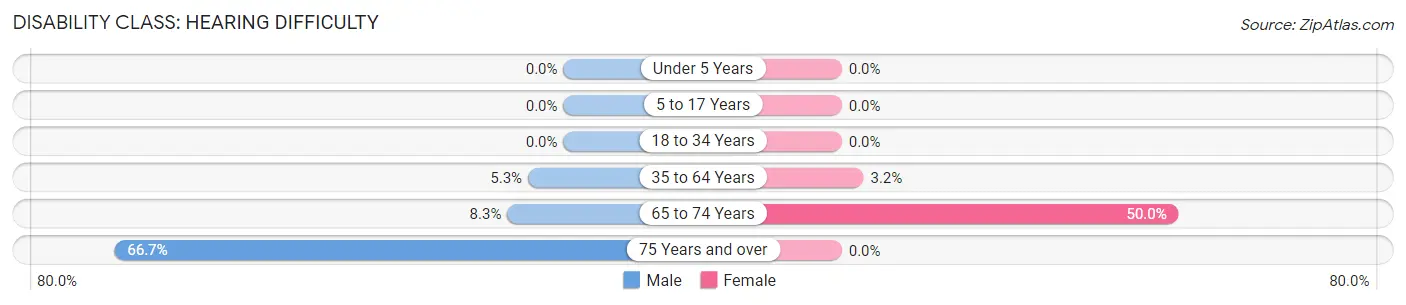
| Age Bracket | Male | Female |
| Under 5 Years | 0 (0.0%) | 0 (0.0%) |
| 5 to 17 Years | 0 (0.0%) | 0 (0.0%) |
| 18 to 34 Years | 0 (0.0%) | 0 (0.0%) |
| 35 to 64 Years | 1 (5.3%) | 1 (3.2%) |
| 65 to 74 Years | 1 (8.3%) | 3 (50.0%) |
| 75 Years and over | 4 (66.7%) | 0 (0.0%) |
Disability Class: Vision Difficulty
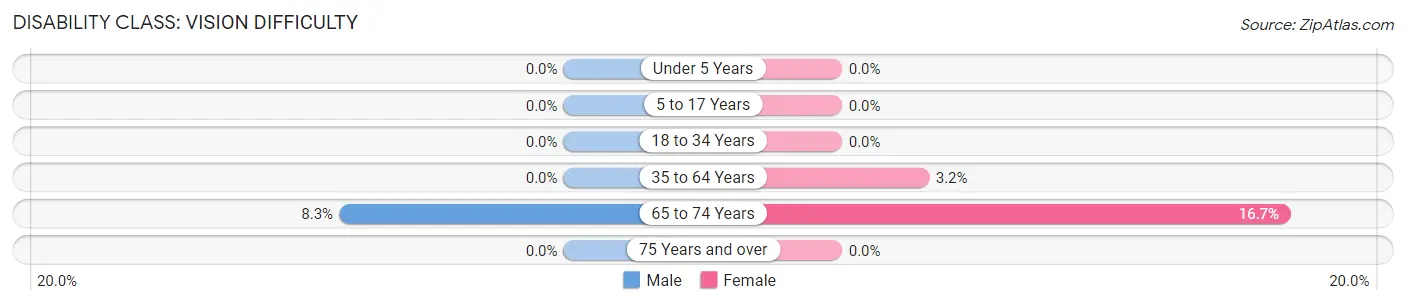
| Age Bracket | Male | Female |
| Under 5 Years | 0 (0.0%) | 0 (0.0%) |
| 5 to 17 Years | 0 (0.0%) | 0 (0.0%) |
| 18 to 34 Years | 0 (0.0%) | 0 (0.0%) |
| 35 to 64 Years | 0 (0.0%) | 1 (3.2%) |
| 65 to 74 Years | 1 (8.3%) | 1 (16.7%) |
| 75 Years and over | 0 (0.0%) | 0 (0.0%) |
Disability Class: Cognitive Difficulty
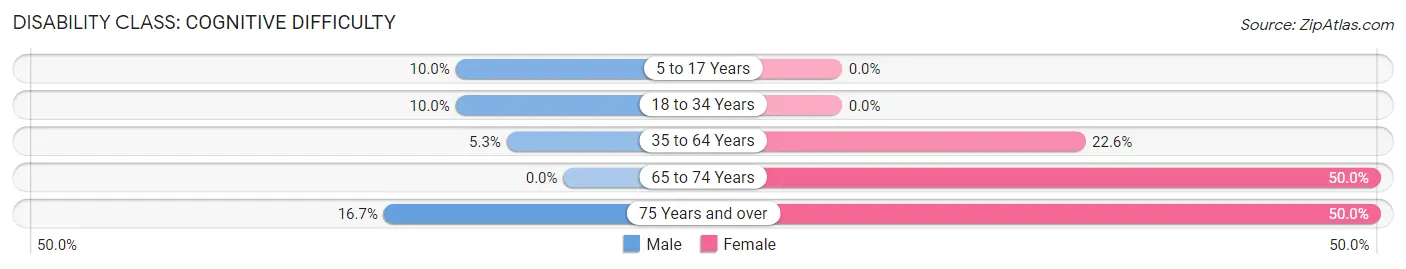
| Age Bracket | Male | Female |
| 5 to 17 Years | 1 (10.0%) | 0 (0.0%) |
| 18 to 34 Years | 2 (10.0%) | 0 (0.0%) |
| 35 to 64 Years | 1 (5.3%) | 7 (22.6%) |
| 65 to 74 Years | 0 (0.0%) | 3 (50.0%) |
| 75 Years and over | 1 (16.7%) | 1 (50.0%) |
Disability Class: Ambulatory Difficulty
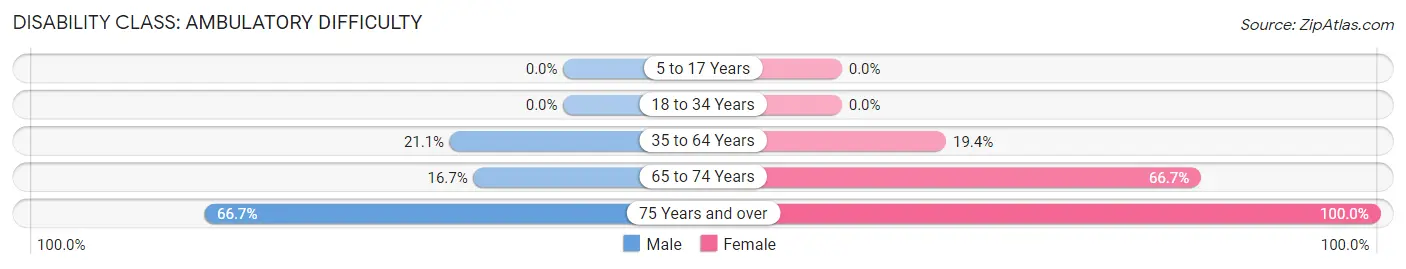
| Age Bracket | Male | Female |
| 5 to 17 Years | 0 (0.0%) | 0 (0.0%) |
| 18 to 34 Years | 0 (0.0%) | 0 (0.0%) |
| 35 to 64 Years | 4 (21.0%) | 6 (19.4%) |
| 65 to 74 Years | 2 (16.7%) | 4 (66.7%) |
| 75 Years and over | 4 (66.7%) | 2 (100.0%) |
Disability Class: Self-Care Difficulty
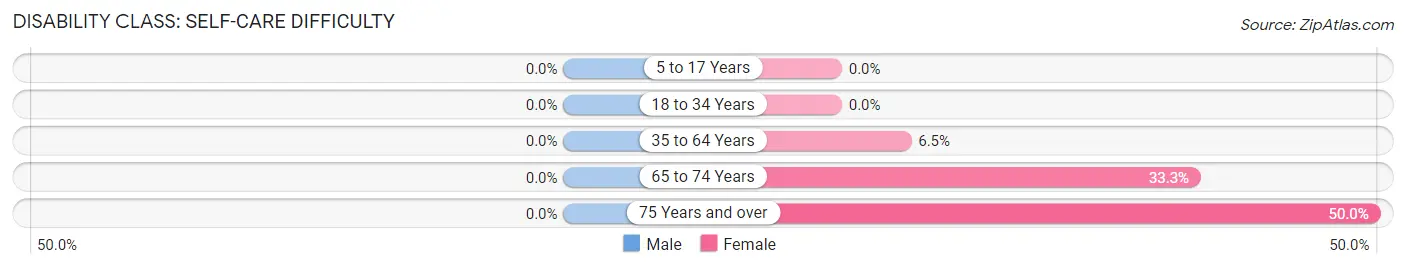
| Age Bracket | Male | Female |
| 5 to 17 Years | 0 (0.0%) | 0 (0.0%) |
| 18 to 34 Years | 0 (0.0%) | 0 (0.0%) |
| 35 to 64 Years | 0 (0.0%) | 2 (6.5%) |
| 65 to 74 Years | 0 (0.0%) | 2 (33.3%) |
| 75 Years and over | 0 (0.0%) | 1 (50.0%) |
Technology Access in Nespelem
Computing Device Access in Nespelem
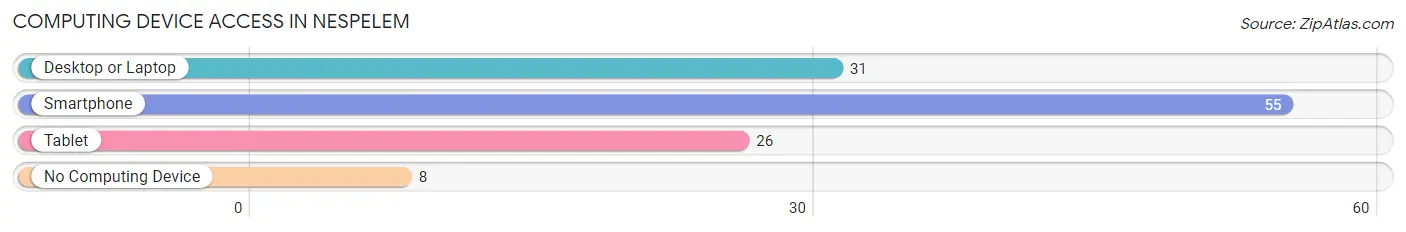
| Device Type | # Households | % Households |
| Desktop or Laptop | 31 | 47.7% |
| Smartphone | 55 | 84.6% |
| Tablet | 26 | 40.0% |
| No Computing Device | 8 | 12.3% |
| Total | 65 | 100.0% |
Internet Access in Nespelem
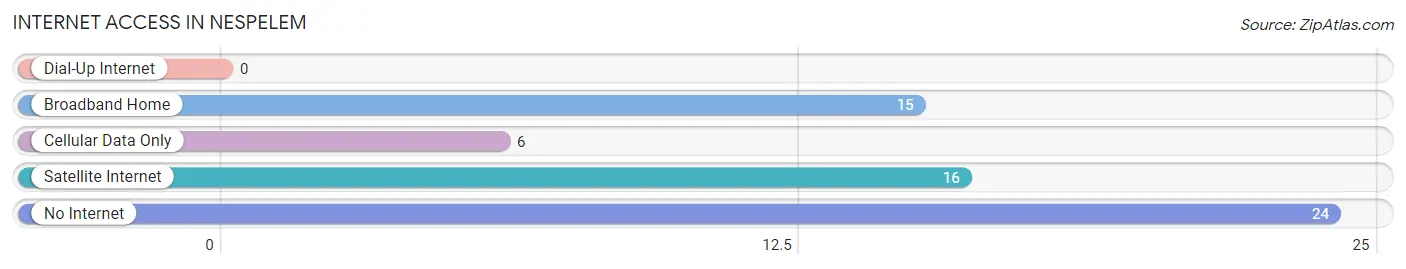
| Internet Type | # Households | % Households |
| Dial-Up Internet | 0 | 0.0% |
| Broadband Home | 15 | 23.1% |
| Cellular Data Only | 6 | 9.2% |
| Satellite Internet | 16 | 24.6% |
| No Internet | 24 | 36.9% |
| Total | 65 | 100.0% |
Nespelem Summary
Nespelem is a small unincorporated community located in the Colville Indian Reservation in Okanogan County, Washington. It is located on the banks of the Columbia River, about 20 miles south of the Canadian border. The population of Nespelem was 545 at the 2010 census.
History
The area around Nespelem has been inhabited by Native Americans for thousands of years. The Colville Indian Reservation was established in 1872, and the town of Nespelem was founded in 1891. The name Nespelem is derived from the Salish word for “place of the sun”.
The town was originally a trading post for the local Native American tribes, and it was also a stop on the Northern Pacific Railroad. In the early 1900s, Nespelem was a bustling town with a hotel, a general store, a post office, and a school.
In the 1950s, the Grand Coulee Dam was built on the Columbia River, flooding much of the surrounding area. This caused the population of Nespelem to decline, as many of the residents were forced to relocate.
Geography
Nespelem is located in the Colville Indian Reservation in Okanogan County, Washington. It is situated on the banks of the Columbia River, about 20 miles south of the Canadian border. The town is surrounded by rolling hills and grasslands, and is located in a semi-arid climate.
The nearest major city is Spokane, which is about 100 miles to the south. The nearest airport is the Spokane International Airport, which is about 90 miles away.
Economy
The economy of Nespelem is largely based on agriculture and tourism. The town is home to several farms, which produce a variety of crops, including wheat, barley, and hay. The town also has a small tourism industry, with visitors coming to enjoy the area’s natural beauty and outdoor activities.
The Colville Indian Reservation is home to several businesses, including a casino, a gas station, and a grocery store. The reservation also has a small industrial park, which is home to several manufacturing companies.
Demographics
As of the 2010 census, the population of Nespelem was 545. The racial makeup of the town was 95.3% Native American, 2.2% White, 0.2% African American, 0.2% Asian, and 2.1% from other races.
The median household income in Nespelem was $25,000, and the median family income was $30,000. The per capita income was $13,000. About 24.3% of the population was below the poverty line.
Conclusion
Nespelem is a small unincorporated community located in the Colville Indian Reservation in Okanogan County, Washington. It is situated on the banks of the Columbia River, about 20 miles south of the Canadian border. The population of Nespelem was 545 at the 2010 census. The economy of Nespelem is largely based on agriculture and tourism, and the racial makeup of the town is 95.3% Native American. The median household income in Nespelem was $25,000, and the per capita income was $13,000.
Common Questions
What is Per Capita Income in Nespelem?
Per Capita income in Nespelem is $26,637.
What is the Median Family Income in Nespelem?
Median Family Income in Nespelem is $50,000.
What is the Median Household income in Nespelem?
Median Household Income in Nespelem is $45,625.
What is Income or Wage Gap in Nespelem?
Income or Wage Gap in Nespelem is 6.6%.
Women in Nespelem earn 93.4 cents for every dollar earned by a man.
What is Inequality or Gini Index in Nespelem?
Inequality or Gini Index in Nespelem is 0.52.
What is the Total Population of Nespelem?
Total Population of Nespelem is 155.
What is the Total Male Population of Nespelem?
Total Male Population of Nespelem is 68.
What is the Total Female Population of Nespelem?
Total Female Population of Nespelem is 87.
What is the Ratio of Males per 100 Females in Nespelem?
There are 78.16 Males per 100 Females in Nespelem.
What is the Ratio of Females per 100 Males in Nespelem?
There are 127.94 Females per 100 Males in Nespelem.
What is the Median Population Age in Nespelem?
Median Population Age in Nespelem is 33.9 Years.
What is the Average Family Size in Nespelem
Average Family Size in Nespelem is 2.9 People.
What is the Average Household Size in Nespelem
Average Household Size in Nespelem is 2.4 People.
How Large is the Labor Force in Nespelem?
There are 49 People in the Labor Forcein in Nespelem.
What is the Percentage of People in the Labor Force in Nespelem?
38.0% of People are in the Labor Force in Nespelem.
What is the Unemployment Rate in Nespelem?
Unemployment Rate in Nespelem is 6.1%.