Moxee, WA Map & Demographics
Moxee Map
Moxee Overview
$33,502
PER CAPITA INCOME
$94,397
AVG FAMILY INCOME
$104,205
AVG HOUSEHOLD INCOME
37.6%
WAGE / INCOME GAP [ % ]
62.4¢/ $1
WAGE / INCOME GAP [ $ ]
0.27
INEQUALITY / GINI INDEX
4,411
TOTAL POPULATION
2,348
MALE POPULATION
2,063
FEMALE POPULATION
113.81
MALES / 100 FEMALES
87.86
FEMALES / 100 MALES
32.6
MEDIAN AGE
3.3
AVG FAMILY SIZE
3.2
AVG HOUSEHOLD SIZE
2,280
LABOR FORCE [ PEOPLE ]
72.1%
PERCENT IN LABOR FORCE
1.3%
UNEMPLOYMENT RATE
Moxee Zip Codes
Moxee Area Codes
Income in Moxee
Income Overview in Moxee
Per Capita Income in Moxee is $33,502, while median incomes of families and households are $94,397 and $104,205 respectively.
| Characteristic | Number | Measure |
| Per Capita Income | 4,411 | $33,502 |
| Median Family Income | 1,246 | $94,397 |
| Mean Family Income | 1,246 | $102,115 |
| Median Household Income | 1,387 | $104,205 |
| Mean Household Income | 1,387 | $104,914 |
| Income Deficit | 1,246 | $0 |
| Wage / Income Gap (%) | 4,411 | 37.60% |
| Wage / Income Gap ($) | 4,411 | 62.40¢ per $1 |
| Gini / Inequality Index | 4,411 | 0.27 |
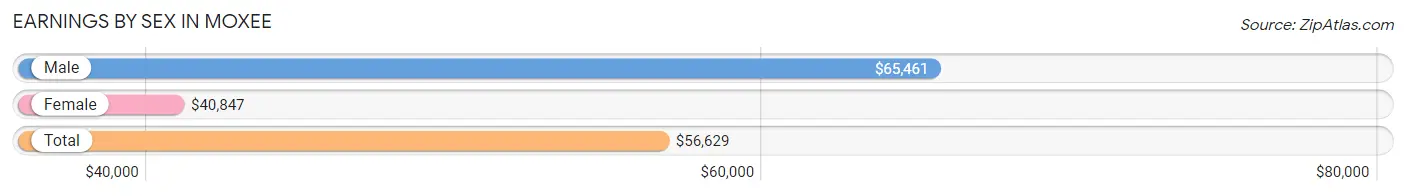
Earnings by Sex in Moxee
Average Earnings in Moxee are $56,629, $65,461 for men and $40,847 for women, a difference of 37.6%.
| Sex | Number | Average Earnings |
| Male | 1,251 (53.2%) | $65,461 |
| Female | 1,100 (46.8%) | $40,847 |
| Total | 2,351 (100.0%) | $56,629 |
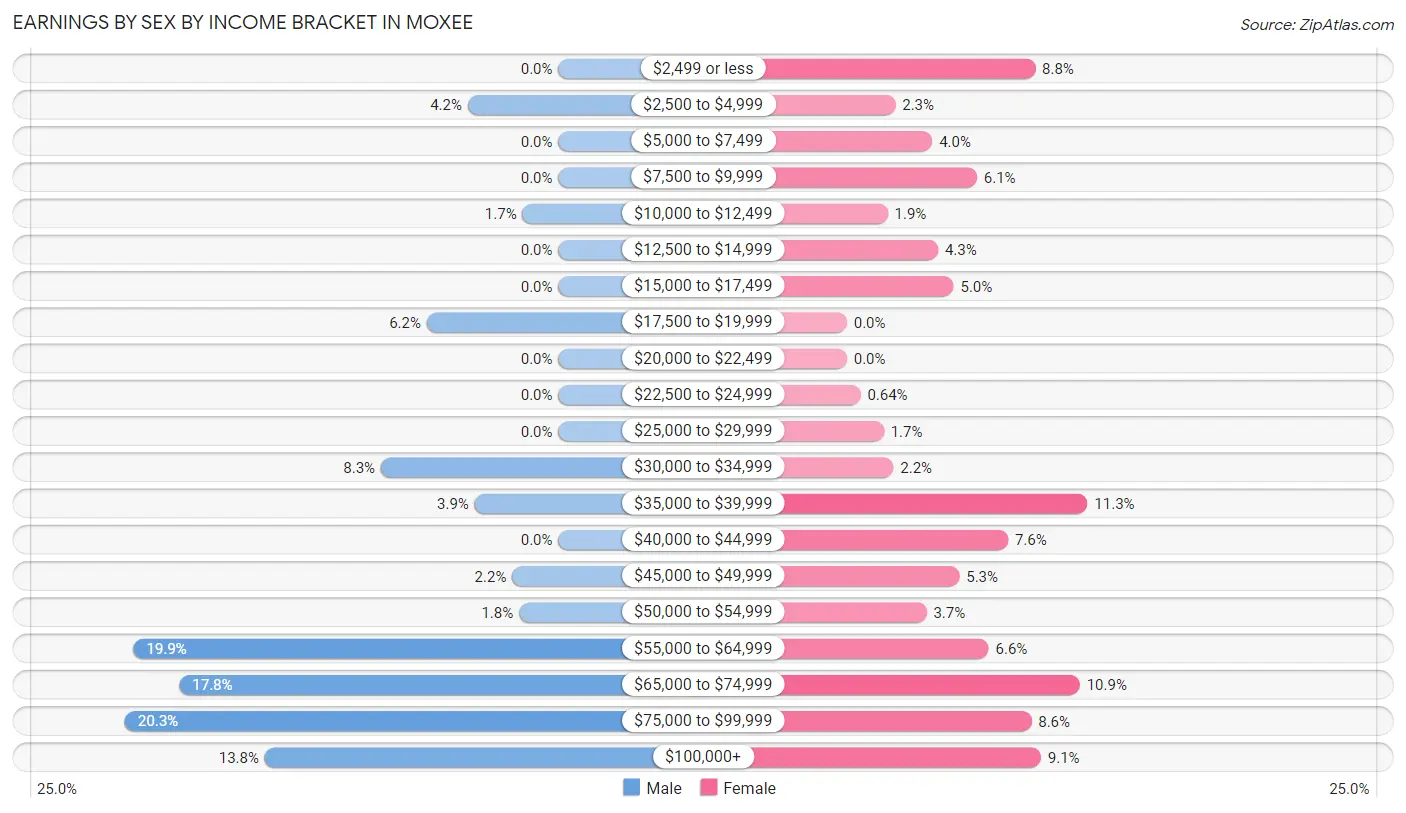
Earnings by Sex by Income Bracket in Moxee
The most common earnings brackets in Moxee are $75,000 to $99,999 for men (254 | 20.3%) and $35,000 to $39,999 for women (124 | 11.3%).
| Income | Male | Female |
| $2,499 or less | 0 (0.0%) | 97 (8.8%) |
| $2,500 to $4,999 | 53 (4.2%) | 25 (2.3%) |
| $5,000 to $7,499 | 0 (0.0%) | 44 (4.0%) |
| $7,500 to $9,999 | 0 (0.0%) | 67 (6.1%) |
| $10,000 to $12,499 | 21 (1.7%) | 21 (1.9%) |
| $12,500 to $14,999 | 0 (0.0%) | 47 (4.3%) |
| $15,000 to $17,499 | 0 (0.0%) | 55 (5.0%) |
| $17,500 to $19,999 | 77 (6.2%) | 0 (0.0%) |
| $20,000 to $22,499 | 0 (0.0%) | 0 (0.0%) |
| $22,500 to $24,999 | 0 (0.0%) | 7 (0.6%) |
| $25,000 to $29,999 | 0 (0.0%) | 19 (1.7%) |
| $30,000 to $34,999 | 104 (8.3%) | 24 (2.2%) |
| $35,000 to $39,999 | 49 (3.9%) | 124 (11.3%) |
| $40,000 to $44,999 | 0 (0.0%) | 83 (7.5%) |
| $45,000 to $49,999 | 27 (2.2%) | 58 (5.3%) |
| $50,000 to $54,999 | 23 (1.8%) | 41 (3.7%) |
| $55,000 to $64,999 | 249 (19.9%) | 73 (6.6%) |
| $65,000 to $74,999 | 222 (17.7%) | 120 (10.9%) |
| $75,000 to $99,999 | 254 (20.3%) | 95 (8.6%) |
| $100,000+ | 172 (13.8%) | 100 (9.1%) |
| Total | 1,251 (100.0%) | 1,100 (100.0%) |
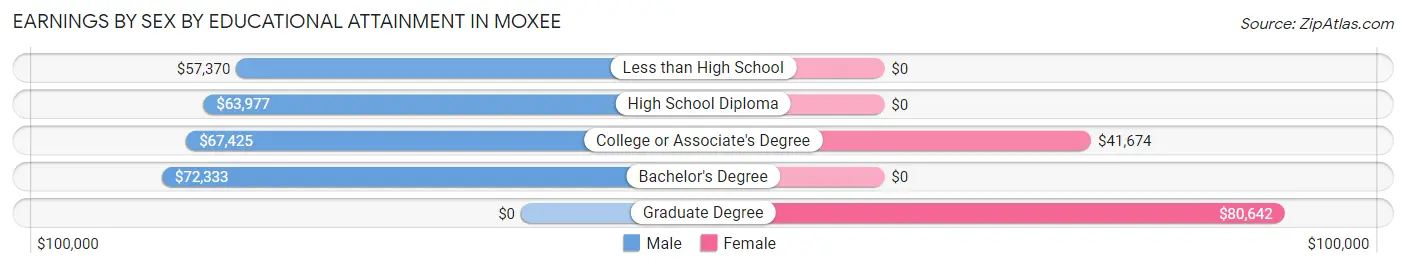
Earnings by Sex by Educational Attainment in Moxee
Average earnings in Moxee are $66,588 for men and $41,907 for women, a difference of 37.1%. Men with an educational attainment of bachelor's degree enjoy the highest average annual earnings of $72,333, while those with less than high school education earn the least with $57,370. Women with an educational attainment of graduate degree earn the most with the average annual earnings of $80,642, while those with college or associate's degree education have the smallest earnings of $41,674.
| Educational Attainment | Male Income | Female Income |
| Less than High School | $57,370 | $0 |
| High School Diploma | $63,977 | $0 |
| College or Associate's Degree | $67,425 | $41,674 |
| Bachelor's Degree | $72,333 | $0 |
| Graduate Degree | - | - |
| Total | $66,588 | $41,907 |
Family Income in Moxee
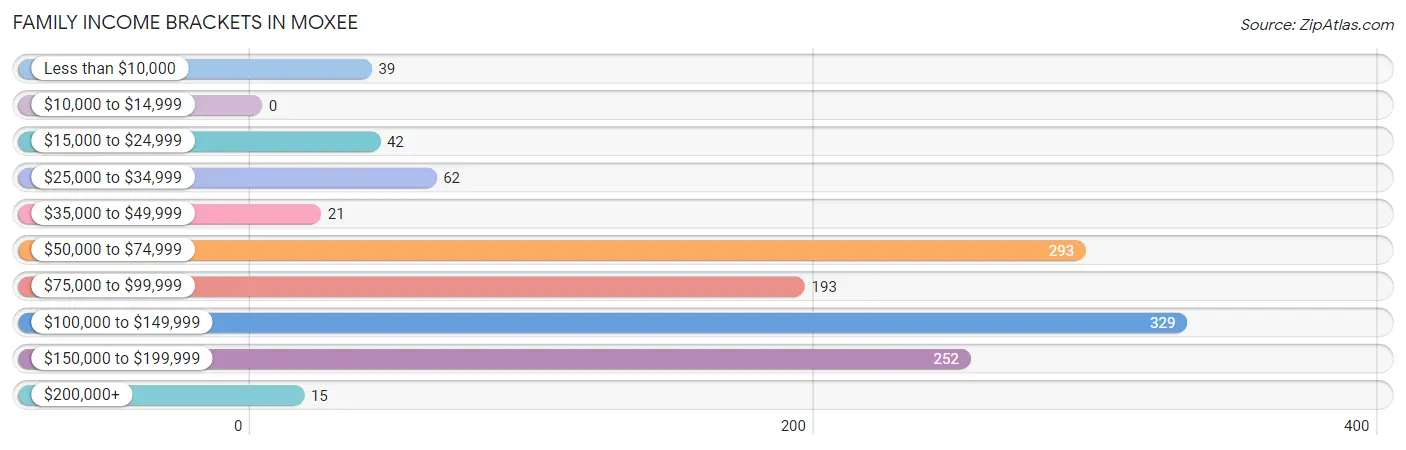
Family Income Brackets in Moxee
According to the Moxee family income data, there are 329 families falling into the $100,000 to $149,999 income range, which is the most common income bracket and makes up 26.4% of all families.
| Income Bracket | # Families | % Families |
| Less than $10,000 | 39 | 3.1% |
| $10,000 to $14,999 | 0 | 0.0% |
| $15,000 to $24,999 | 42 | 3.4% |
| $25,000 to $34,999 | 62 | 5.0% |
| $35,000 to $49,999 | 21 | 1.7% |
| $50,000 to $74,999 | 293 | 23.5% |
| $75,000 to $99,999 | 193 | 15.5% |
| $100,000 to $149,999 | 329 | 26.4% |
| $150,000 to $199,999 | 252 | 20.2% |
| $200,000+ | 15 | 1.2% |
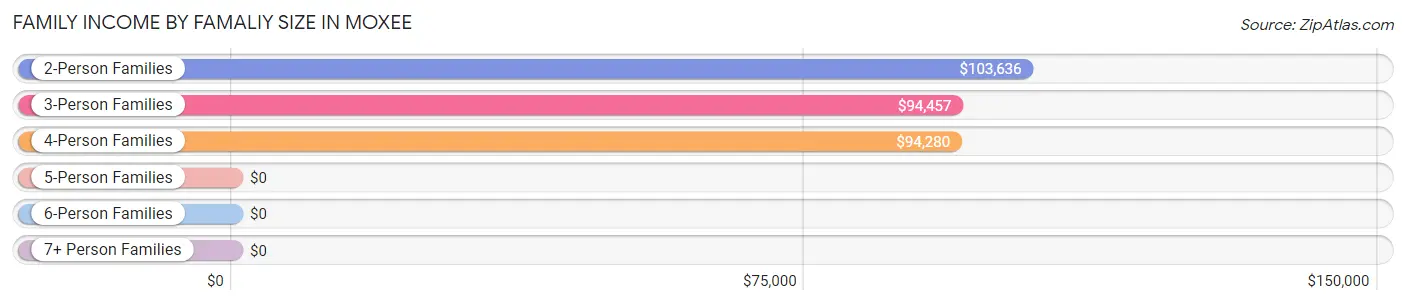
Family Income by Famaliy Size in Moxee
2-person families (512 | 41.1%) account for the highest median family income in Moxee with $103,636 per family, while 2-person families (512 | 41.1%) have the highest median income of $51,818 per family member.
| Income Bracket | # Families | Median Income |
| 2-Person Families | 512 (41.1%) | $103,636 |
| 3-Person Families | 268 (21.5%) | $94,457 |
| 4-Person Families | 360 (28.9%) | $94,280 |
| 5-Person Families | 42 (3.4%) | $0 |
| 6-Person Families | 45 (3.6%) | $0 |
| 7+ Person Families | 19 (1.5%) | $0 |
| Total | 1,246 (100.0%) | $94,397 |
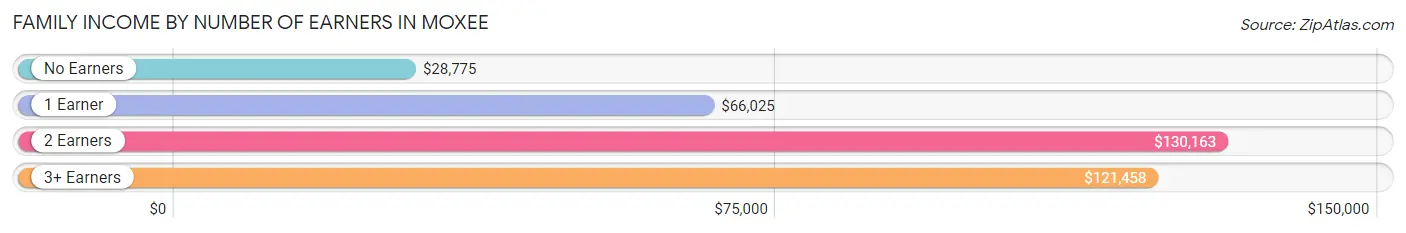
Family Income by Number of Earners in Moxee
The median family income in Moxee is $94,397, with families comprising 2 earners (619) having the highest median family income of $130,163, while families with no earners (90) have the lowest median family income of $28,775, accounting for 49.7% and 7.2% of families, respectively.
| Number of Earners | # Families | Median Income |
| No Earners | 90 (7.2%) | $28,775 |
| 1 Earner | 411 (33.0%) | $66,025 |
| 2 Earners | 619 (49.7%) | $130,163 |
| 3+ Earners | 126 (10.1%) | $121,458 |
| Total | 1,246 (100.0%) | $94,397 |
Household Income in Moxee
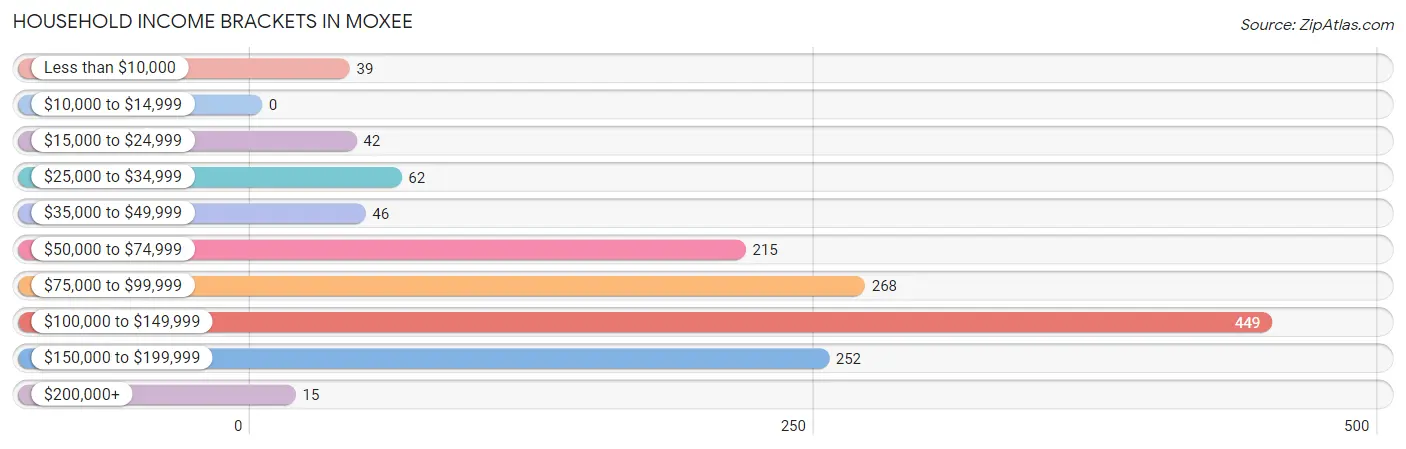
Household Income Brackets in Moxee
With 449 households falling in the category, the $100,000 to $149,999 income range is the most frequent in Moxee, accounting for 32.4% of all households.
| Income Bracket | # Households | % Households |
| Less than $10,000 | 39 | 2.8% |
| $10,000 to $14,999 | 0 | 0.0% |
| $15,000 to $24,999 | 42 | 3.0% |
| $25,000 to $34,999 | 62 | 4.5% |
| $35,000 to $49,999 | 46 | 3.3% |
| $50,000 to $74,999 | 215 | 15.5% |
| $75,000 to $99,999 | 268 | 19.3% |
| $100,000 to $149,999 | 449 | 32.4% |
| $150,000 to $199,999 | 252 | 18.2% |
| $200,000+ | 15 | 1.1% |
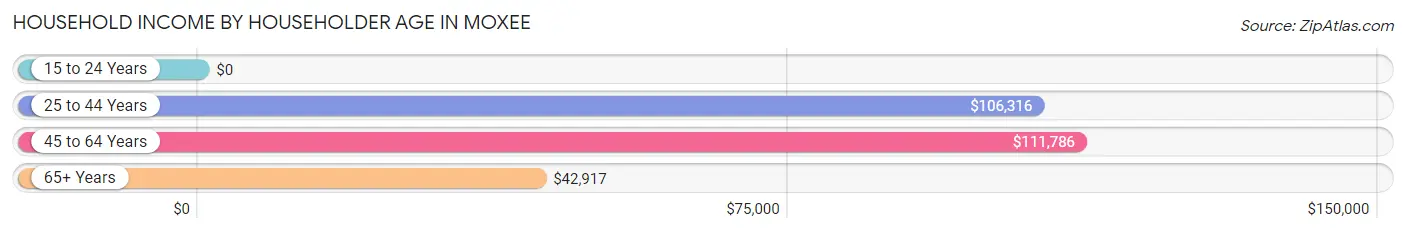
Household Income by Householder Age in Moxee
The median household income in Moxee is $104,205, with the highest median household income of $111,786 found in the 45 to 64 years age bracket for the primary householder. A total of 370 households (26.7%) fall into this category. Meanwhile, the 15 to 24 years age bracket for the primary householder has the lowest median household income of $0, with 94 households (6.8%) in this group.
| Income Bracket | # Households | Median Income |
| 15 to 24 Years | 94 (6.8%) | $0 |
| 25 to 44 Years | 814 (58.7%) | $106,316 |
| 45 to 64 Years | 370 (26.7%) | $111,786 |
| 65+ Years | 109 (7.9%) | $42,917 |
| Total | 1,387 (100.0%) | $104,205 |
Poverty in Moxee
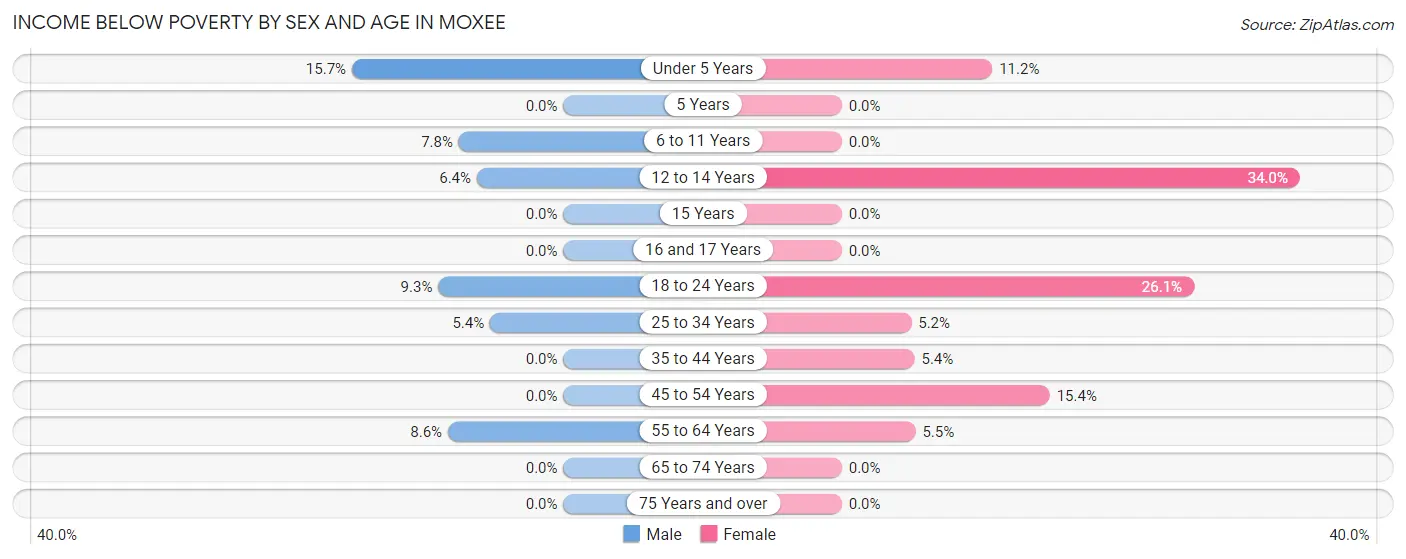
Income Below Poverty by Sex and Age in Moxee
With 5.0% poverty level for males and 8.1% for females among the residents of Moxee, under 5 year old males and 12 to 14 year old females are the most vulnerable to poverty, with 19 males (15.7%) and 17 females (34.0%) in their respective age groups living below the poverty level.
| Age Bracket | Male | Female |
| Under 5 Years | 19 (15.7%) | 22 (11.2%) |
| 5 Years | 0 (0.0%) | 0 (0.0%) |
| 6 to 11 Years | 19 (7.8%) | 0 (0.0%) |
| 12 to 14 Years | 12 (6.4%) | 17 (34.0%) |
| 15 Years | 0 (0.0%) | 0 (0.0%) |
| 16 and 17 Years | 0 (0.0%) | 0 (0.0%) |
| 18 to 24 Years | 30 (9.3%) | 46 (26.1%) |
| 25 to 34 Years | 16 (5.4%) | 19 (5.2%) |
| 35 to 44 Years | 0 (0.0%) | 21 (5.4%) |
| 45 to 54 Years | 0 (0.0%) | 21 (15.4%) |
| 55 to 64 Years | 21 (8.6%) | 21 (5.5%) |
| 65 to 74 Years | 0 (0.0%) | 0 (0.0%) |
| 75 Years and over | 0 (0.0%) | 0 (0.0%) |
| Total | 117 (5.0%) | 167 (8.1%) |
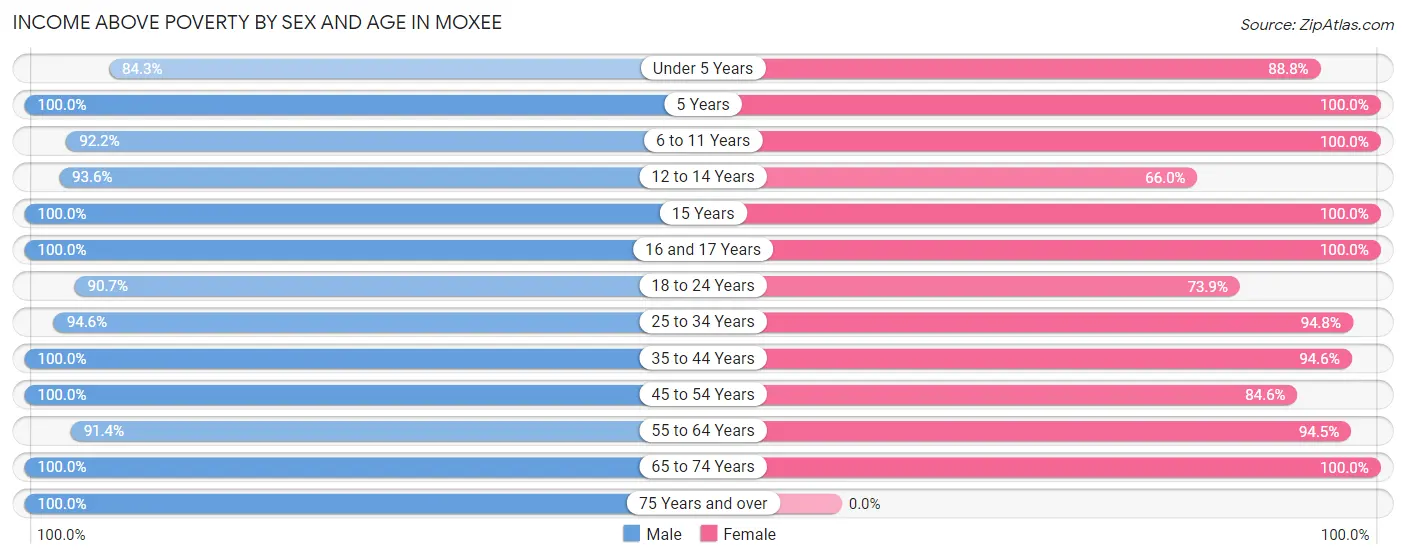
Income Above Poverty by Sex and Age in Moxee
According to the poverty statistics in Moxee, males aged 5 years and females aged 5 years are the age groups that are most secure financially, with 100.0% of males and 100.0% of females in these age groups living above the poverty line.
| Age Bracket | Male | Female |
| Under 5 Years | 102 (84.3%) | 175 (88.8%) |
| 5 Years | 96 (100.0%) | 57 (100.0%) |
| 6 to 11 Years | 226 (92.2%) | 146 (100.0%) |
| 12 to 14 Years | 175 (93.6%) | 33 (66.0%) |
| 15 Years | 96 (100.0%) | 54 (100.0%) |
| 16 and 17 Years | 23 (100.0%) | 18 (100.0%) |
| 18 to 24 Years | 293 (90.7%) | 130 (73.9%) |
| 25 to 34 Years | 278 (94.6%) | 349 (94.8%) |
| 35 to 44 Years | 375 (100.0%) | 368 (94.6%) |
| 45 to 54 Years | 245 (100.0%) | 115 (84.6%) |
| 55 to 64 Years | 224 (91.4%) | 363 (94.5%) |
| 65 to 74 Years | 88 (100.0%) | 88 (100.0%) |
| 75 Years and over | 10 (100.0%) | 0 (0.0%) |
| Total | 2,231 (95.0%) | 1,896 (91.9%) |
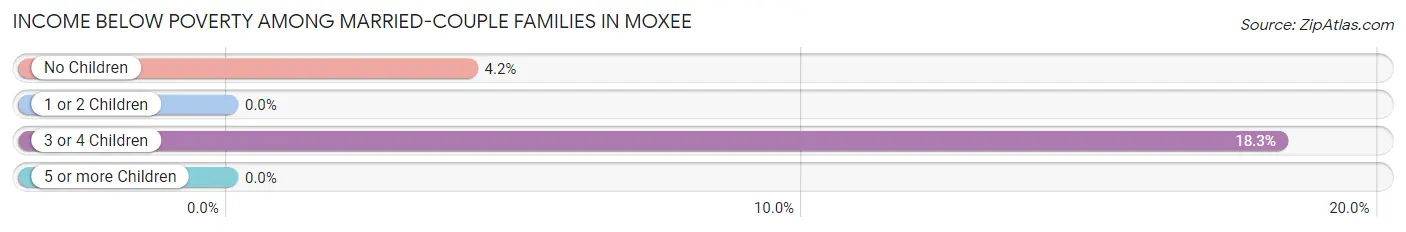
Income Below Poverty Among Married-Couple Families in Moxee
The poverty statistics for married-couple families in Moxee show that 3.9% or 40 of the total 1,032 families live below the poverty line. Families with 3 or 4 children have the highest poverty rate of 18.3%, comprising of 19 families. On the other hand, families with 1 or 2 children have the lowest poverty rate of 0.0%, which includes 0 families.
| Children | Above Poverty | Below Poverty |
| No Children | 482 (95.8%) | 21 (4.2%) |
| 1 or 2 Children | 425 (100.0%) | 0 (0.0%) |
| 3 or 4 Children | 85 (81.7%) | 19 (18.3%) |
| 5 or more Children | 0 (0.0%) | 0 (0.0%) |
| Total | 992 (96.1%) | 40 (3.9%) |
Income Below Poverty Among Single-Parent Households in Moxee
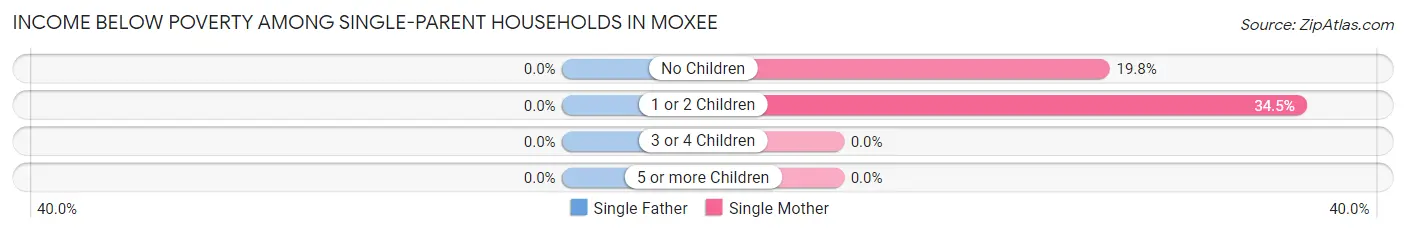
| Children | Single Father | Single Mother |
| No Children | 0 (0.0%) | 21 (19.8%) |
| 1 or 2 Children | 0 (0.0%) | 20 (34.5%) |
| 3 or 4 Children | 0 (0.0%) | 0 (0.0%) |
| 5 or more Children | 0 (0.0%) | 0 (0.0%) |
| Total | 0 (0.0%) | 41 (25.0%) |
Income Below Poverty Among Married-Couple vs Single-Parent Households in Moxee
The poverty data for Moxee shows that 40 of the married-couple family households (3.9%) and 41 of the single-parent households (19.2%) are living below the poverty level. Within the married-couple family households, those with 3 or 4 children have the highest poverty rate, with 19 households (18.3%) falling below the poverty line. Among the single-parent households, those with no children have the highest poverty rate, with 21 household (19.8%) living below poverty.
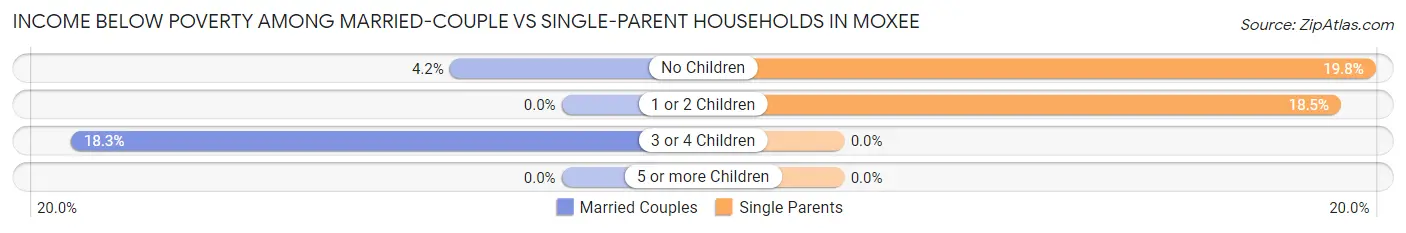
| Children | Married-Couple Families | Single-Parent Households |
| No Children | 21 (4.2%) | 21 (19.8%) |
| 1 or 2 Children | 0 (0.0%) | 20 (18.5%) |
| 3 or 4 Children | 19 (18.3%) | 0 (0.0%) |
| 5 or more Children | 0 (0.0%) | 0 (0.0%) |
| Total | 40 (3.9%) | 41 (19.2%) |
Race in Moxee
The most populous races in Moxee are White / Caucasian (3,324 | 75.4%), Hispanic or Latino (1,259 | 28.5%), and Some other Race (586 | 13.3%).
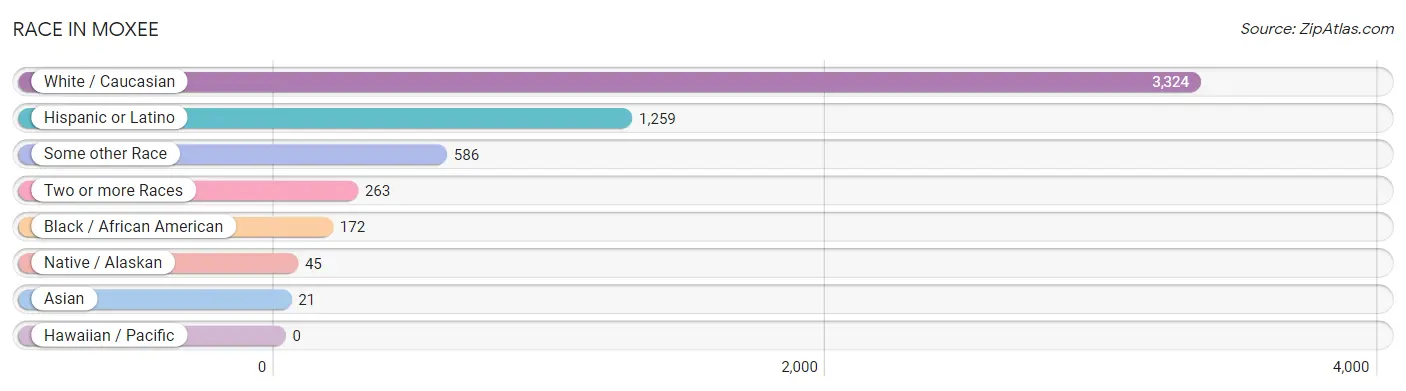
| Race | # Population | % Population |
| Asian | 21 | 0.5% |
| Black / African American | 172 | 3.9% |
| Hawaiian / Pacific | 0 | 0.0% |
| Hispanic or Latino | 1,259 | 28.5% |
| Native / Alaskan | 45 | 1.0% |
| White / Caucasian | 3,324 | 75.4% |
| Two or more Races | 263 | 6.0% |
| Some other Race | 586 | 13.3% |
| Total | 4,411 | 100.0% |
Ancestry in Moxee
The most populous ancestries reported in Moxee are Mexican (1,089 | 24.7%), German (604 | 13.7%), English (388 | 8.8%), American (356 | 8.1%), and European (203 | 4.6%), together accounting for 59.9% of all Moxee residents.
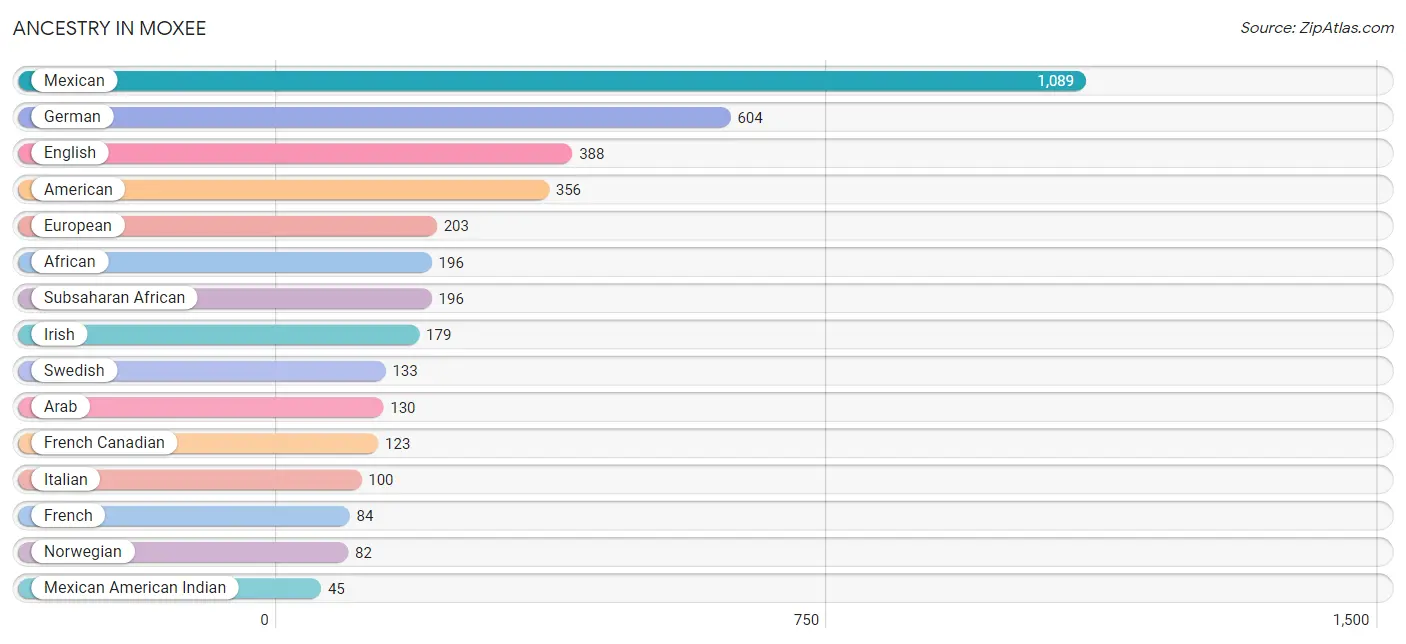
| Ancestry | # Population | % Population |
| African | 196 | 4.4% |
| American | 356 | 8.1% |
| Arab | 130 | 2.9% |
| Cherokee | 19 | 0.4% |
| English | 388 | 8.8% |
| European | 203 | 4.6% |
| French | 84 | 1.9% |
| French Canadian | 123 | 2.8% |
| German | 604 | 13.7% |
| Hungarian | 43 | 1.0% |
| Irish | 179 | 4.1% |
| Italian | 100 | 2.3% |
| Korean | 21 | 0.5% |
| Lithuanian | 21 | 0.5% |
| Mexican | 1,089 | 24.7% |
| Mexican American Indian | 45 | 1.0% |
| Norwegian | 82 | 1.9% |
| Polish | 26 | 0.6% |
| Scandinavian | 19 | 0.4% |
| Scottish | 13 | 0.3% |
| Subsaharan African | 196 | 4.4% |
| Swedish | 133 | 3.0% | View All 22 Rows |
Immigrants in Moxee
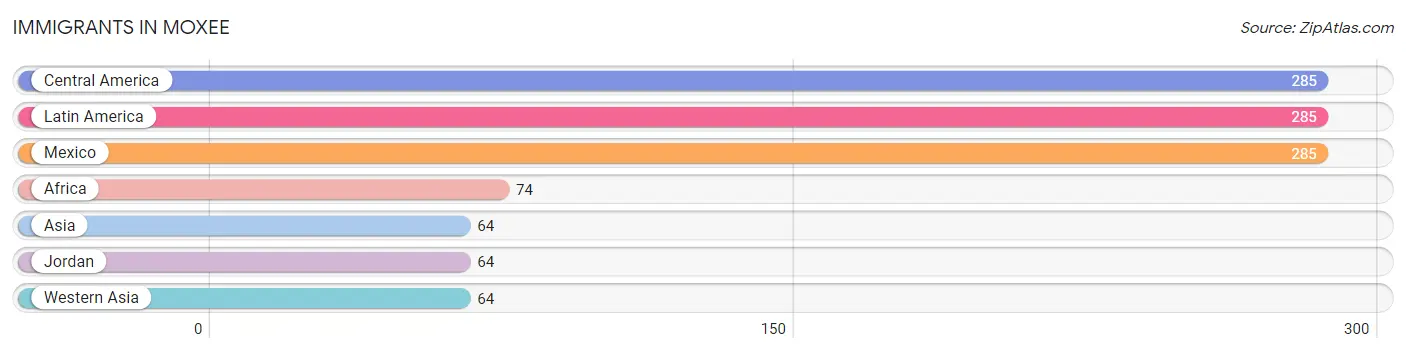
The most numerous immigrant groups reported in Moxee came from Central America (285 | 6.5%), Latin America (285 | 6.5%), Mexico (285 | 6.5%), Africa (74 | 1.7%), and Asia (64 | 1.5%), together accounting for 22.5% of all Moxee residents.
| Immigration Origin | # Population | % Population |
| Africa | 74 | 1.7% |
| Asia | 64 | 1.5% |
| Central America | 285 | 6.5% |
| Jordan | 64 | 1.5% |
| Latin America | 285 | 6.5% |
| Mexico | 285 | 6.5% |
| Western Asia | 64 | 1.5% | View All 7 Rows |
Sex and Age in Moxee
Sex and Age in Moxee
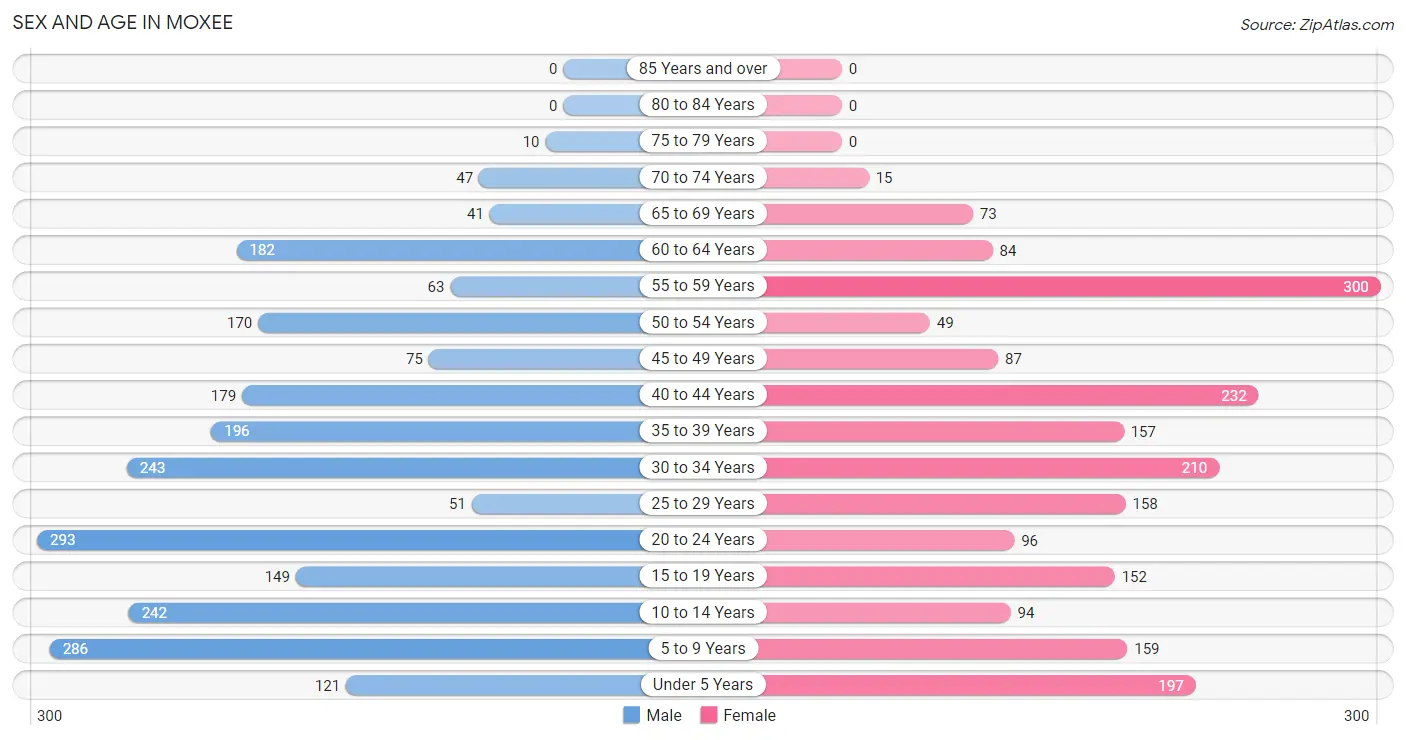
The most populous age groups in Moxee are 20 to 24 Years (293 | 12.5%) for men and 55 to 59 Years (300 | 14.5%) for women.
| Age Bracket | Male | Female |
| Under 5 Years | 121 (5.1%) | 197 (9.6%) |
| 5 to 9 Years | 286 (12.2%) | 159 (7.7%) |
| 10 to 14 Years | 242 (10.3%) | 94 (4.6%) |
| 15 to 19 Years | 149 (6.4%) | 152 (7.4%) |
| 20 to 24 Years | 293 (12.5%) | 96 (4.6%) |
| 25 to 29 Years | 51 (2.2%) | 158 (7.7%) |
| 30 to 34 Years | 243 (10.3%) | 210 (10.2%) |
| 35 to 39 Years | 196 (8.4%) | 157 (7.6%) |
| 40 to 44 Years | 179 (7.6%) | 232 (11.3%) |
| 45 to 49 Years | 75 (3.2%) | 87 (4.2%) |
| 50 to 54 Years | 170 (7.2%) | 49 (2.4%) |
| 55 to 59 Years | 63 (2.7%) | 300 (14.5%) |
| 60 to 64 Years | 182 (7.7%) | 84 (4.1%) |
| 65 to 69 Years | 41 (1.8%) | 73 (3.5%) |
| 70 to 74 Years | 47 (2.0%) | 15 (0.7%) |
| 75 to 79 Years | 10 (0.4%) | 0 (0.0%) |
| 80 to 84 Years | 0 (0.0%) | 0 (0.0%) |
| 85 Years and over | 0 (0.0%) | 0 (0.0%) |
| Total | 2,348 (100.0%) | 2,063 (100.0%) |
Families and Households in Moxee
Median Family Size in Moxee
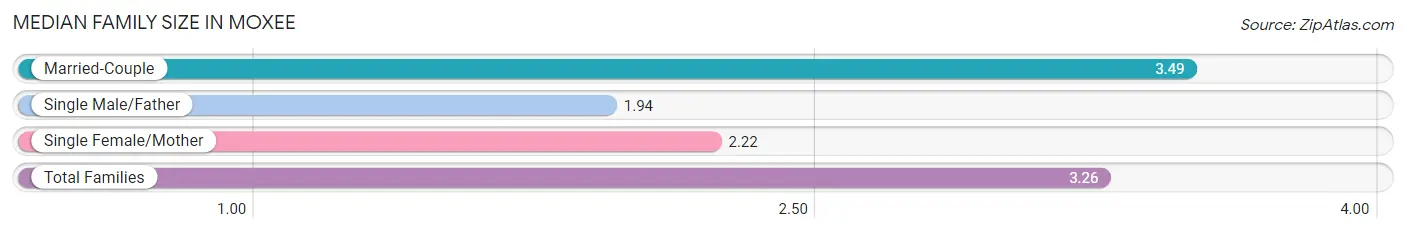
The median family size in Moxee is 3.26 persons per family, with married-couple families (1,032 | 82.8%) accounting for the largest median family size of 3.49 persons per family. On the other hand, single male/father families (50 | 4.0%) represent the smallest median family size with 1.94 persons per family.
| Family Type | # Families | Family Size |
| Married-Couple | 1,032 (82.8%) | 3.49 |
| Single Male/Father | 50 (4.0%) | 1.94 |
| Single Female/Mother | 164 (13.2%) | 2.22 |
| Total Families | 1,246 (100.0%) | 3.26 |
Median Household Size in Moxee
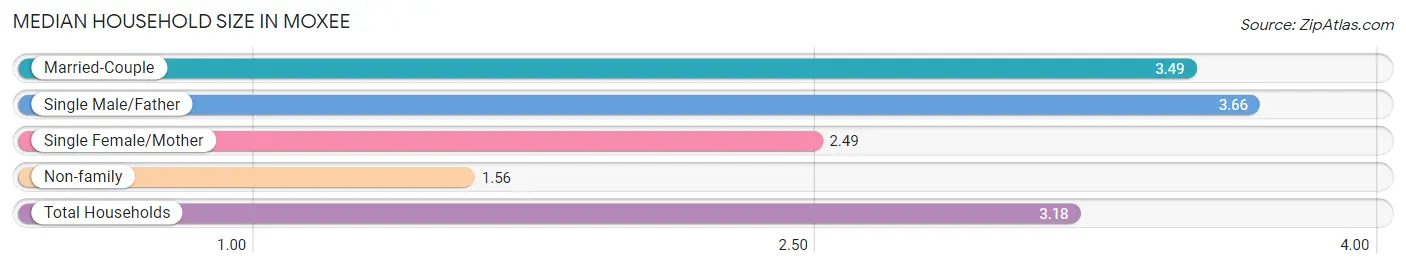
The median household size in Moxee is 3.18 persons per household, with single male/father households (50 | 3.6%) accounting for the largest median household size of 3.66 persons per household. non-family households (141 | 10.2%) represent the smallest median household size with 1.56 persons per household.
| Household Type | # Households | Household Size |
| Married-Couple | 1,032 (74.4%) | 3.49 |
| Single Male/Father | 50 (3.6%) | 3.66 |
| Single Female/Mother | 164 (11.8%) | 2.49 |
| Non-family | 141 (10.2%) | 1.56 |
| Total Households | 1,387 (100.0%) | 3.18 |
Household Size by Marriage Status in Moxee
Out of a total of 1,387 households in Moxee, 1,246 (89.8%) are family households, while 141 (10.2%) are nonfamily households. The most numerous type of family households are 2-person households, comprising 462, and the most common type of nonfamily households are 1-person households, comprising 74.
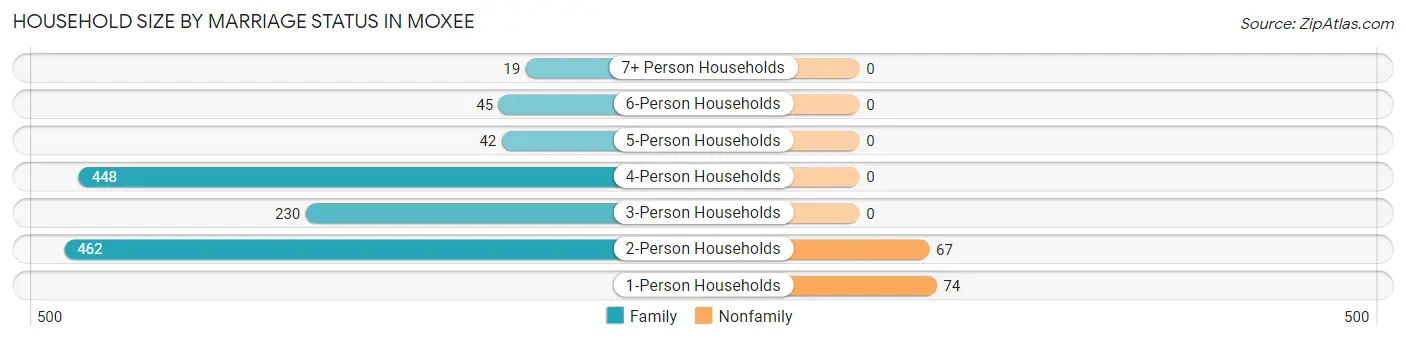
| Household Size | Family Households | Nonfamily Households |
| 1-Person Households | - | 74 (5.3%) |
| 2-Person Households | 462 (33.3%) | 67 (4.8%) |
| 3-Person Households | 230 (16.6%) | 0 (0.0%) |
| 4-Person Households | 448 (32.3%) | 0 (0.0%) |
| 5-Person Households | 42 (3.0%) | 0 (0.0%) |
| 6-Person Households | 45 (3.2%) | 0 (0.0%) |
| 7+ Person Households | 19 (1.4%) | 0 (0.0%) |
| Total | 1,246 (89.8%) | 141 (10.2%) |
Female Fertility in Moxee
Fertility by Age in Moxee
Average fertility rate in Moxee is 84.0 births per 1,000 women. Women in the age bracket of 20 to 34 years have the highest fertility rate with 198.0 births per 1,000 women. Women in the age bracket of 20 to 34 years acount for 100.0% of all women with births.
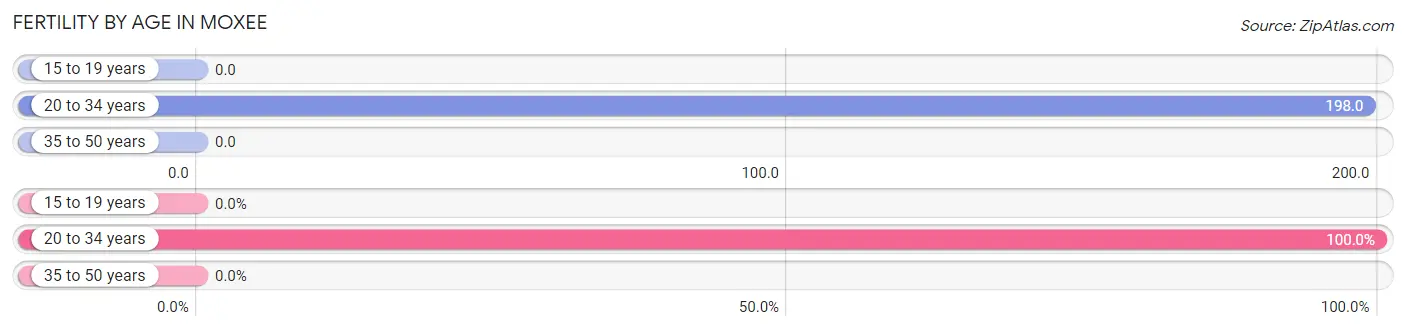
| Age Bracket | Women with Births | Births / 1,000 Women |
| 15 to 19 years | 0 (0.0%) | 0.0 |
| 20 to 34 years | 92 (100.0%) | 198.0 |
| 35 to 50 years | 0 (0.0%) | 0.0 |
| Total | 92 (100.0%) | 84.0 |
Fertility by Age by Marriage Status in Moxee
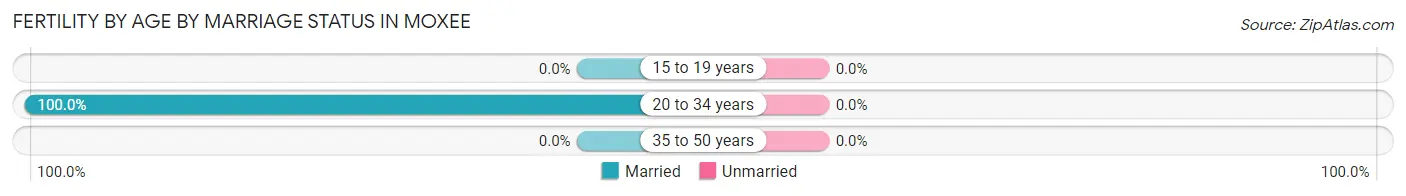
| Age Bracket | Married | Unmarried |
| 15 to 19 years | 0 (0.0%) | 0 (0.0%) |
| 20 to 34 years | 92 (100.0%) | 0 (0.0%) |
| 35 to 50 years | 0 (0.0%) | 0 (0.0%) |
| Total | 92 (100.0%) | 0 (0.0%) |
Fertility by Education in Moxee
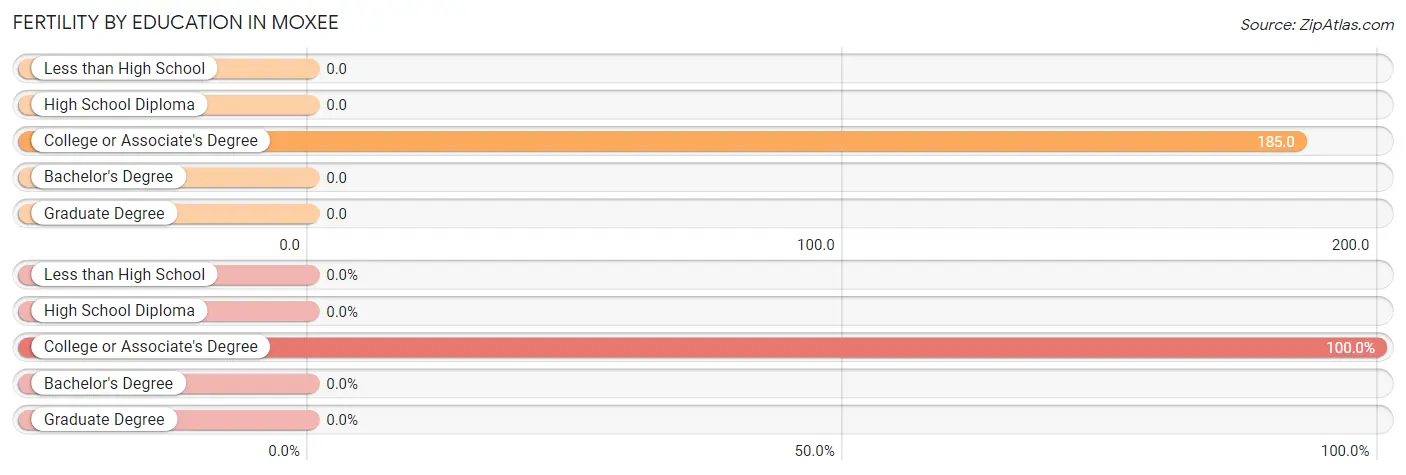
| Educational Attainment | Women with Births | Births / 1,000 Women |
| Less than High School | 0 (0.0%) | 0.0 |
| High School Diploma | 0 (0.0%) | 0.0 |
| College or Associate's Degree | 92 (100.0%) | 185.0 |
| Bachelor's Degree | 0 (0.0%) | 0.0 |
| Graduate Degree | 0 (0.0%) | 0.0 |
| Total | 92 (100.0%) | 84.0 |
Fertility by Education by Marriage Status in Moxee
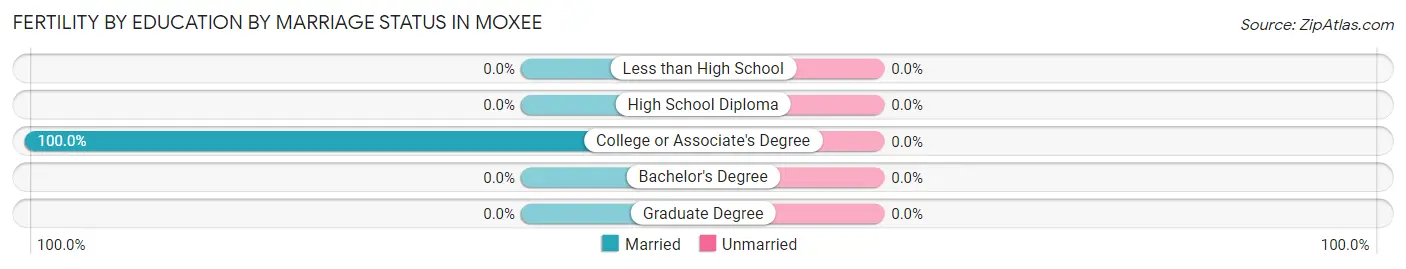
| Educational Attainment | Married | Unmarried |
| Less than High School | 0 (0.0%) | 0 (0.0%) |
| High School Diploma | 0 (0.0%) | 0 (0.0%) |
| College or Associate's Degree | 92 (100.0%) | 0 (0.0%) |
| Bachelor's Degree | 0 (0.0%) | 0 (0.0%) |
| Graduate Degree | 0 (0.0%) | 0 (0.0%) |
| Total | 92 (100.0%) | 0 (0.0%) |
Employment Characteristics in Moxee
Employment by Class of Employer in Moxee
Among the 2,250 employed individuals in Moxee, private company employees (1,467 | 65.2%), local government employees (258 | 11.5%), and not-for-profit organizations (211 | 9.4%) make up the most common classes of employment.
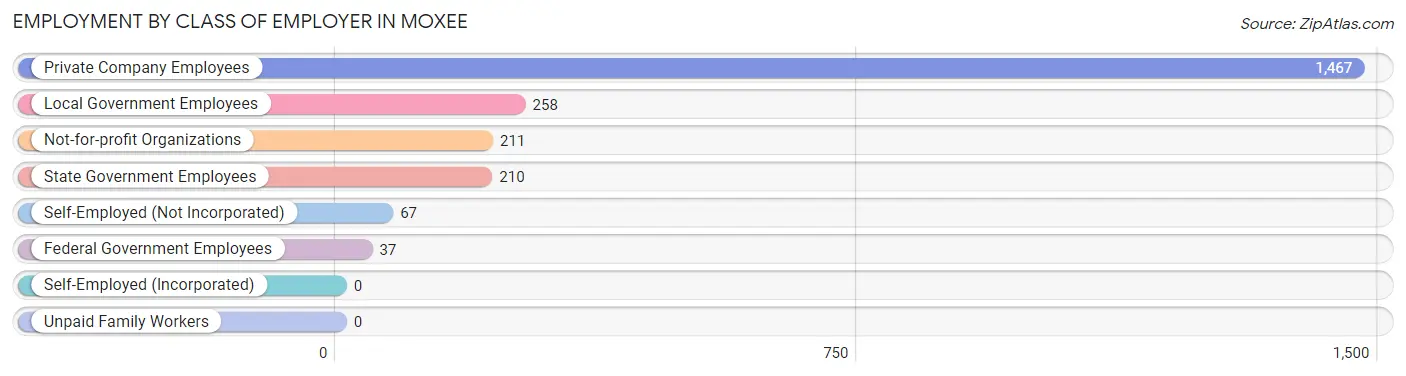
| Employer Class | # Employees | % Employees |
| Private Company Employees | 1,467 | 65.2% |
| Self-Employed (Incorporated) | 0 | 0.0% |
| Self-Employed (Not Incorporated) | 67 | 3.0% |
| Not-for-profit Organizations | 211 | 9.4% |
| Local Government Employees | 258 | 11.5% |
| State Government Employees | 210 | 9.3% |
| Federal Government Employees | 37 | 1.6% |
| Unpaid Family Workers | 0 | 0.0% |
| Total | 2,250 | 100.0% |
Employment Status by Age in Moxee
According to the labor force statistics for Moxee, out of the total population over 16 years of age (3,162), 72.1% or 2,280 individuals are in the labor force, with 1.3% or 30 of them unemployed. The age group with the highest labor force participation rate is 60 to 64 years, with 100.0% or 266 individuals in the labor force. Within the labor force, the 16 to 19 years age range has the highest percentage of unemployed individuals, with 50.0% or 17 of them being unemployed.
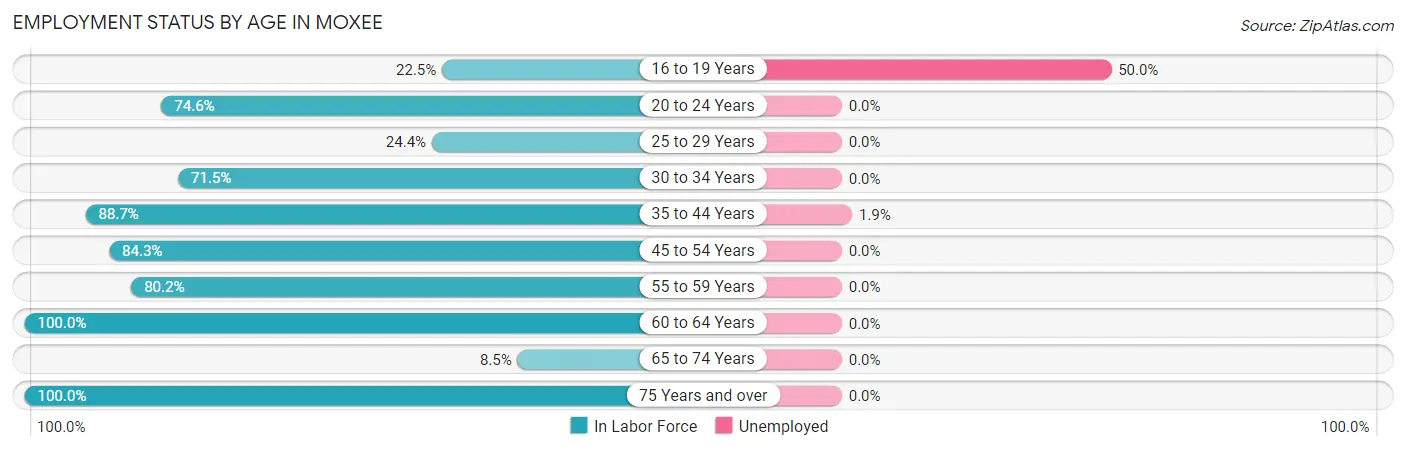
| Age Bracket | In Labor Force | Unemployed |
| 16 to 19 Years | 34 (22.5%) | 17 (50.0%) |
| 20 to 24 Years | 290 (74.6%) | 0 (0.0%) |
| 25 to 29 Years | 51 (24.4%) | 0 (0.0%) |
| 30 to 34 Years | 324 (71.5%) | 0 (0.0%) |
| 35 to 44 Years | 678 (88.7%) | 13 (1.9%) |
| 45 to 54 Years | 321 (84.3%) | 0 (0.0%) |
| 55 to 59 Years | 291 (80.2%) | 0 (0.0%) |
| 60 to 64 Years | 266 (100.0%) | 0 (0.0%) |
| 65 to 74 Years | 15 (8.5%) | 0 (0.0%) |
| 75 Years and over | 10 (100.0%) | 0 (0.0%) |
| Total | 2,280 (72.1%) | 30 (1.3%) |
Employment Status by Educational Attainment in Moxee
According to labor force statistics for Moxee, 79.3% of individuals (1,932) out of the total population between 25 and 64 years of age (2,436) are in the labor force, with 0.7% or 14 of them being unemployed. The group with the highest labor force participation rate are those with the educational attainment of bachelor's degree or higher, with 97.8% or 575 individuals in the labor force. Within the labor force, individuals with bachelor's degree or higher education have the highest percentage of unemployment, with 2.3% or 13 of them being unemployed.
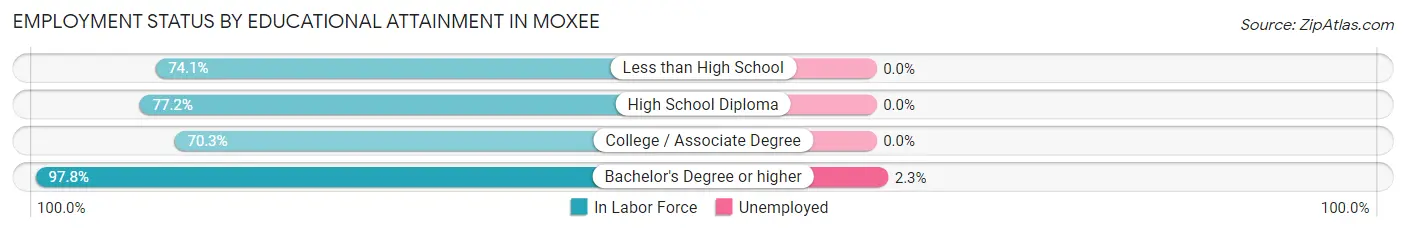
| Educational Attainment | In Labor Force | Unemployed |
| Less than High School | 209 (74.1%) | 0 (0.0%) |
| High School Diploma | 509 (77.2%) | 0 (0.0%) |
| College / Associate Degree | 638 (70.3%) | 0 (0.0%) |
| Bachelor's Degree or higher | 575 (97.8%) | 14 (2.3%) |
| Total | 1,932 (79.3%) | 17 (0.7%) |
Employment Occupations by Sex in Moxee
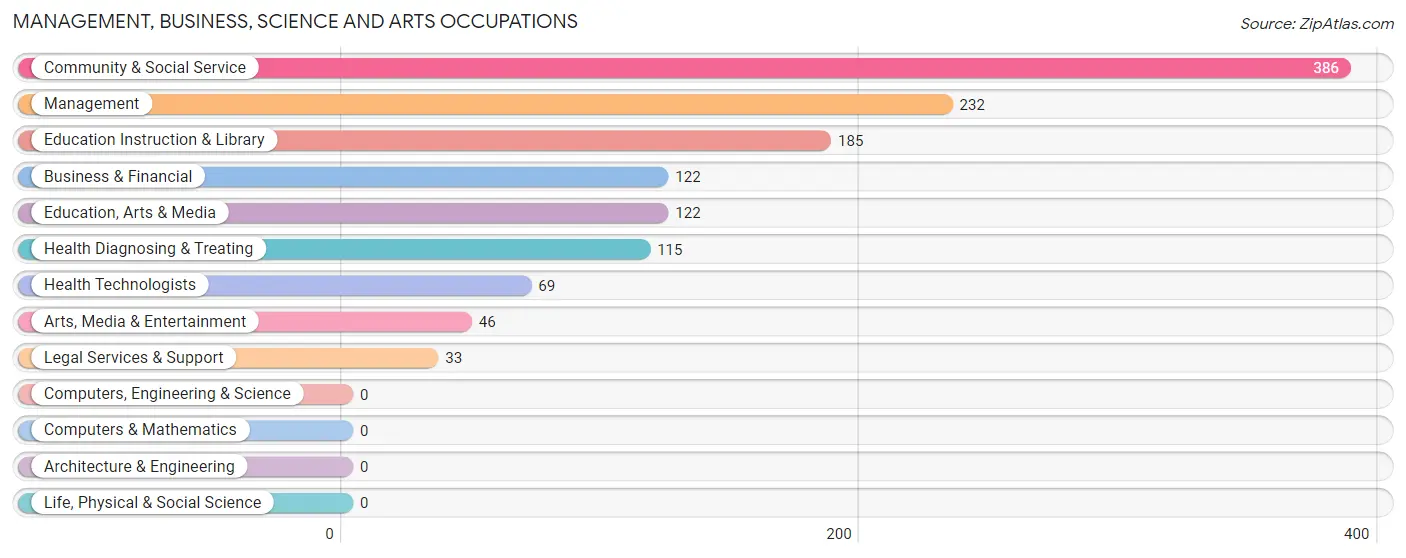
Management, Business, Science and Arts Occupations
The most common Management, Business, Science and Arts occupations in Moxee are Community & Social Service (386 | 17.2%), Management (232 | 10.3%), Education Instruction & Library (185 | 8.2%), Business & Financial (122 | 5.4%), and Education, Arts & Media (122 | 5.4%).
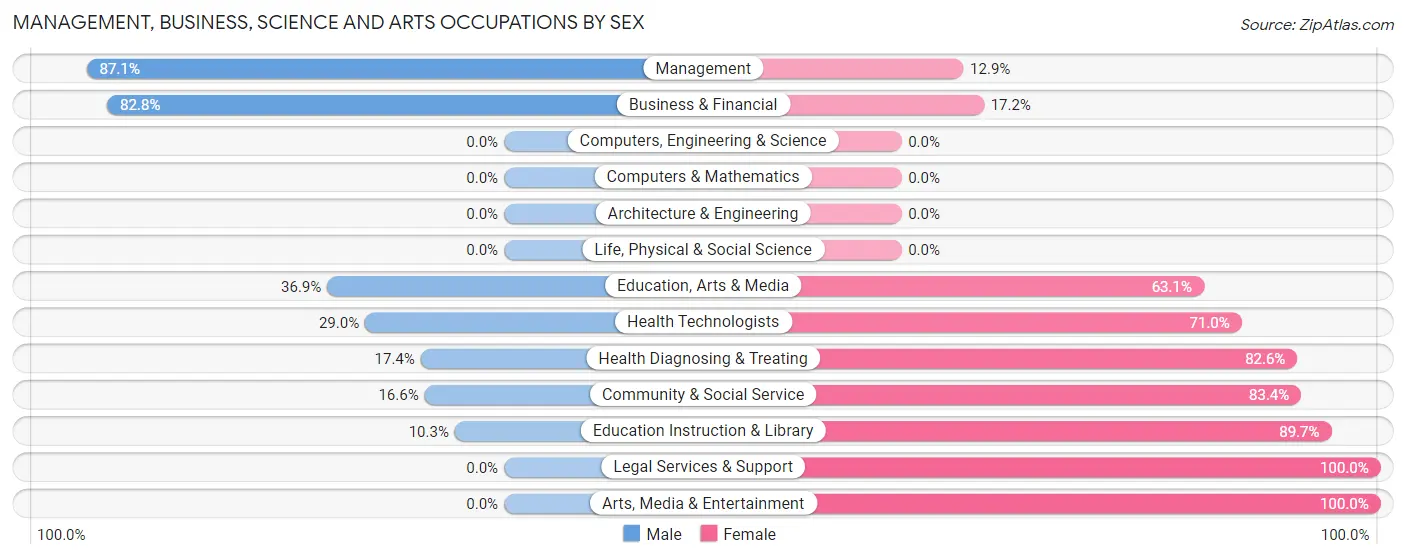
Management, Business, Science and Arts Occupations by Sex
Within the Management, Business, Science and Arts occupations in Moxee, the most male-oriented occupations are Management (87.1%), Business & Financial (82.8%), and Education, Arts & Media (36.9%), while the most female-oriented occupations are Legal Services & Support (100.0%), Arts, Media & Entertainment (100.0%), and Education Instruction & Library (89.7%).
| Occupation | Male | Female |
| Management | 202 (87.1%) | 30 (12.9%) |
| Business & Financial | 101 (82.8%) | 21 (17.2%) |
| Computers, Engineering & Science | 0 (0.0%) | 0 (0.0%) |
| Computers & Mathematics | 0 (0.0%) | 0 (0.0%) |
| Architecture & Engineering | 0 (0.0%) | 0 (0.0%) |
| Life, Physical & Social Science | 0 (0.0%) | 0 (0.0%) |
| Community & Social Service | 64 (16.6%) | 322 (83.4%) |
| Education, Arts & Media | 45 (36.9%) | 77 (63.1%) |
| Legal Services & Support | 0 (0.0%) | 33 (100.0%) |
| Education Instruction & Library | 19 (10.3%) | 166 (89.7%) |
| Arts, Media & Entertainment | 0 (0.0%) | 46 (100.0%) |
| Health Diagnosing & Treating | 20 (17.4%) | 95 (82.6%) |
| Health Technologists | 20 (29.0%) | 49 (71.0%) |
| Total (Category) | 387 (45.3%) | 468 (54.7%) |
| Total (Overall) | 1,241 (55.2%) | 1,009 (44.8%) |
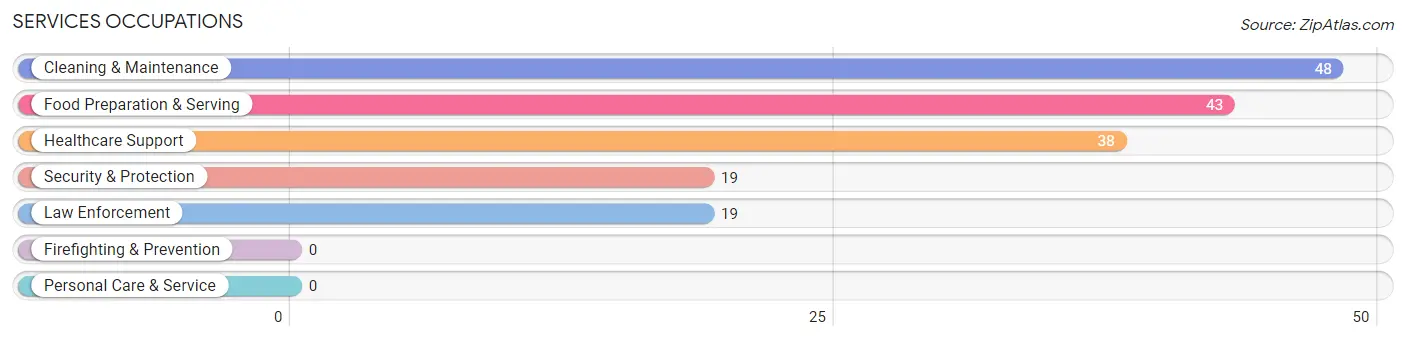
Services Occupations
The most common Services occupations in Moxee are Cleaning & Maintenance (48 | 2.1%), Food Preparation & Serving (43 | 1.9%), Healthcare Support (38 | 1.7%), Security & Protection (19 | 0.8%), and Law Enforcement (19 | 0.8%).
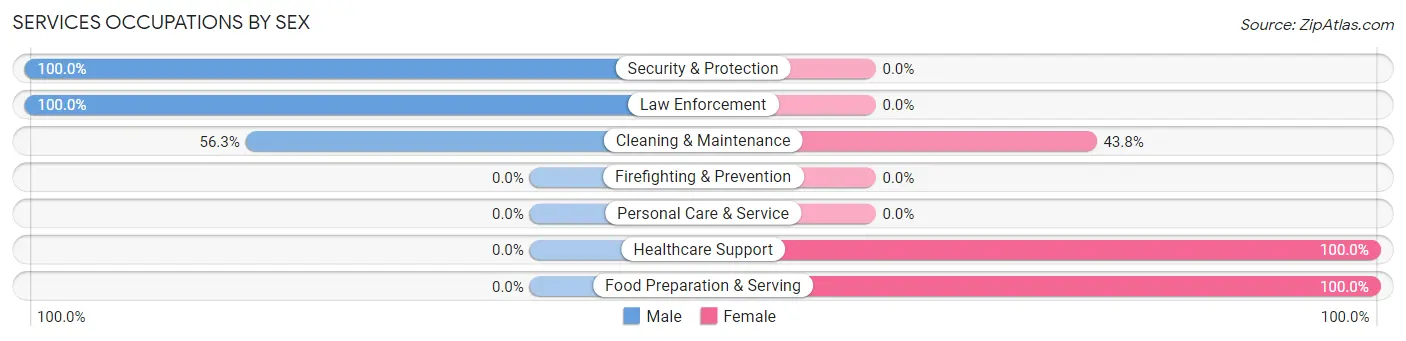
Services Occupations by Sex
Within the Services occupations in Moxee, the most male-oriented occupations are Security & Protection (100.0%), Law Enforcement (100.0%), and Cleaning & Maintenance (56.2%), while the most female-oriented occupations are Healthcare Support (100.0%), Food Preparation & Serving (100.0%), and Cleaning & Maintenance (43.8%).
| Occupation | Male | Female |
| Healthcare Support | 0 (0.0%) | 38 (100.0%) |
| Security & Protection | 19 (100.0%) | 0 (0.0%) |
| Firefighting & Prevention | 0 (0.0%) | 0 (0.0%) |
| Law Enforcement | 19 (100.0%) | 0 (0.0%) |
| Food Preparation & Serving | 0 (0.0%) | 43 (100.0%) |
| Cleaning & Maintenance | 27 (56.2%) | 21 (43.8%) |
| Personal Care & Service | 0 (0.0%) | 0 (0.0%) |
| Total (Category) | 46 (31.1%) | 102 (68.9%) |
| Total (Overall) | 1,241 (55.2%) | 1,009 (44.8%) |
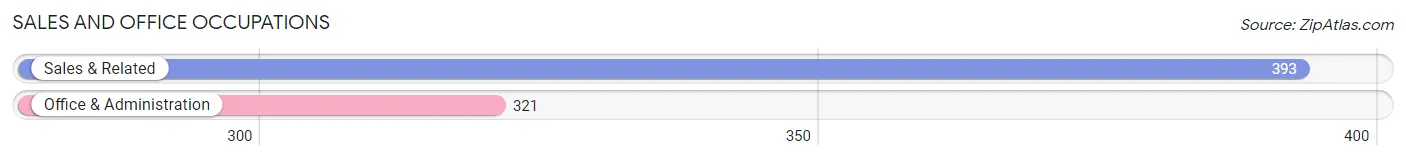
Sales and Office Occupations
The most common Sales and Office occupations in Moxee are Sales & Related (393 | 17.5%), and Office & Administration (321 | 14.3%).
Sales and Office Occupations by Sex
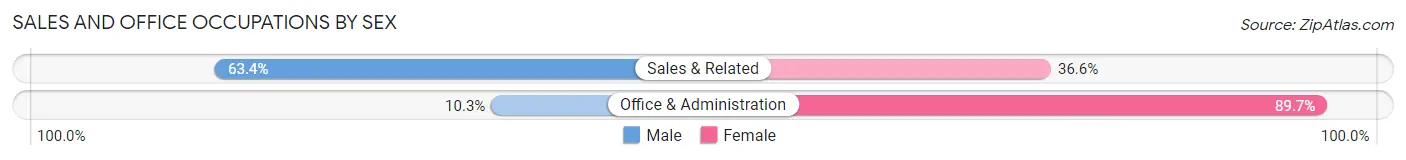
| Occupation | Male | Female |
| Sales & Related | 249 (63.4%) | 144 (36.6%) |
| Office & Administration | 33 (10.3%) | 288 (89.7%) |
| Total (Category) | 282 (39.5%) | 432 (60.5%) |
| Total (Overall) | 1,241 (55.2%) | 1,009 (44.8%) |
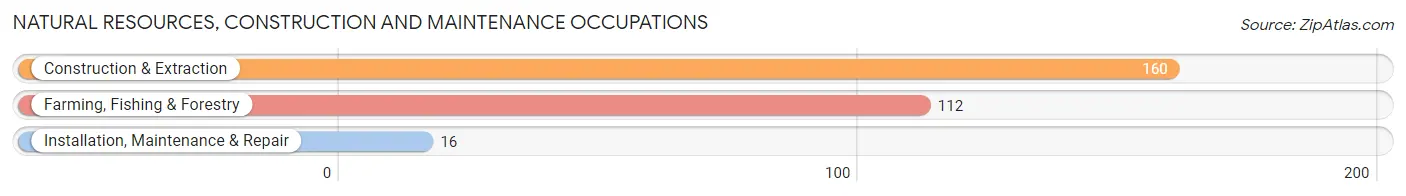
Natural Resources, Construction and Maintenance Occupations
The most common Natural Resources, Construction and Maintenance occupations in Moxee are Construction & Extraction (160 | 7.1%), Farming, Fishing & Forestry (112 | 5.0%), and Installation, Maintenance & Repair (16 | 0.7%).
Natural Resources, Construction and Maintenance Occupations by Sex
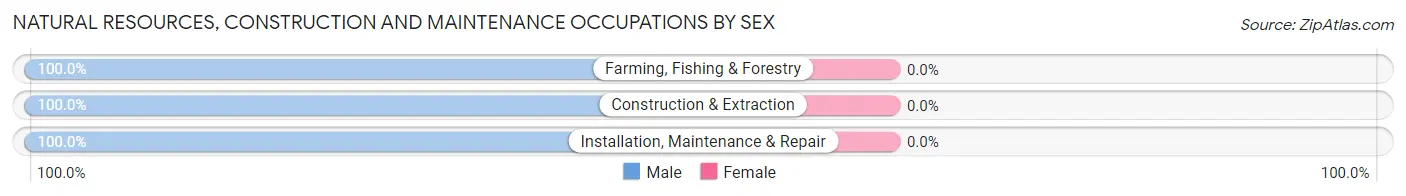
| Occupation | Male | Female |
| Farming, Fishing & Forestry | 112 (100.0%) | 0 (0.0%) |
| Construction & Extraction | 160 (100.0%) | 0 (0.0%) |
| Installation, Maintenance & Repair | 16 (100.0%) | 0 (0.0%) |
| Total (Category) | 288 (100.0%) | 0 (0.0%) |
| Total (Overall) | 1,241 (55.2%) | 1,009 (44.8%) |
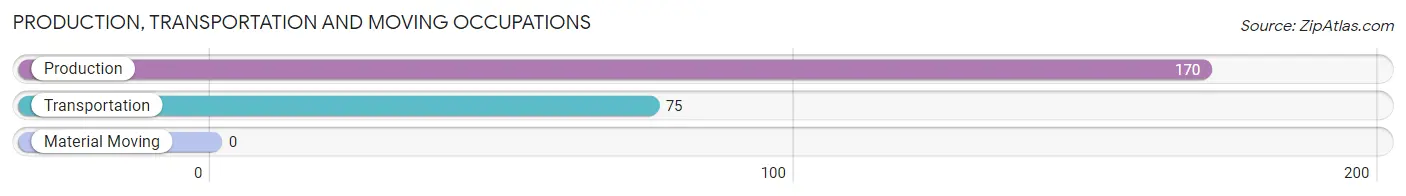
Production, Transportation and Moving Occupations
The most common Production, Transportation and Moving occupations in Moxee are Production (170 | 7.6%), and Transportation (75 | 3.3%).
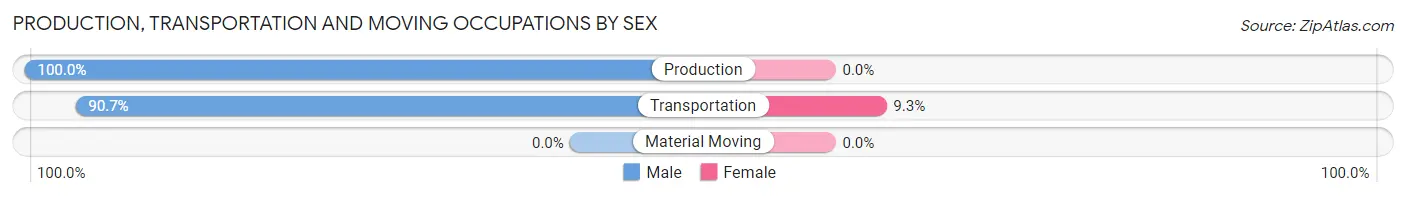
Production, Transportation and Moving Occupations by Sex
| Occupation | Male | Female |
| Production | 170 (100.0%) | 0 (0.0%) |
| Transportation | 68 (90.7%) | 7 (9.3%) |
| Material Moving | 0 (0.0%) | 0 (0.0%) |
| Total (Category) | 238 (97.1%) | 7 (2.9%) |
| Total (Overall) | 1,241 (55.2%) | 1,009 (44.8%) |
Employment Industries by Sex in Moxee
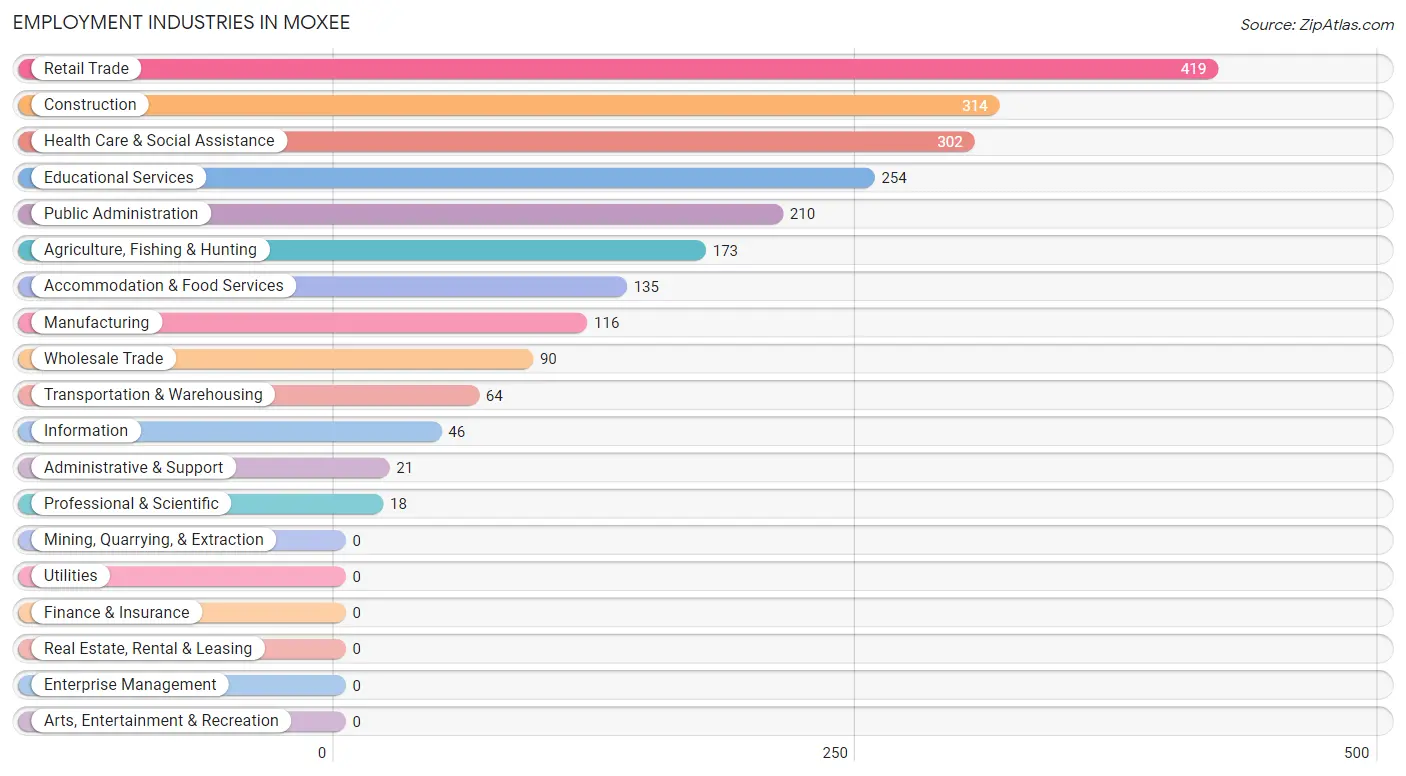
Employment Industries in Moxee
The major employment industries in Moxee include Retail Trade (419 | 18.6%), Construction (314 | 14.0%), Health Care & Social Assistance (302 | 13.4%), Educational Services (254 | 11.3%), and Public Administration (210 | 9.3%).
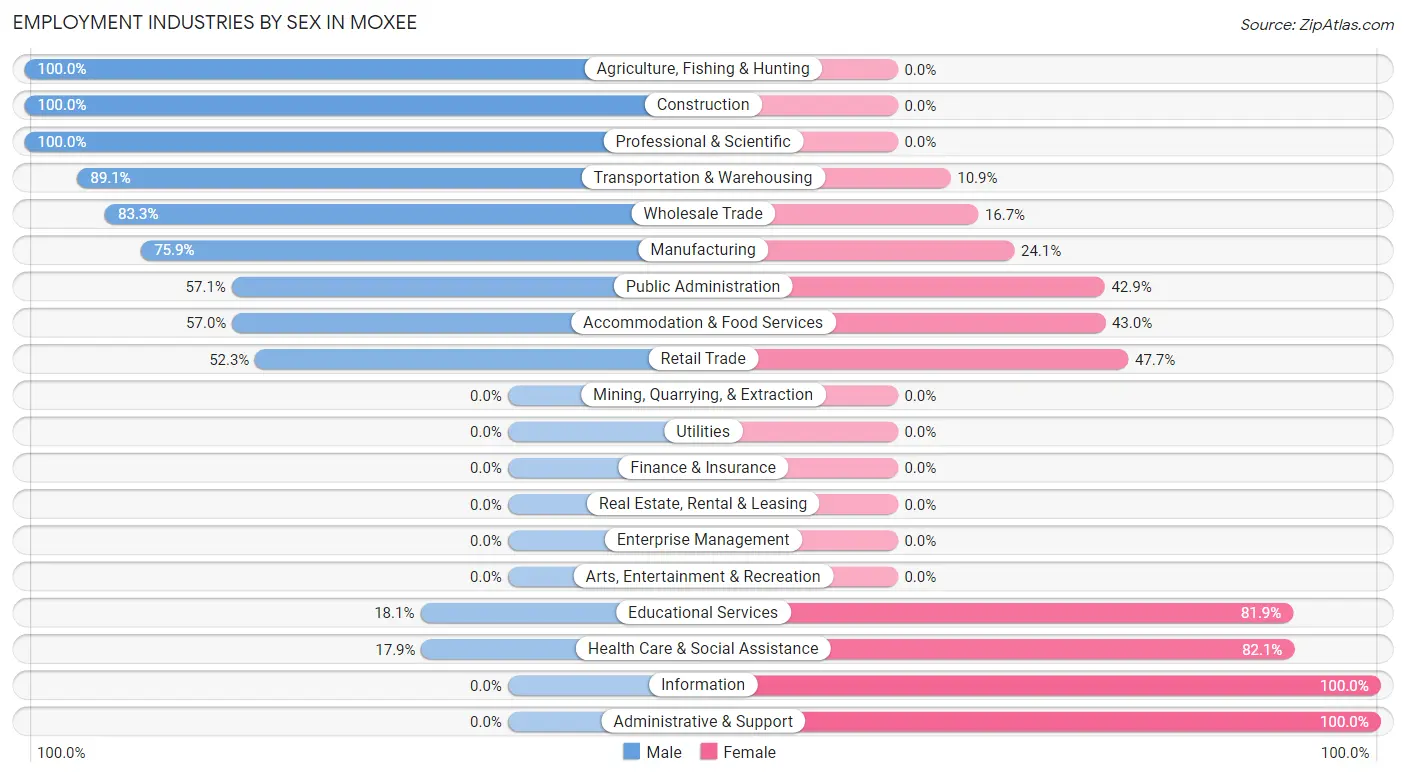
Employment Industries by Sex in Moxee
The Moxee industries that see more men than women are Agriculture, Fishing & Hunting (100.0%), Construction (100.0%), and Professional & Scientific (100.0%), whereas the industries that tend to have a higher number of women are Information (100.0%), Administrative & Support (100.0%), and Health Care & Social Assistance (82.1%).
| Industry | Male | Female |
| Agriculture, Fishing & Hunting | 173 (100.0%) | 0 (0.0%) |
| Mining, Quarrying, & Extraction | 0 (0.0%) | 0 (0.0%) |
| Construction | 314 (100.0%) | 0 (0.0%) |
| Manufacturing | 88 (75.9%) | 28 (24.1%) |
| Wholesale Trade | 75 (83.3%) | 15 (16.7%) |
| Retail Trade | 219 (52.3%) | 200 (47.7%) |
| Transportation & Warehousing | 57 (89.1%) | 7 (10.9%) |
| Utilities | 0 (0.0%) | 0 (0.0%) |
| Information | 0 (0.0%) | 46 (100.0%) |
| Finance & Insurance | 0 (0.0%) | 0 (0.0%) |
| Real Estate, Rental & Leasing | 0 (0.0%) | 0 (0.0%) |
| Professional & Scientific | 18 (100.0%) | 0 (0.0%) |
| Enterprise Management | 0 (0.0%) | 0 (0.0%) |
| Administrative & Support | 0 (0.0%) | 21 (100.0%) |
| Educational Services | 46 (18.1%) | 208 (81.9%) |
| Health Care & Social Assistance | 54 (17.9%) | 248 (82.1%) |
| Arts, Entertainment & Recreation | 0 (0.0%) | 0 (0.0%) |
| Accommodation & Food Services | 77 (57.0%) | 58 (43.0%) |
| Public Administration | 120 (57.1%) | 90 (42.9%) |
| Total | 1,241 (55.2%) | 1,009 (44.8%) |
Education in Moxee
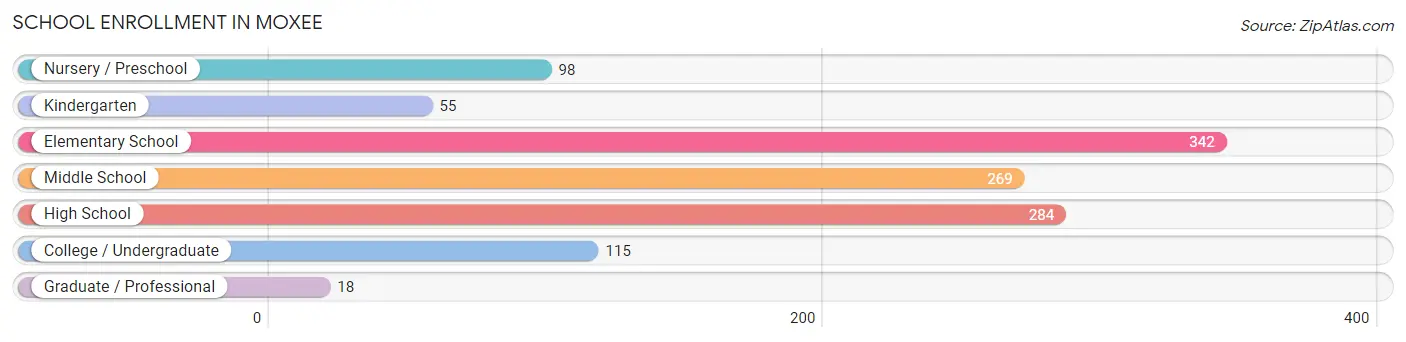
School Enrollment in Moxee
The most common levels of schooling among the 1,181 students in Moxee are elementary school (342 | 29.0%), high school (284 | 24.0%), and middle school (269 | 22.8%).
| School Level | # Students | % Students |
| Nursery / Preschool | 98 | 8.3% |
| Kindergarten | 55 | 4.7% |
| Elementary School | 342 | 29.0% |
| Middle School | 269 | 22.8% |
| High School | 284 | 24.0% |
| College / Undergraduate | 115 | 9.7% |
| Graduate / Professional | 18 | 1.5% |
| Total | 1,181 | 100.0% |
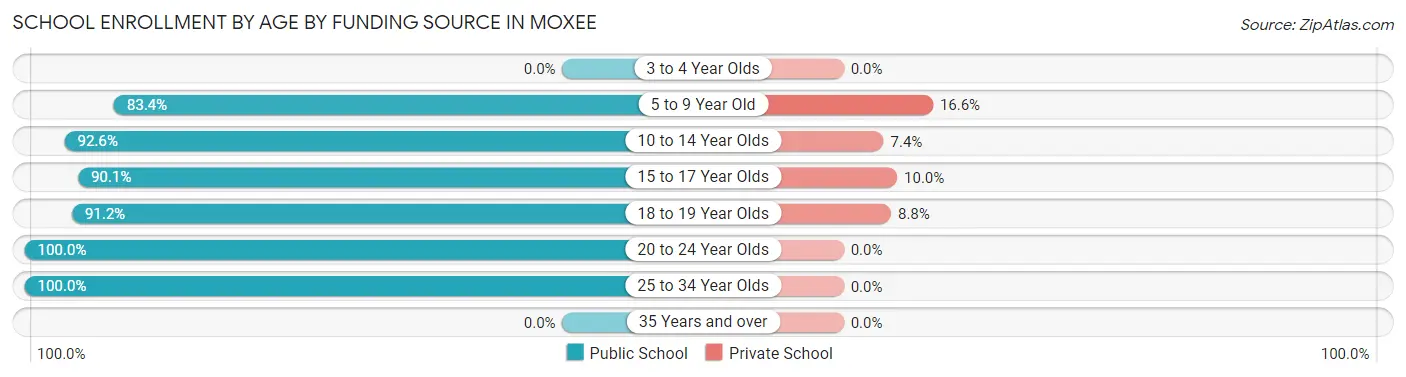
School Enrollment by Age by Funding Source in Moxee
Out of a total of 1,181 students who are enrolled in schools in Moxee, 128 (10.8%) attend a private institution, while the remaining 1,053 (89.2%) are enrolled in public schools. The age group of 5 to 9 year old has the highest likelihood of being enrolled in private schools, with 74 (16.6% in the age bracket) enrolled. Conversely, the age group of 20 to 24 year olds has the lowest likelihood of being enrolled in a private school, with 61 (100.0% in the age bracket) attending a public institution.
| Age Bracket | Public School | Private School |
| 3 to 4 Year Olds | 0 (0.0%) | 0 (0.0%) |
| 5 to 9 Year Old | 371 (83.4%) | 74 (16.6%) |
| 10 to 14 Year Olds | 311 (92.6%) | 25 (7.4%) |
| 15 to 17 Year Olds | 172 (90.0%) | 19 (10.0%) |
| 18 to 19 Year Olds | 93 (91.2%) | 9 (8.8%) |
| 20 to 24 Year Olds | 61 (100.0%) | 0 (0.0%) |
| 25 to 34 Year Olds | 46 (100.0%) | 0 (0.0%) |
| 35 Years and over | 0 (0.0%) | 0 (0.0%) |
| Total | 1,053 (89.2%) | 128 (10.8%) |
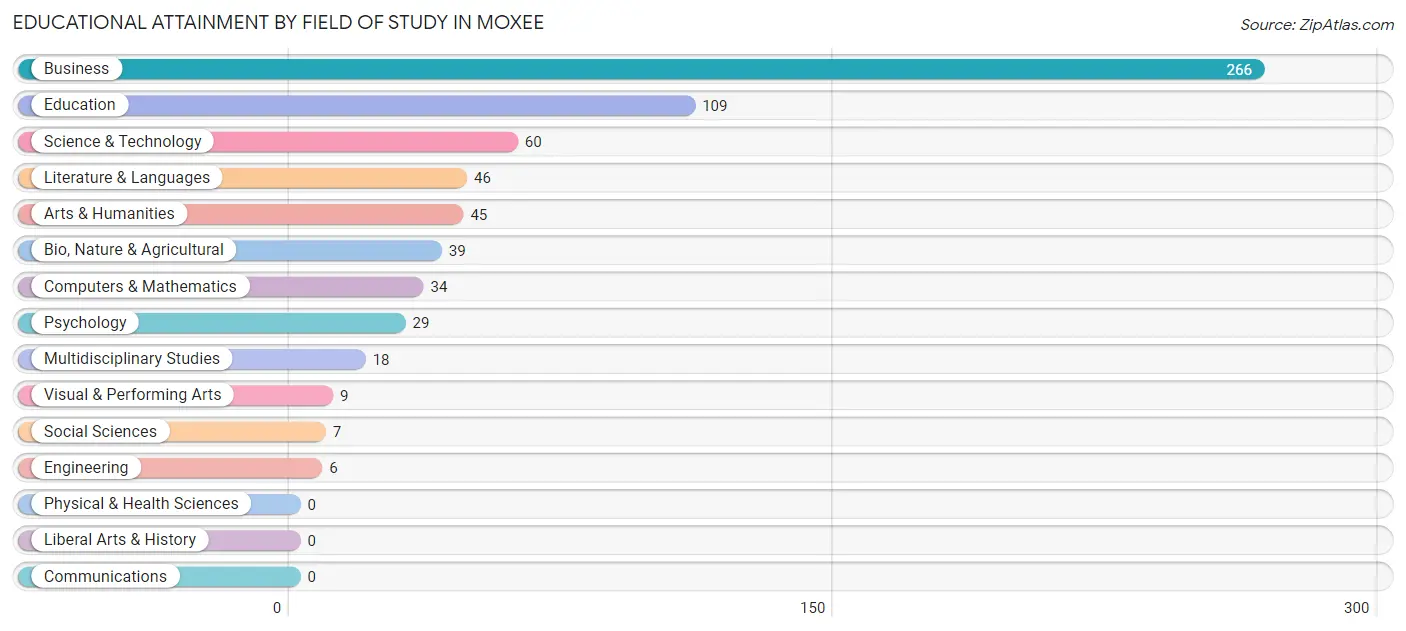
Educational Attainment by Field of Study in Moxee
Business (266 | 39.8%), education (109 | 16.3%), science & technology (60 | 9.0%), literature & languages (46 | 6.9%), and arts & humanities (45 | 6.7%) are the most common fields of study among 668 individuals in Moxee who have obtained a bachelor's degree or higher.
| Field of Study | # Graduates | % Graduates |
| Computers & Mathematics | 34 | 5.1% |
| Bio, Nature & Agricultural | 39 | 5.8% |
| Physical & Health Sciences | 0 | 0.0% |
| Psychology | 29 | 4.3% |
| Social Sciences | 7 | 1.1% |
| Engineering | 6 | 0.9% |
| Multidisciplinary Studies | 18 | 2.7% |
| Science & Technology | 60 | 9.0% |
| Business | 266 | 39.8% |
| Education | 109 | 16.3% |
| Literature & Languages | 46 | 6.9% |
| Liberal Arts & History | 0 | 0.0% |
| Visual & Performing Arts | 9 | 1.3% |
| Communications | 0 | 0.0% |
| Arts & Humanities | 45 | 6.7% |
| Total | 668 | 100.0% |
Transportation & Commute in Moxee
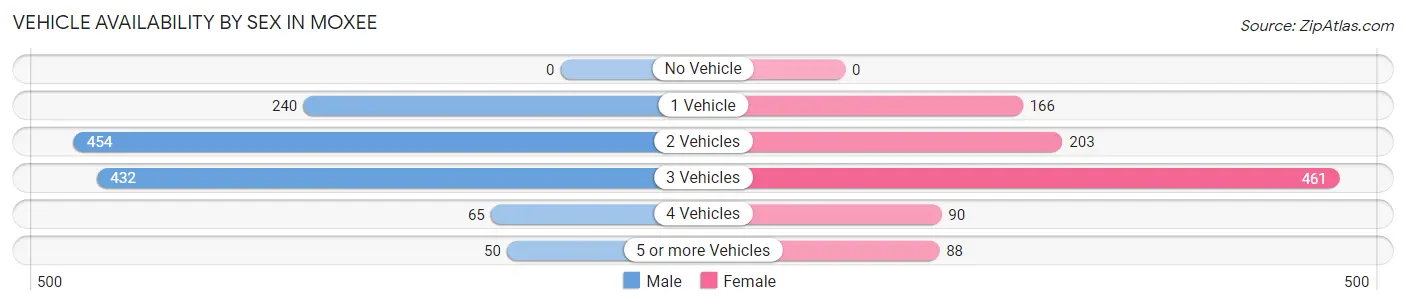
Vehicle Availability by Sex in Moxee
The most prevalent vehicle ownership categories in Moxee are males with 2 vehicles (454, accounting for 36.6%) and females with 2 vehicles (203, making up 45.0%).
| Vehicles Available | Male | Female |
| No Vehicle | 0 (0.0%) | 0 (0.0%) |
| 1 Vehicle | 240 (19.3%) | 166 (16.5%) |
| 2 Vehicles | 454 (36.6%) | 203 (20.1%) |
| 3 Vehicles | 432 (34.8%) | 461 (45.7%) |
| 4 Vehicles | 65 (5.2%) | 90 (8.9%) |
| 5 or more Vehicles | 50 (4.0%) | 88 (8.7%) |
| Total | 1,241 (100.0%) | 1,008 (100.0%) |
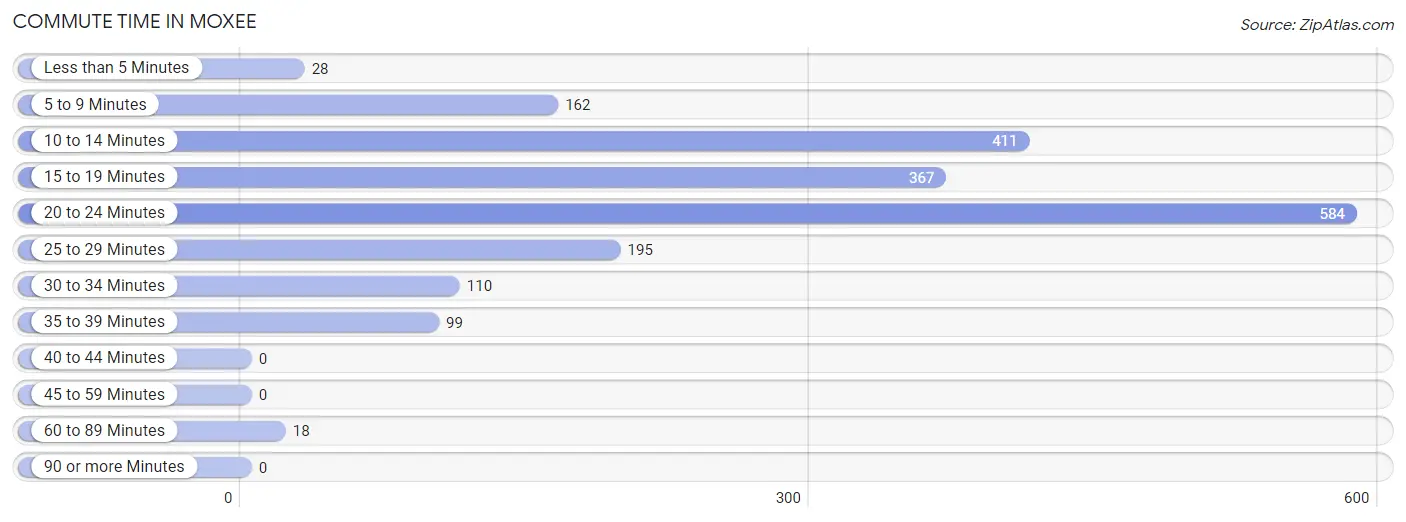
Commute Time in Moxee
The most frequently occuring commute durations in Moxee are 20 to 24 minutes (584 commuters, 29.6%), 10 to 14 minutes (411 commuters, 20.8%), and 15 to 19 minutes (367 commuters, 18.6%).
| Commute Time | # Commuters | % Commuters |
| Less than 5 Minutes | 28 | 1.4% |
| 5 to 9 Minutes | 162 | 8.2% |
| 10 to 14 Minutes | 411 | 20.8% |
| 15 to 19 Minutes | 367 | 18.6% |
| 20 to 24 Minutes | 584 | 29.6% |
| 25 to 29 Minutes | 195 | 9.9% |
| 30 to 34 Minutes | 110 | 5.6% |
| 35 to 39 Minutes | 99 | 5.0% |
| 40 to 44 Minutes | 0 | 0.0% |
| 45 to 59 Minutes | 0 | 0.0% |
| 60 to 89 Minutes | 18 | 0.9% |
| 90 or more Minutes | 0 | 0.0% |
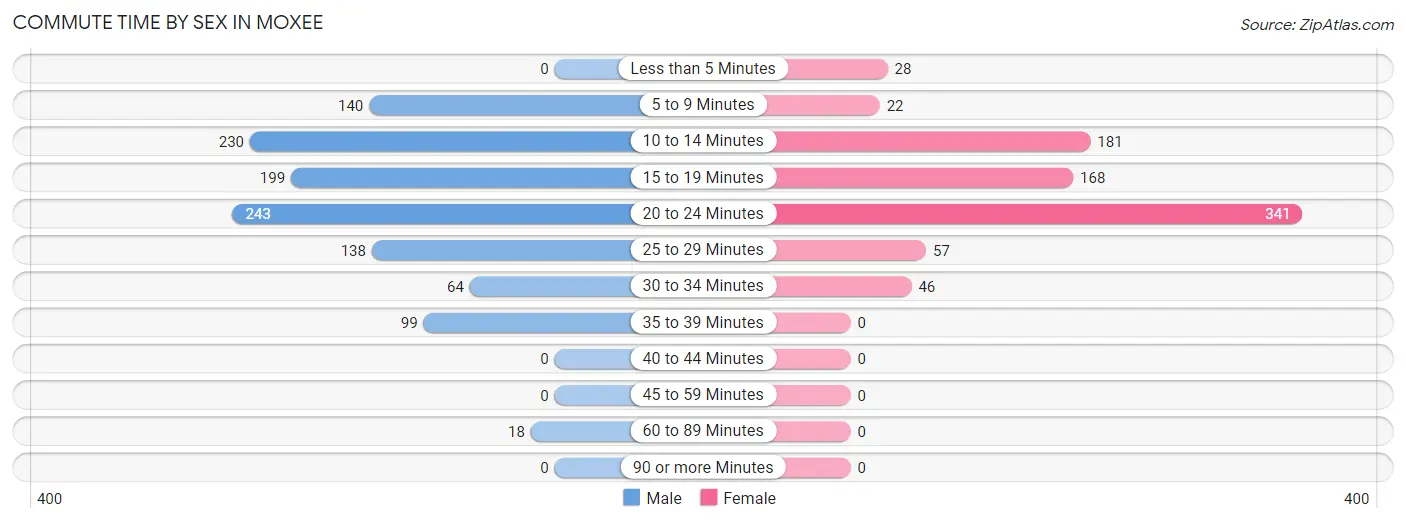
Commute Time by Sex in Moxee
The most common commute times in Moxee are 20 to 24 minutes (243 commuters, 21.5%) for males and 20 to 24 minutes (341 commuters, 40.5%) for females.
| Commute Time | Male | Female |
| Less than 5 Minutes | 0 (0.0%) | 28 (3.3%) |
| 5 to 9 Minutes | 140 (12.4%) | 22 (2.6%) |
| 10 to 14 Minutes | 230 (20.3%) | 181 (21.5%) |
| 15 to 19 Minutes | 199 (17.6%) | 168 (19.9%) |
| 20 to 24 Minutes | 243 (21.5%) | 341 (40.5%) |
| 25 to 29 Minutes | 138 (12.2%) | 57 (6.8%) |
| 30 to 34 Minutes | 64 (5.7%) | 46 (5.5%) |
| 35 to 39 Minutes | 99 (8.7%) | 0 (0.0%) |
| 40 to 44 Minutes | 0 (0.0%) | 0 (0.0%) |
| 45 to 59 Minutes | 0 (0.0%) | 0 (0.0%) |
| 60 to 89 Minutes | 18 (1.6%) | 0 (0.0%) |
| 90 or more Minutes | 0 (0.0%) | 0 (0.0%) |
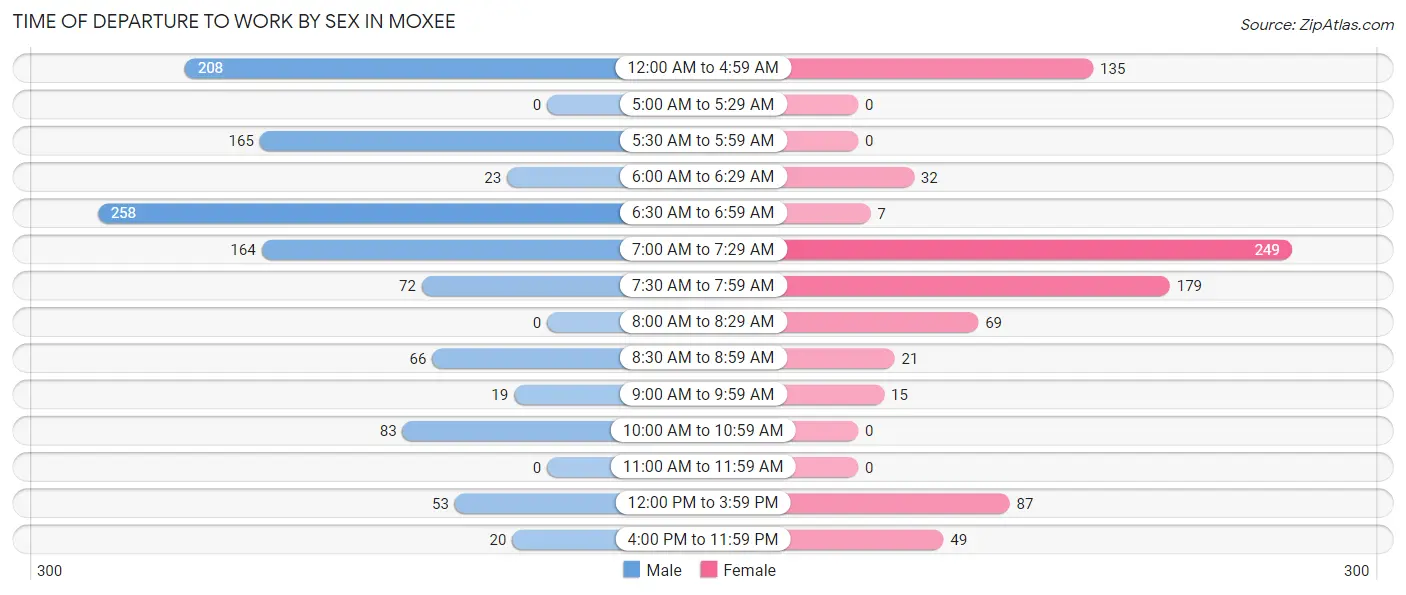
Time of Departure to Work by Sex in Moxee
The most frequent times of departure to work in Moxee are 6:30 AM to 6:59 AM (258, 22.8%) for males and 7:00 AM to 7:29 AM (249, 29.5%) for females.
| Time of Departure | Male | Female |
| 12:00 AM to 4:59 AM | 208 (18.4%) | 135 (16.0%) |
| 5:00 AM to 5:29 AM | 0 (0.0%) | 0 (0.0%) |
| 5:30 AM to 5:59 AM | 165 (14.6%) | 0 (0.0%) |
| 6:00 AM to 6:29 AM | 23 (2.0%) | 32 (3.8%) |
| 6:30 AM to 6:59 AM | 258 (22.8%) | 7 (0.8%) |
| 7:00 AM to 7:29 AM | 164 (14.5%) | 249 (29.5%) |
| 7:30 AM to 7:59 AM | 72 (6.4%) | 179 (21.2%) |
| 8:00 AM to 8:29 AM | 0 (0.0%) | 69 (8.2%) |
| 8:30 AM to 8:59 AM | 66 (5.8%) | 21 (2.5%) |
| 9:00 AM to 9:59 AM | 19 (1.7%) | 15 (1.8%) |
| 10:00 AM to 10:59 AM | 83 (7.3%) | 0 (0.0%) |
| 11:00 AM to 11:59 AM | 0 (0.0%) | 0 (0.0%) |
| 12:00 PM to 3:59 PM | 53 (4.7%) | 87 (10.3%) |
| 4:00 PM to 11:59 PM | 20 (1.8%) | 49 (5.8%) |
| Total | 1,131 (100.0%) | 843 (100.0%) |
Housing Occupancy in Moxee
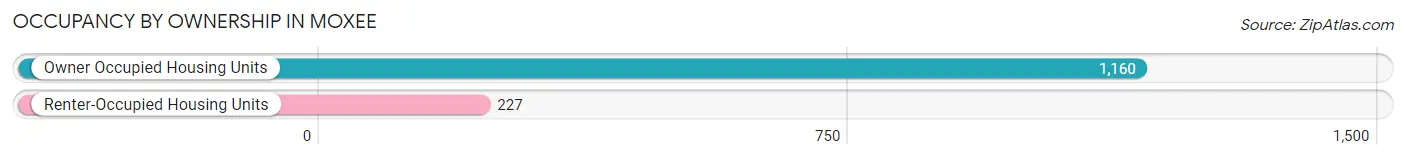
Occupancy by Ownership in Moxee
Of the total 1,387 dwellings in Moxee, owner-occupied units account for 1,160 (83.6%), while renter-occupied units make up 227 (16.4%).
| Occupancy | # Housing Units | % Housing Units |
| Owner Occupied Housing Units | 1,160 | 83.6% |
| Renter-Occupied Housing Units | 227 | 16.4% |
| Total Occupied Housing Units | 1,387 | 100.0% |
Occupancy by Household Size in Moxee
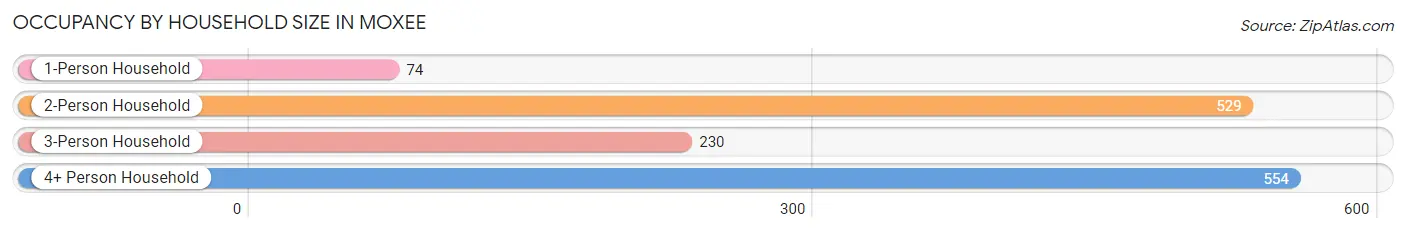
| Household Size | # Housing Units | % Housing Units |
| 1-Person Household | 74 | 5.3% |
| 2-Person Household | 529 | 38.1% |
| 3-Person Household | 230 | 16.6% |
| 4+ Person Household | 554 | 39.9% |
| Total Housing Units | 1,387 | 100.0% |
Occupancy by Ownership by Household Size in Moxee
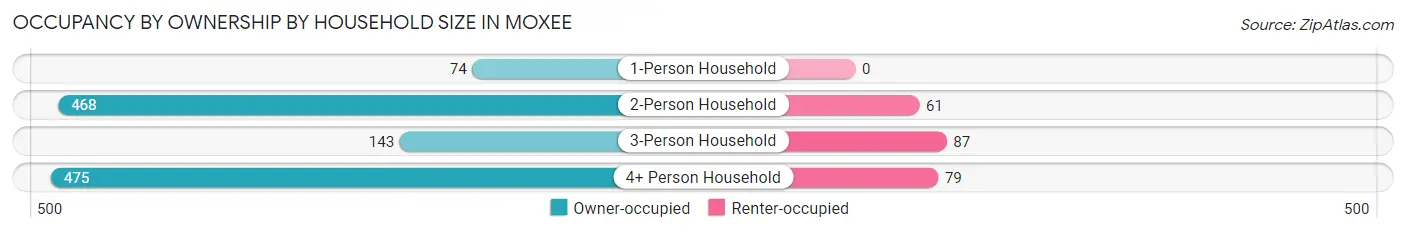
| Household Size | Owner-occupied | Renter-occupied |
| 1-Person Household | 74 (100.0%) | 0 (0.0%) |
| 2-Person Household | 468 (88.5%) | 61 (11.5%) |
| 3-Person Household | 143 (62.2%) | 87 (37.8%) |
| 4+ Person Household | 475 (85.7%) | 79 (14.3%) |
| Total Housing Units | 1,160 (83.6%) | 227 (16.4%) |
Occupancy by Educational Attainment in Moxee
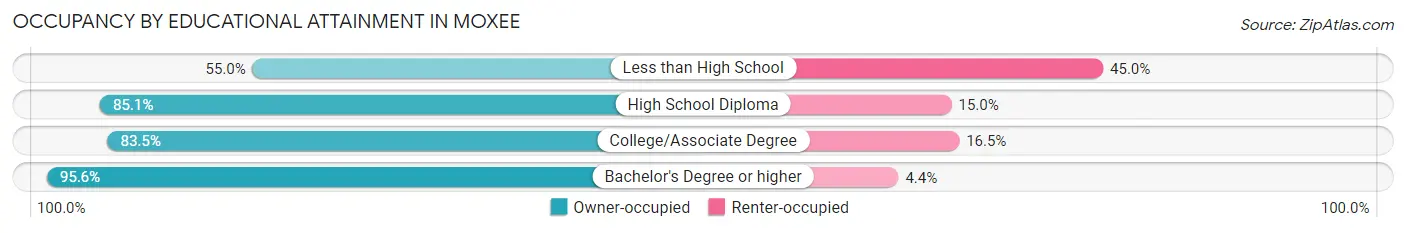
| Household Size | Owner-occupied | Renter-occupied |
| Less than High School | 88 (55.0%) | 72 (45.0%) |
| High School Diploma | 347 (85.1%) | 61 (14.9%) |
| College/Associate Degree | 401 (83.5%) | 79 (16.5%) |
| Bachelor's Degree or higher | 324 (95.6%) | 15 (4.4%) |
Occupancy by Age of Householder in Moxee
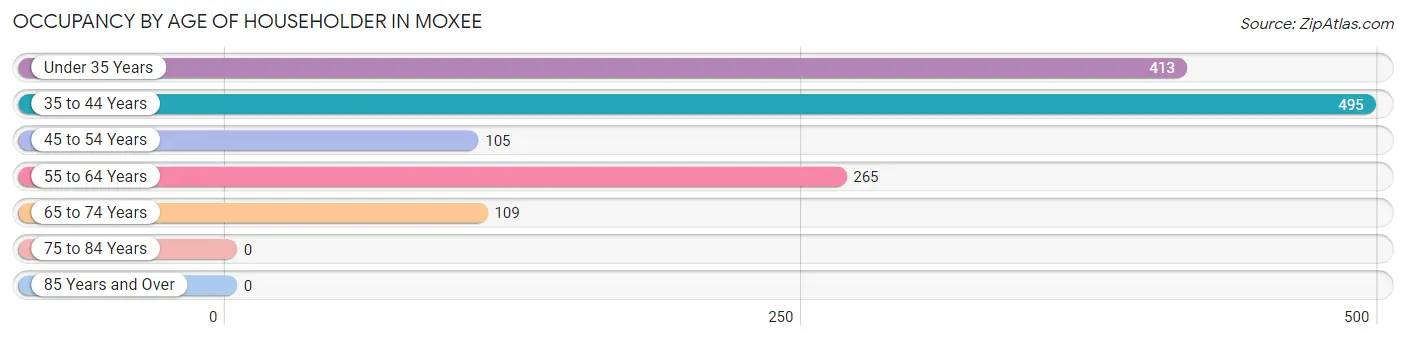
| Age Bracket | # Households | % Households |
| Under 35 Years | 413 | 29.8% |
| 35 to 44 Years | 495 | 35.7% |
| 45 to 54 Years | 105 | 7.6% |
| 55 to 64 Years | 265 | 19.1% |
| 65 to 74 Years | 109 | 7.9% |
| 75 to 84 Years | 0 | 0.0% |
| 85 Years and Over | 0 | 0.0% |
| Total | 1,387 | 100.0% |
Housing Finances in Moxee
Median Income by Occupancy in Moxee
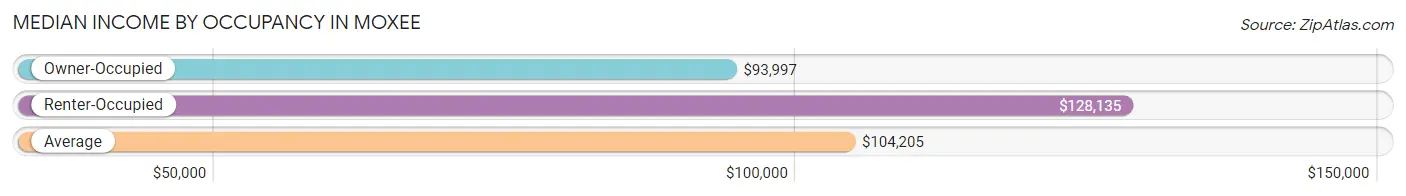
| Occupancy Type | # Households | Median Income |
| Owner-Occupied | 1,160 (83.6%) | $93,997 |
| Renter-Occupied | 227 (16.4%) | $128,135 |
| Average | 1,387 (100.0%) | $104,205 |
Occupancy by Householder Income Bracket in Moxee
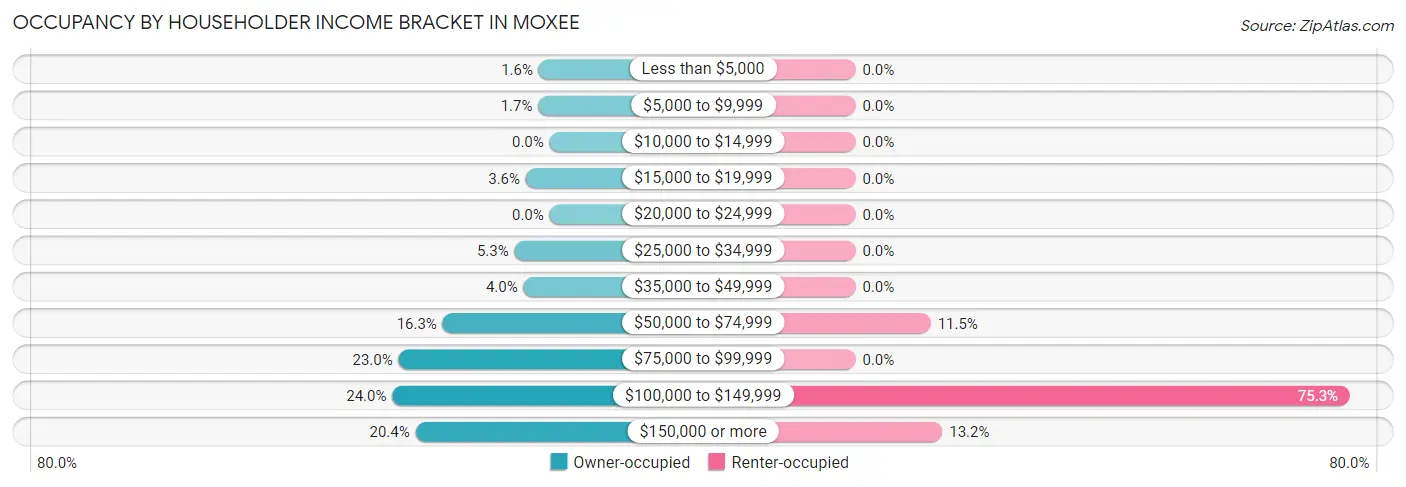
| Income Bracket | Owner-occupied | Renter-occupied |
| Less than $5,000 | 19 (1.6%) | 0 (0.0%) |
| $5,000 to $9,999 | 20 (1.7%) | 0 (0.0%) |
| $10,000 to $14,999 | 0 (0.0%) | 0 (0.0%) |
| $15,000 to $19,999 | 42 (3.6%) | 0 (0.0%) |
| $20,000 to $24,999 | 0 (0.0%) | 0 (0.0%) |
| $25,000 to $34,999 | 62 (5.3%) | 0 (0.0%) |
| $35,000 to $49,999 | 46 (4.0%) | 0 (0.0%) |
| $50,000 to $74,999 | 189 (16.3%) | 26 (11.5%) |
| $75,000 to $99,999 | 267 (23.0%) | 0 (0.0%) |
| $100,000 to $149,999 | 278 (24.0%) | 171 (75.3%) |
| $150,000 or more | 237 (20.4%) | 30 (13.2%) |
| Total | 1,160 (100.0%) | 227 (100.0%) |
Monthly Housing Cost Tiers in Moxee
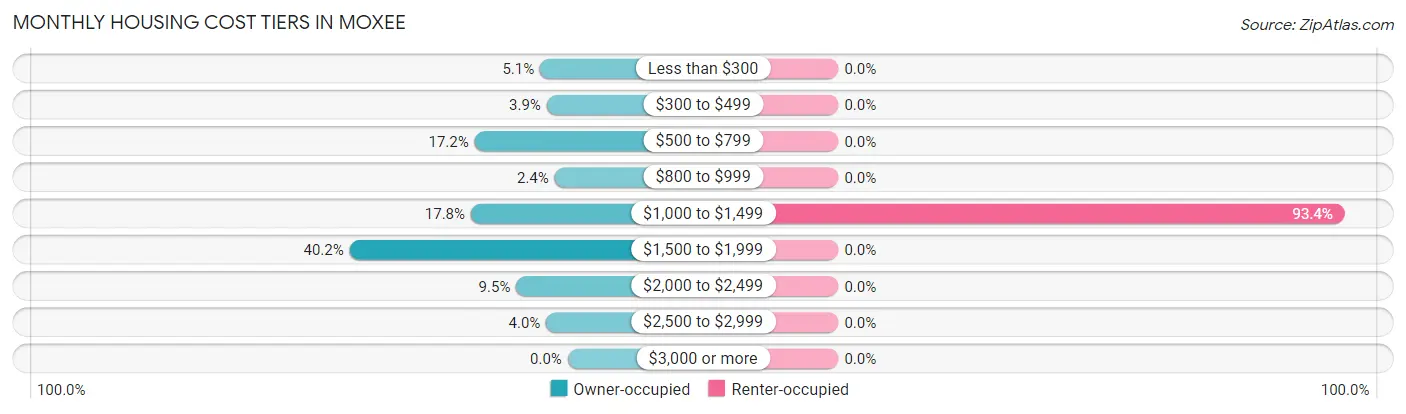
| Monthly Cost | Owner-occupied | Renter-occupied |
| Less than $300 | 59 (5.1%) | 0 (0.0%) |
| $300 to $499 | 45 (3.9%) | 0 (0.0%) |
| $500 to $799 | 199 (17.2%) | 0 (0.0%) |
| $800 to $999 | 28 (2.4%) | 0 (0.0%) |
| $1,000 to $1,499 | 207 (17.8%) | 212 (93.4%) |
| $1,500 to $1,999 | 466 (40.2%) | 0 (0.0%) |
| $2,000 to $2,499 | 110 (9.5%) | 0 (0.0%) |
| $2,500 to $2,999 | 46 (4.0%) | 0 (0.0%) |
| $3,000 or more | 0 (0.0%) | 0 (0.0%) |
| Total | 1,160 (100.0%) | 227 (100.0%) |
Physical Housing Characteristics in Moxee
Housing Structures in Moxee
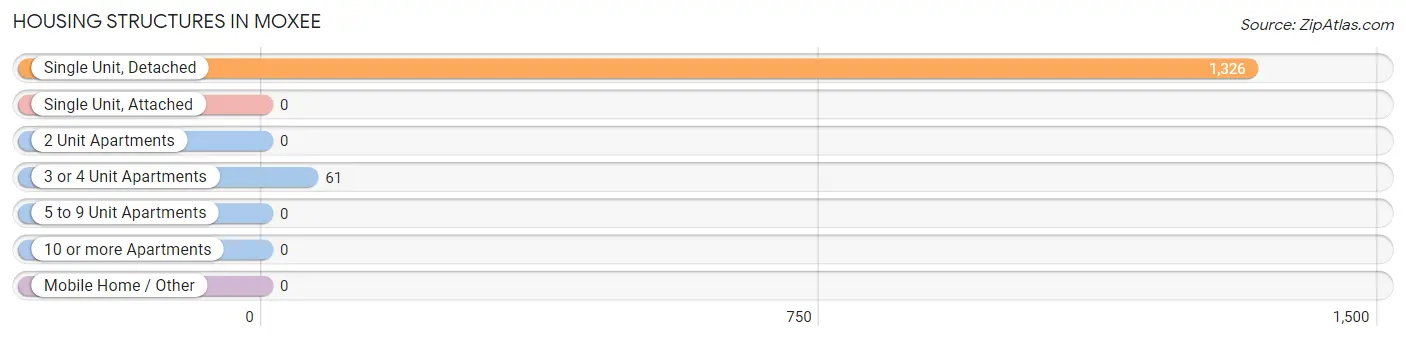
| Structure Type | # Housing Units | % Housing Units |
| Single Unit, Detached | 1,326 | 95.6% |
| Single Unit, Attached | 0 | 0.0% |
| 2 Unit Apartments | 0 | 0.0% |
| 3 or 4 Unit Apartments | 61 | 4.4% |
| 5 to 9 Unit Apartments | 0 | 0.0% |
| 10 or more Apartments | 0 | 0.0% |
| Mobile Home / Other | 0 | 0.0% |
| Total | 1,387 | 100.0% |
Housing Structures by Occupancy in Moxee
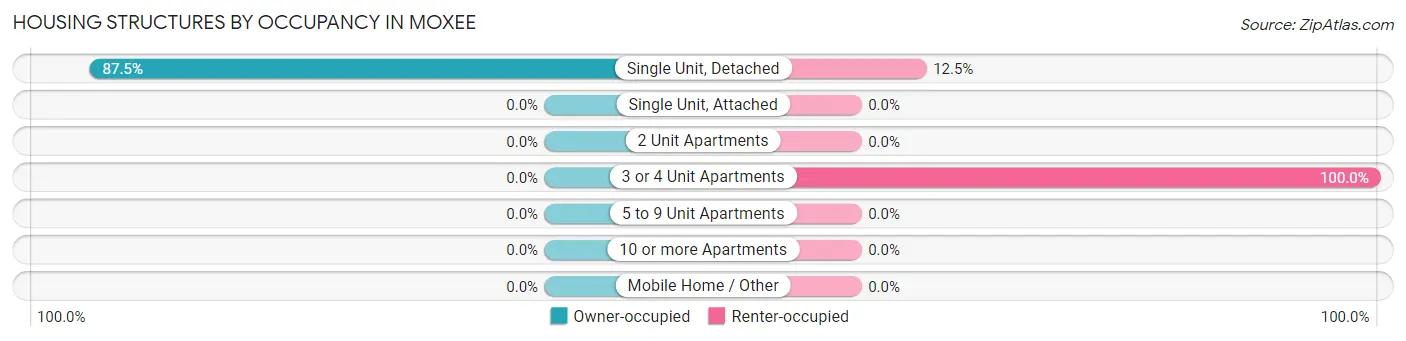
| Structure Type | Owner-occupied | Renter-occupied |
| Single Unit, Detached | 1,160 (87.5%) | 166 (12.5%) |
| Single Unit, Attached | 0 (0.0%) | 0 (0.0%) |
| 2 Unit Apartments | 0 (0.0%) | 0 (0.0%) |
| 3 or 4 Unit Apartments | 0 (0.0%) | 61 (100.0%) |
| 5 to 9 Unit Apartments | 0 (0.0%) | 0 (0.0%) |
| 10 or more Apartments | 0 (0.0%) | 0 (0.0%) |
| Mobile Home / Other | 0 (0.0%) | 0 (0.0%) |
| Total | 1,160 (83.6%) | 227 (16.4%) |
Housing Structures by Number of Rooms in Moxee
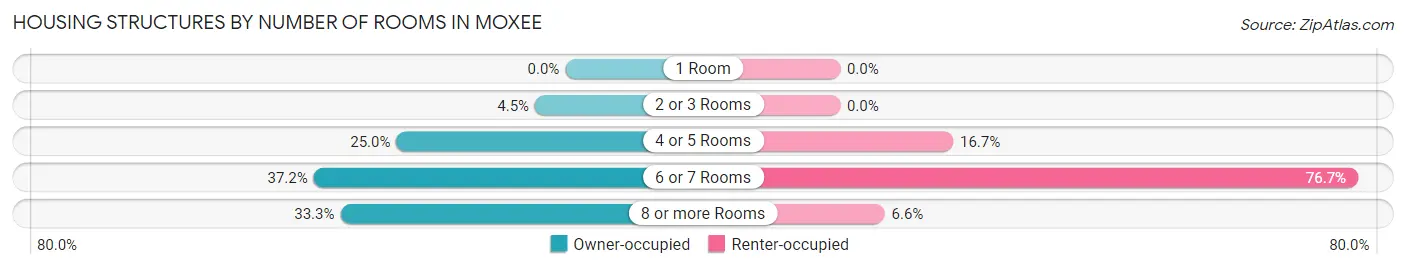
| Number of Rooms | Owner-occupied | Renter-occupied |
| 1 Room | 0 (0.0%) | 0 (0.0%) |
| 2 or 3 Rooms | 52 (4.5%) | 0 (0.0%) |
| 4 or 5 Rooms | 290 (25.0%) | 38 (16.7%) |
| 6 or 7 Rooms | 432 (37.2%) | 174 (76.6%) |
| 8 or more Rooms | 386 (33.3%) | 15 (6.6%) |
| Total | 1,160 (100.0%) | 227 (100.0%) |
Housing Structure by Heating Type in Moxee
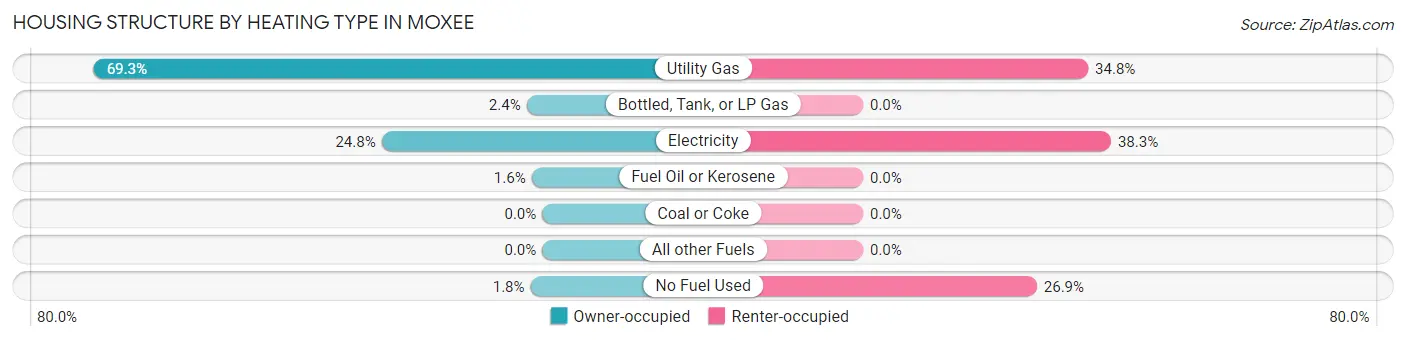
| Heating Type | Owner-occupied | Renter-occupied |
| Utility Gas | 804 (69.3%) | 79 (34.8%) |
| Bottled, Tank, or LP Gas | 28 (2.4%) | 0 (0.0%) |
| Electricity | 288 (24.8%) | 87 (38.3%) |
| Fuel Oil or Kerosene | 19 (1.6%) | 0 (0.0%) |
| Coal or Coke | 0 (0.0%) | 0 (0.0%) |
| All other Fuels | 0 (0.0%) | 0 (0.0%) |
| No Fuel Used | 21 (1.8%) | 61 (26.9%) |
| Total | 1,160 (100.0%) | 227 (100.0%) |
Household Vehicle Usage in Moxee
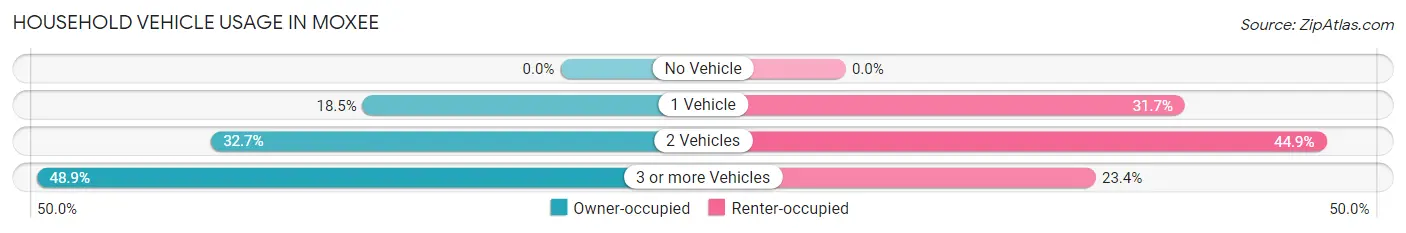
| Vehicles per Household | Owner-occupied | Renter-occupied |
| No Vehicle | 0 (0.0%) | 0 (0.0%) |
| 1 Vehicle | 214 (18.4%) | 72 (31.7%) |
| 2 Vehicles | 379 (32.7%) | 102 (44.9%) |
| 3 or more Vehicles | 567 (48.9%) | 53 (23.4%) |
| Total | 1,160 (100.0%) | 227 (100.0%) |
Real Estate & Mortgages in Moxee
Real Estate and Mortgage Overview in Moxee
| Characteristic | Without Mortgage | With Mortgage |
| Housing Units | 310 | 850 |
| Median Property Value | $291,000 | $307,700 |
| Median Household Income | $93,409 | $131 |
| Monthly Housing Costs | $627 | $0 |
| Real Estate Taxes | $2,859 | $19 |
Property Value by Mortgage Status in Moxee
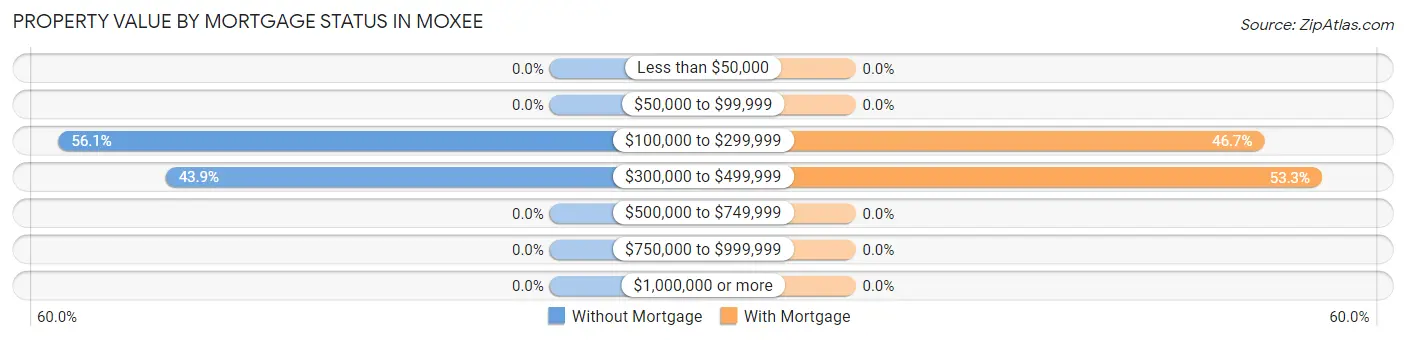
| Property Value | Without Mortgage | With Mortgage |
| Less than $50,000 | 0 (0.0%) | 0 (0.0%) |
| $50,000 to $99,999 | 0 (0.0%) | 0 (0.0%) |
| $100,000 to $299,999 | 174 (56.1%) | 397 (46.7%) |
| $300,000 to $499,999 | 136 (43.9%) | 453 (53.3%) |
| $500,000 to $749,999 | 0 (0.0%) | 0 (0.0%) |
| $750,000 to $999,999 | 0 (0.0%) | 0 (0.0%) |
| $1,000,000 or more | 0 (0.0%) | 0 (0.0%) |
| Total | 310 (100.0%) | 850 (100.0%) |
Household Income by Mortgage Status in Moxee
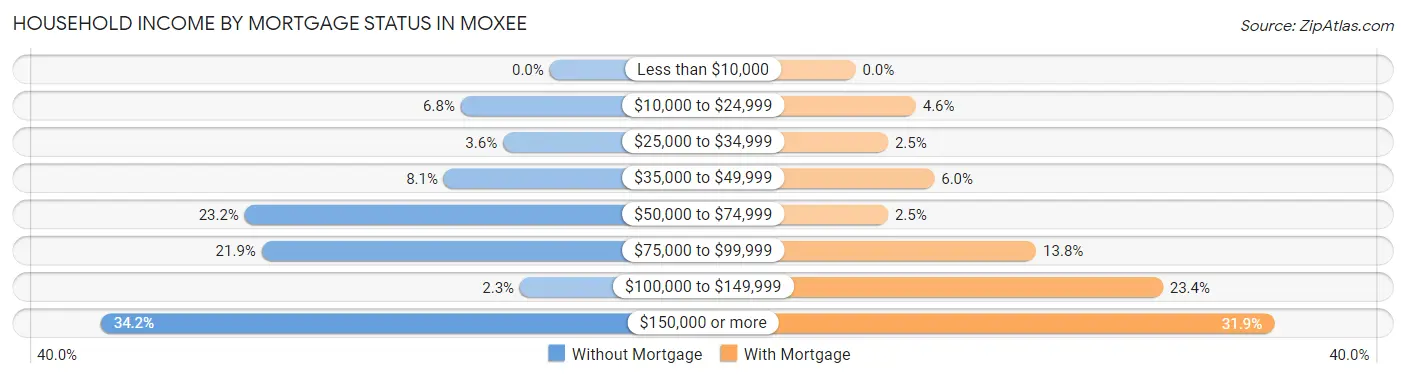
| Household Income | Without Mortgage | With Mortgage |
| Less than $10,000 | 0 (0.0%) | 0 (0.0%) |
| $10,000 to $24,999 | 21 (6.8%) | 39 (4.6%) |
| $25,000 to $34,999 | 11 (3.5%) | 21 (2.5%) |
| $35,000 to $49,999 | 25 (8.1%) | 51 (6.0%) |
| $50,000 to $74,999 | 72 (23.2%) | 21 (2.5%) |
| $75,000 to $99,999 | 68 (21.9%) | 117 (13.8%) |
| $100,000 to $149,999 | 7 (2.3%) | 199 (23.4%) |
| $150,000 or more | 106 (34.2%) | 271 (31.9%) |
| Total | 310 (100.0%) | 850 (100.0%) |
Property Value to Household Income Ratio in Moxee
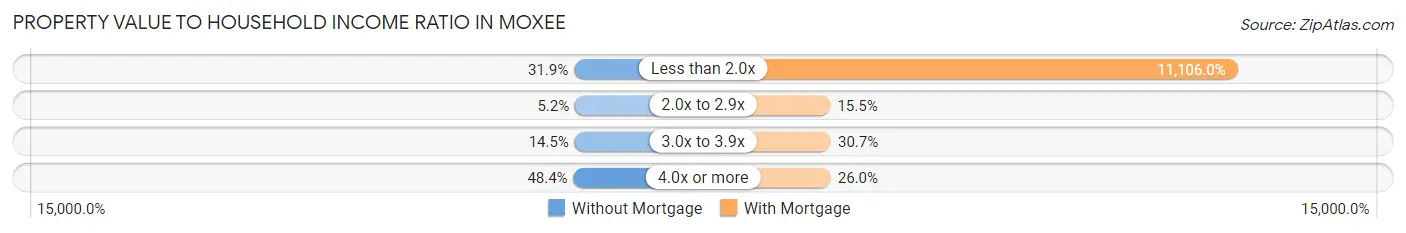
| Value-to-Income Ratio | Without Mortgage | With Mortgage |
| Less than 2.0x | 99 (31.9%) | 94,401 (11,106.0%) |
| 2.0x to 2.9x | 16 (5.2%) | 132 (15.5%) |
| 3.0x to 3.9x | 45 (14.5%) | 261 (30.7%) |
| 4.0x or more | 150 (48.4%) | 221 (26.0%) |
| Total | 310 (100.0%) | 850 (100.0%) |
Real Estate Taxes by Mortgage Status in Moxee
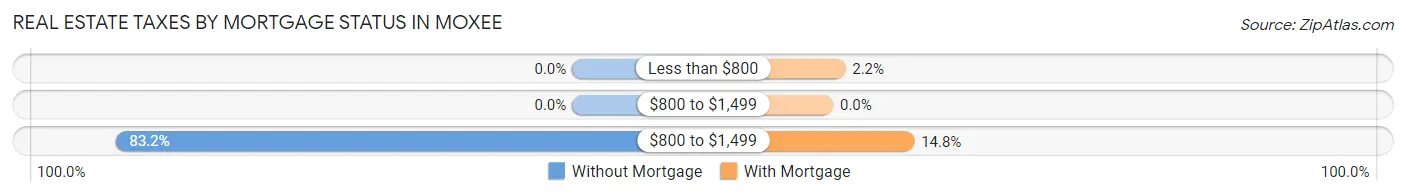
| Property Taxes | Without Mortgage | With Mortgage |
| Less than $800 | 0 (0.0%) | 19 (2.2%) |
| $800 to $1,499 | 0 (0.0%) | 0 (0.0%) |
| $800 to $1,499 | 258 (83.2%) | 126 (14.8%) |
| Total | 310 (100.0%) | 850 (100.0%) |
Health & Disability in Moxee
Health Insurance Coverage by Age in Moxee
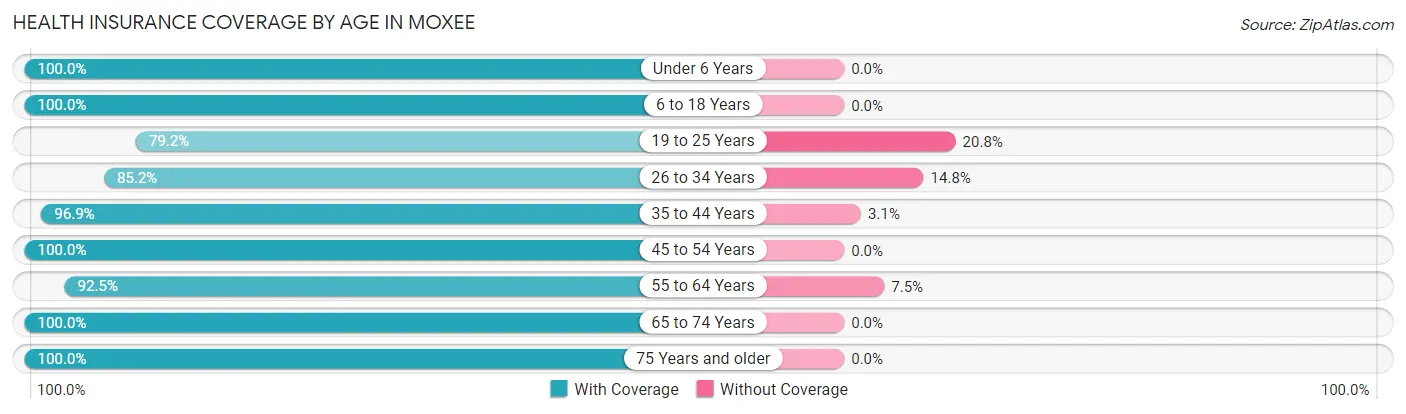
| Age Bracket | With Coverage | Without Coverage |
| Under 6 Years | 471 (100.0%) | 0 (0.0%) |
| 6 to 18 Years | 904 (100.0%) | 0 (0.0%) |
| 19 to 25 Years | 328 (79.2%) | 86 (20.8%) |
| 26 to 34 Years | 564 (85.2%) | 98 (14.8%) |
| 35 to 44 Years | 740 (96.9%) | 24 (3.1%) |
| 45 to 54 Years | 381 (100.0%) | 0 (0.0%) |
| 55 to 64 Years | 582 (92.5%) | 47 (7.5%) |
| 65 to 74 Years | 176 (100.0%) | 0 (0.0%) |
| 75 Years and older | 10 (100.0%) | 0 (0.0%) |
| Total | 4,156 (94.2%) | 255 (5.8%) |
Health Insurance Coverage by Citizenship Status in Moxee
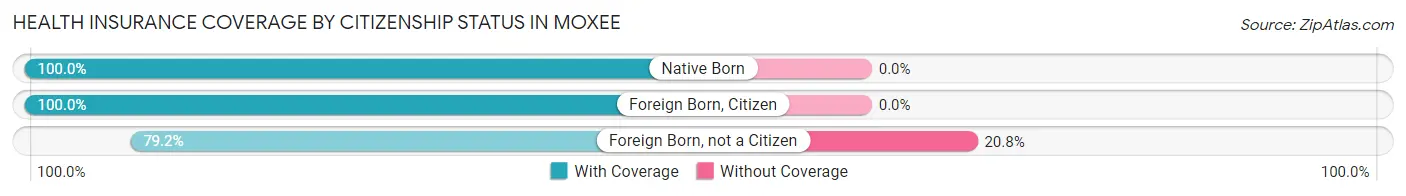
| Citizenship Status | With Coverage | Without Coverage |
| Native Born | 471 (100.0%) | 0 (0.0%) |
| Foreign Born, Citizen | 904 (100.0%) | 0 (0.0%) |
| Foreign Born, not a Citizen | 328 (79.2%) | 86 (20.8%) |
Health Insurance Coverage by Household Income in Moxee
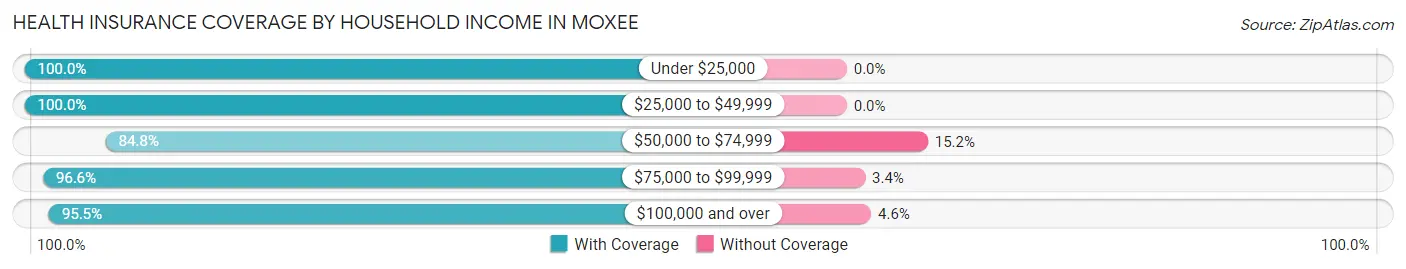
| Household Income | With Coverage | Without Coverage |
| Under $25,000 | 237 (100.0%) | 0 (0.0%) |
| $25,000 to $49,999 | 194 (100.0%) | 0 (0.0%) |
| $50,000 to $74,999 | 682 (84.8%) | 122 (15.2%) |
| $75,000 to $99,999 | 986 (96.6%) | 35 (3.4%) |
| $100,000 and over | 2,056 (95.5%) | 98 (4.5%) |
Public vs Private Health Insurance Coverage by Age in Moxee
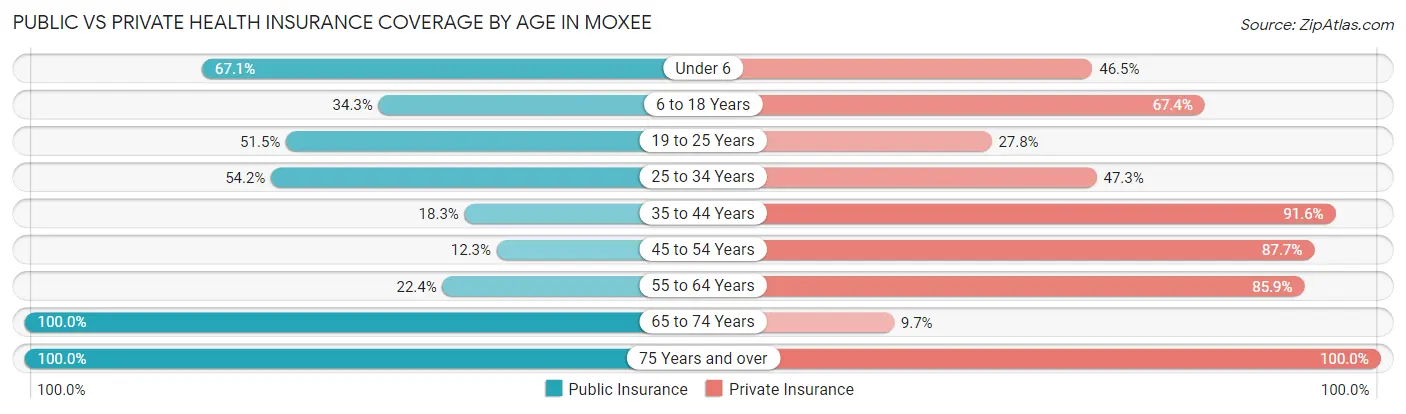
| Age Bracket | Public Insurance | Private Insurance |
| Under 6 | 316 (67.1%) | 219 (46.5%) |
| 6 to 18 Years | 310 (34.3%) | 609 (67.4%) |
| 19 to 25 Years | 213 (51.4%) | 115 (27.8%) |
| 25 to 34 Years | 359 (54.2%) | 313 (47.3%) |
| 35 to 44 Years | 140 (18.3%) | 700 (91.6%) |
| 45 to 54 Years | 47 (12.3%) | 334 (87.7%) |
| 55 to 64 Years | 141 (22.4%) | 540 (85.9%) |
| 65 to 74 Years | 176 (100.0%) | 17 (9.7%) |
| 75 Years and over | 10 (100.0%) | 10 (100.0%) |
| Total | 1,712 (38.8%) | 2,857 (64.8%) |
Disability Status by Sex by Age in Moxee
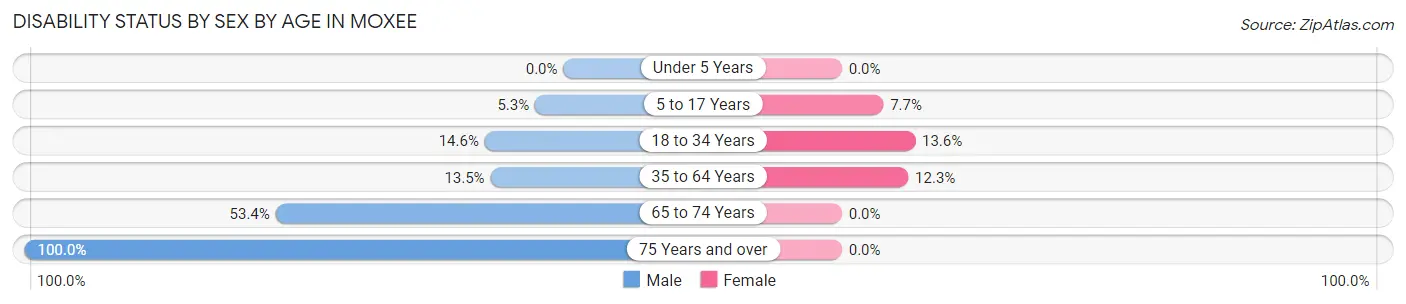
| Age Bracket | Male | Female |
| Under 5 Years | 0 (0.0%) | 0 (0.0%) |
| 5 to 17 Years | 34 (5.3%) | 25 (7.7%) |
| 18 to 34 Years | 90 (14.6%) | 74 (13.6%) |
| 35 to 64 Years | 117 (13.5%) | 112 (12.3%) |
| 65 to 74 Years | 47 (53.4%) | 0 (0.0%) |
| 75 Years and over | 10 (100.0%) | 0 (0.0%) |
Disability Class by Sex by Age in Moxee
Disability Class: Hearing Difficulty
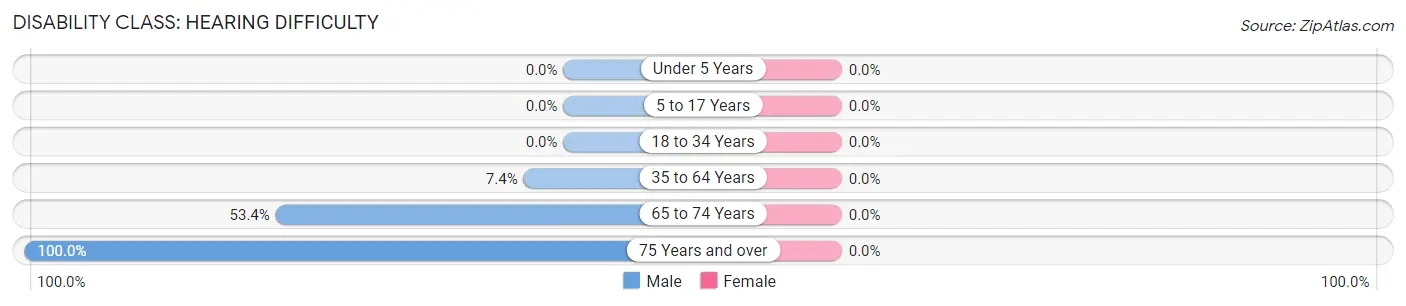
| Age Bracket | Male | Female |
| Under 5 Years | 0 (0.0%) | 0 (0.0%) |
| 5 to 17 Years | 0 (0.0%) | 0 (0.0%) |
| 18 to 34 Years | 0 (0.0%) | 0 (0.0%) |
| 35 to 64 Years | 64 (7.4%) | 0 (0.0%) |
| 65 to 74 Years | 47 (53.4%) | 0 (0.0%) |
| 75 Years and over | 10 (100.0%) | 0 (0.0%) |
Disability Class: Vision Difficulty
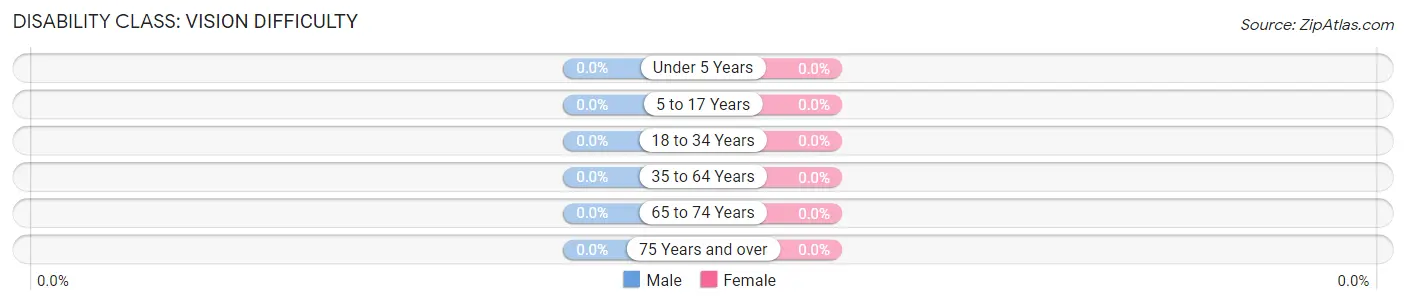
| Age Bracket | Male | Female |
| Under 5 Years | 0 (0.0%) | 0 (0.0%) |
| 5 to 17 Years | 0 (0.0%) | 0 (0.0%) |
| 18 to 34 Years | 0 (0.0%) | 0 (0.0%) |
| 35 to 64 Years | 0 (0.0%) | 0 (0.0%) |
| 65 to 74 Years | 0 (0.0%) | 0 (0.0%) |
| 75 Years and over | 0 (0.0%) | 0 (0.0%) |
Disability Class: Cognitive Difficulty
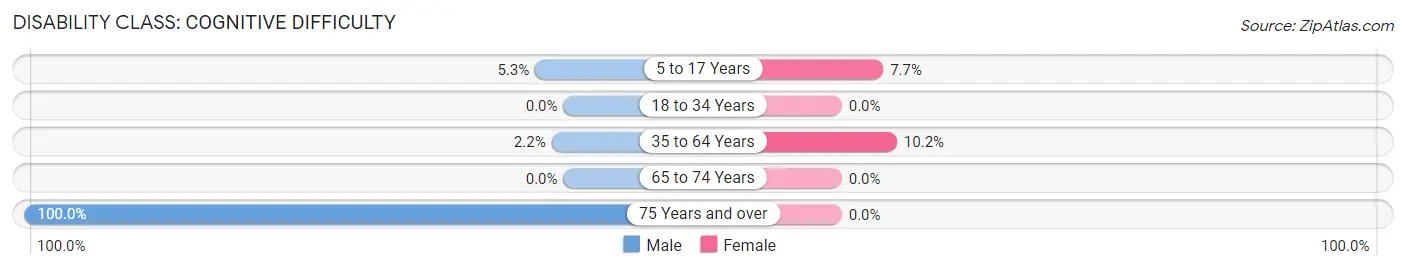
| Age Bracket | Male | Female |
| 5 to 17 Years | 34 (5.3%) | 25 (7.7%) |
| 18 to 34 Years | 0 (0.0%) | 0 (0.0%) |
| 35 to 64 Years | 19 (2.2%) | 93 (10.2%) |
| 65 to 74 Years | 0 (0.0%) | 0 (0.0%) |
| 75 Years and over | 10 (100.0%) | 0 (0.0%) |
Disability Class: Ambulatory Difficulty
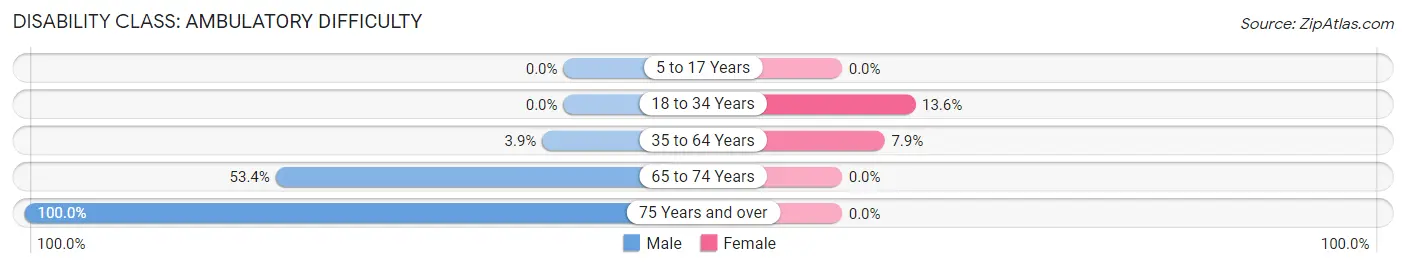
| Age Bracket | Male | Female |
| 5 to 17 Years | 0 (0.0%) | 0 (0.0%) |
| 18 to 34 Years | 0 (0.0%) | 74 (13.6%) |
| 35 to 64 Years | 34 (3.9%) | 72 (7.9%) |
| 65 to 74 Years | 47 (53.4%) | 0 (0.0%) |
| 75 Years and over | 10 (100.0%) | 0 (0.0%) |
Disability Class: Self-Care Difficulty
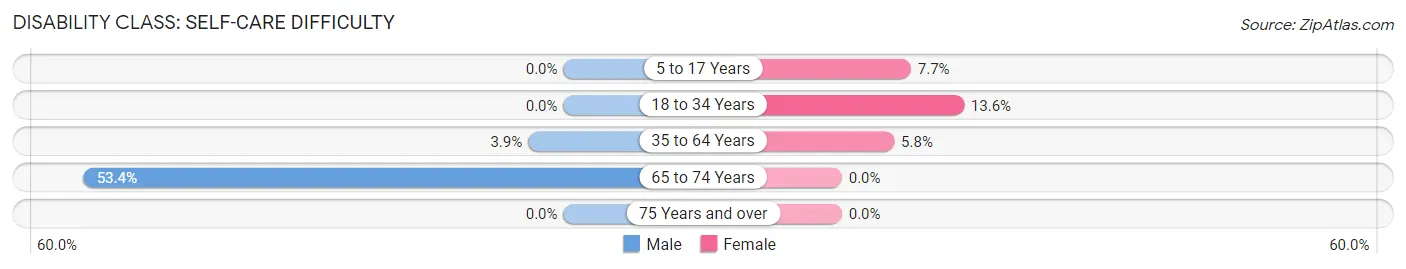
| Age Bracket | Male | Female |
| 5 to 17 Years | 0 (0.0%) | 25 (7.7%) |
| 18 to 34 Years | 0 (0.0%) | 74 (13.6%) |
| 35 to 64 Years | 34 (3.9%) | 53 (5.8%) |
| 65 to 74 Years | 47 (53.4%) | 0 (0.0%) |
| 75 Years and over | 0 (0.0%) | 0 (0.0%) |
Technology Access in Moxee
Computing Device Access in Moxee
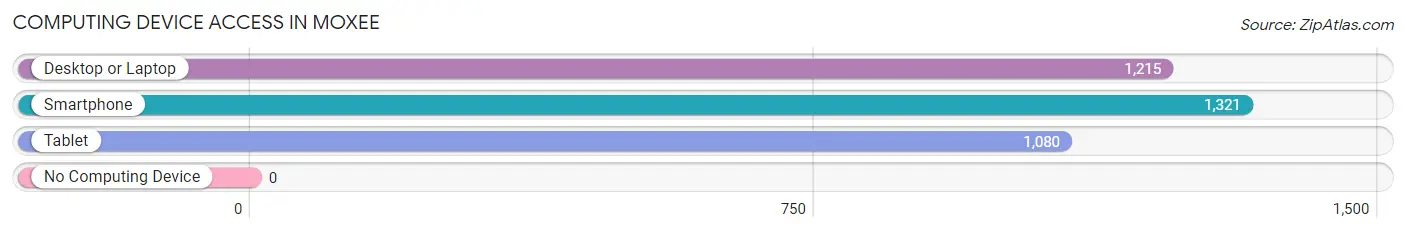
| Device Type | # Households | % Households |
| Desktop or Laptop | 1,215 | 87.6% |
| Smartphone | 1,321 | 95.2% |
| Tablet | 1,080 | 77.9% |
| No Computing Device | 0 | 0.0% |
| Total | 1,387 | 100.0% |
Internet Access in Moxee
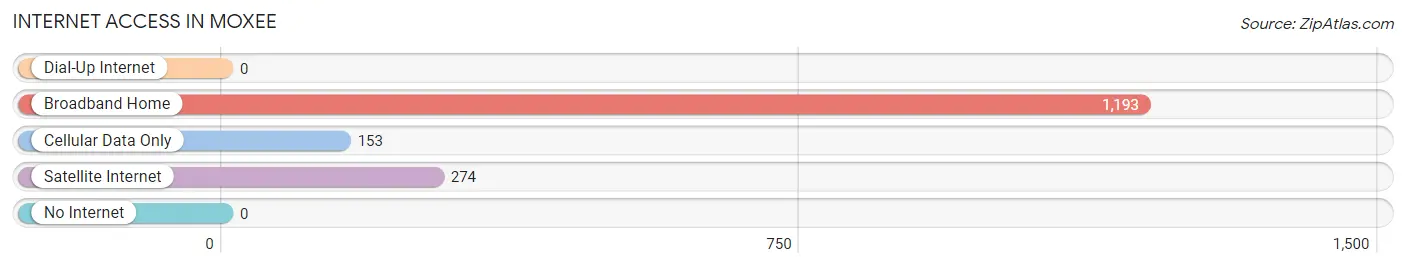
| Internet Type | # Households | % Households |
| Dial-Up Internet | 0 | 0.0% |
| Broadband Home | 1,193 | 86.0% |
| Cellular Data Only | 153 | 11.0% |
| Satellite Internet | 274 | 19.8% |
| No Internet | 0 | 0.0% |
| Total | 1,387 | 100.0% |
Moxee Summary
Moxee, Washington is a small city located in Yakima County, Washington. It is situated in the Yakima Valley, which is known for its agricultural production. The city is located about 8 miles east of Yakima, the county seat, and about 140 miles southeast of Seattle. As of the 2010 census, the population of Moxee was 2,326.
History
Moxee was founded in 1891 by the Northern Pacific Railway. The city was named after the Moxee Indians, a Native American tribe that lived in the area. The city was originally a farming community, and the main crops grown were hops and apples. In the early 1900s, the city was home to several hop farms, and the hops were shipped to breweries around the country.
In the 1920s, the city began to grow and develop. The Northern Pacific Railway built a depot in the city, and the city was incorporated in 1923. The city continued to grow throughout the 20th century, and by the 2000s, it had become a bedroom community for Yakima.
Geography
Moxee is located in the Yakima Valley, which is known for its agricultural production. The city is situated at an elevation of 1,068 feet above sea level. The city is located about 8 miles east of Yakima, the county seat, and about 140 miles southeast of Seattle.
The city is located in a semi-arid climate zone, with hot summers and cold winters. The average annual precipitation is about 11 inches, and the average annual snowfall is about 8 inches.
Economy
Moxee’s economy is largely based on agriculture. The city is home to several hop farms, and the hops are shipped to breweries around the country. The city is also home to several wineries, and the wine is sold both locally and nationally.
In addition to agriculture, the city is home to several businesses, including a grocery store, a hardware store, and a few restaurants. The city is also home to a few manufacturing companies, including a plastics manufacturer and a metal fabrication company.
Demographics
As of the 2010 census, the population of Moxee was 2,326. The population is largely white (90.2%), with small percentages of Hispanic (4.2%), Asian (2.2%), and African American (1.2%) residents. The median household income is $45,938, and the median age is 36.
The city is home to several churches, including the Moxee United Methodist Church, the Moxee Presbyterian Church, and the Moxee Baptist Church. The city is also home to a public library, a community center, and several parks.
Conclusion
Moxee, Washington is a small city located in Yakima County, Washington. It is situated in the Yakima Valley, which is known for its agricultural production. The city is home to several hop farms, wineries, and other businesses. As of the 2010 census, the population of Moxee was 2,326, and the median household income is $45,938. The city is home to several churches, a public library, a community center, and several parks.
Common Questions
What is Per Capita Income in Moxee?
Per Capita income in Moxee is $33,502.
What is the Median Family Income in Moxee?
Median Family Income in Moxee is $94,397.
What is the Median Household income in Moxee?
Median Household Income in Moxee is $104,205.
What is Income or Wage Gap in Moxee?
Income or Wage Gap in Moxee is 37.6%.
Women in Moxee earn 62.4 cents for every dollar earned by a man.
What is Inequality or Gini Index in Moxee?
Inequality or Gini Index in Moxee is 0.27.
What is the Total Population of Moxee?
Total Population of Moxee is 4,411.
What is the Total Male Population of Moxee?
Total Male Population of Moxee is 2,348.
What is the Total Female Population of Moxee?
Total Female Population of Moxee is 2,063.
What is the Ratio of Males per 100 Females in Moxee?
There are 113.81 Males per 100 Females in Moxee.
What is the Ratio of Females per 100 Males in Moxee?
There are 87.86 Females per 100 Males in Moxee.
What is the Median Population Age in Moxee?
Median Population Age in Moxee is 32.6 Years.
What is the Average Family Size in Moxee
Average Family Size in Moxee is 3.3 People.
What is the Average Household Size in Moxee
Average Household Size in Moxee is 3.2 People.
How Large is the Labor Force in Moxee?
There are 2,280 People in the Labor Forcein in Moxee.
What is the Percentage of People in the Labor Force in Moxee?
72.1% of People are in the Labor Force in Moxee.
What is the Unemployment Rate in Moxee?
Unemployment Rate in Moxee is 1.3%.