Mead, WA Map & Demographics
Mead Map
Mead Overview
$35,129
PER CAPITA INCOME
$93,671
AVG FAMILY INCOME
$74,431
AVG HOUSEHOLD INCOME
37.9%
WAGE / INCOME GAP [ % ]
62.1¢/ $1
WAGE / INCOME GAP [ $ ]
0.39
INEQUALITY / GINI INDEX
7,172
TOTAL POPULATION
3,565
MALE POPULATION
3,607
FEMALE POPULATION
98.84
MALES / 100 FEMALES
101.18
FEMALES / 100 MALES
42.8
MEDIAN AGE
3.1
AVG FAMILY SIZE
2.8
AVG HOUSEHOLD SIZE
3,307
LABOR FORCE [ PEOPLE ]
57.8%
PERCENT IN LABOR FORCE
9.0%
UNEMPLOYMENT RATE
Mead Zip Codes
Mead Area Codes
Income in Mead
Income Overview in Mead
Per Capita Income in Mead is $35,129, while median incomes of families and households are $93,671 and $74,431 respectively.
| Characteristic | Number | Measure |
| Per Capita Income | 7,172 | $35,129 |
| Median Family Income | 1,981 | $93,671 |
| Mean Family Income | 1,981 | $108,483 |
| Median Household Income | 2,600 | $74,431 |
| Mean Household Income | 2,600 | $94,464 |
| Income Deficit | 1,981 | $0 |
| Wage / Income Gap (%) | 7,172 | 37.88% |
| Wage / Income Gap ($) | 7,172 | 62.12¢ per $1 |
| Gini / Inequality Index | 7,172 | 0.39 |
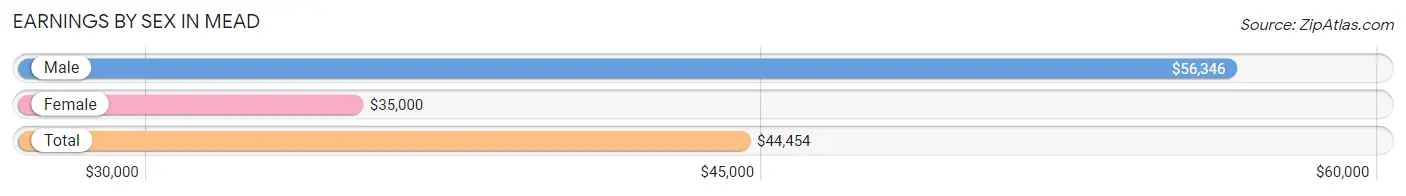
Earnings by Sex in Mead
Average Earnings in Mead are $44,454, $56,346 for men and $35,000 for women, a difference of 37.9%.
| Sex | Number | Average Earnings |
| Male | 1,846 (51.2%) | $56,346 |
| Female | 1,762 (48.8%) | $35,000 |
| Total | 3,608 (100.0%) | $44,454 |
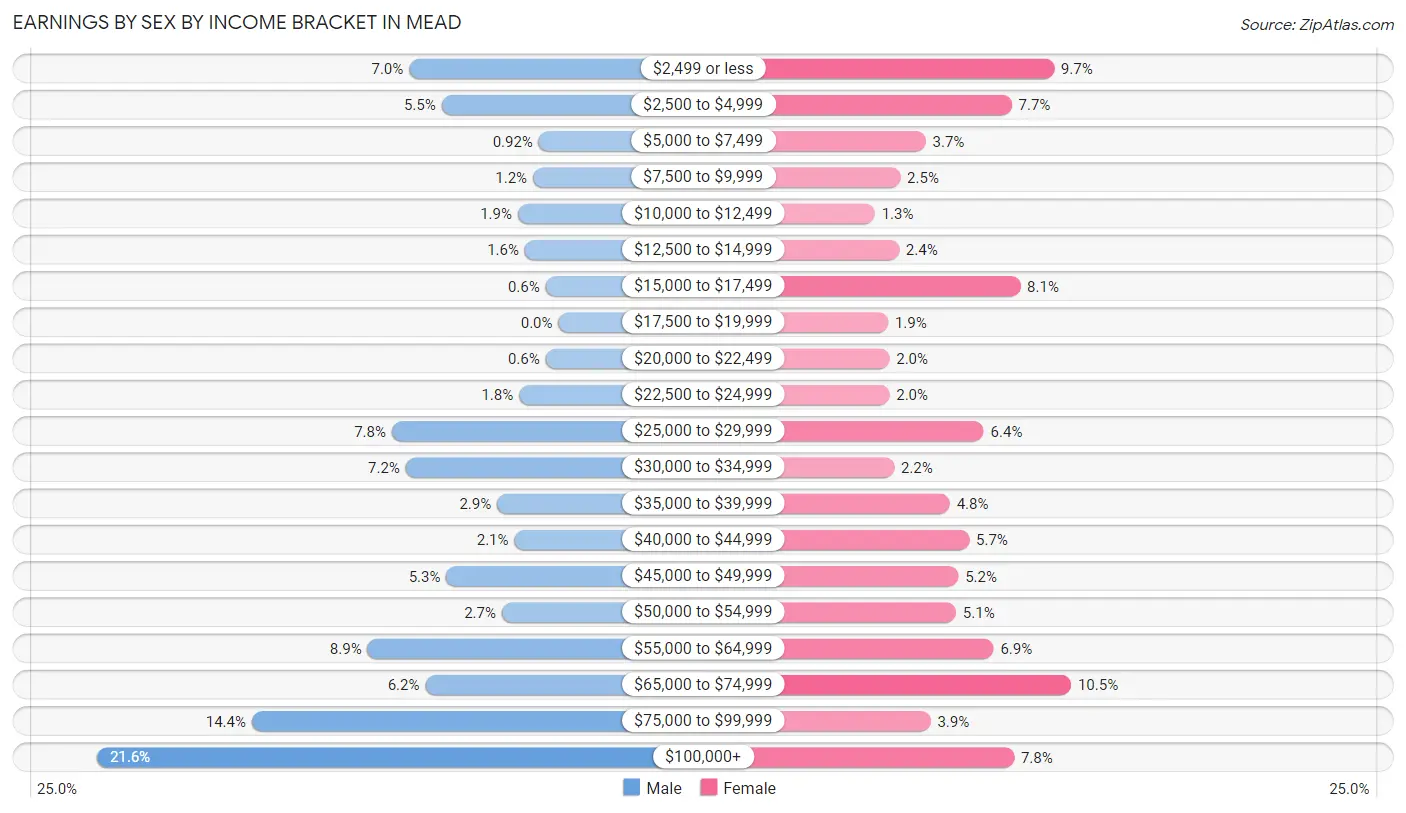
Earnings by Sex by Income Bracket in Mead
The most common earnings brackets in Mead are $100,000+ for men (399 | 21.6%) and $65,000 to $74,999 for women (185 | 10.5%).
| Income | Male | Female |
| $2,499 or less | 129 (7.0%) | 171 (9.7%) |
| $2,500 to $4,999 | 101 (5.5%) | 136 (7.7%) |
| $5,000 to $7,499 | 17 (0.9%) | 65 (3.7%) |
| $7,500 to $9,999 | 22 (1.2%) | 44 (2.5%) |
| $10,000 to $12,499 | 35 (1.9%) | 23 (1.3%) |
| $12,500 to $14,999 | 29 (1.6%) | 43 (2.4%) |
| $15,000 to $17,499 | 11 (0.6%) | 143 (8.1%) |
| $17,500 to $19,999 | 0 (0.0%) | 34 (1.9%) |
| $20,000 to $22,499 | 11 (0.6%) | 35 (2.0%) |
| $22,500 to $24,999 | 34 (1.8%) | 35 (2.0%) |
| $25,000 to $29,999 | 144 (7.8%) | 113 (6.4%) |
| $30,000 to $34,999 | 132 (7.1%) | 39 (2.2%) |
| $35,000 to $39,999 | 53 (2.9%) | 85 (4.8%) |
| $40,000 to $44,999 | 38 (2.1%) | 101 (5.7%) |
| $45,000 to $49,999 | 97 (5.2%) | 92 (5.2%) |
| $50,000 to $54,999 | 49 (2.6%) | 90 (5.1%) |
| $55,000 to $64,999 | 165 (8.9%) | 121 (6.9%) |
| $65,000 to $74,999 | 115 (6.2%) | 185 (10.5%) |
| $75,000 to $99,999 | 265 (14.4%) | 69 (3.9%) |
| $100,000+ | 399 (21.6%) | 138 (7.8%) |
| Total | 1,846 (100.0%) | 1,762 (100.0%) |
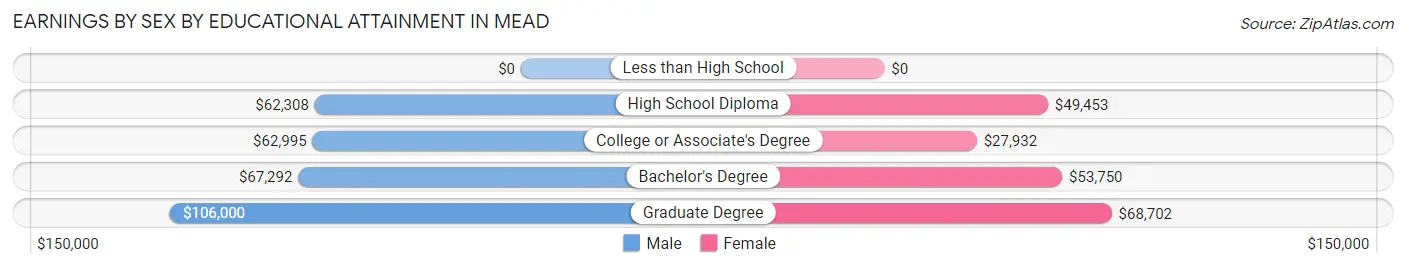
Earnings by Sex by Educational Attainment in Mead
Average earnings in Mead are $64,596 for men and $41,118 for women, a difference of 36.3%. Men with an educational attainment of graduate degree enjoy the highest average annual earnings of $106,000, while those with high school diploma education earn the least with $62,308. Women with an educational attainment of graduate degree earn the most with the average annual earnings of $68,702, while those with college or associate's degree education have the smallest earnings of $27,932.
| Educational Attainment | Male Income | Female Income |
| Less than High School | - | - |
| High School Diploma | $62,308 | $49,453 |
| College or Associate's Degree | $62,995 | $27,932 |
| Bachelor's Degree | $67,292 | $53,750 |
| Graduate Degree | $106,000 | $68,702 |
| Total | $64,596 | $41,118 |
Family Income in Mead
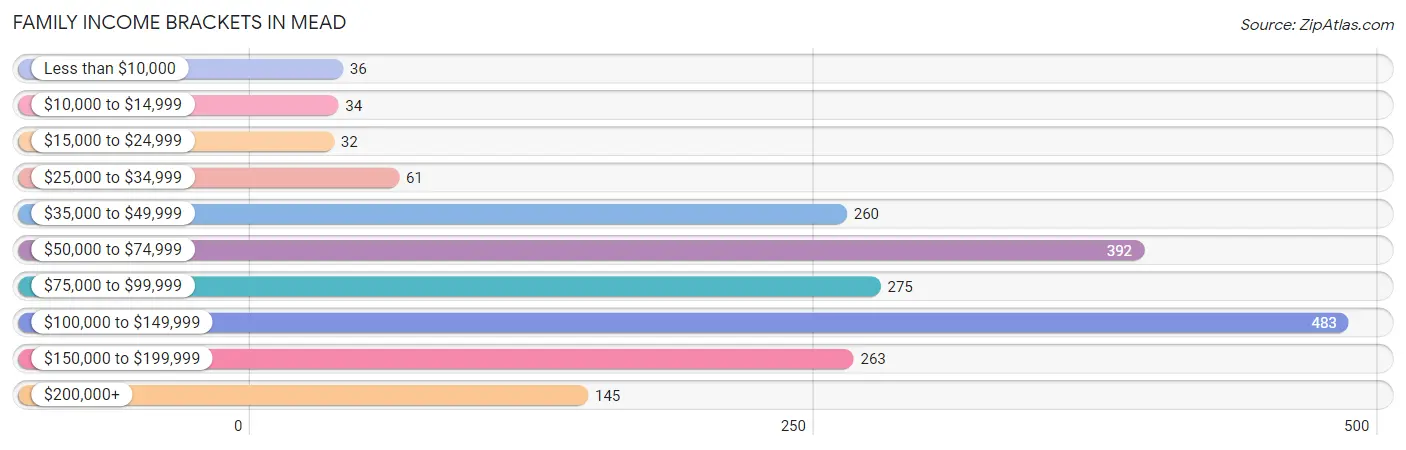
Family Income Brackets in Mead
According to the Mead family income data, there are 483 families falling into the $100,000 to $149,999 income range, which is the most common income bracket and makes up 24.4% of all families. Conversely, the $15,000 to $24,999 income bracket is the least frequent group with only 32 families (1.6%) belonging to this category.
| Income Bracket | # Families | % Families |
| Less than $10,000 | 36 | 1.8% |
| $10,000 to $14,999 | 34 | 1.7% |
| $15,000 to $24,999 | 32 | 1.6% |
| $25,000 to $34,999 | 61 | 3.1% |
| $35,000 to $49,999 | 260 | 13.1% |
| $50,000 to $74,999 | 392 | 19.8% |
| $75,000 to $99,999 | 275 | 13.9% |
| $100,000 to $149,999 | 483 | 24.4% |
| $150,000 to $199,999 | 263 | 13.3% |
| $200,000+ | 145 | 7.3% |
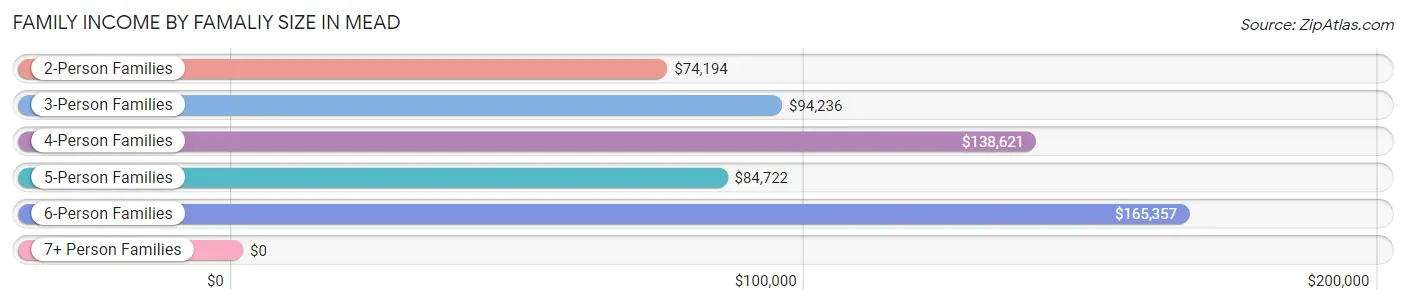
Family Income by Famaliy Size in Mead
6-person families (88 | 4.4%) account for the highest median family income in Mead with $165,357 per family, while 2-person families (981 | 49.5%) have the highest median income of $37,097 per family member.
| Income Bracket | # Families | Median Income |
| 2-Person Families | 981 (49.5%) | $74,194 |
| 3-Person Families | 378 (19.1%) | $94,236 |
| 4-Person Families | 360 (18.2%) | $138,621 |
| 5-Person Families | 136 (6.9%) | $84,722 |
| 6-Person Families | 88 (4.4%) | $165,357 |
| 7+ Person Families | 38 (1.9%) | $0 |
| Total | 1,981 (100.0%) | $93,671 |
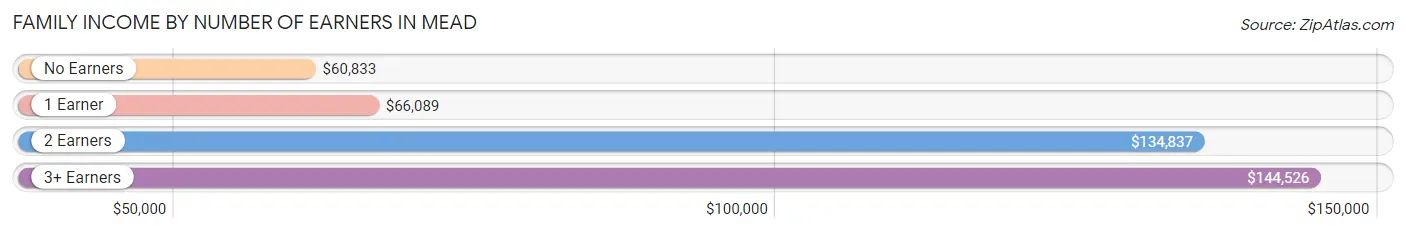
Family Income by Number of Earners in Mead
The median family income in Mead is $93,671, with families comprising 3+ earners (233) having the highest median family income of $144,526, while families with no earners (316) have the lowest median family income of $60,833, accounting for 11.8% and 16.0% of families, respectively.
| Number of Earners | # Families | Median Income |
| No Earners | 316 (16.0%) | $60,833 |
| 1 Earner | 597 (30.1%) | $66,089 |
| 2 Earners | 835 (42.1%) | $134,837 |
| 3+ Earners | 233 (11.8%) | $144,526 |
| Total | 1,981 (100.0%) | $93,671 |
Household Income in Mead
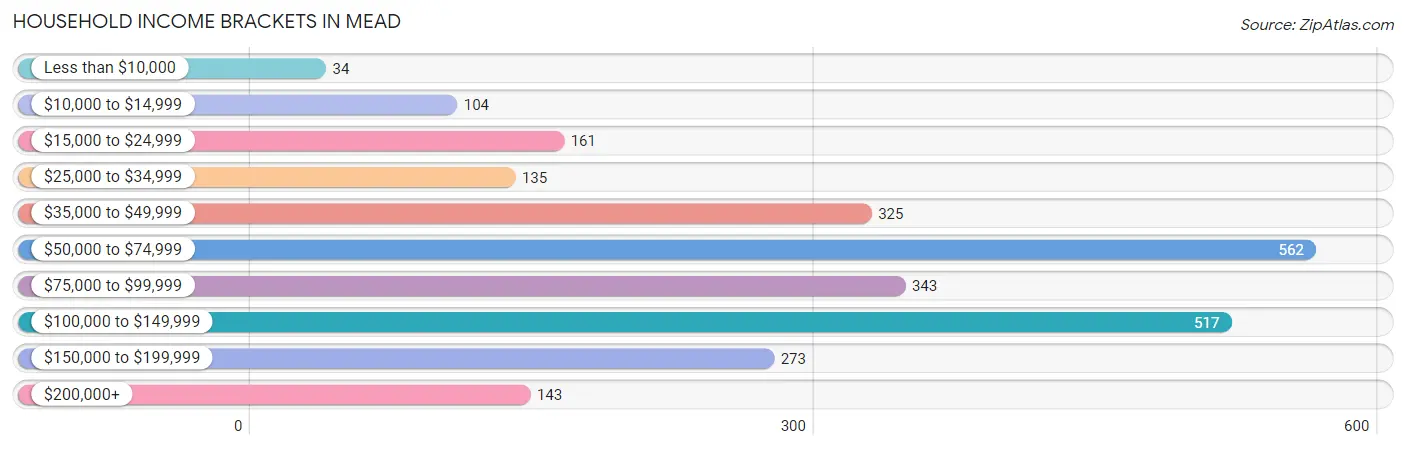
Household Income Brackets in Mead
With 562 households falling in the category, the $50,000 to $74,999 income range is the most frequent in Mead, accounting for 21.6% of all households. In contrast, only 34 households (1.3%) fall into the less than $10,000 income bracket, making it the least populous group.
| Income Bracket | # Households | % Households |
| Less than $10,000 | 34 | 1.3% |
| $10,000 to $14,999 | 104 | 4.0% |
| $15,000 to $24,999 | 161 | 6.2% |
| $25,000 to $34,999 | 135 | 5.2% |
| $35,000 to $49,999 | 325 | 12.5% |
| $50,000 to $74,999 | 562 | 21.6% |
| $75,000 to $99,999 | 343 | 13.2% |
| $100,000 to $149,999 | 517 | 19.9% |
| $150,000 to $199,999 | 273 | 10.5% |
| $200,000+ | 143 | 5.5% |
Household Income by Householder Age in Mead
The median household income in Mead is $74,431, with the highest median household income of $98,077 found in the 25 to 44 years age bracket for the primary householder. A total of 632 households (24.3%) fall into this category. Meanwhile, the 15 to 24 years age bracket for the primary householder has the lowest median household income of $0, with 8 households (0.3%) in this group.
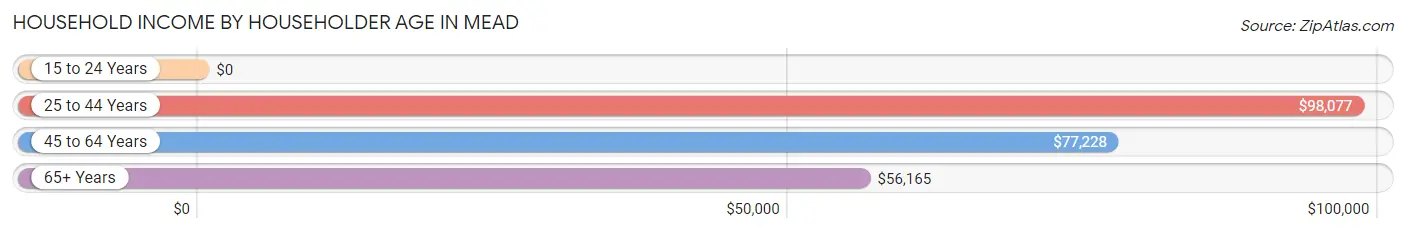
| Income Bracket | # Households | Median Income |
| 15 to 24 Years | 8 (0.3%) | $0 |
| 25 to 44 Years | 632 (24.3%) | $98,077 |
| 45 to 64 Years | 1,163 (44.7%) | $77,228 |
| 65+ Years | 797 (30.6%) | $56,165 |
| Total | 2,600 (100.0%) | $74,431 |
Poverty in Mead
Income Below Poverty by Sex and Age in Mead
With 7.3% poverty level for males and 8.3% for females among the residents of Mead, 16 and 17 year old males and 12 to 14 year old females are the most vulnerable to poverty, with 28 males (17.4%) and 27 females (19.6%) in their respective age groups living below the poverty level.
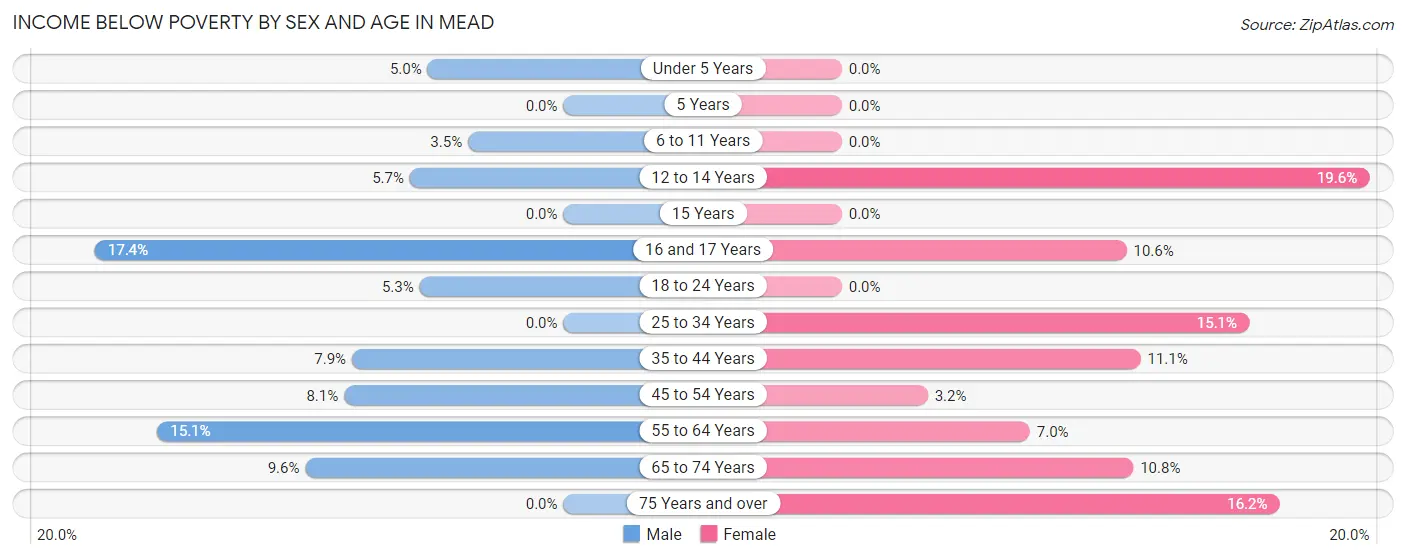
| Age Bracket | Male | Female |
| Under 5 Years | 13 (5.0%) | 0 (0.0%) |
| 5 Years | 0 (0.0%) | 0 (0.0%) |
| 6 to 11 Years | 8 (3.5%) | 0 (0.0%) |
| 12 to 14 Years | 9 (5.7%) | 27 (19.6%) |
| 15 Years | 0 (0.0%) | 0 (0.0%) |
| 16 and 17 Years | 28 (17.4%) | 28 (10.6%) |
| 18 to 24 Years | 15 (5.3%) | 0 (0.0%) |
| 25 to 34 Years | 0 (0.0%) | 50 (15.1%) |
| 35 to 44 Years | 27 (7.9%) | 54 (11.1%) |
| 45 to 54 Years | 49 (8.1%) | 16 (3.2%) |
| 55 to 64 Years | 71 (15.1%) | 36 (7.0%) |
| 65 to 74 Years | 39 (9.6%) | 50 (10.8%) |
| 75 Years and over | 0 (0.0%) | 38 (16.2%) |
| Total | 259 (7.3%) | 299 (8.3%) |
Income Above Poverty by Sex and Age in Mead
According to the poverty statistics in Mead, males aged 5 years and females aged under 5 years are the age groups that are most secure financially, with 100.0% of males and 100.0% of females in these age groups living above the poverty line.
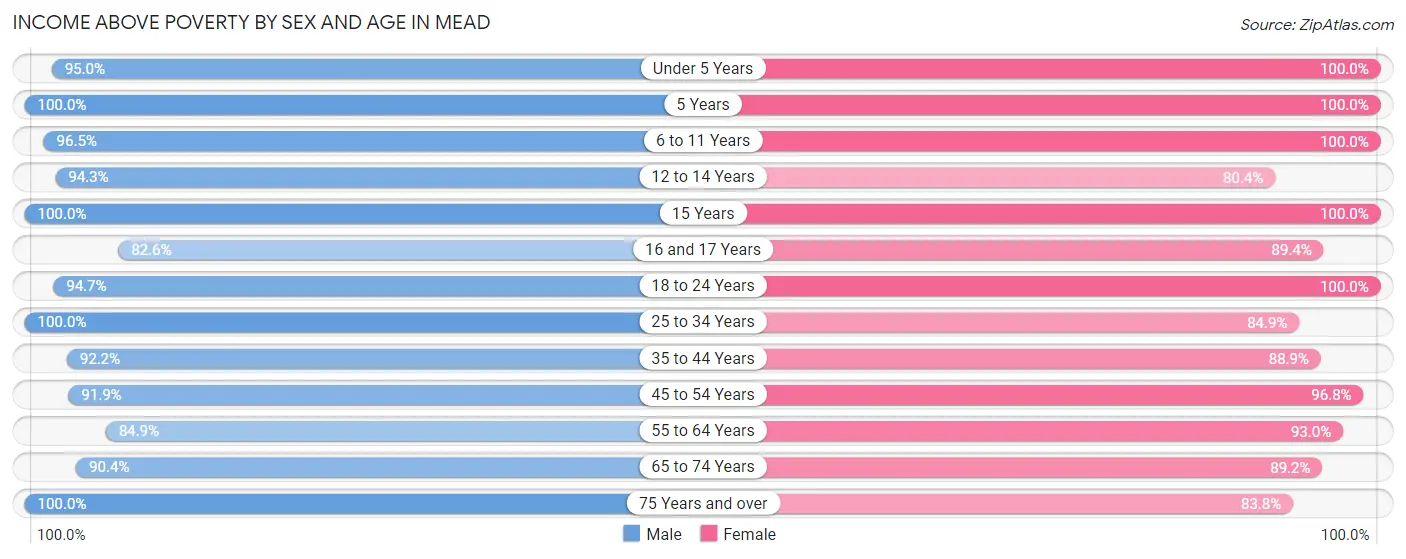
| Age Bracket | Male | Female |
| Under 5 Years | 245 (95.0%) | 198 (100.0%) |
| 5 Years | 44 (100.0%) | 19 (100.0%) |
| 6 to 11 Years | 218 (96.5%) | 249 (100.0%) |
| 12 to 14 Years | 149 (94.3%) | 111 (80.4%) |
| 15 Years | 79 (100.0%) | 44 (100.0%) |
| 16 and 17 Years | 133 (82.6%) | 237 (89.4%) |
| 18 to 24 Years | 266 (94.7%) | 150 (100.0%) |
| 25 to 34 Years | 307 (100.0%) | 281 (84.9%) |
| 35 to 44 Years | 317 (92.1%) | 433 (88.9%) |
| 45 to 54 Years | 553 (91.9%) | 486 (96.8%) |
| 55 to 64 Years | 400 (84.9%) | 480 (93.0%) |
| 65 to 74 Years | 368 (90.4%) | 412 (89.2%) |
| 75 Years and over | 201 (100.0%) | 196 (83.8%) |
| Total | 3,280 (92.7%) | 3,296 (91.7%) |
Income Below Poverty Among Married-Couple Families in Mead
The poverty statistics for married-couple families in Mead show that 0.9% or 13 of the total 1,511 families live below the poverty line. Families with no children have the highest poverty rate of 1.4%, comprising of 13 families. On the other hand, families with 1 or 2 children have the lowest poverty rate of 0.0%, which includes 0 families.
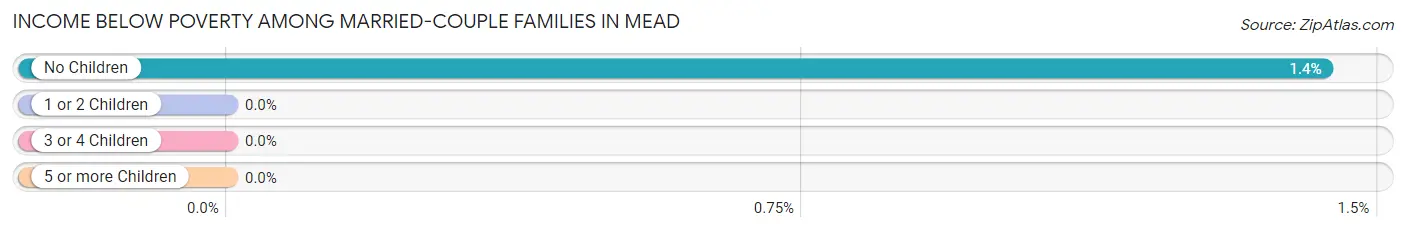
| Children | Above Poverty | Below Poverty |
| No Children | 898 (98.6%) | 13 (1.4%) |
| 1 or 2 Children | 447 (100.0%) | 0 (0.0%) |
| 3 or 4 Children | 125 (100.0%) | 0 (0.0%) |
| 5 or more Children | 28 (100.0%) | 0 (0.0%) |
| Total | 1,498 (99.1%) | 13 (0.9%) |
Income Below Poverty Among Single-Parent Households in Mead
According to the poverty data in Mead, 20.8% or 31 single-father households and 17.8% or 57 single-mother households are living below the poverty line. Among single-father households, those with 1 or 2 children have the highest poverty rate, with 31 households (24.2%) experiencing poverty. Likewise, among single-mother households, those with 1 or 2 children have the highest poverty rate, with 49 households (23.6%) falling below the poverty line.
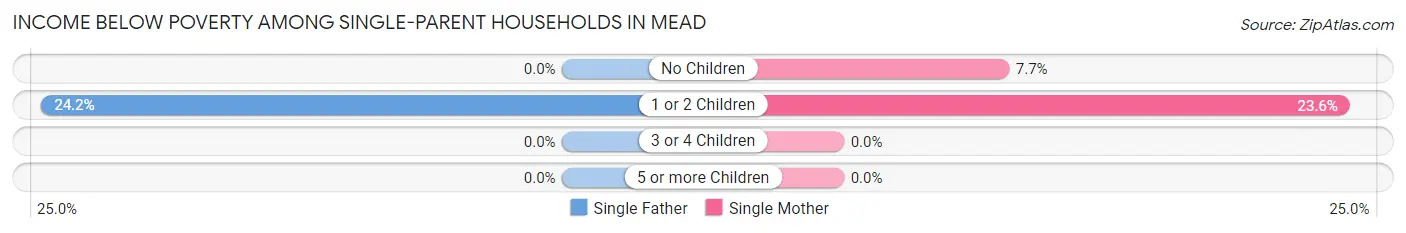
| Children | Single Father | Single Mother |
| No Children | 0 (0.0%) | 8 (7.7%) |
| 1 or 2 Children | 31 (24.2%) | 49 (23.6%) |
| 3 or 4 Children | 0 (0.0%) | 0 (0.0%) |
| 5 or more Children | 0 (0.0%) | 0 (0.0%) |
| Total | 31 (20.8%) | 57 (17.8%) |
Income Below Poverty Among Married-Couple vs Single-Parent Households in Mead
The poverty data for Mead shows that 13 of the married-couple family households (0.9%) and 88 of the single-parent households (18.7%) are living below the poverty level. Within the married-couple family households, those with no children have the highest poverty rate, with 13 households (1.4%) falling below the poverty line. Among the single-parent households, those with 1 or 2 children have the highest poverty rate, with 80 household (23.8%) living below poverty.
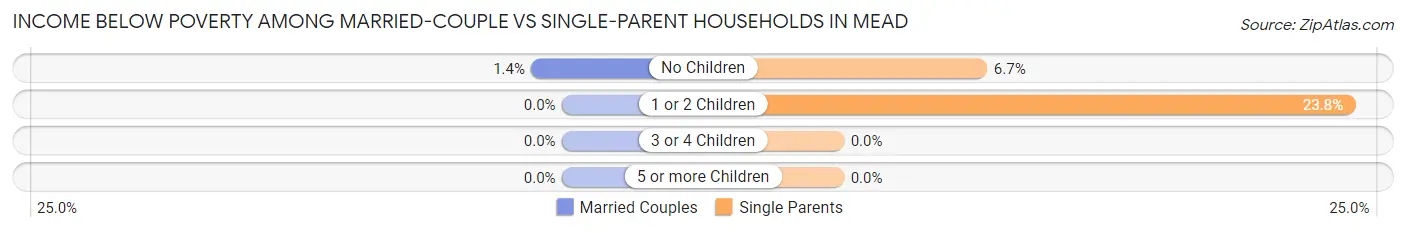
| Children | Married-Couple Families | Single-Parent Households |
| No Children | 13 (1.4%) | 8 (6.7%) |
| 1 or 2 Children | 0 (0.0%) | 80 (23.8%) |
| 3 or 4 Children | 0 (0.0%) | 0 (0.0%) |
| 5 or more Children | 0 (0.0%) | 0 (0.0%) |
| Total | 13 (0.9%) | 88 (18.7%) |
Race in Mead
The most populous races in Mead are White / Caucasian (6,521 | 90.9%), Hispanic or Latino (440 | 6.1%), and Two or more Races (306 | 4.3%).
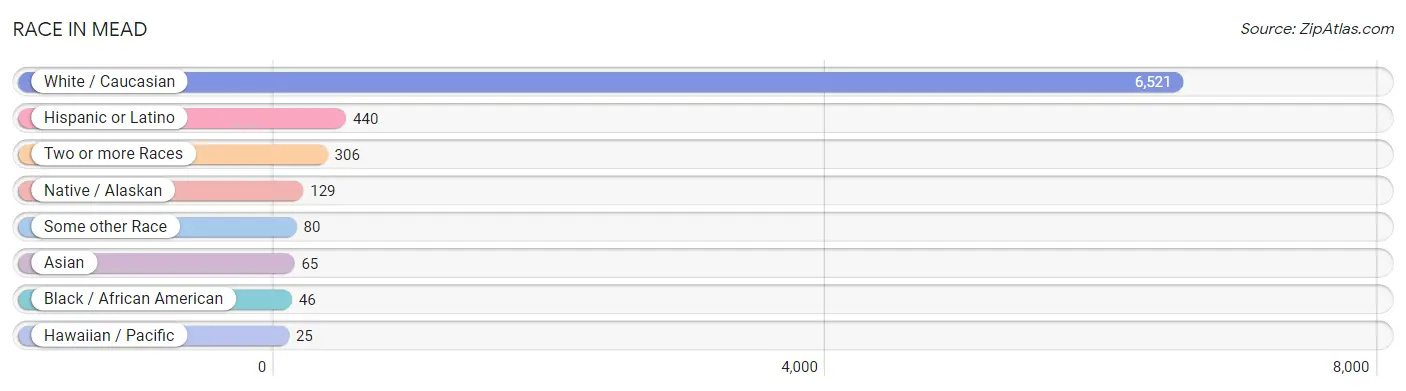
| Race | # Population | % Population |
| Asian | 65 | 0.9% |
| Black / African American | 46 | 0.6% |
| Hawaiian / Pacific | 25 | 0.4% |
| Hispanic or Latino | 440 | 6.1% |
| Native / Alaskan | 129 | 1.8% |
| White / Caucasian | 6,521 | 90.9% |
| Two or more Races | 306 | 4.3% |
| Some other Race | 80 | 1.1% |
| Total | 7,172 | 100.0% |
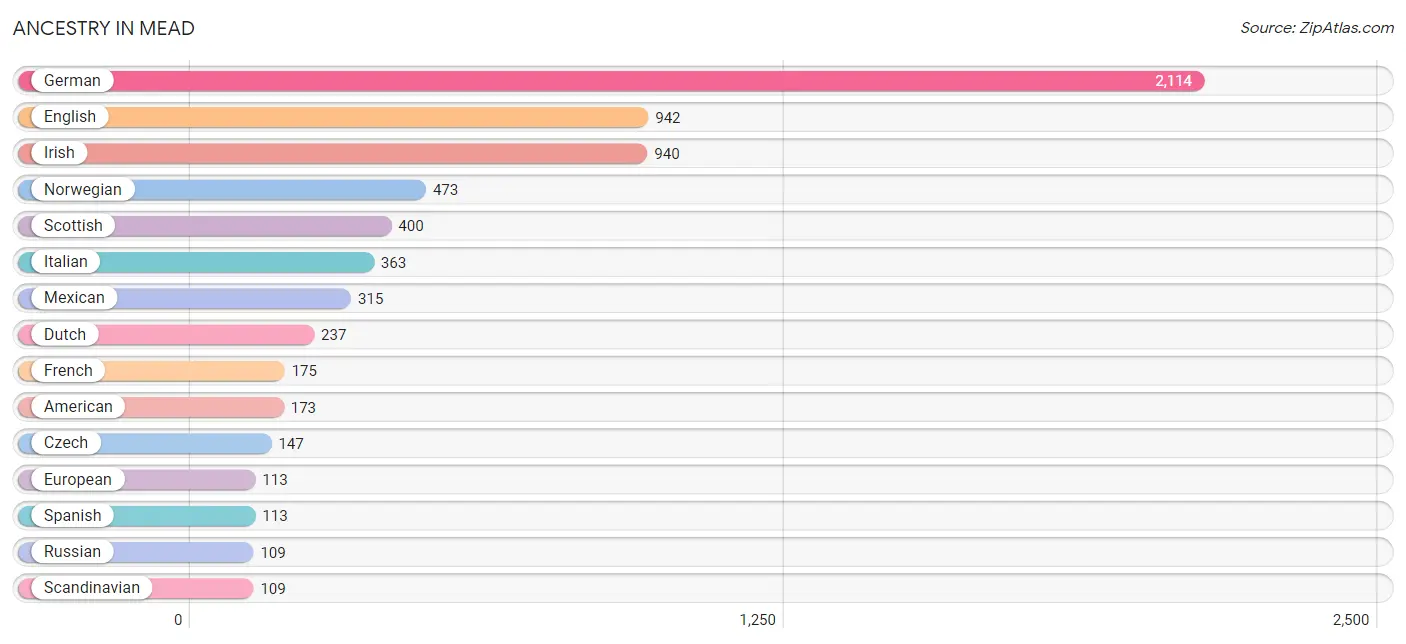
Ancestry in Mead
The most populous ancestries reported in Mead are German (2,114 | 29.5%), English (942 | 13.1%), Irish (940 | 13.1%), Norwegian (473 | 6.6%), and Scottish (400 | 5.6%), together accounting for 67.9% of all Mead residents.
| Ancestry | # Population | % Population |
| American | 173 | 2.4% |
| Austrian | 10 | 0.1% |
| Basque | 6 | 0.1% |
| Belgian | 9 | 0.1% |
| Bhutanese | 56 | 0.8% |
| Blackfeet | 5 | 0.1% |
| British | 30 | 0.4% |
| Burmese | 37 | 0.5% |
| Canadian | 12 | 0.2% |
| Celtic | 19 | 0.3% |
| Cherokee | 6 | 0.1% |
| Chippewa | 74 | 1.0% |
| Choctaw | 11 | 0.2% |
| Czech | 147 | 2.1% |
| Czechoslovakian | 27 | 0.4% |
| Danish | 77 | 1.1% |
| Dutch | 237 | 3.3% |
| English | 942 | 13.1% |
| European | 113 | 1.6% |
| Finnish | 15 | 0.2% |
| French | 175 | 2.4% |
| French Canadian | 54 | 0.7% |
| German | 2,114 | 29.5% |
| Greek | 16 | 0.2% |
| Hungarian | 9 | 0.1% |
| Indian (Asian) | 9 | 0.1% |
| Iranian | 11 | 0.2% |
| Irish | 940 | 13.1% |
| Italian | 363 | 5.1% |
| Jamaican | 14 | 0.2% |
| Korean | 56 | 0.8% |
| Mexican | 315 | 4.4% |
| Nigerian | 31 | 0.4% |
| Northern European | 61 | 0.9% |
| Norwegian | 473 | 6.6% |
| Osage | 5 | 0.1% |
| Polish | 85 | 1.2% |
| Portuguese | 35 | 0.5% |
| Russian | 109 | 1.5% |
| Scandinavian | 109 | 1.5% |
| Scotch-Irish | 98 | 1.4% |
| Scottish | 400 | 5.6% |
| Sioux | 5 | 0.1% |
| Spaniard | 12 | 0.2% |
| Spanish | 113 | 1.6% |
| Subsaharan African | 31 | 0.4% |
| Swedish | 70 | 1.0% |
| Swiss | 70 | 1.0% |
| Tsimshian | 39 | 0.5% |
| Ukrainian | 92 | 1.3% |
| Welsh | 88 | 1.2% | View All 51 Rows |
Immigrants in Mead
The most numerous immigrant groups reported in Mead came from Europe (80 | 1.1%), Eastern Europe (50 | 0.7%), Asia (44 | 0.6%), Philippines (35 | 0.5%), and South Eastern Asia (35 | 0.5%), together accounting for 3.4% of all Mead residents.
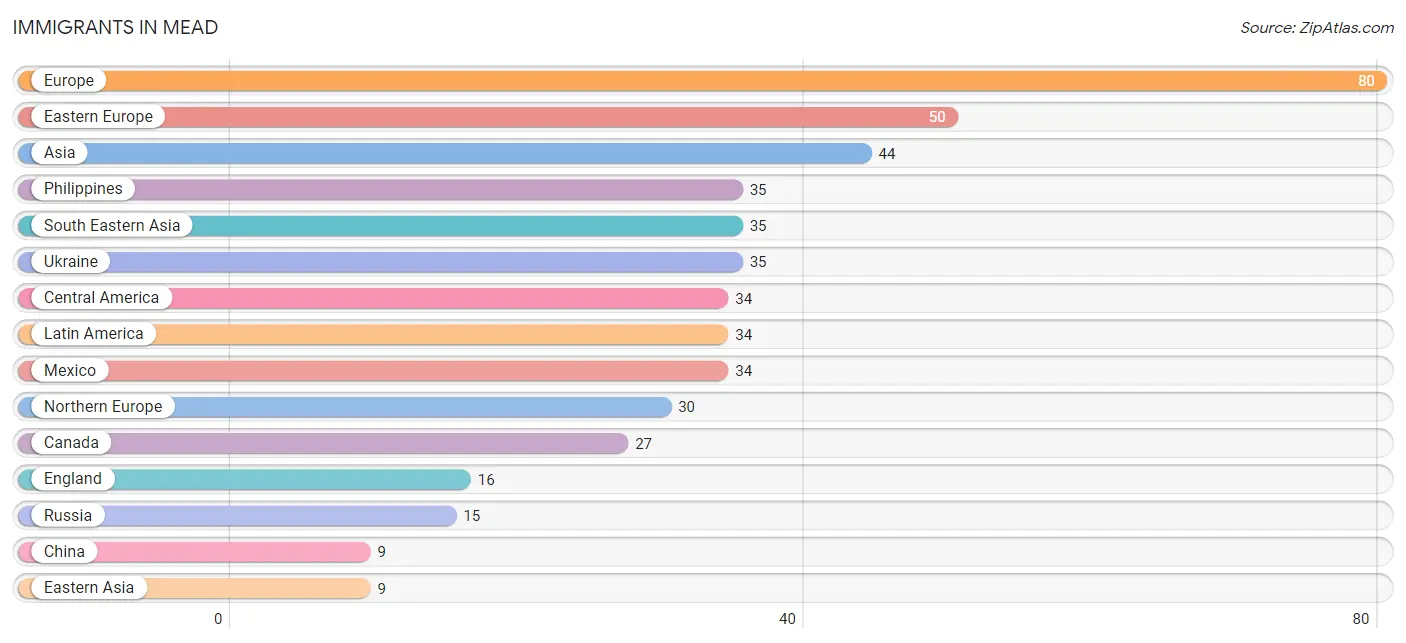
| Immigration Origin | # Population | % Population |
| Asia | 44 | 0.6% |
| Canada | 27 | 0.4% |
| Central America | 34 | 0.5% |
| China | 9 | 0.1% |
| Eastern Asia | 9 | 0.1% |
| Eastern Europe | 50 | 0.7% |
| England | 16 | 0.2% |
| Europe | 80 | 1.1% |
| Latin America | 34 | 0.5% |
| Mexico | 34 | 0.5% |
| Northern Europe | 30 | 0.4% |
| Philippines | 35 | 0.5% |
| Russia | 15 | 0.2% |
| South Eastern Asia | 35 | 0.5% |
| Ukraine | 35 | 0.5% | View All 15 Rows |
Sex and Age in Mead
Sex and Age in Mead
The most populous age groups in Mead are 45 to 49 Years (373 | 10.5%) for men and 15 to 19 Years (391 | 10.8%) for women.
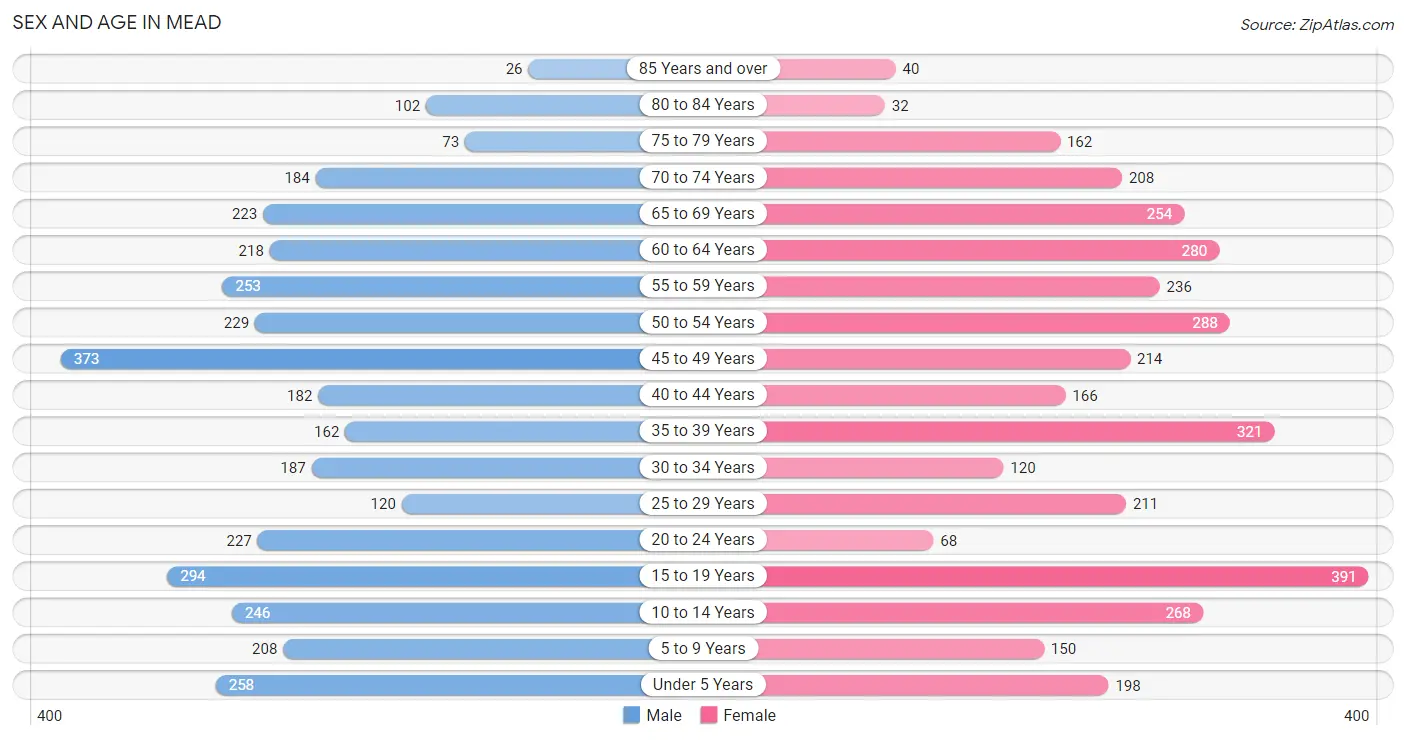
| Age Bracket | Male | Female |
| Under 5 Years | 258 (7.2%) | 198 (5.5%) |
| 5 to 9 Years | 208 (5.8%) | 150 (4.2%) |
| 10 to 14 Years | 246 (6.9%) | 268 (7.4%) |
| 15 to 19 Years | 294 (8.3%) | 391 (10.8%) |
| 20 to 24 Years | 227 (6.4%) | 68 (1.9%) |
| 25 to 29 Years | 120 (3.4%) | 211 (5.9%) |
| 30 to 34 Years | 187 (5.2%) | 120 (3.3%) |
| 35 to 39 Years | 162 (4.5%) | 321 (8.9%) |
| 40 to 44 Years | 182 (5.1%) | 166 (4.6%) |
| 45 to 49 Years | 373 (10.5%) | 214 (5.9%) |
| 50 to 54 Years | 229 (6.4%) | 288 (8.0%) |
| 55 to 59 Years | 253 (7.1%) | 236 (6.5%) |
| 60 to 64 Years | 218 (6.1%) | 280 (7.8%) |
| 65 to 69 Years | 223 (6.3%) | 254 (7.0%) |
| 70 to 74 Years | 184 (5.2%) | 208 (5.8%) |
| 75 to 79 Years | 73 (2.1%) | 162 (4.5%) |
| 80 to 84 Years | 102 (2.9%) | 32 (0.9%) |
| 85 Years and over | 26 (0.7%) | 40 (1.1%) |
| Total | 3,565 (100.0%) | 3,607 (100.0%) |
Families and Households in Mead
Median Family Size in Mead
The median family size in Mead is 3.14 persons per family, with married-couple families (1,511 | 76.3%) accounting for the largest median family size of 3.24 persons per family. On the other hand, single male/father families (149 | 7.5%) represent the smallest median family size with 2.40 persons per family.
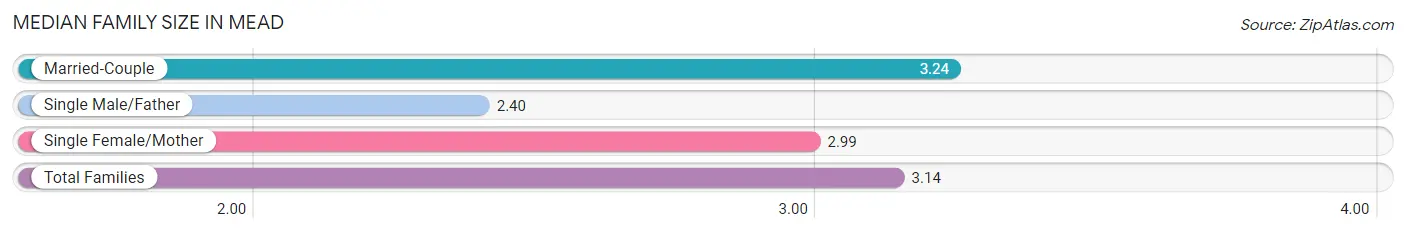
| Family Type | # Families | Family Size |
| Married-Couple | 1,511 (76.3%) | 3.24 |
| Single Male/Father | 149 (7.5%) | 2.40 |
| Single Female/Mother | 321 (16.2%) | 2.99 |
| Total Families | 1,981 (100.0%) | 3.14 |
Median Household Size in Mead
The median household size in Mead is 2.76 persons per household, with single female/mother households (321 | 12.3%) accounting for the largest median household size of 3.41 persons per household. non-family households (619 | 23.8%) represent the smallest median household size with 1.22 persons per household.
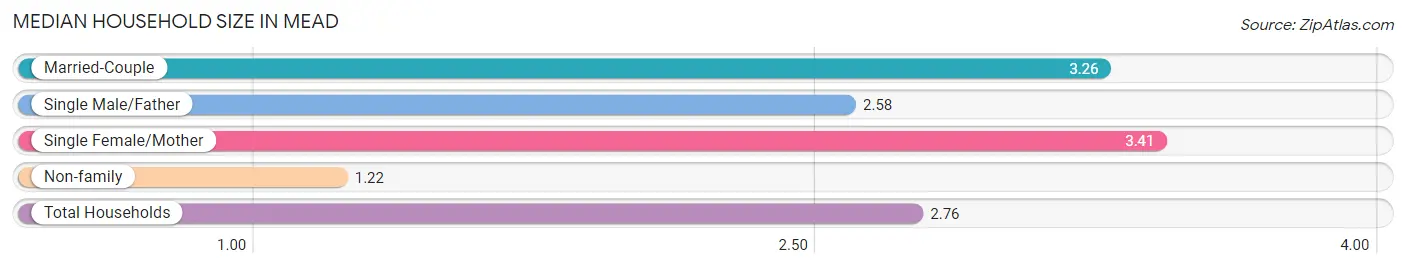
| Household Type | # Households | Household Size |
| Married-Couple | 1,511 (58.1%) | 3.26 |
| Single Male/Father | 149 (5.7%) | 2.58 |
| Single Female/Mother | 321 (12.3%) | 3.41 |
| Non-family | 619 (23.8%) | 1.22 |
| Total Households | 2,600 (100.0%) | 2.76 |
Household Size by Marriage Status in Mead
Out of a total of 2,600 households in Mead, 1,981 (76.2%) are family households, while 619 (23.8%) are nonfamily households. The most numerous type of family households are 2-person households, comprising 981, and the most common type of nonfamily households are 1-person households, comprising 500.
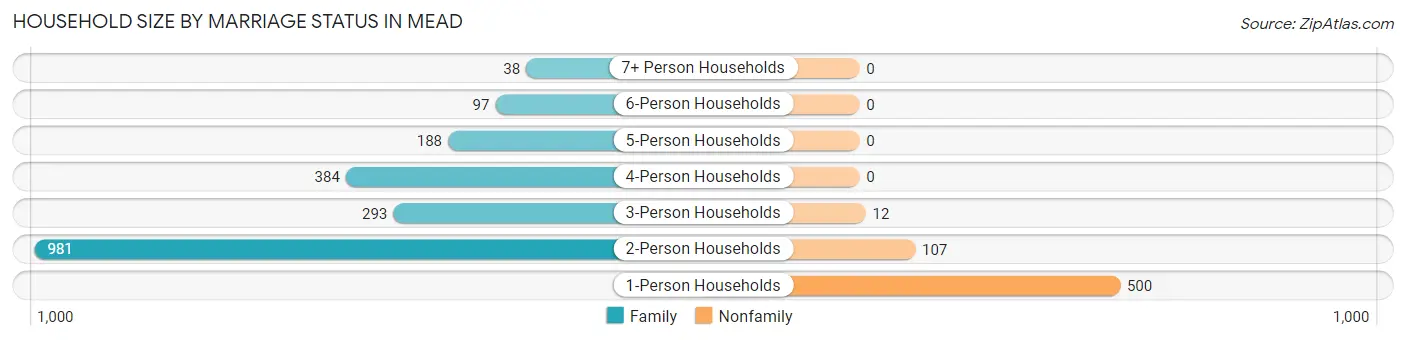
| Household Size | Family Households | Nonfamily Households |
| 1-Person Households | - | 500 (19.2%) |
| 2-Person Households | 981 (37.7%) | 107 (4.1%) |
| 3-Person Households | 293 (11.3%) | 12 (0.5%) |
| 4-Person Households | 384 (14.8%) | 0 (0.0%) |
| 5-Person Households | 188 (7.2%) | 0 (0.0%) |
| 6-Person Households | 97 (3.7%) | 0 (0.0%) |
| 7+ Person Households | 38 (1.5%) | 0 (0.0%) |
| Total | 1,981 (76.2%) | 619 (23.8%) |
Female Fertility in Mead
Fertility by Age in Mead
Average fertility rate in Mead is 40.0 births per 1,000 women. Women in the age bracket of 20 to 34 years have the highest fertility rate with 63.0 births per 1,000 women. Women in the age bracket of 35 to 50 years acount for 43.3% of all women with births.
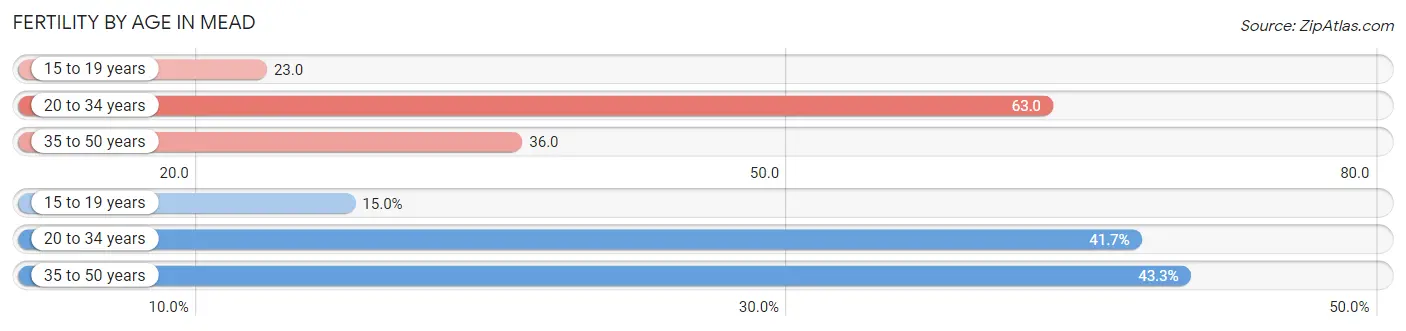
| Age Bracket | Women with Births | Births / 1,000 Women |
| 15 to 19 years | 9 (15.0%) | 23.0 |
| 20 to 34 years | 25 (41.7%) | 63.0 |
| 35 to 50 years | 26 (43.3%) | 36.0 |
| Total | 60 (100.0%) | 40.0 |
Fertility by Age by Marriage Status in Mead
55.0% of women with births (60) in Mead are married. The highest percentage of unmarried women with births falls into 15 to 19 years age bracket with 100.0% of them unmarried at the time of birth, while the lowest percentage of unmarried women with births belong to 35 to 50 years age bracket with 0.0% of them unmarried.
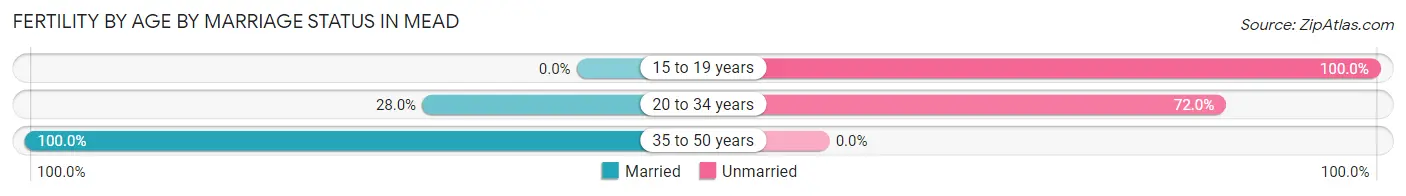
| Age Bracket | Married | Unmarried |
| 15 to 19 years | 0 (0.0%) | 9 (100.0%) |
| 20 to 34 years | 7 (28.0%) | 18 (72.0%) |
| 35 to 50 years | 26 (100.0%) | 0 (0.0%) |
| Total | 33 (55.0%) | 27 (45.0%) |
Fertility by Education in Mead
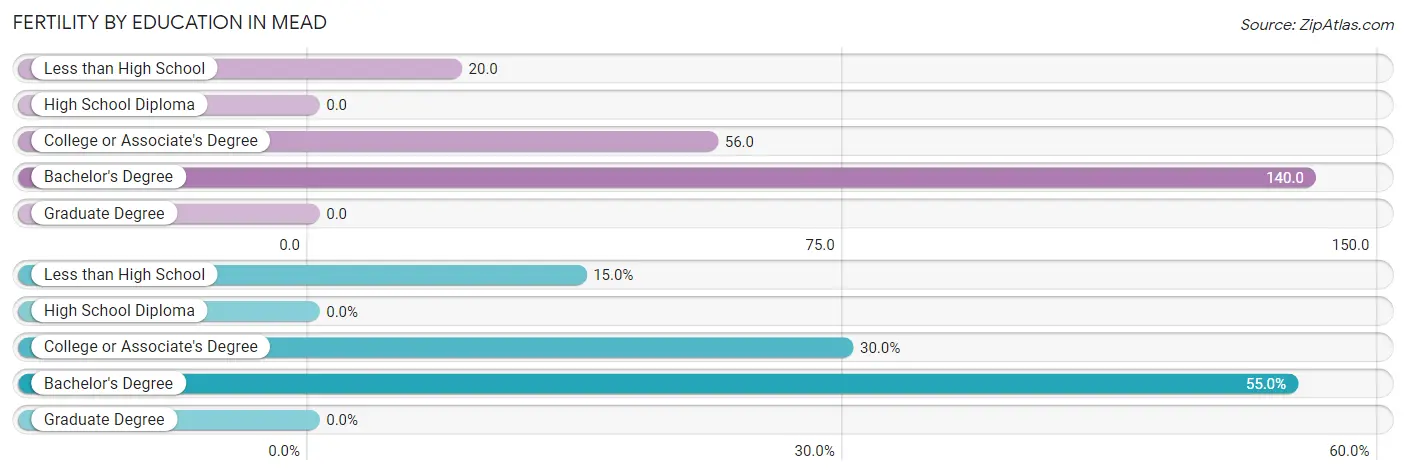
| Educational Attainment | Women with Births | Births / 1,000 Women |
| Less than High School | 9 (15.0%) | 20.0 |
| High School Diploma | 0 (0.0%) | 0.0 |
| College or Associate's Degree | 18 (30.0%) | 56.0 |
| Bachelor's Degree | 33 (55.0%) | 140.0 |
| Graduate Degree | 0 (0.0%) | 0.0 |
| Total | 60 (100.0%) | 40.0 |
Fertility by Education by Marriage Status in Mead
45.0% of women with births in Mead are unmarried. Women with the educational attainment of bachelor's degree are most likely to be married with 100.0% of them married at childbirth, while women with the educational attainment of less than high school are least likely to be married with 100.0% of them unmarried at childbirth.
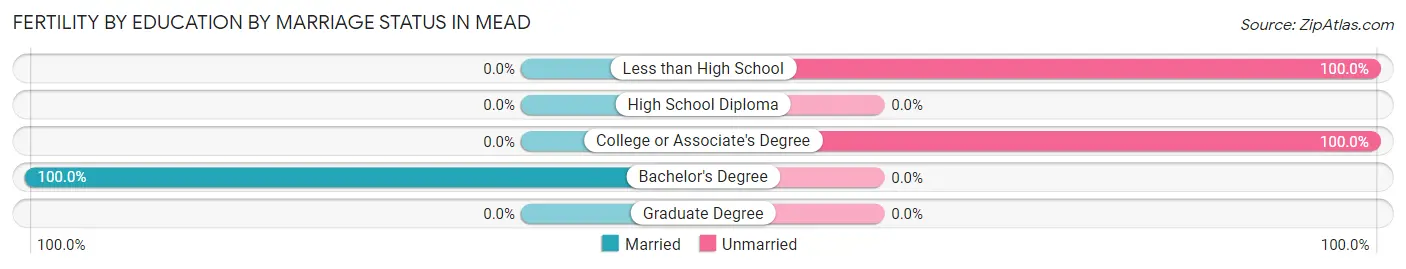
| Educational Attainment | Married | Unmarried |
| Less than High School | 0 (0.0%) | 9 (100.0%) |
| High School Diploma | 0 (0.0%) | 0 (0.0%) |
| College or Associate's Degree | 0 (0.0%) | 18 (100.0%) |
| Bachelor's Degree | 33 (100.0%) | 0 (0.0%) |
| Graduate Degree | 0 (0.0%) | 0 (0.0%) |
| Total | 33 (55.0%) | 27 (45.0%) |
Employment Characteristics in Mead
Employment by Class of Employer in Mead
Among the 2,824 employed individuals in Mead, private company employees (1,810 | 64.1%), local government employees (298 | 10.5%), and state government employees (172 | 6.1%) make up the most common classes of employment.
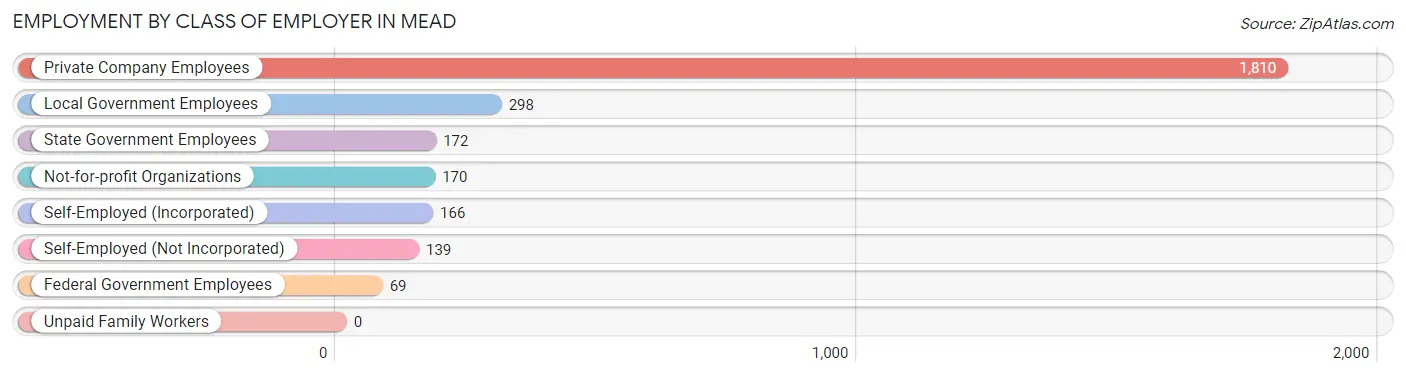
| Employer Class | # Employees | % Employees |
| Private Company Employees | 1,810 | 64.1% |
| Self-Employed (Incorporated) | 166 | 5.9% |
| Self-Employed (Not Incorporated) | 139 | 4.9% |
| Not-for-profit Organizations | 170 | 6.0% |
| Local Government Employees | 298 | 10.5% |
| State Government Employees | 172 | 6.1% |
| Federal Government Employees | 69 | 2.4% |
| Unpaid Family Workers | 0 | 0.0% |
| Total | 2,824 | 100.0% |
Employment Status by Age in Mead
According to the labor force statistics for Mead, out of the total population over 16 years of age (5,721), 57.8% or 3,307 individuals are in the labor force, with 9.0% or 298 of them unemployed. The age group with the highest labor force participation rate is 30 to 34 years, with 93.8% or 288 individuals in the labor force. Within the labor force, the 20 to 24 years age range has the highest percentage of unemployed individuals, with 36.7% or 76 of them being unemployed.
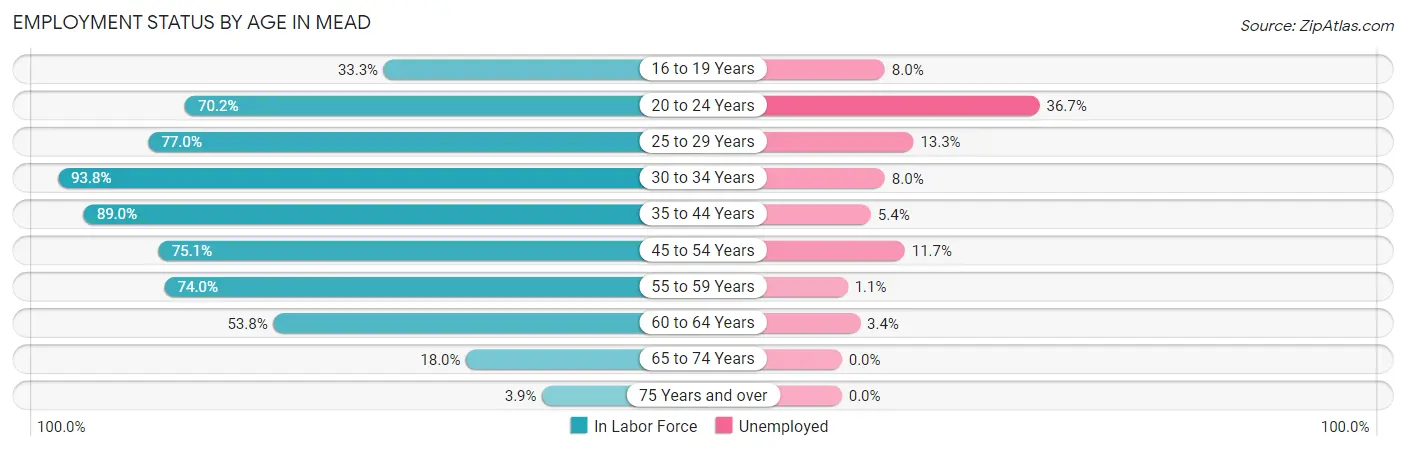
| Age Bracket | In Labor Force | Unemployed |
| 16 to 19 Years | 187 (33.3%) | 15 (8.0%) |
| 20 to 24 Years | 207 (70.2%) | 76 (36.7%) |
| 25 to 29 Years | 255 (77.0%) | 34 (13.3%) |
| 30 to 34 Years | 288 (93.8%) | 23 (8.0%) |
| 35 to 44 Years | 740 (89.0%) | 40 (5.4%) |
| 45 to 54 Years | 829 (75.1%) | 97 (11.7%) |
| 55 to 59 Years | 362 (74.0%) | 4 (1.1%) |
| 60 to 64 Years | 268 (53.8%) | 9 (3.4%) |
| 65 to 74 Years | 156 (18.0%) | 0 (0.0%) |
| 75 Years and over | 17 (3.9%) | 0 (0.0%) |
| Total | 3,307 (57.8%) | 298 (9.0%) |
Employment Status by Educational Attainment in Mead
According to labor force statistics for Mead, 77.0% of individuals (2,741) out of the total population between 25 and 64 years of age (3,560) are in the labor force, with 7.5% or 206 of them being unemployed. The group with the highest labor force participation rate are those with the educational attainment of bachelor's degree or higher, with 91.6% or 890 individuals in the labor force. Within the labor force, individuals with less than high school education have the highest percentage of unemployment, with 32.1% or 67 of them being unemployed.
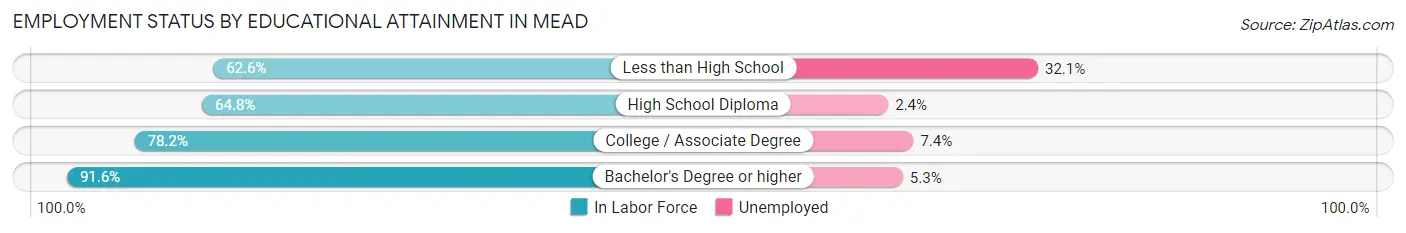
| Educational Attainment | In Labor Force | Unemployed |
| Less than High School | 209 (62.6%) | 107 (32.1%) |
| High School Diploma | 577 (64.8%) | 21 (2.4%) |
| College / Associate Degree | 1,066 (78.2%) | 101 (7.4%) |
| Bachelor's Degree or higher | 890 (91.6%) | 52 (5.3%) |
| Total | 2,741 (77.0%) | 267 (7.5%) |
Employment Occupations by Sex in Mead
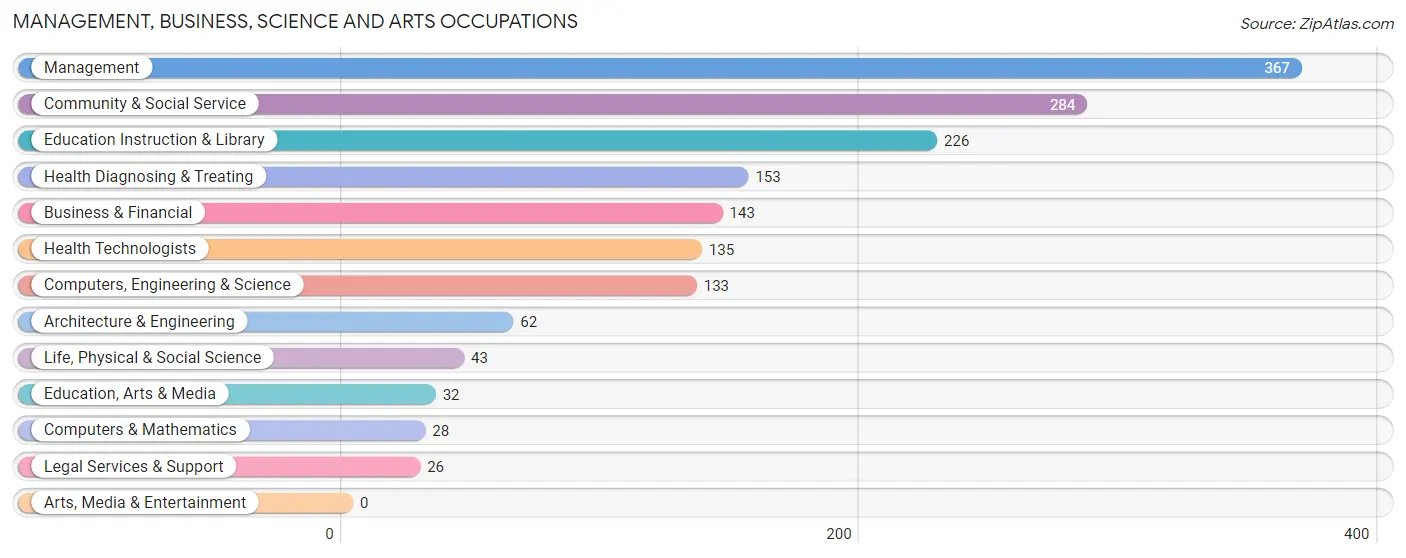
Management, Business, Science and Arts Occupations
The most common Management, Business, Science and Arts occupations in Mead are Management (367 | 12.2%), Community & Social Service (284 | 9.4%), Education Instruction & Library (226 | 7.5%), Health Diagnosing & Treating (153 | 5.1%), and Business & Financial (143 | 4.8%).
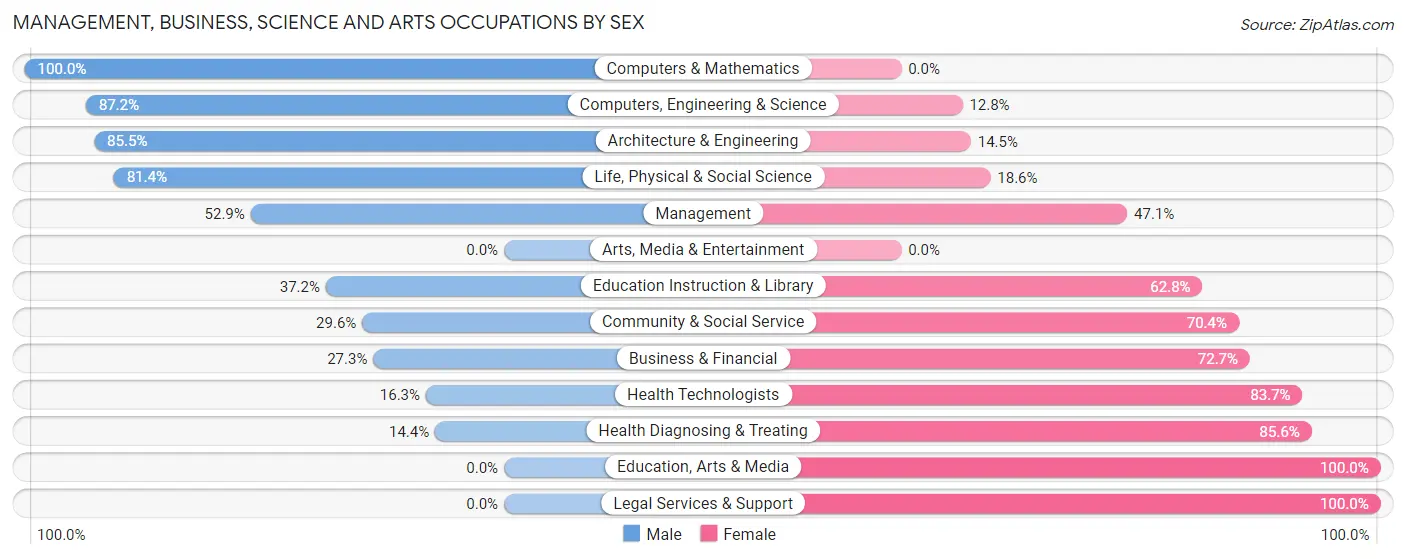
Management, Business, Science and Arts Occupations by Sex
Within the Management, Business, Science and Arts occupations in Mead, the most male-oriented occupations are Computers & Mathematics (100.0%), Computers, Engineering & Science (87.2%), and Architecture & Engineering (85.5%), while the most female-oriented occupations are Education, Arts & Media (100.0%), Legal Services & Support (100.0%), and Health Diagnosing & Treating (85.6%).
| Occupation | Male | Female |
| Management | 194 (52.9%) | 173 (47.1%) |
| Business & Financial | 39 (27.3%) | 104 (72.7%) |
| Computers, Engineering & Science | 116 (87.2%) | 17 (12.8%) |
| Computers & Mathematics | 28 (100.0%) | 0 (0.0%) |
| Architecture & Engineering | 53 (85.5%) | 9 (14.5%) |
| Life, Physical & Social Science | 35 (81.4%) | 8 (18.6%) |
| Community & Social Service | 84 (29.6%) | 200 (70.4%) |
| Education, Arts & Media | 0 (0.0%) | 32 (100.0%) |
| Legal Services & Support | 0 (0.0%) | 26 (100.0%) |
| Education Instruction & Library | 84 (37.2%) | 142 (62.8%) |
| Arts, Media & Entertainment | 0 (0.0%) | 0 (0.0%) |
| Health Diagnosing & Treating | 22 (14.4%) | 131 (85.6%) |
| Health Technologists | 22 (16.3%) | 113 (83.7%) |
| Total (Category) | 455 (42.1%) | 625 (57.9%) |
| Total (Overall) | 1,518 (50.4%) | 1,493 (49.6%) |
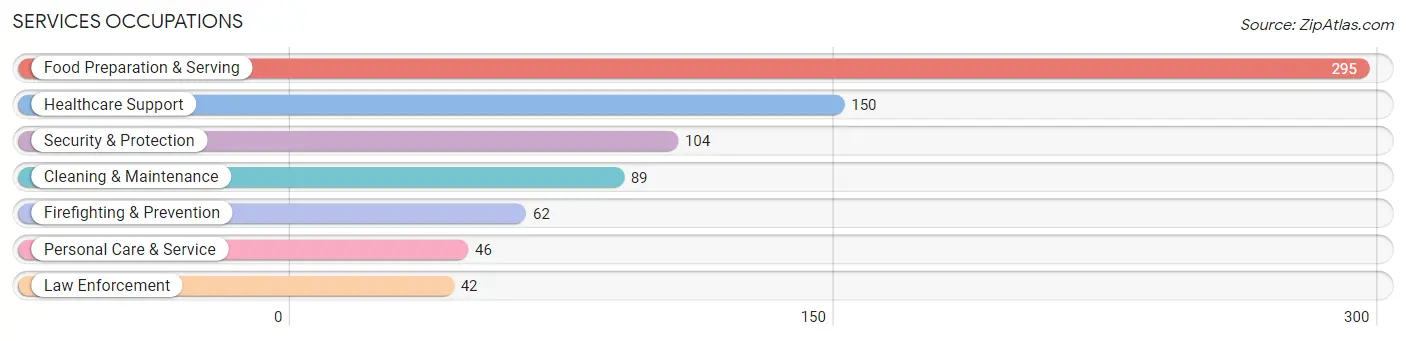
Services Occupations
The most common Services occupations in Mead are Food Preparation & Serving (295 | 9.8%), Healthcare Support (150 | 5.0%), Security & Protection (104 | 3.5%), Cleaning & Maintenance (89 | 3.0%), and Firefighting & Prevention (62 | 2.1%).
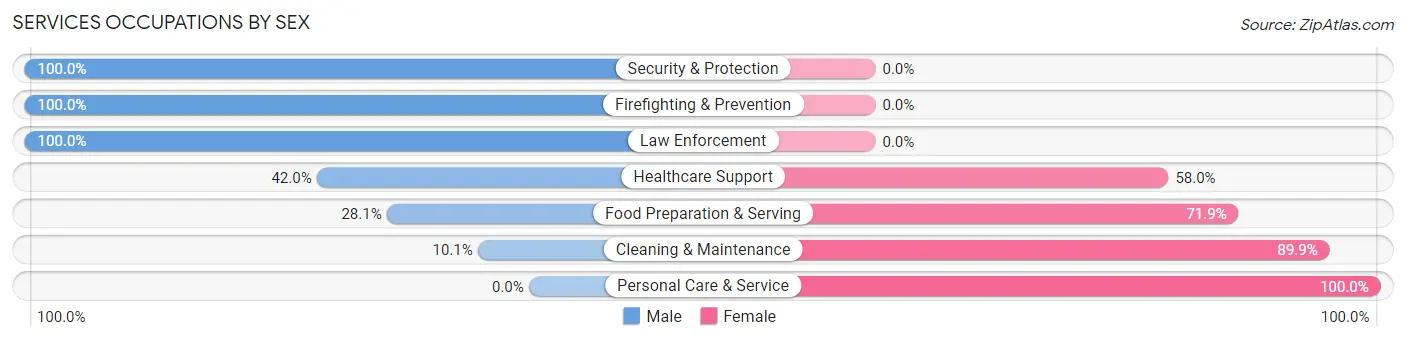
Services Occupations by Sex
Within the Services occupations in Mead, the most male-oriented occupations are Security & Protection (100.0%), Firefighting & Prevention (100.0%), and Law Enforcement (100.0%), while the most female-oriented occupations are Personal Care & Service (100.0%), Cleaning & Maintenance (89.9%), and Food Preparation & Serving (71.9%).
| Occupation | Male | Female |
| Healthcare Support | 63 (42.0%) | 87 (58.0%) |
| Security & Protection | 104 (100.0%) | 0 (0.0%) |
| Firefighting & Prevention | 62 (100.0%) | 0 (0.0%) |
| Law Enforcement | 42 (100.0%) | 0 (0.0%) |
| Food Preparation & Serving | 83 (28.1%) | 212 (71.9%) |
| Cleaning & Maintenance | 9 (10.1%) | 80 (89.9%) |
| Personal Care & Service | 0 (0.0%) | 46 (100.0%) |
| Total (Category) | 259 (37.9%) | 425 (62.1%) |
| Total (Overall) | 1,518 (50.4%) | 1,493 (49.6%) |
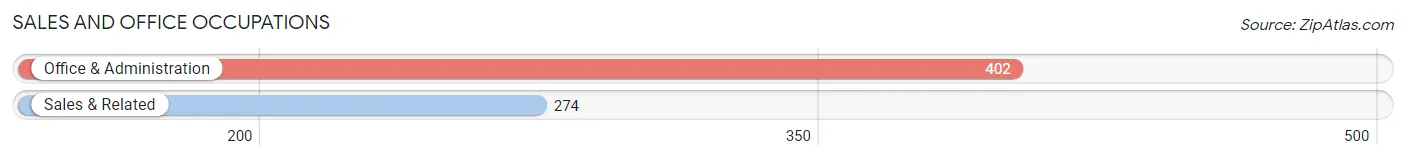
Sales and Office Occupations
The most common Sales and Office occupations in Mead are Office & Administration (402 | 13.4%), and Sales & Related (274 | 9.1%).
Sales and Office Occupations by Sex
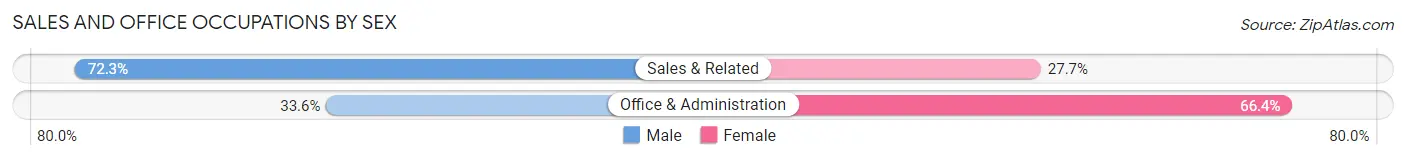
| Occupation | Male | Female |
| Sales & Related | 198 (72.3%) | 76 (27.7%) |
| Office & Administration | 135 (33.6%) | 267 (66.4%) |
| Total (Category) | 333 (49.3%) | 343 (50.7%) |
| Total (Overall) | 1,518 (50.4%) | 1,493 (49.6%) |
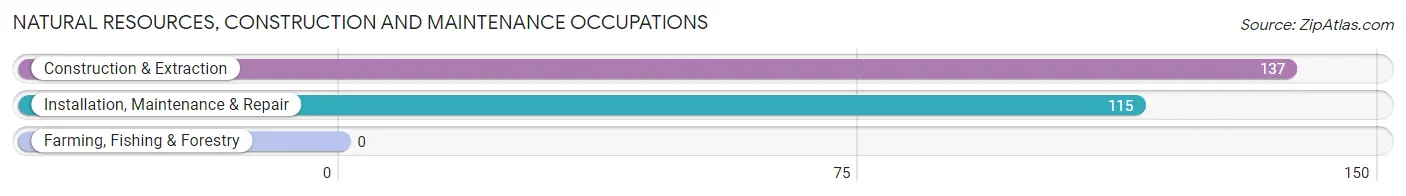
Natural Resources, Construction and Maintenance Occupations
The most common Natural Resources, Construction and Maintenance occupations in Mead are Construction & Extraction (137 | 4.5%), and Installation, Maintenance & Repair (115 | 3.8%).
Natural Resources, Construction and Maintenance Occupations by Sex
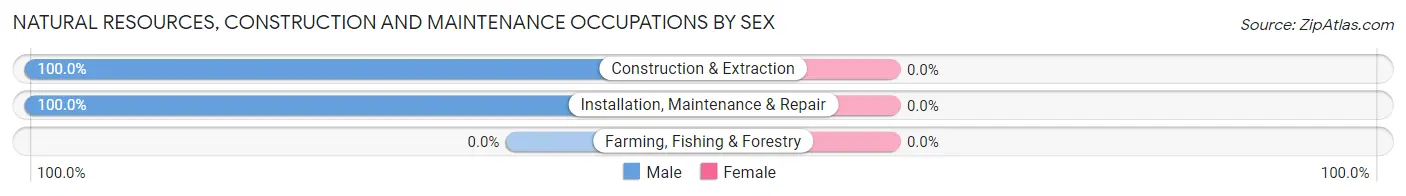
| Occupation | Male | Female |
| Farming, Fishing & Forestry | 0 (0.0%) | 0 (0.0%) |
| Construction & Extraction | 137 (100.0%) | 0 (0.0%) |
| Installation, Maintenance & Repair | 115 (100.0%) | 0 (0.0%) |
| Total (Category) | 252 (100.0%) | 0 (0.0%) |
| Total (Overall) | 1,518 (50.4%) | 1,493 (49.6%) |
Production, Transportation and Moving Occupations
The most common Production, Transportation and Moving occupations in Mead are Transportation (125 | 4.2%), Production (100 | 3.3%), and Material Moving (94 | 3.1%).
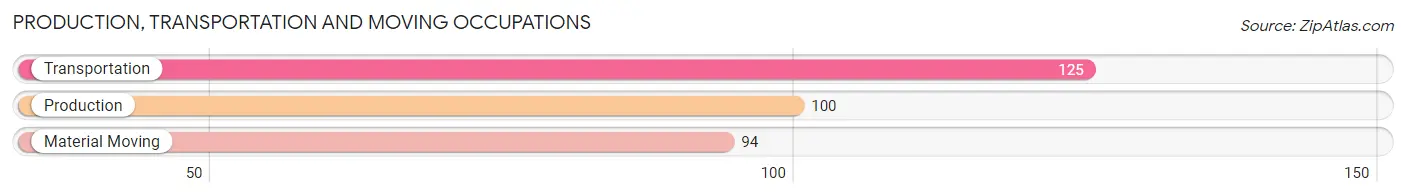
Production, Transportation and Moving Occupations by Sex
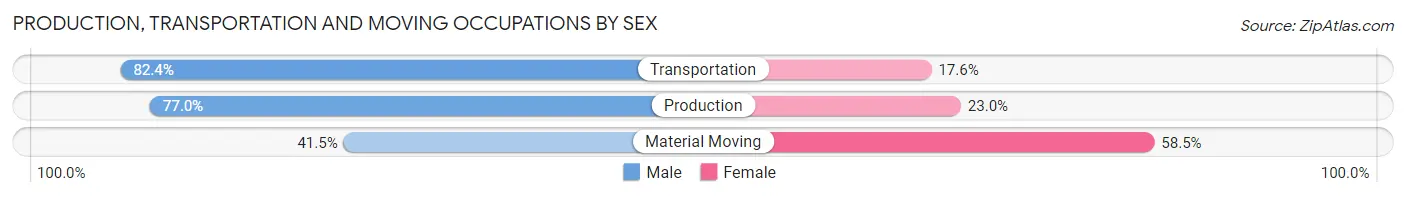
| Occupation | Male | Female |
| Production | 77 (77.0%) | 23 (23.0%) |
| Transportation | 103 (82.4%) | 22 (17.6%) |
| Material Moving | 39 (41.5%) | 55 (58.5%) |
| Total (Category) | 219 (68.6%) | 100 (31.4%) |
| Total (Overall) | 1,518 (50.4%) | 1,493 (49.6%) |
Employment Industries by Sex in Mead
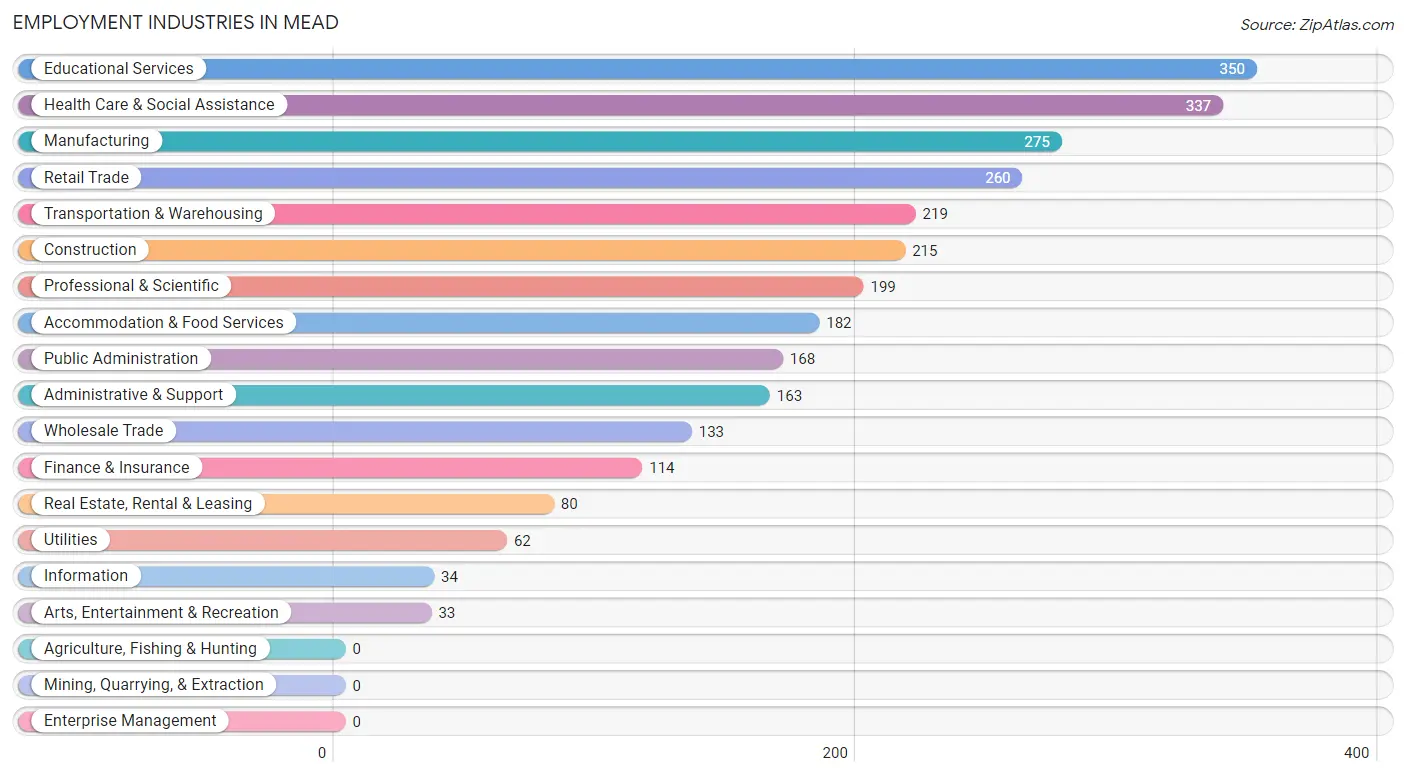
Employment Industries in Mead
The major employment industries in Mead include Educational Services (350 | 11.6%), Health Care & Social Assistance (337 | 11.2%), Manufacturing (275 | 9.1%), Retail Trade (260 | 8.6%), and Transportation & Warehousing (219 | 7.3%).
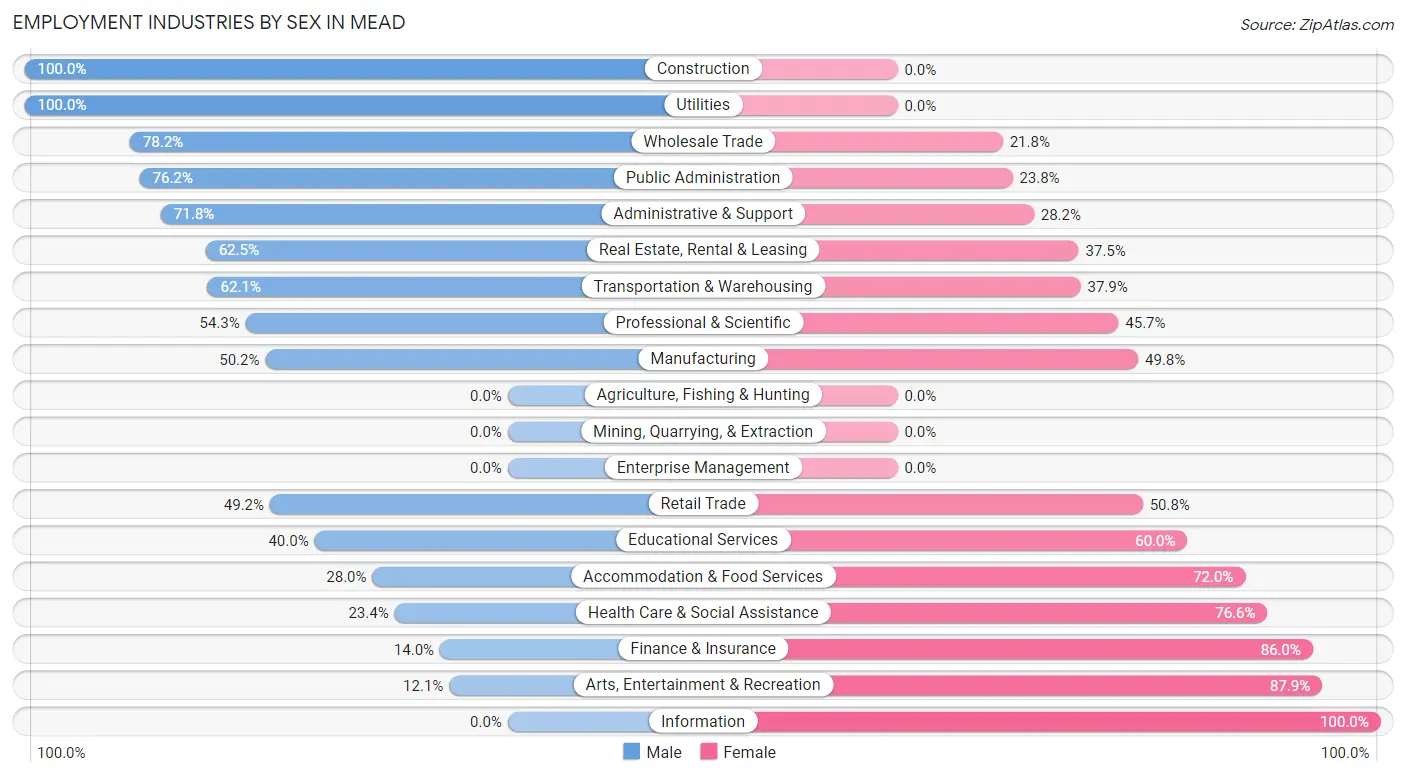
Employment Industries by Sex in Mead
The Mead industries that see more men than women are Construction (100.0%), Utilities (100.0%), and Wholesale Trade (78.2%), whereas the industries that tend to have a higher number of women are Information (100.0%), Arts, Entertainment & Recreation (87.9%), and Finance & Insurance (86.0%).
| Industry | Male | Female |
| Agriculture, Fishing & Hunting | 0 (0.0%) | 0 (0.0%) |
| Mining, Quarrying, & Extraction | 0 (0.0%) | 0 (0.0%) |
| Construction | 215 (100.0%) | 0 (0.0%) |
| Manufacturing | 138 (50.2%) | 137 (49.8%) |
| Wholesale Trade | 104 (78.2%) | 29 (21.8%) |
| Retail Trade | 128 (49.2%) | 132 (50.8%) |
| Transportation & Warehousing | 136 (62.1%) | 83 (37.9%) |
| Utilities | 62 (100.0%) | 0 (0.0%) |
| Information | 0 (0.0%) | 34 (100.0%) |
| Finance & Insurance | 16 (14.0%) | 98 (86.0%) |
| Real Estate, Rental & Leasing | 50 (62.5%) | 30 (37.5%) |
| Professional & Scientific | 108 (54.3%) | 91 (45.7%) |
| Enterprise Management | 0 (0.0%) | 0 (0.0%) |
| Administrative & Support | 117 (71.8%) | 46 (28.2%) |
| Educational Services | 140 (40.0%) | 210 (60.0%) |
| Health Care & Social Assistance | 79 (23.4%) | 258 (76.6%) |
| Arts, Entertainment & Recreation | 4 (12.1%) | 29 (87.9%) |
| Accommodation & Food Services | 51 (28.0%) | 131 (72.0%) |
| Public Administration | 128 (76.2%) | 40 (23.8%) |
| Total | 1,518 (50.4%) | 1,493 (49.6%) |
Education in Mead
School Enrollment in Mead
The most common levels of schooling among the 1,584 students in Mead are high school (589 | 37.2%), middle school (429 | 27.1%), and elementary school (282 | 17.8%).
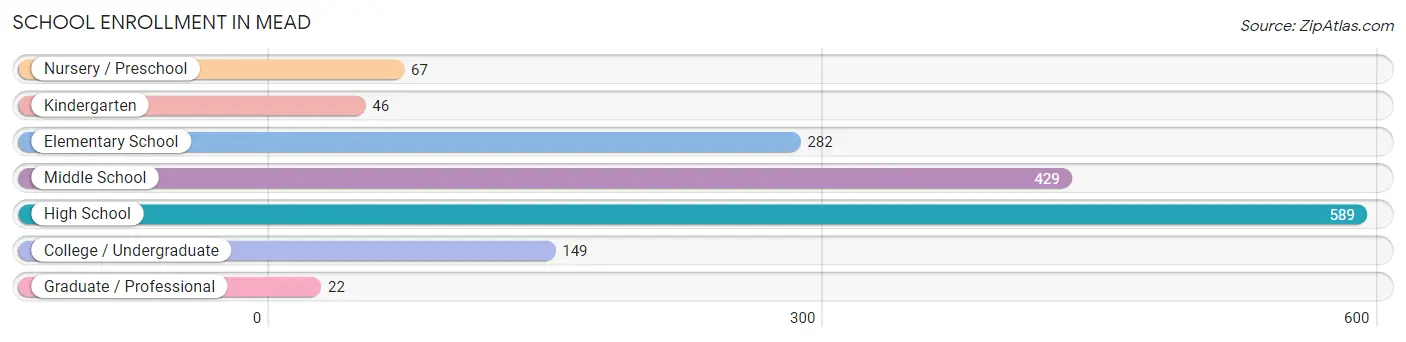
| School Level | # Students | % Students |
| Nursery / Preschool | 67 | 4.2% |
| Kindergarten | 46 | 2.9% |
| Elementary School | 282 | 17.8% |
| Middle School | 429 | 27.1% |
| High School | 589 | 37.2% |
| College / Undergraduate | 149 | 9.4% |
| Graduate / Professional | 22 | 1.4% |
| Total | 1,584 | 100.0% |
School Enrollment by Age by Funding Source in Mead
Out of a total of 1,584 students who are enrolled in schools in Mead, 390 (24.6%) attend a private institution, while the remaining 1,194 (75.4%) are enrolled in public schools. The age group of 3 to 4 year olds has the highest likelihood of being enrolled in private schools, with 15 (100.0% in the age bracket) enrolled. Conversely, the age group of 18 to 19 year olds has the lowest likelihood of being enrolled in a private school, with 57 (90.5% in the age bracket) attending a public institution.
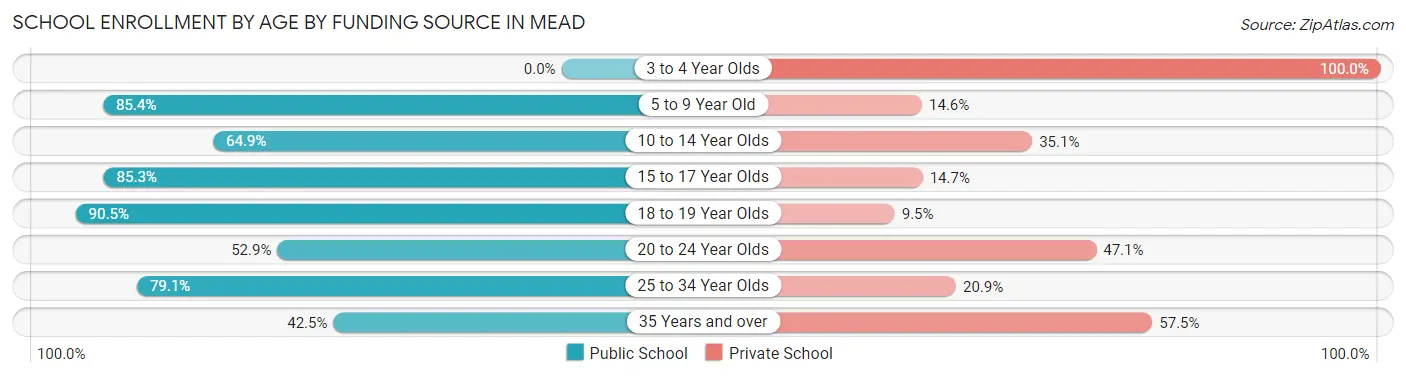
| Age Bracket | Public School | Private School |
| 3 to 4 Year Olds | 0 (0.0%) | 15 (100.0%) |
| 5 to 9 Year Old | 298 (85.4%) | 51 (14.6%) |
| 10 to 14 Year Olds | 314 (64.9%) | 170 (35.1%) |
| 15 to 17 Year Olds | 440 (85.3%) | 76 (14.7%) |
| 18 to 19 Year Olds | 57 (90.5%) | 6 (9.5%) |
| 20 to 24 Year Olds | 18 (52.9%) | 16 (47.1%) |
| 25 to 34 Year Olds | 34 (79.1%) | 9 (20.9%) |
| 35 Years and over | 34 (42.5%) | 46 (57.5%) |
| Total | 1,194 (75.4%) | 390 (24.6%) |
Educational Attainment by Field of Study in Mead
Education (270 | 19.7%), psychology (151 | 11.0%), science & technology (150 | 10.9%), business (148 | 10.8%), and arts & humanities (123 | 9.0%) are the most common fields of study among 1,373 individuals in Mead who have obtained a bachelor's degree or higher.
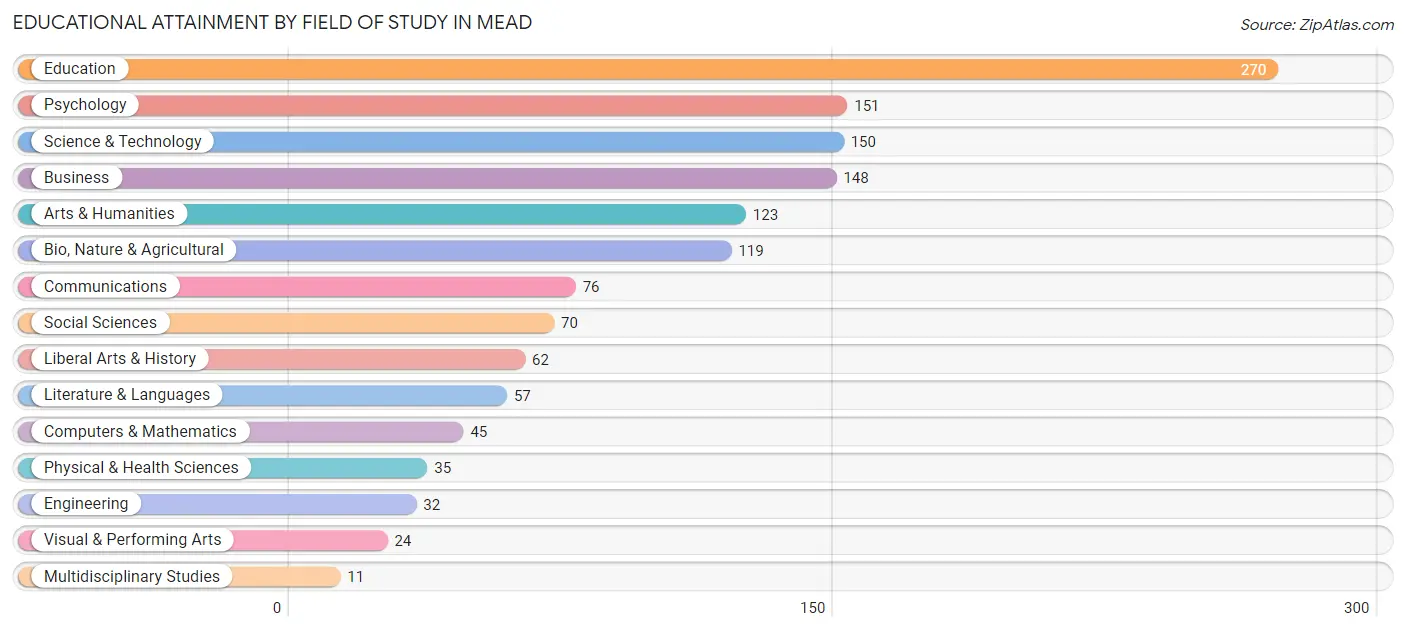
| Field of Study | # Graduates | % Graduates |
| Computers & Mathematics | 45 | 3.3% |
| Bio, Nature & Agricultural | 119 | 8.7% |
| Physical & Health Sciences | 35 | 2.5% |
| Psychology | 151 | 11.0% |
| Social Sciences | 70 | 5.1% |
| Engineering | 32 | 2.3% |
| Multidisciplinary Studies | 11 | 0.8% |
| Science & Technology | 150 | 10.9% |
| Business | 148 | 10.8% |
| Education | 270 | 19.7% |
| Literature & Languages | 57 | 4.2% |
| Liberal Arts & History | 62 | 4.5% |
| Visual & Performing Arts | 24 | 1.8% |
| Communications | 76 | 5.5% |
| Arts & Humanities | 123 | 9.0% |
| Total | 1,373 | 100.0% |
Transportation & Commute in Mead
Vehicle Availability by Sex in Mead
The most prevalent vehicle ownership categories in Mead are males with 3 vehicles (555, accounting for 38.0%) and females with 3 vehicles (435, making up 40.7%).
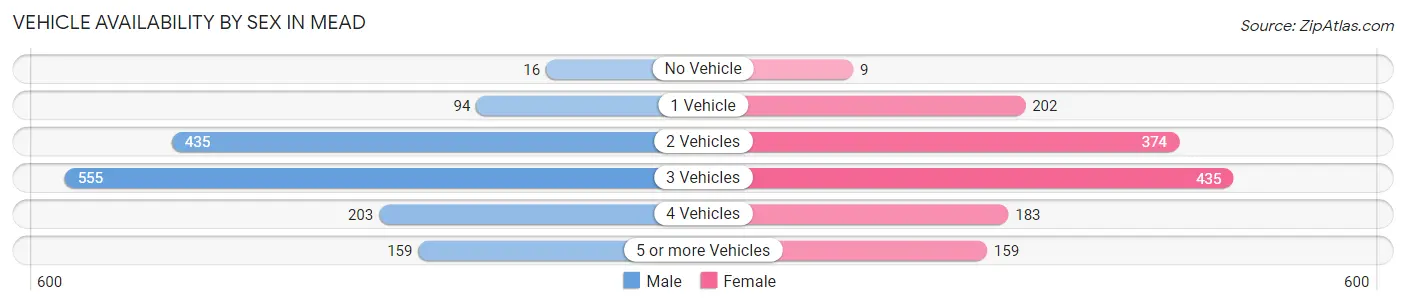
| Vehicles Available | Male | Female |
| No Vehicle | 16 (1.1%) | 9 (0.7%) |
| 1 Vehicle | 94 (6.4%) | 202 (14.8%) |
| 2 Vehicles | 435 (29.7%) | 374 (27.5%) |
| 3 Vehicles | 555 (38.0%) | 435 (31.9%) |
| 4 Vehicles | 203 (13.9%) | 183 (13.4%) |
| 5 or more Vehicles | 159 (10.9%) | 159 (11.7%) |
| Total | 1,462 (100.0%) | 1,362 (100.0%) |
Commute Time in Mead
The most frequently occuring commute durations in Mead are 30 to 34 minutes (477 commuters, 18.9%), 15 to 19 minutes (413 commuters, 16.4%), and 20 to 24 minutes (367 commuters, 14.5%).
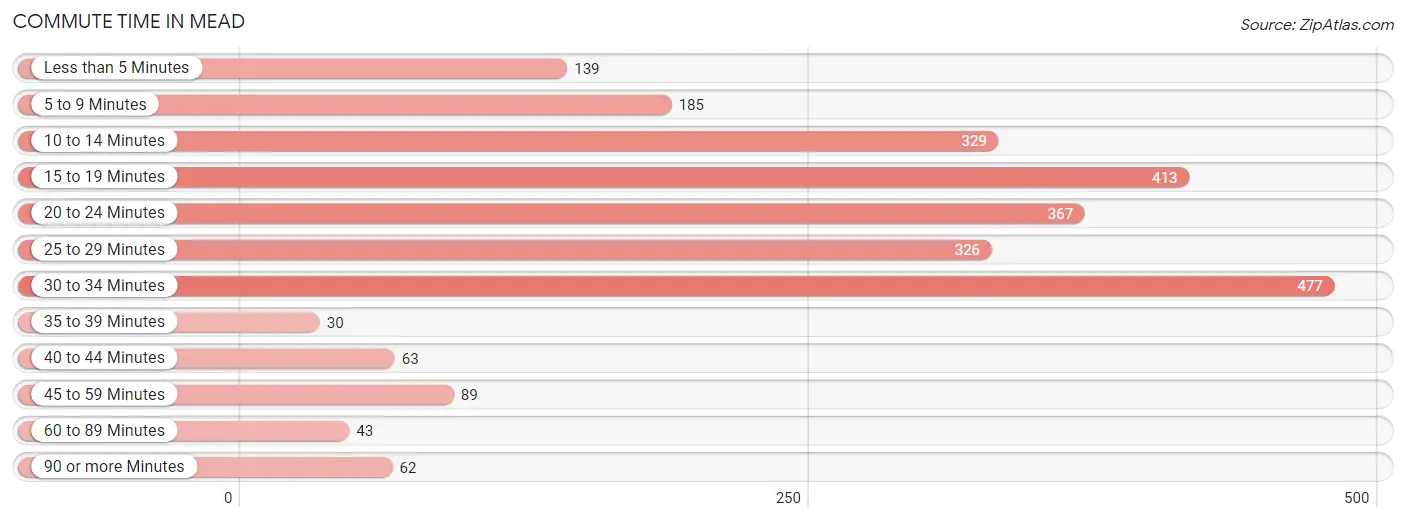
| Commute Time | # Commuters | % Commuters |
| Less than 5 Minutes | 139 | 5.5% |
| 5 to 9 Minutes | 185 | 7.3% |
| 10 to 14 Minutes | 329 | 13.0% |
| 15 to 19 Minutes | 413 | 16.4% |
| 20 to 24 Minutes | 367 | 14.5% |
| 25 to 29 Minutes | 326 | 12.9% |
| 30 to 34 Minutes | 477 | 18.9% |
| 35 to 39 Minutes | 30 | 1.2% |
| 40 to 44 Minutes | 63 | 2.5% |
| 45 to 59 Minutes | 89 | 3.5% |
| 60 to 89 Minutes | 43 | 1.7% |
| 90 or more Minutes | 62 | 2.5% |
Commute Time by Sex in Mead
The most common commute times in Mead are 30 to 34 minutes (227 commuters, 17.5%) for males and 30 to 34 minutes (250 commuters, 20.4%) for females.
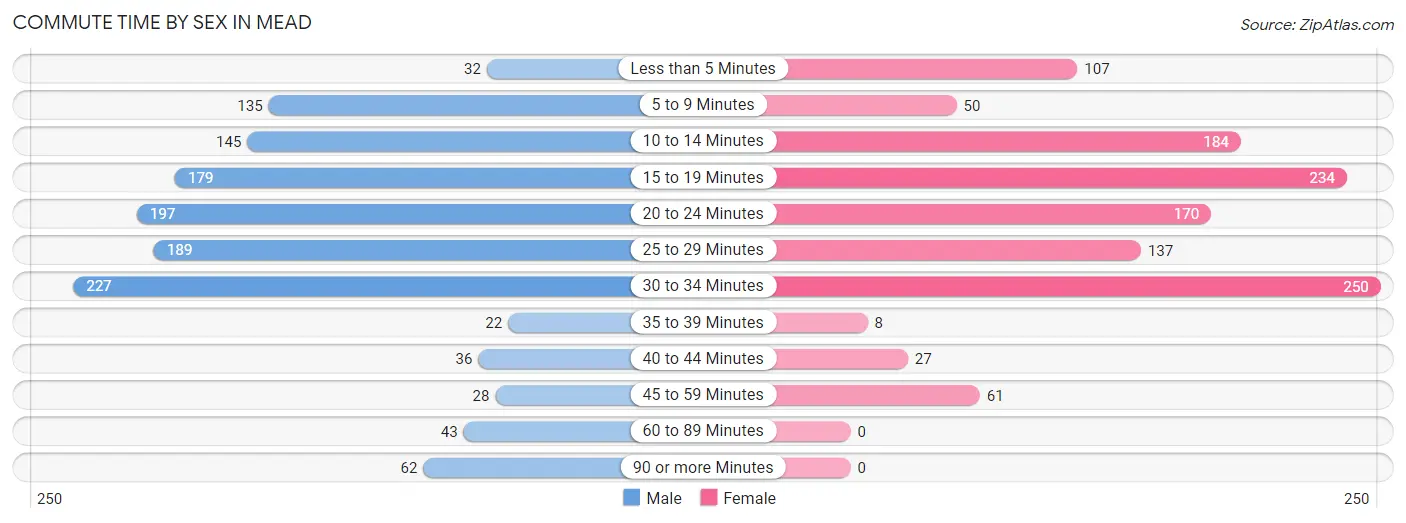
| Commute Time | Male | Female |
| Less than 5 Minutes | 32 (2.5%) | 107 (8.7%) |
| 5 to 9 Minutes | 135 (10.4%) | 50 (4.1%) |
| 10 to 14 Minutes | 145 (11.2%) | 184 (15.0%) |
| 15 to 19 Minutes | 179 (13.8%) | 234 (19.1%) |
| 20 to 24 Minutes | 197 (15.2%) | 170 (13.8%) |
| 25 to 29 Minutes | 189 (14.6%) | 137 (11.2%) |
| 30 to 34 Minutes | 227 (17.5%) | 250 (20.4%) |
| 35 to 39 Minutes | 22 (1.7%) | 8 (0.6%) |
| 40 to 44 Minutes | 36 (2.8%) | 27 (2.2%) |
| 45 to 59 Minutes | 28 (2.2%) | 61 (5.0%) |
| 60 to 89 Minutes | 43 (3.3%) | 0 (0.0%) |
| 90 or more Minutes | 62 (4.8%) | 0 (0.0%) |
Time of Departure to Work by Sex in Mead
The most frequent times of departure to work in Mead are 6:30 AM to 6:59 AM (259, 20.0%) for males and 7:30 AM to 7:59 AM (285, 23.2%) for females.
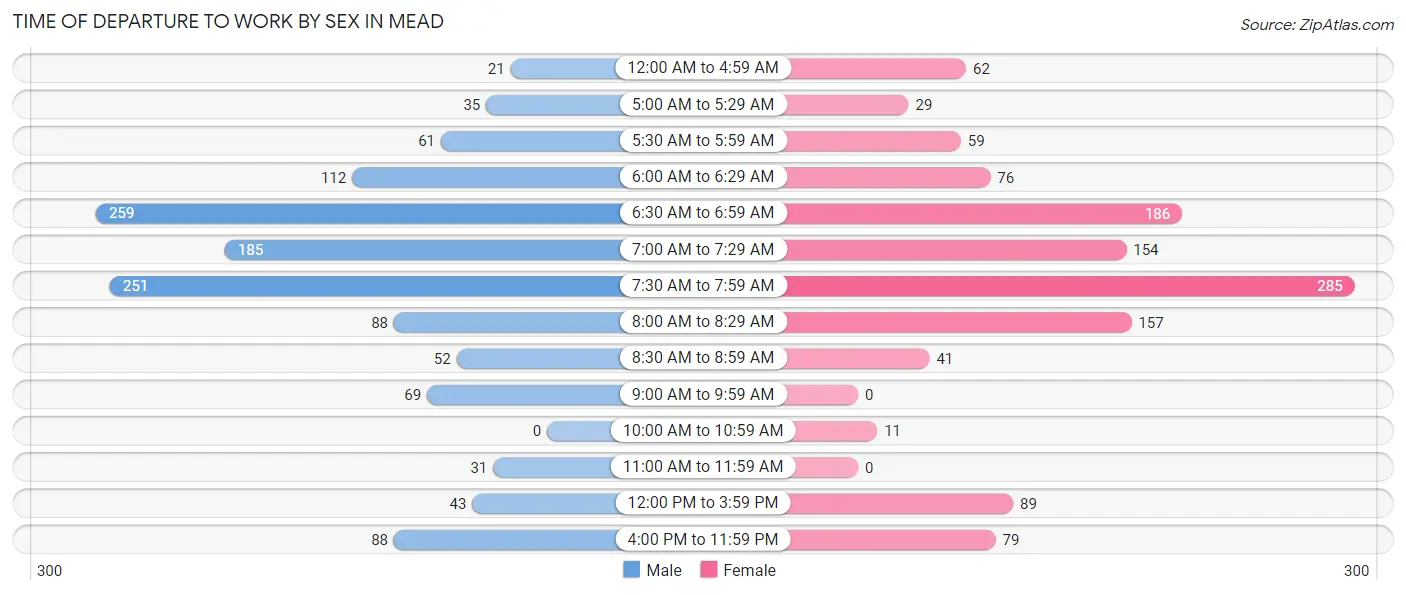
| Time of Departure | Male | Female |
| 12:00 AM to 4:59 AM | 21 (1.6%) | 62 (5.1%) |
| 5:00 AM to 5:29 AM | 35 (2.7%) | 29 (2.4%) |
| 5:30 AM to 5:59 AM | 61 (4.7%) | 59 (4.8%) |
| 6:00 AM to 6:29 AM | 112 (8.6%) | 76 (6.2%) |
| 6:30 AM to 6:59 AM | 259 (20.0%) | 186 (15.1%) |
| 7:00 AM to 7:29 AM | 185 (14.3%) | 154 (12.5%) |
| 7:30 AM to 7:59 AM | 251 (19.4%) | 285 (23.2%) |
| 8:00 AM to 8:29 AM | 88 (6.8%) | 157 (12.8%) |
| 8:30 AM to 8:59 AM | 52 (4.0%) | 41 (3.3%) |
| 9:00 AM to 9:59 AM | 69 (5.3%) | 0 (0.0%) |
| 10:00 AM to 10:59 AM | 0 (0.0%) | 11 (0.9%) |
| 11:00 AM to 11:59 AM | 31 (2.4%) | 0 (0.0%) |
| 12:00 PM to 3:59 PM | 43 (3.3%) | 89 (7.2%) |
| 4:00 PM to 11:59 PM | 88 (6.8%) | 79 (6.4%) |
| Total | 1,295 (100.0%) | 1,228 (100.0%) |
Housing Occupancy in Mead
Occupancy by Ownership in Mead
Of the total 2,600 dwellings in Mead, owner-occupied units account for 2,334 (89.8%), while renter-occupied units make up 266 (10.2%).
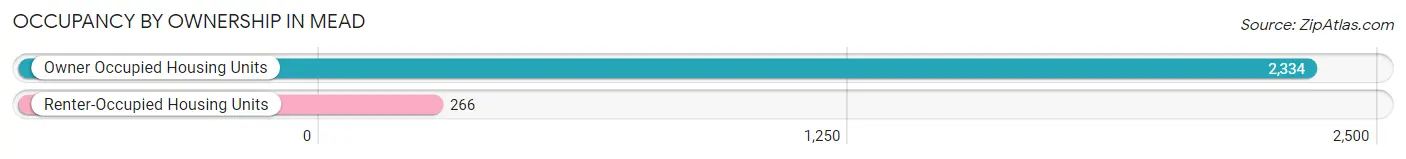
| Occupancy | # Housing Units | % Housing Units |
| Owner Occupied Housing Units | 2,334 | 89.8% |
| Renter-Occupied Housing Units | 266 | 10.2% |
| Total Occupied Housing Units | 2,600 | 100.0% |
Occupancy by Household Size in Mead
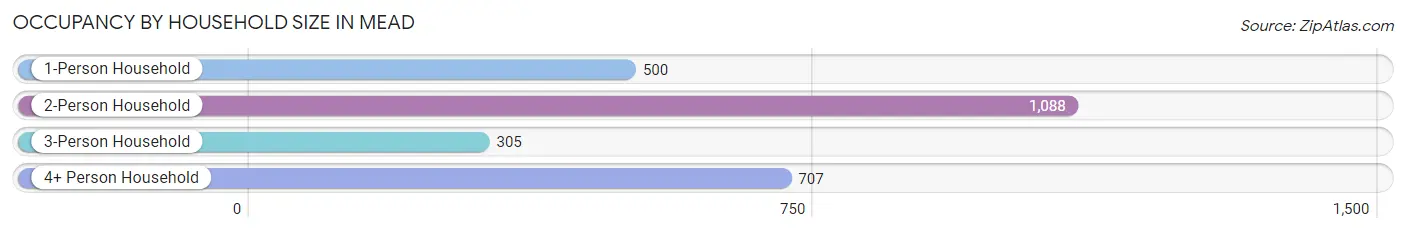
| Household Size | # Housing Units | % Housing Units |
| 1-Person Household | 500 | 19.2% |
| 2-Person Household | 1,088 | 41.8% |
| 3-Person Household | 305 | 11.7% |
| 4+ Person Household | 707 | 27.2% |
| Total Housing Units | 2,600 | 100.0% |
Occupancy by Ownership by Household Size in Mead
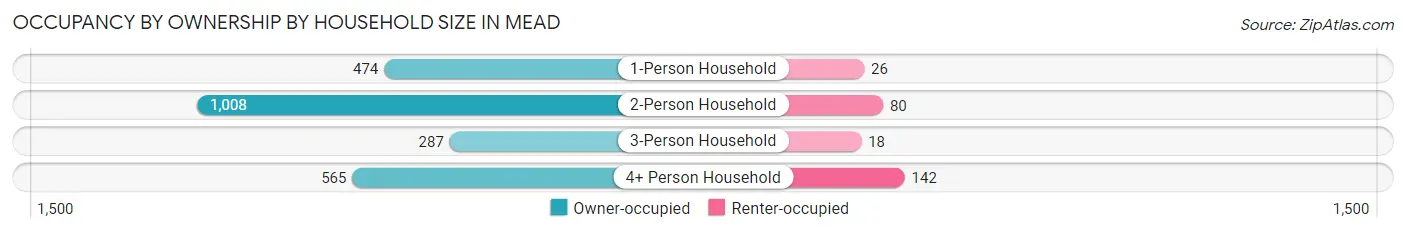
| Household Size | Owner-occupied | Renter-occupied |
| 1-Person Household | 474 (94.8%) | 26 (5.2%) |
| 2-Person Household | 1,008 (92.6%) | 80 (7.3%) |
| 3-Person Household | 287 (94.1%) | 18 (5.9%) |
| 4+ Person Household | 565 (79.9%) | 142 (20.1%) |
| Total Housing Units | 2,334 (89.8%) | 266 (10.2%) |
Occupancy by Educational Attainment in Mead
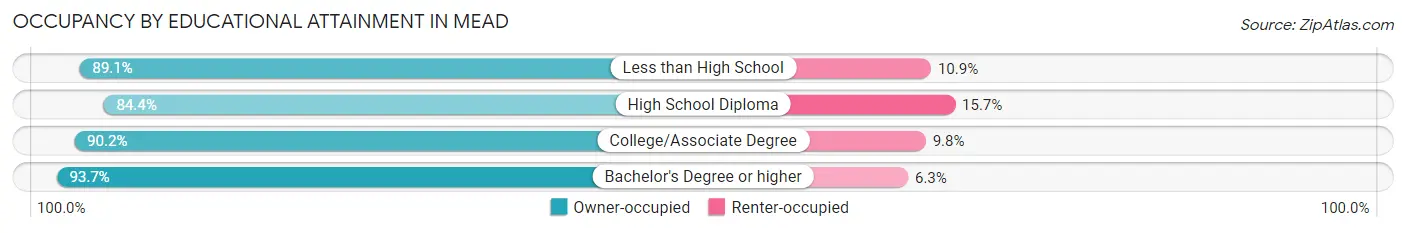
| Household Size | Owner-occupied | Renter-occupied |
| Less than High School | 82 (89.1%) | 10 (10.9%) |
| High School Diploma | 555 (84.4%) | 103 (15.7%) |
| College/Associate Degree | 926 (90.2%) | 101 (9.8%) |
| Bachelor's Degree or higher | 771 (93.7%) | 52 (6.3%) |
Occupancy by Age of Householder in Mead
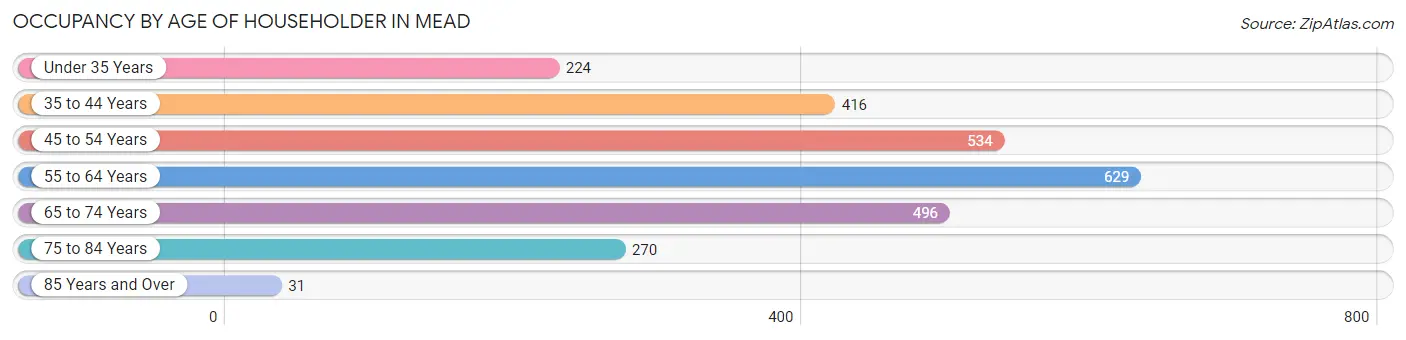
| Age Bracket | # Households | % Households |
| Under 35 Years | 224 | 8.6% |
| 35 to 44 Years | 416 | 16.0% |
| 45 to 54 Years | 534 | 20.5% |
| 55 to 64 Years | 629 | 24.2% |
| 65 to 74 Years | 496 | 19.1% |
| 75 to 84 Years | 270 | 10.4% |
| 85 Years and Over | 31 | 1.2% |
| Total | 2,600 | 100.0% |
Housing Finances in Mead
Median Income by Occupancy in Mead
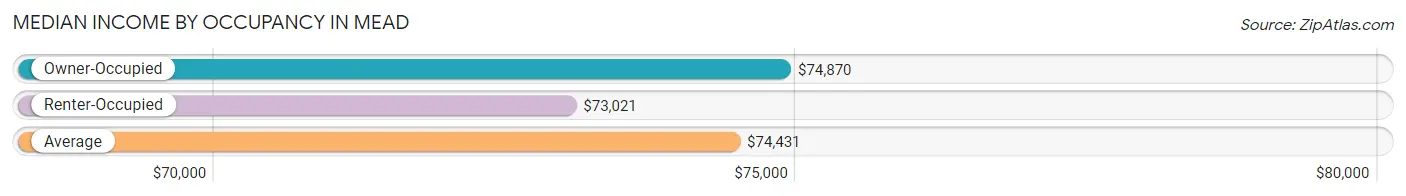
| Occupancy Type | # Households | Median Income |
| Owner-Occupied | 2,334 (89.8%) | $74,870 |
| Renter-Occupied | 266 (10.2%) | $73,021 |
| Average | 2,600 (100.0%) | $74,431 |
Occupancy by Householder Income Bracket in Mead
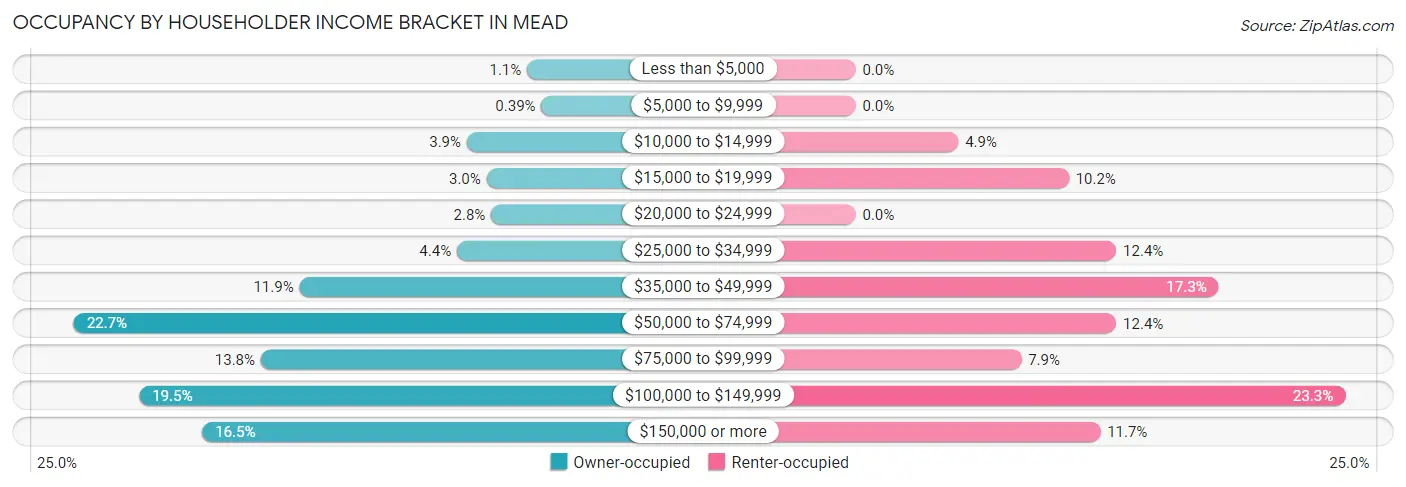
| Income Bracket | Owner-occupied | Renter-occupied |
| Less than $5,000 | 25 (1.1%) | 0 (0.0%) |
| $5,000 to $9,999 | 9 (0.4%) | 0 (0.0%) |
| $10,000 to $14,999 | 92 (3.9%) | 13 (4.9%) |
| $15,000 to $19,999 | 70 (3.0%) | 27 (10.2%) |
| $20,000 to $24,999 | 65 (2.8%) | 0 (0.0%) |
| $25,000 to $34,999 | 103 (4.4%) | 33 (12.4%) |
| $35,000 to $49,999 | 278 (11.9%) | 46 (17.3%) |
| $50,000 to $74,999 | 529 (22.7%) | 33 (12.4%) |
| $75,000 to $99,999 | 321 (13.8%) | 21 (7.9%) |
| $100,000 to $149,999 | 456 (19.5%) | 62 (23.3%) |
| $150,000 or more | 386 (16.5%) | 31 (11.7%) |
| Total | 2,334 (100.0%) | 266 (100.0%) |
Monthly Housing Cost Tiers in Mead
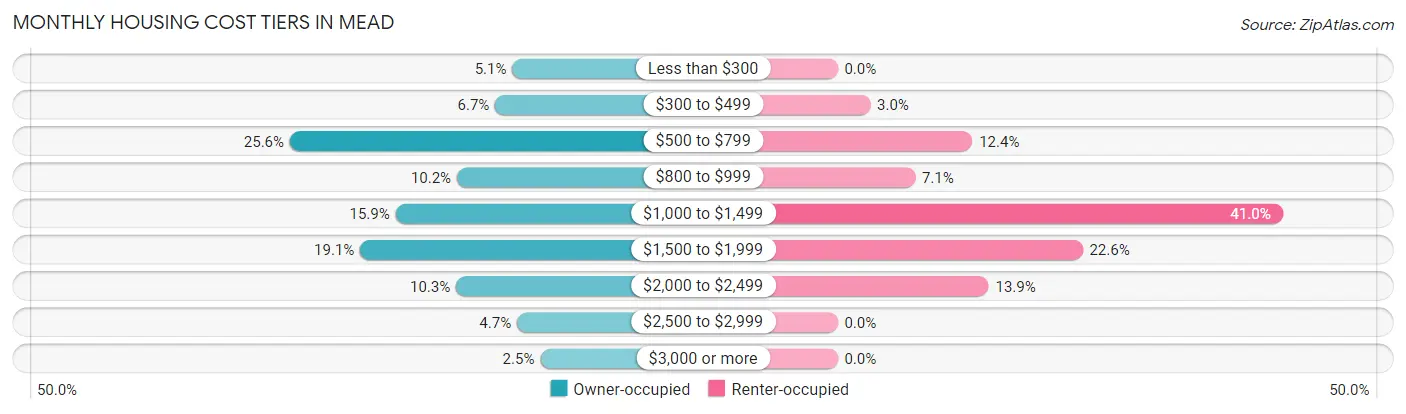
| Monthly Cost | Owner-occupied | Renter-occupied |
| Less than $300 | 119 (5.1%) | 0 (0.0%) |
| $300 to $499 | 156 (6.7%) | 8 (3.0%) |
| $500 to $799 | 597 (25.6%) | 33 (12.4%) |
| $800 to $999 | 238 (10.2%) | 19 (7.1%) |
| $1,000 to $1,499 | 370 (15.9%) | 109 (41.0%) |
| $1,500 to $1,999 | 446 (19.1%) | 60 (22.6%) |
| $2,000 to $2,499 | 240 (10.3%) | 37 (13.9%) |
| $2,500 to $2,999 | 109 (4.7%) | 0 (0.0%) |
| $3,000 or more | 59 (2.5%) | 0 (0.0%) |
| Total | 2,334 (100.0%) | 266 (100.0%) |
Physical Housing Characteristics in Mead
Housing Structures in Mead
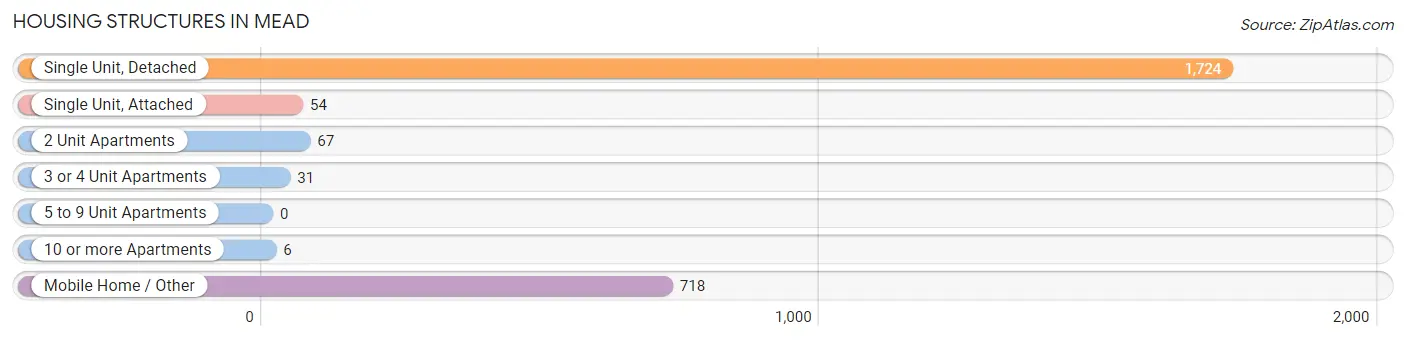
| Structure Type | # Housing Units | % Housing Units |
| Single Unit, Detached | 1,724 | 66.3% |
| Single Unit, Attached | 54 | 2.1% |
| 2 Unit Apartments | 67 | 2.6% |
| 3 or 4 Unit Apartments | 31 | 1.2% |
| 5 to 9 Unit Apartments | 0 | 0.0% |
| 10 or more Apartments | 6 | 0.2% |
| Mobile Home / Other | 718 | 27.6% |
| Total | 2,600 | 100.0% |
Housing Structures by Occupancy in Mead
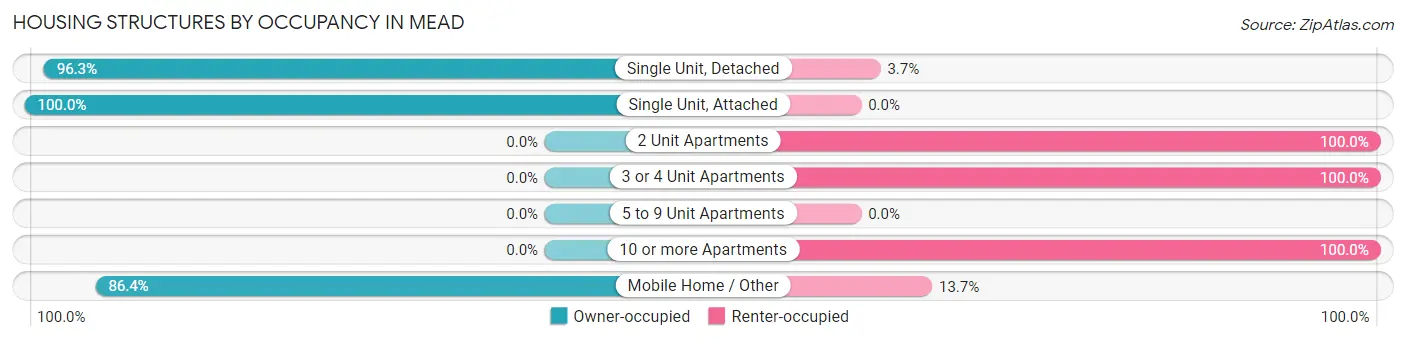
| Structure Type | Owner-occupied | Renter-occupied |
| Single Unit, Detached | 1,660 (96.3%) | 64 (3.7%) |
| Single Unit, Attached | 54 (100.0%) | 0 (0.0%) |
| 2 Unit Apartments | 0 (0.0%) | 67 (100.0%) |
| 3 or 4 Unit Apartments | 0 (0.0%) | 31 (100.0%) |
| 5 to 9 Unit Apartments | 0 (0.0%) | 0 (0.0%) |
| 10 or more Apartments | 0 (0.0%) | 6 (100.0%) |
| Mobile Home / Other | 620 (86.4%) | 98 (13.7%) |
| Total | 2,334 (89.8%) | 266 (10.2%) |
Housing Structures by Number of Rooms in Mead
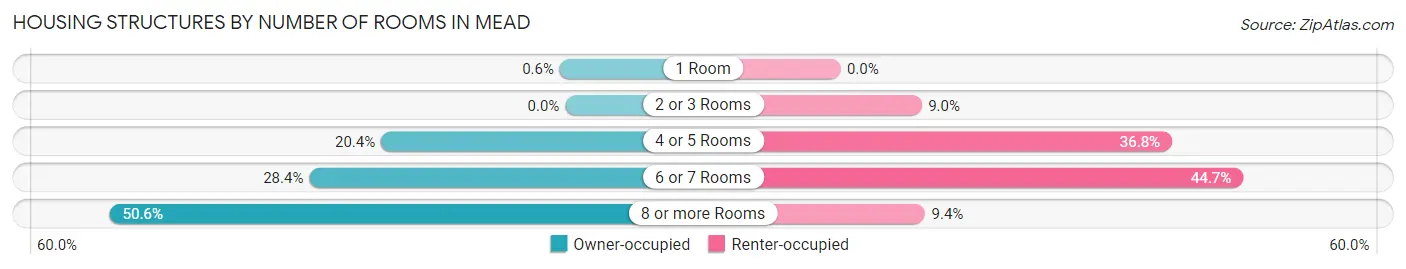
| Number of Rooms | Owner-occupied | Renter-occupied |
| 1 Room | 14 (0.6%) | 0 (0.0%) |
| 2 or 3 Rooms | 0 (0.0%) | 24 (9.0%) |
| 4 or 5 Rooms | 477 (20.4%) | 98 (36.8%) |
| 6 or 7 Rooms | 663 (28.4%) | 119 (44.7%) |
| 8 or more Rooms | 1,180 (50.6%) | 25 (9.4%) |
| Total | 2,334 (100.0%) | 266 (100.0%) |
Housing Structure by Heating Type in Mead
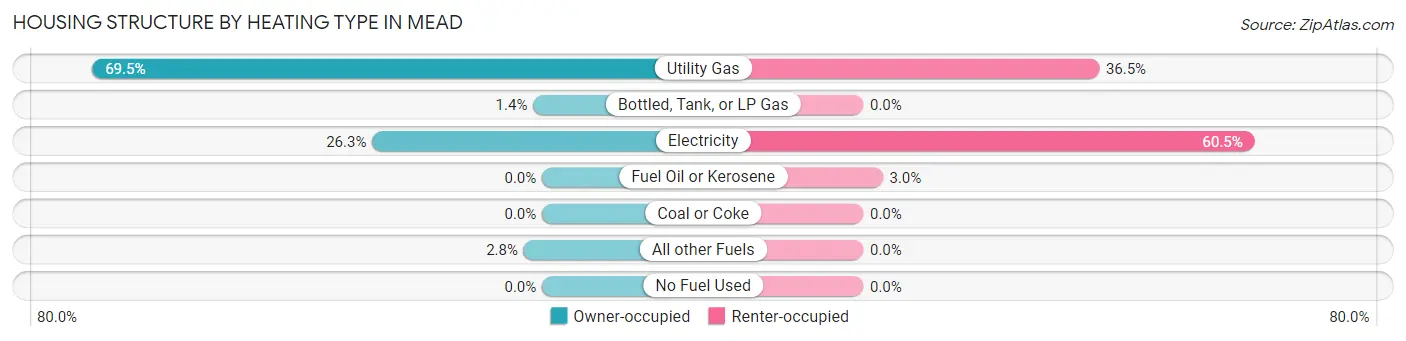
| Heating Type | Owner-occupied | Renter-occupied |
| Utility Gas | 1,623 (69.5%) | 97 (36.5%) |
| Bottled, Tank, or LP Gas | 32 (1.4%) | 0 (0.0%) |
| Electricity | 613 (26.3%) | 161 (60.5%) |
| Fuel Oil or Kerosene | 0 (0.0%) | 8 (3.0%) |
| Coal or Coke | 0 (0.0%) | 0 (0.0%) |
| All other Fuels | 66 (2.8%) | 0 (0.0%) |
| No Fuel Used | 0 (0.0%) | 0 (0.0%) |
| Total | 2,334 (100.0%) | 266 (100.0%) |
Household Vehicle Usage in Mead
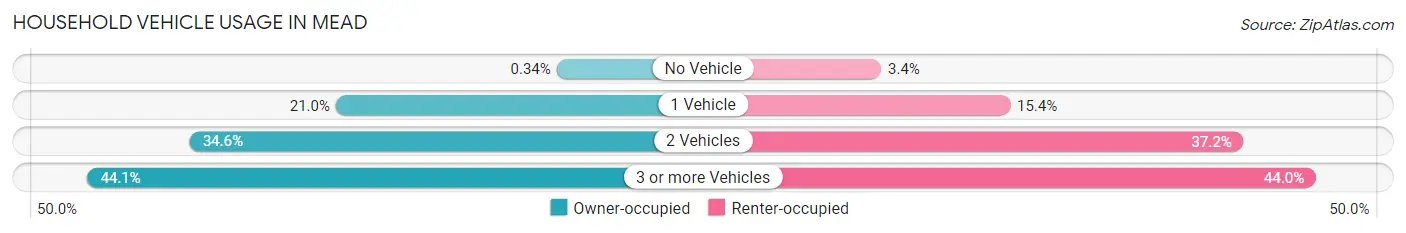
| Vehicles per Household | Owner-occupied | Renter-occupied |
| No Vehicle | 8 (0.3%) | 9 (3.4%) |
| 1 Vehicle | 489 (20.9%) | 41 (15.4%) |
| 2 Vehicles | 807 (34.6%) | 99 (37.2%) |
| 3 or more Vehicles | 1,030 (44.1%) | 117 (44.0%) |
| Total | 2,334 (100.0%) | 266 (100.0%) |
Real Estate & Mortgages in Mead
Real Estate and Mortgage Overview in Mead
| Characteristic | Without Mortgage | With Mortgage |
| Housing Units | 1,117 | 1,217 |
| Median Property Value | $239,200 | $405,900 |
| Median Household Income | $56,893 | $288 |
| Monthly Housing Costs | $626 | $59 |
| Real Estate Taxes | $2,062 | $27 |
Property Value by Mortgage Status in Mead
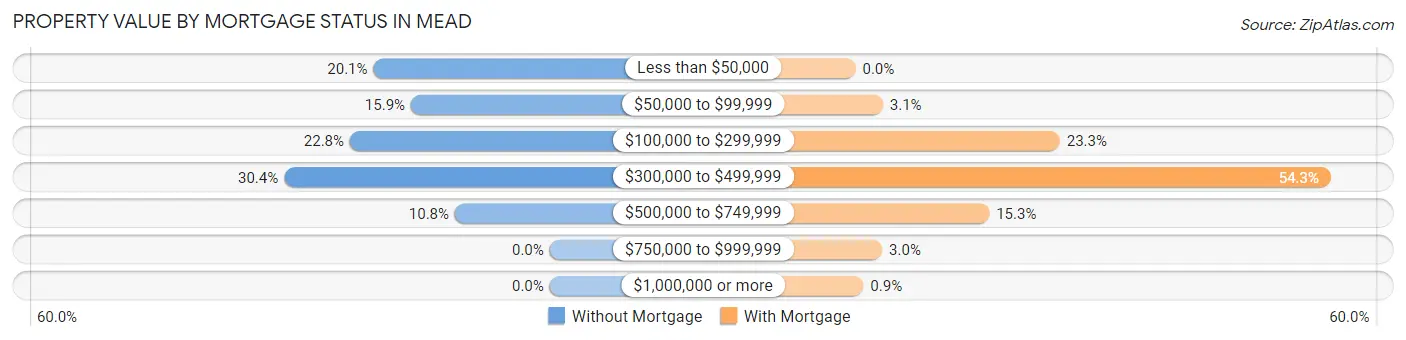
| Property Value | Without Mortgage | With Mortgage |
| Less than $50,000 | 225 (20.1%) | 0 (0.0%) |
| $50,000 to $99,999 | 177 (15.9%) | 38 (3.1%) |
| $100,000 to $299,999 | 255 (22.8%) | 284 (23.3%) |
| $300,000 to $499,999 | 339 (30.3%) | 661 (54.3%) |
| $500,000 to $749,999 | 121 (10.8%) | 186 (15.3%) |
| $750,000 to $999,999 | 0 (0.0%) | 37 (3.0%) |
| $1,000,000 or more | 0 (0.0%) | 11 (0.9%) |
| Total | 1,117 (100.0%) | 1,217 (100.0%) |
Household Income by Mortgage Status in Mead
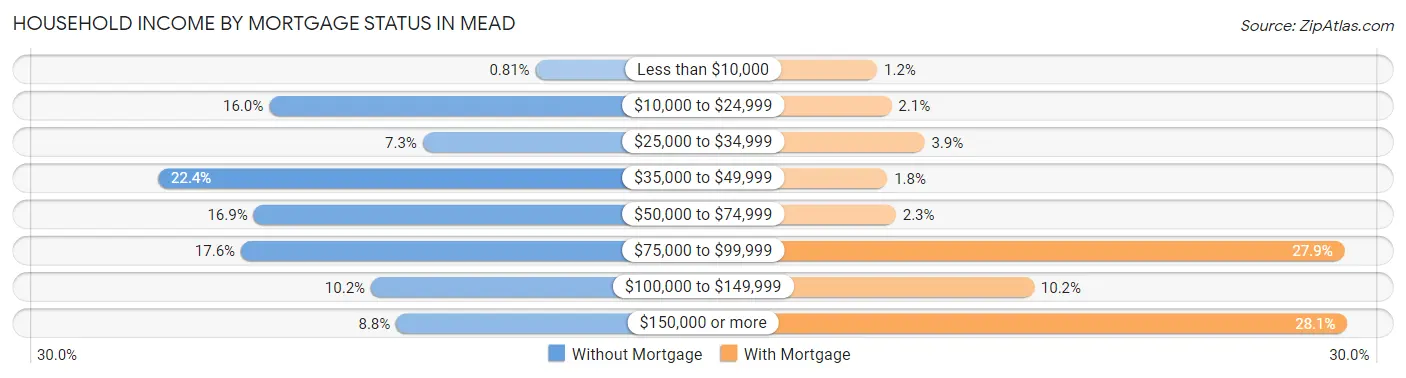
| Household Income | Without Mortgage | With Mortgage |
| Less than $10,000 | 9 (0.8%) | 15 (1.2%) |
| $10,000 to $24,999 | 179 (16.0%) | 25 (2.1%) |
| $25,000 to $34,999 | 81 (7.2%) | 48 (3.9%) |
| $35,000 to $49,999 | 250 (22.4%) | 22 (1.8%) |
| $50,000 to $74,999 | 189 (16.9%) | 28 (2.3%) |
| $75,000 to $99,999 | 197 (17.6%) | 340 (27.9%) |
| $100,000 to $149,999 | 114 (10.2%) | 124 (10.2%) |
| $150,000 or more | 98 (8.8%) | 342 (28.1%) |
| Total | 1,117 (100.0%) | 1,217 (100.0%) |
Property Value to Household Income Ratio in Mead
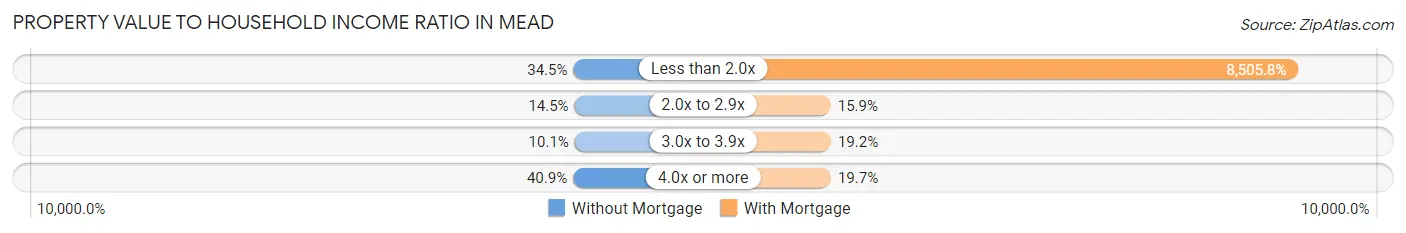
| Value-to-Income Ratio | Without Mortgage | With Mortgage |
| Less than 2.0x | 385 (34.5%) | 103,516 (8,505.8%) |
| 2.0x to 2.9x | 162 (14.5%) | 193 (15.9%) |
| 3.0x to 3.9x | 113 (10.1%) | 233 (19.2%) |
| 4.0x or more | 457 (40.9%) | 240 (19.7%) |
| Total | 1,117 (100.0%) | 1,217 (100.0%) |
Real Estate Taxes by Mortgage Status in Mead
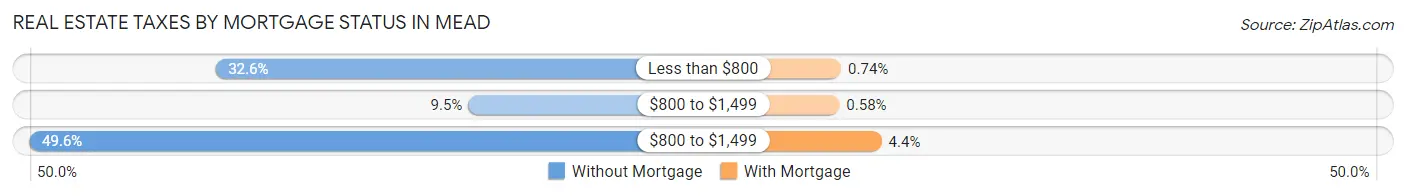
| Property Taxes | Without Mortgage | With Mortgage |
| Less than $800 | 364 (32.6%) | 9 (0.7%) |
| $800 to $1,499 | 106 (9.5%) | 7 (0.6%) |
| $800 to $1,499 | 554 (49.6%) | 54 (4.4%) |
| Total | 1,117 (100.0%) | 1,217 (100.0%) |
Health & Disability in Mead
Health Insurance Coverage by Age in Mead
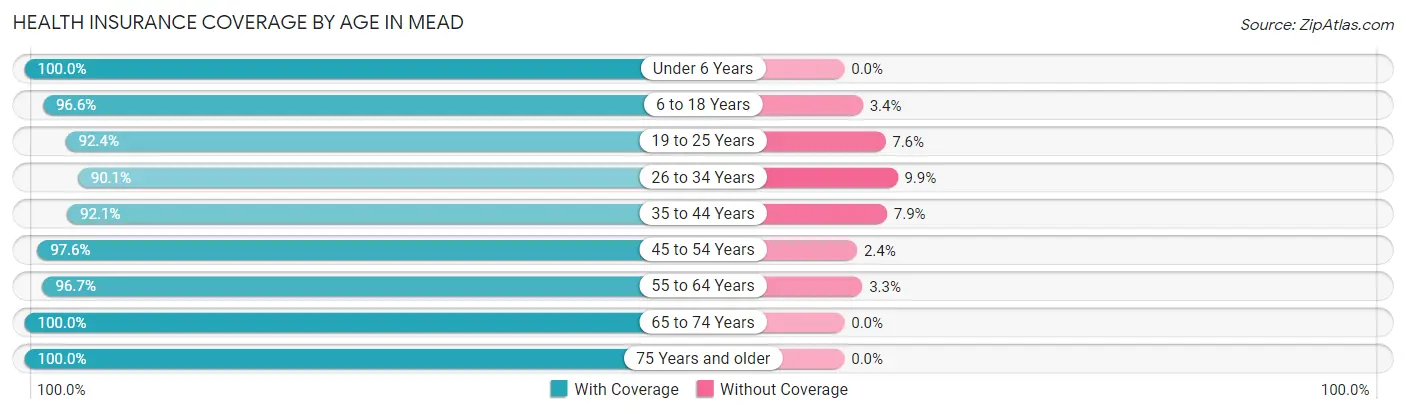
| Age Bracket | With Coverage | Without Coverage |
| Under 6 Years | 545 (100.0%) | 0 (0.0%) |
| 6 to 18 Years | 1,380 (96.6%) | 49 (3.4%) |
| 19 to 25 Years | 423 (92.4%) | 35 (7.6%) |
| 26 to 34 Years | 463 (90.1%) | 51 (9.9%) |
| 35 to 44 Years | 765 (92.1%) | 66 (7.9%) |
| 45 to 54 Years | 1,078 (97.6%) | 26 (2.4%) |
| 55 to 64 Years | 954 (96.7%) | 33 (3.3%) |
| 65 to 74 Years | 869 (100.0%) | 0 (0.0%) |
| 75 Years and older | 435 (100.0%) | 0 (0.0%) |
| Total | 6,912 (96.4%) | 260 (3.6%) |
Health Insurance Coverage by Citizenship Status in Mead
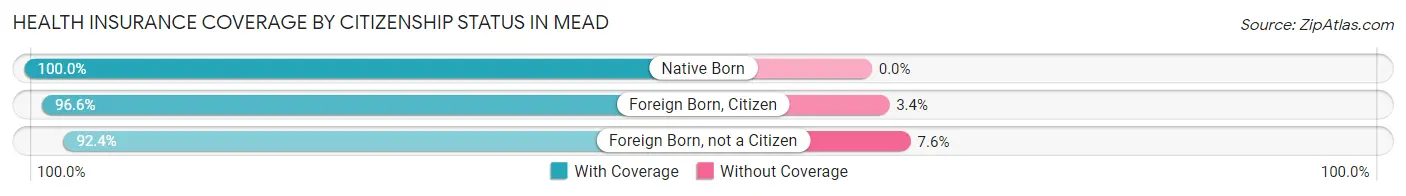
| Citizenship Status | With Coverage | Without Coverage |
| Native Born | 545 (100.0%) | 0 (0.0%) |
| Foreign Born, Citizen | 1,380 (96.6%) | 49 (3.4%) |
| Foreign Born, not a Citizen | 423 (92.4%) | 35 (7.6%) |
Health Insurance Coverage by Household Income in Mead
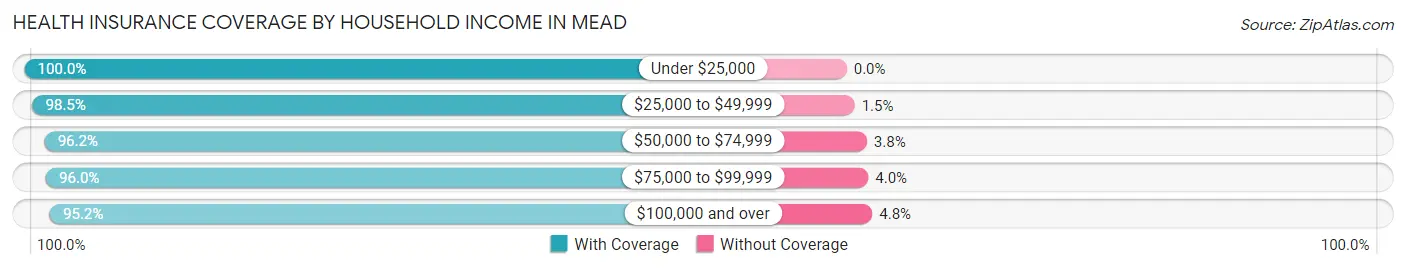
| Household Income | With Coverage | Without Coverage |
| Under $25,000 | 546 (100.0%) | 0 (0.0%) |
| $25,000 to $49,999 | 1,128 (98.5%) | 17 (1.5%) |
| $50,000 to $74,999 | 1,124 (96.2%) | 44 (3.8%) |
| $75,000 to $99,999 | 856 (96.0%) | 36 (4.0%) |
| $100,000 and over | 3,250 (95.2%) | 163 (4.8%) |
Public vs Private Health Insurance Coverage by Age in Mead
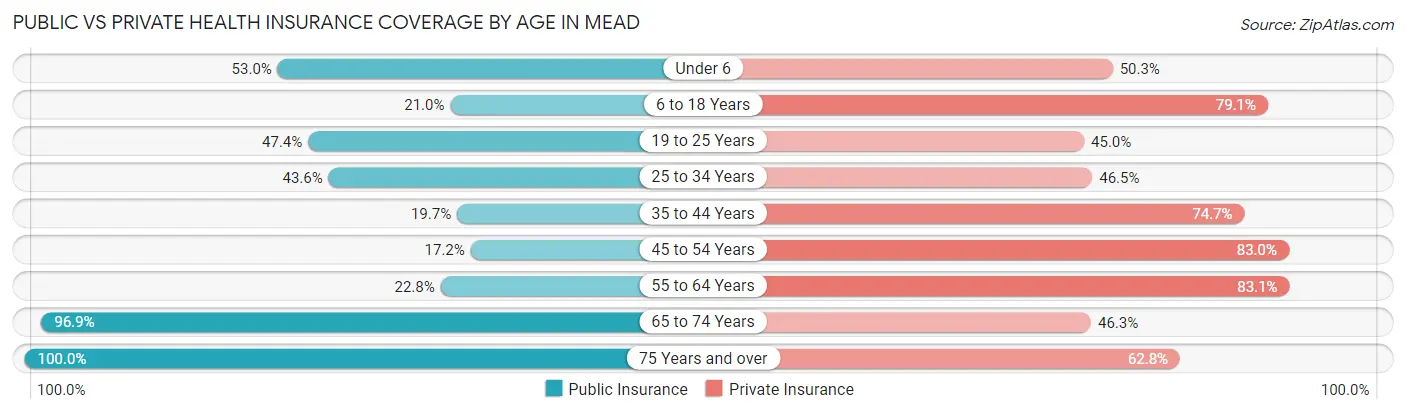
| Age Bracket | Public Insurance | Private Insurance |
| Under 6 | 289 (53.0%) | 274 (50.3%) |
| 6 to 18 Years | 300 (21.0%) | 1,130 (79.1%) |
| 19 to 25 Years | 217 (47.4%) | 206 (45.0%) |
| 25 to 34 Years | 224 (43.6%) | 239 (46.5%) |
| 35 to 44 Years | 164 (19.7%) | 621 (74.7%) |
| 45 to 54 Years | 190 (17.2%) | 916 (83.0%) |
| 55 to 64 Years | 225 (22.8%) | 820 (83.1%) |
| 65 to 74 Years | 842 (96.9%) | 402 (46.3%) |
| 75 Years and over | 435 (100.0%) | 273 (62.8%) |
| Total | 2,886 (40.2%) | 4,881 (68.1%) |
Disability Status by Sex by Age in Mead
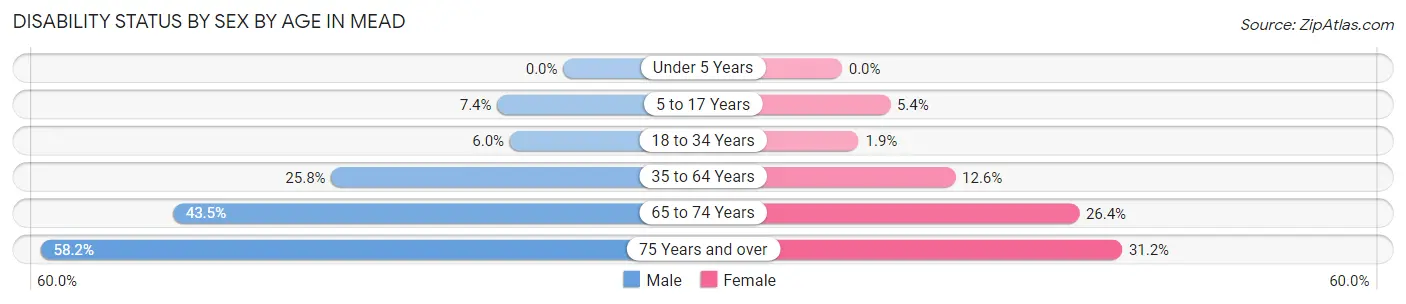
| Age Bracket | Male | Female |
| Under 5 Years | 0 (0.0%) | 0 (0.0%) |
| 5 to 17 Years | 51 (7.3%) | 39 (5.4%) |
| 18 to 34 Years | 35 (5.9%) | 9 (1.9%) |
| 35 to 64 Years | 366 (25.8%) | 190 (12.6%) |
| 65 to 74 Years | 177 (43.5%) | 122 (26.4%) |
| 75 Years and over | 117 (58.2%) | 73 (31.2%) |
Disability Class by Sex by Age in Mead
Disability Class: Hearing Difficulty
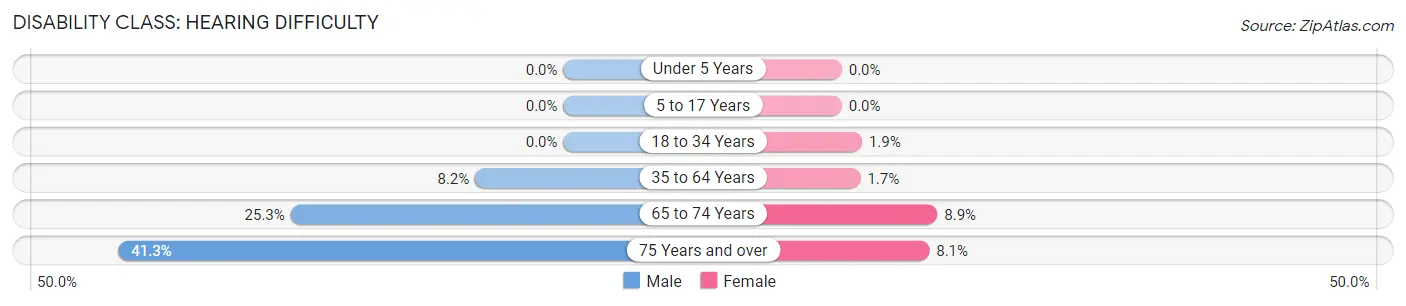
| Age Bracket | Male | Female |
| Under 5 Years | 0 (0.0%) | 0 (0.0%) |
| 5 to 17 Years | 0 (0.0%) | 0 (0.0%) |
| 18 to 34 Years | 0 (0.0%) | 9 (1.9%) |
| 35 to 64 Years | 116 (8.2%) | 26 (1.7%) |
| 65 to 74 Years | 103 (25.3%) | 41 (8.9%) |
| 75 Years and over | 83 (41.3%) | 19 (8.1%) |
Disability Class: Vision Difficulty
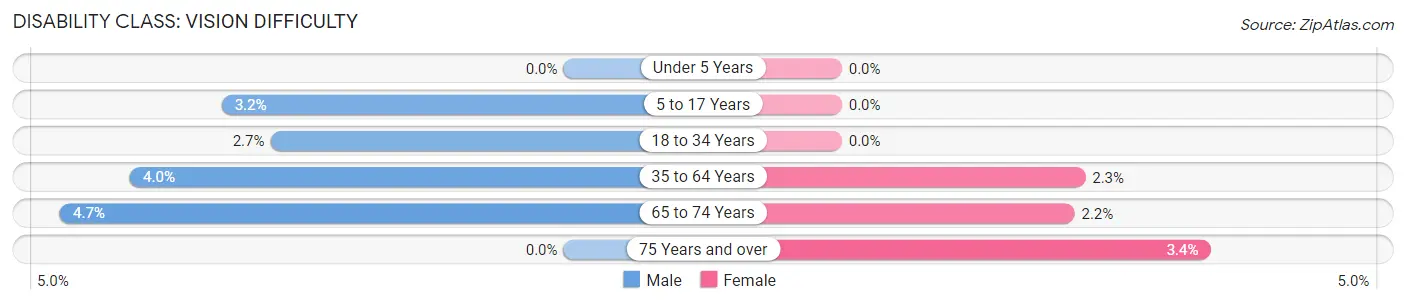
| Age Bracket | Male | Female |
| Under 5 Years | 0 (0.0%) | 0 (0.0%) |
| 5 to 17 Years | 22 (3.2%) | 0 (0.0%) |
| 18 to 34 Years | 16 (2.7%) | 0 (0.0%) |
| 35 to 64 Years | 57 (4.0%) | 34 (2.3%) |
| 65 to 74 Years | 19 (4.7%) | 10 (2.2%) |
| 75 Years and over | 0 (0.0%) | 8 (3.4%) |
Disability Class: Cognitive Difficulty
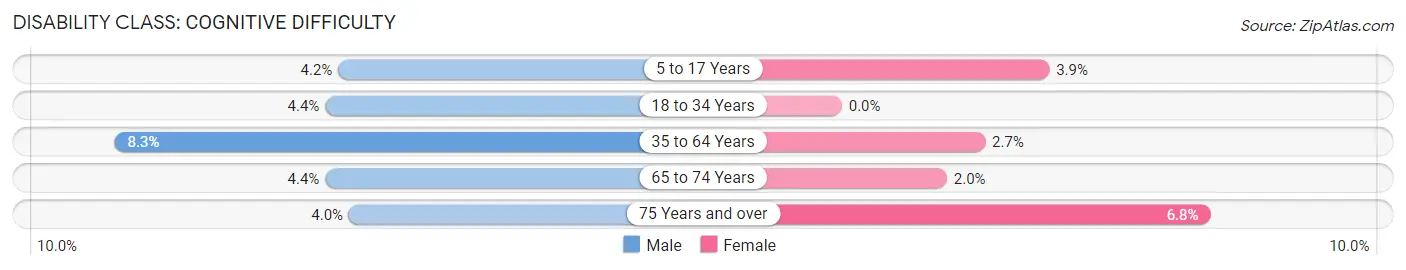
| Age Bracket | Male | Female |
| 5 to 17 Years | 29 (4.2%) | 28 (3.8%) |
| 18 to 34 Years | 26 (4.4%) | 0 (0.0%) |
| 35 to 64 Years | 118 (8.3%) | 40 (2.7%) |
| 65 to 74 Years | 18 (4.4%) | 9 (1.9%) |
| 75 Years and over | 8 (4.0%) | 16 (6.8%) |
Disability Class: Ambulatory Difficulty
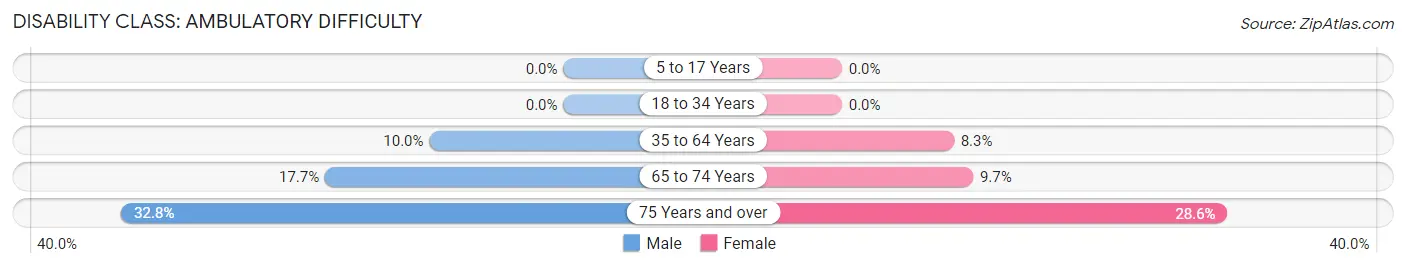
| Age Bracket | Male | Female |
| 5 to 17 Years | 0 (0.0%) | 0 (0.0%) |
| 18 to 34 Years | 0 (0.0%) | 0 (0.0%) |
| 35 to 64 Years | 141 (10.0%) | 125 (8.3%) |
| 65 to 74 Years | 72 (17.7%) | 45 (9.7%) |
| 75 Years and over | 66 (32.8%) | 67 (28.6%) |
Disability Class: Self-Care Difficulty
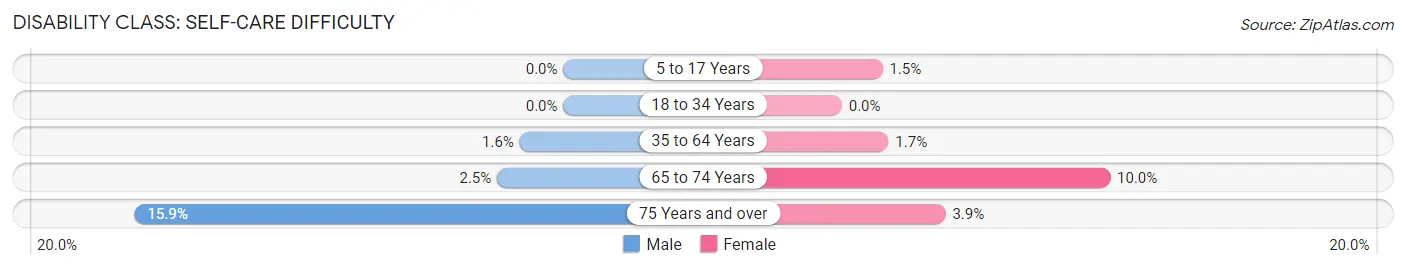
| Age Bracket | Male | Female |
| 5 to 17 Years | 0 (0.0%) | 11 (1.5%) |
| 18 to 34 Years | 0 (0.0%) | 0 (0.0%) |
| 35 to 64 Years | 23 (1.6%) | 26 (1.7%) |
| 65 to 74 Years | 10 (2.5%) | 46 (10.0%) |
| 75 Years and over | 32 (15.9%) | 9 (3.8%) |
Technology Access in Mead
Computing Device Access in Mead
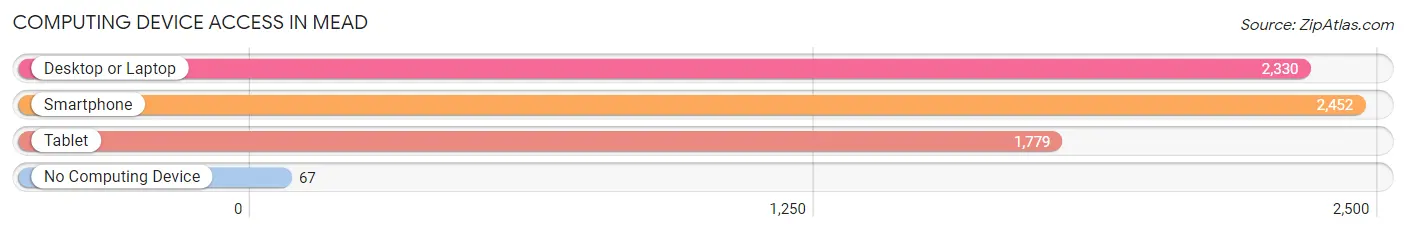
| Device Type | # Households | % Households |
| Desktop or Laptop | 2,330 | 89.6% |
| Smartphone | 2,452 | 94.3% |
| Tablet | 1,779 | 68.4% |
| No Computing Device | 67 | 2.6% |
| Total | 2,600 | 100.0% |
Internet Access in Mead
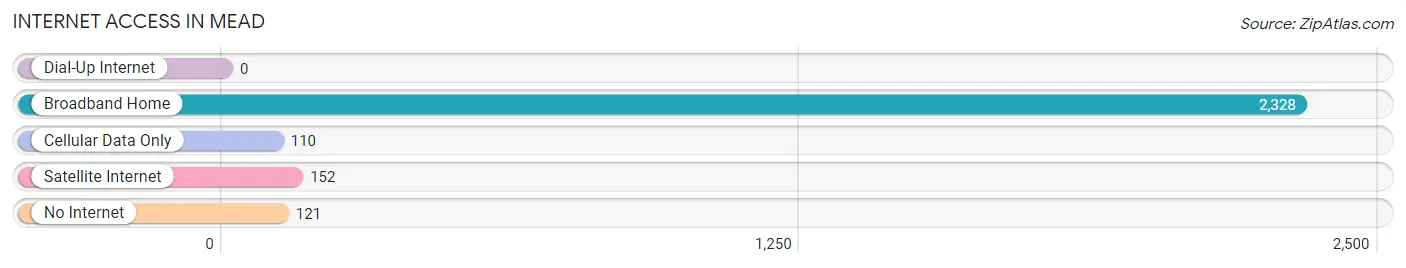
| Internet Type | # Households | % Households |
| Dial-Up Internet | 0 | 0.0% |
| Broadband Home | 2,328 | 89.5% |
| Cellular Data Only | 110 | 4.2% |
| Satellite Internet | 152 | 5.9% |
| No Internet | 121 | 4.6% |
| Total | 2,600 | 100.0% |
Mead Summary
Mead is a small town located in Spokane County, Washington, United States. It is situated on the Spokane River, approximately 20 miles northwest of Spokane. The town was founded in 1883 and was named after the nearby meadow. As of the 2010 census, the population of Mead was 5,314.
History
Mead was founded in 1883 by a group of settlers from the Midwest. The town was named after the nearby meadow, which was a popular spot for hunting and fishing. The first post office was established in 1884.
In the early 1900s, the town began to grow and develop. The Spokane and Inland Railway was built in 1902, connecting Mead to Spokane and other nearby towns. This allowed for the transportation of goods and people, and helped to spur economic growth in the area.
In the 1920s, the town experienced a period of rapid growth. The population increased from 500 in 1920 to 1,500 in 1930. This growth was due to the construction of the Spokane and Inland Railway, as well as the development of the nearby Spokane Valley.
In the 1950s, the town experienced a period of decline. The population decreased from 1,500 in 1950 to 1,200 in 1960. This decline was due to the closure of the Spokane and Inland Railway, as well as the development of the nearby Spokane Valley.
Geography
Mead is located in Spokane County, Washington, United States. It is situated on the Spokane River, approximately 20 miles northwest of Spokane. The town is located at an elevation of 1,845 feet above sea level.
The town is surrounded by rolling hills and is located in a valley. The climate is semi-arid, with hot summers and cold winters. The average annual precipitation is 16.5 inches.
Economy
Mead’s economy is largely based on agriculture and manufacturing. The town is home to several large farms, which produce a variety of crops, including wheat, barley, and hay. The town is also home to several manufacturing companies, which produce a variety of products, including furniture, clothing, and electronics.
The town is also home to several retail stores, restaurants, and other businesses. The town is served by the Spokane International Airport, which is located approximately 20 miles away.
Demographics
As of the 2010 census, the population of Mead was 5,314. The racial makeup of the town was 94.3% White, 0.7% African American, 0.7% Native American, 0.7% Asian, 0.2% Pacific Islander, and 2.6% from other races. The median household income was $50,945, and the median family income was $60,945.
Conclusion
Mead is a small town located in Spokane County, Washington, United States. It is situated on the Spokane River, approximately 20 miles northwest of Spokane. The town was founded in 1883 and was named after the nearby meadow. As of the 2010 census, the population of Mead was 5,314. The town’s economy is largely based on agriculture and manufacturing, and it is served by the Spokane International Airport. The racial makeup of the town was 94.3% White, 0.7% African American, 0.7% Native American, 0.7% Asian, 0.2% Pacific Islander, and 2.6% from other races. The median household income was $50,945, and the median family income was $60,945.
Common Questions
What is Per Capita Income in Mead?
Per Capita income in Mead is $35,129.
What is the Median Family Income in Mead?
Median Family Income in Mead is $93,671.
What is the Median Household income in Mead?
Median Household Income in Mead is $74,431.
What is Income or Wage Gap in Mead?
Income or Wage Gap in Mead is 37.9%.
Women in Mead earn 62.1 cents for every dollar earned by a man.
What is Inequality or Gini Index in Mead?
Inequality or Gini Index in Mead is 0.39.
What is the Total Population of Mead?
Total Population of Mead is 7,172.
What is the Total Male Population of Mead?
Total Male Population of Mead is 3,565.
What is the Total Female Population of Mead?
Total Female Population of Mead is 3,607.
What is the Ratio of Males per 100 Females in Mead?
There are 98.84 Males per 100 Females in Mead.
What is the Ratio of Females per 100 Males in Mead?
There are 101.18 Females per 100 Males in Mead.
What is the Median Population Age in Mead?
Median Population Age in Mead is 42.8 Years.
What is the Average Family Size in Mead
Average Family Size in Mead is 3.1 People.
What is the Average Household Size in Mead
Average Household Size in Mead is 2.8 People.
How Large is the Labor Force in Mead?
There are 3,307 People in the Labor Forcein in Mead.
What is the Percentage of People in the Labor Force in Mead?
57.8% of People are in the Labor Force in Mead.
What is the Unemployment Rate in Mead?
Unemployment Rate in Mead is 9.0%.