Mansfield, WA Map & Demographics
Mansfield Map
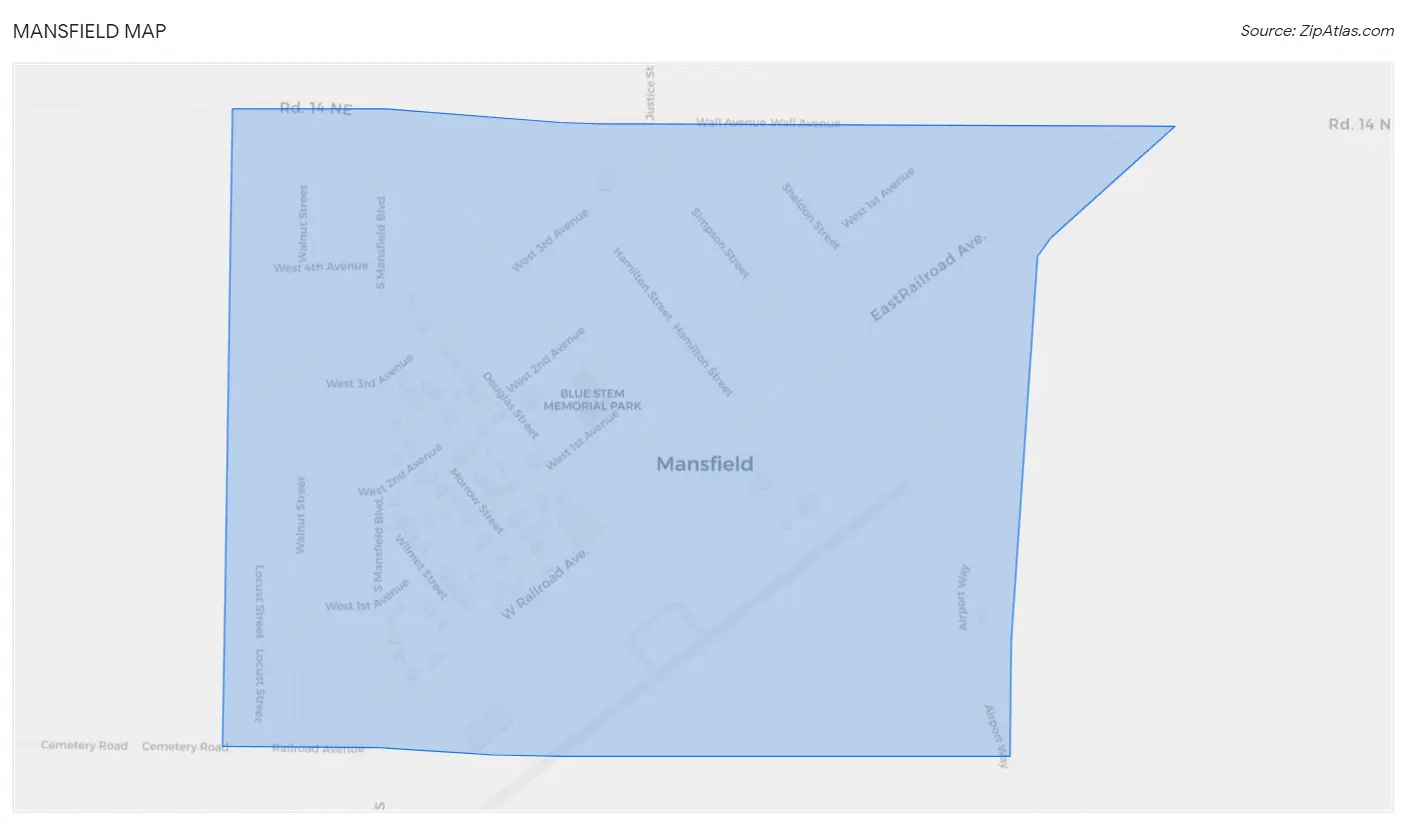
Mansfield Overview
$27,799
PER CAPITA INCOME
$59,792
AVG FAMILY INCOME
$43,000
AVG HOUSEHOLD INCOME
41.4%
WAGE / INCOME GAP [ % ]
58.6¢/ $1
WAGE / INCOME GAP [ $ ]
$14,545
FAMILY INCOME DEFICIT
0.43
INEQUALITY / GINI INDEX
324
TOTAL POPULATION
161
MALE POPULATION
163
FEMALE POPULATION
98.77
MALES / 100 FEMALES
101.24
FEMALES / 100 MALES
46.8
MEDIAN AGE
2.6
AVG FAMILY SIZE
2.1
AVG HOUSEHOLD SIZE
99
LABOR FORCE [ PEOPLE ]
37.4%
PERCENT IN LABOR FORCE
4.0%
UNEMPLOYMENT RATE
Mansfield Zip Codes
Mansfield Area Codes
Income in Mansfield
Income Overview in Mansfield
Per Capita Income in Mansfield is $27,799, while median incomes of families and households are $59,792 and $43,000 respectively.
| Characteristic | Number | Measure |
| Per Capita Income | 324 | $27,799 |
| Median Family Income | 99 | $59,792 |
| Mean Family Income | 99 | $67,845 |
| Median Household Income | 156 | $43,000 |
| Mean Household Income | 156 | $55,659 |
| Income Deficit | 99 | $14,545 |
| Wage / Income Gap (%) | 324 | 41.39% |
| Wage / Income Gap ($) | 324 | 58.61¢ per $1 |
| Gini / Inequality Index | 324 | 0.43 |
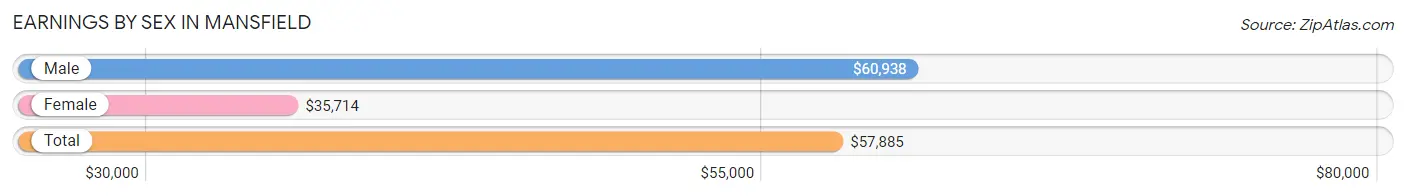
Earnings by Sex in Mansfield
Average Earnings in Mansfield are $57,885, $60,938 for men and $35,714 for women, a difference of 41.4%.
| Sex | Number | Average Earnings |
| Male | 56 (56.0%) | $60,938 |
| Female | 44 (44.0%) | $35,714 |
| Total | 100 (100.0%) | $57,885 |
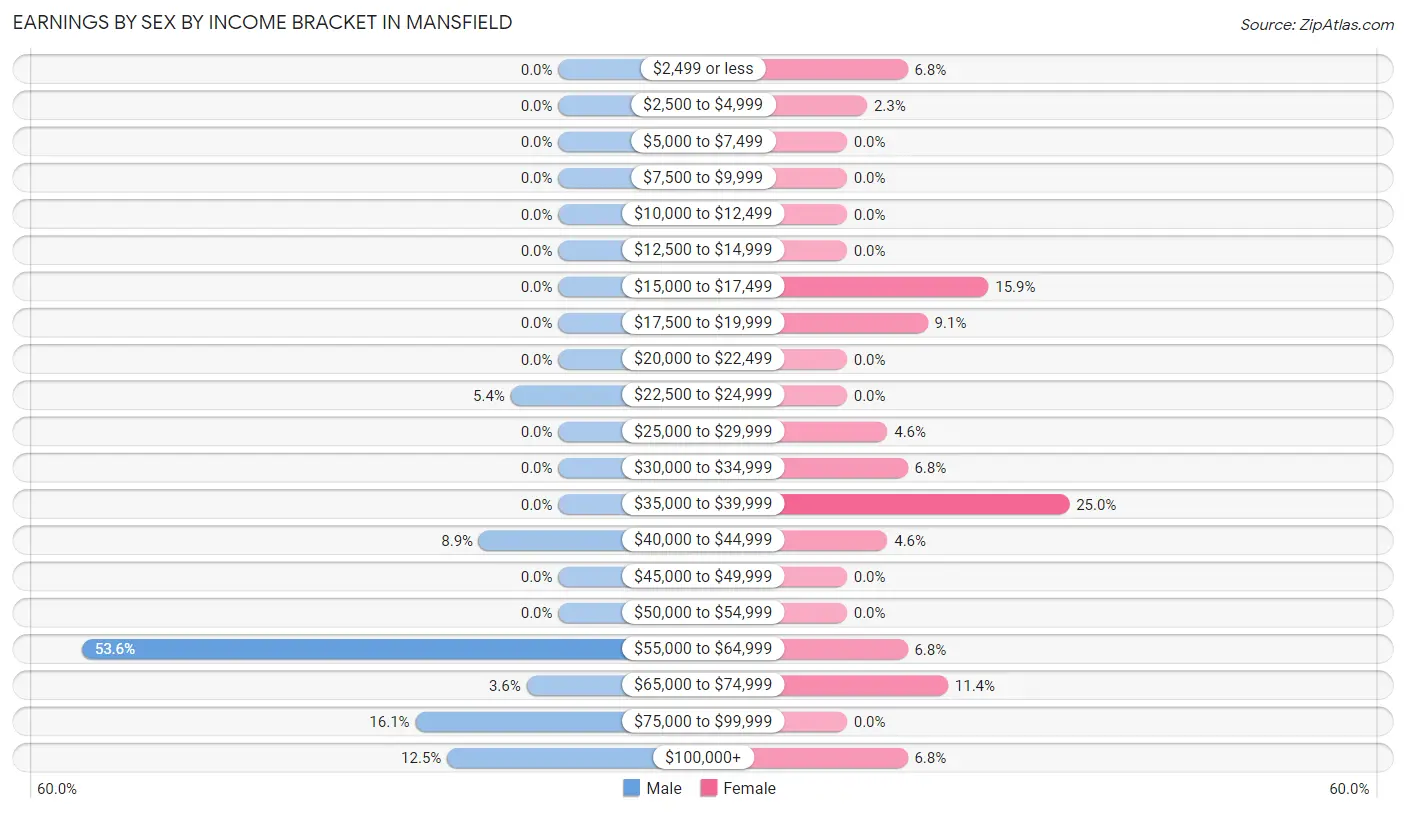
Earnings by Sex by Income Bracket in Mansfield
The most common earnings brackets in Mansfield are $55,000 to $64,999 for men (30 | 53.6%) and $35,000 to $39,999 for women (11 | 25.0%).
| Income | Male | Female |
| $2,499 or less | 0 (0.0%) | 3 (6.8%) |
| $2,500 to $4,999 | 0 (0.0%) | 1 (2.3%) |
| $5,000 to $7,499 | 0 (0.0%) | 0 (0.0%) |
| $7,500 to $9,999 | 0 (0.0%) | 0 (0.0%) |
| $10,000 to $12,499 | 0 (0.0%) | 0 (0.0%) |
| $12,500 to $14,999 | 0 (0.0%) | 0 (0.0%) |
| $15,000 to $17,499 | 0 (0.0%) | 7 (15.9%) |
| $17,500 to $19,999 | 0 (0.0%) | 4 (9.1%) |
| $20,000 to $22,499 | 0 (0.0%) | 0 (0.0%) |
| $22,500 to $24,999 | 3 (5.4%) | 0 (0.0%) |
| $25,000 to $29,999 | 0 (0.0%) | 2 (4.5%) |
| $30,000 to $34,999 | 0 (0.0%) | 3 (6.8%) |
| $35,000 to $39,999 | 0 (0.0%) | 11 (25.0%) |
| $40,000 to $44,999 | 5 (8.9%) | 2 (4.5%) |
| $45,000 to $49,999 | 0 (0.0%) | 0 (0.0%) |
| $50,000 to $54,999 | 0 (0.0%) | 0 (0.0%) |
| $55,000 to $64,999 | 30 (53.6%) | 3 (6.8%) |
| $65,000 to $74,999 | 2 (3.6%) | 5 (11.4%) |
| $75,000 to $99,999 | 9 (16.1%) | 0 (0.0%) |
| $100,000+ | 7 (12.5%) | 3 (6.8%) |
| Total | 56 (100.0%) | 44 (100.0%) |
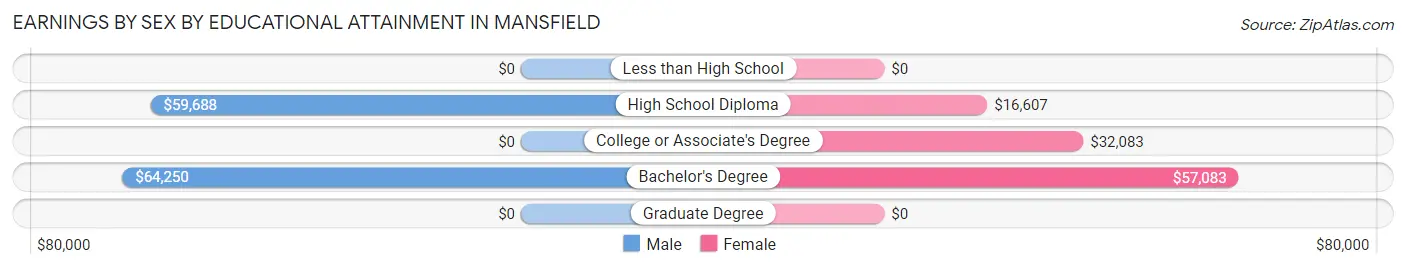
Earnings by Sex by Educational Attainment in Mansfield
Average earnings in Mansfield are $60,938 for men and $35,893 for women, a difference of 41.1%. Men with an educational attainment of bachelor's degree enjoy the highest average annual earnings of $64,250, while those with high school diploma education earn the least with $59,688. Women with an educational attainment of bachelor's degree earn the most with the average annual earnings of $57,083, while those with high school diploma education have the smallest earnings of $16,607.
| Educational Attainment | Male Income | Female Income |
| Less than High School | - | - |
| High School Diploma | $59,688 | $16,607 |
| College or Associate's Degree | - | - |
| Bachelor's Degree | $64,250 | $57,083 |
| Graduate Degree | - | - |
| Total | $60,938 | $35,893 |
Family Income in Mansfield
Family Income Brackets in Mansfield
According to the Mansfield family income data, there are 23 families falling into the $75,000 to $99,999 income range, which is the most common income bracket and makes up 23.2% of all families.
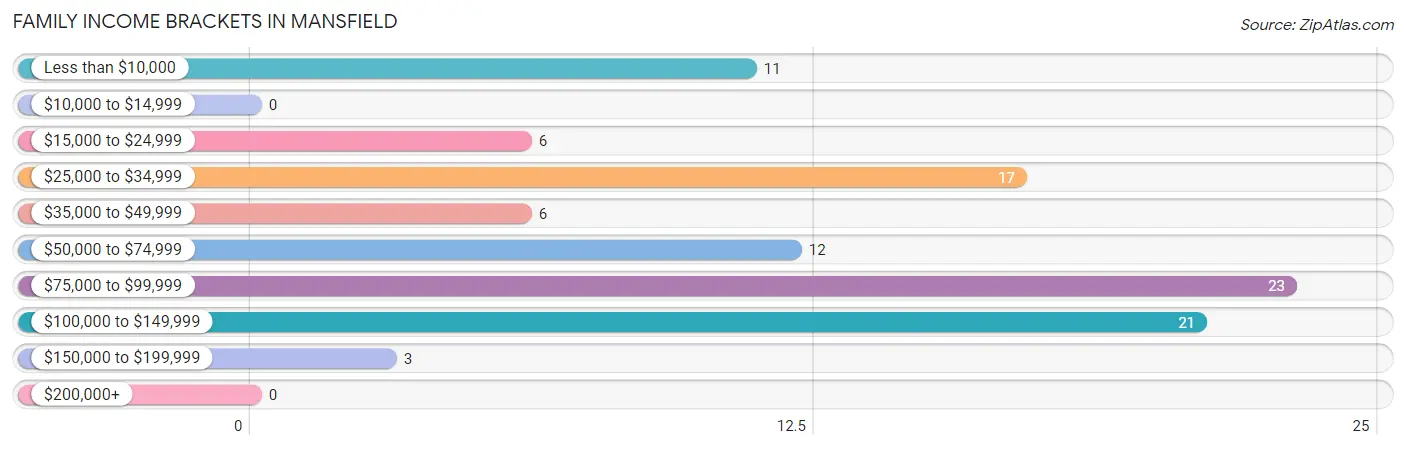
| Income Bracket | # Families | % Families |
| Less than $10,000 | 11 | 11.1% |
| $10,000 to $14,999 | 0 | 0.0% |
| $15,000 to $24,999 | 6 | 6.1% |
| $25,000 to $34,999 | 17 | 17.2% |
| $35,000 to $49,999 | 6 | 6.1% |
| $50,000 to $74,999 | 12 | 12.1% |
| $75,000 to $99,999 | 23 | 23.2% |
| $100,000 to $149,999 | 21 | 21.2% |
| $150,000 to $199,999 | 3 | 3.0% |
| $200,000+ | 0 | 0.0% |
Family Income by Famaliy Size in Mansfield
4-person families (8 | 8.1%) account for the highest median family income in Mansfield with $77,500 per family, while 3-person families (8 | 8.1%) have the highest median income of $19,583 per family member.
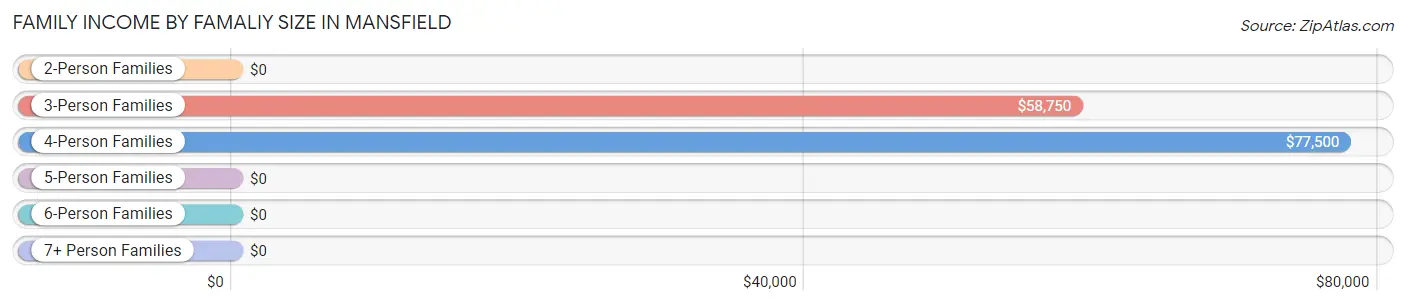
| Income Bracket | # Families | Median Income |
| 2-Person Families | 75 (75.8%) | $0 |
| 3-Person Families | 8 (8.1%) | $58,750 |
| 4-Person Families | 8 (8.1%) | $77,500 |
| 5-Person Families | 4 (4.0%) | $0 |
| 6-Person Families | 4 (4.0%) | $0 |
| 7+ Person Families | 0 (0.0%) | $0 |
| Total | 99 (100.0%) | $59,792 |
Family Income by Number of Earners in Mansfield
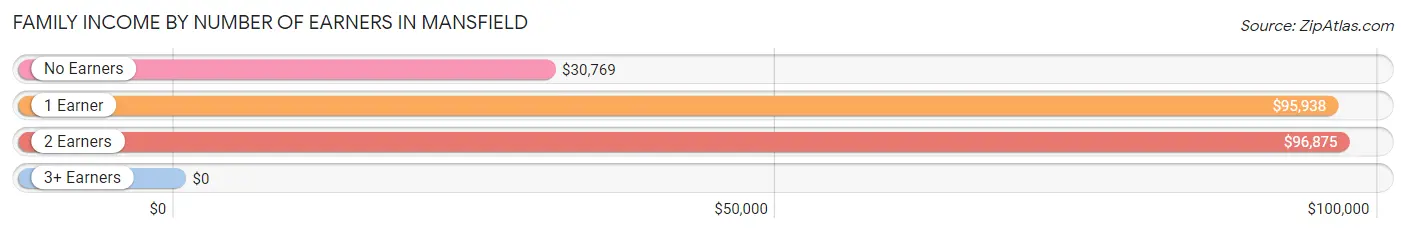
| Number of Earners | # Families | Median Income |
| No Earners | 48 (48.5%) | $30,769 |
| 1 Earner | 29 (29.3%) | $95,938 |
| 2 Earners | 20 (20.2%) | $96,875 |
| 3+ Earners | 2 (2.0%) | $0 |
| Total | 99 (100.0%) | $59,792 |
Household Income in Mansfield
Household Income Brackets in Mansfield
With 32 households falling in the category, the $75,000 to $99,999 income range is the most frequent in Mansfield, accounting for 20.5% of all households.
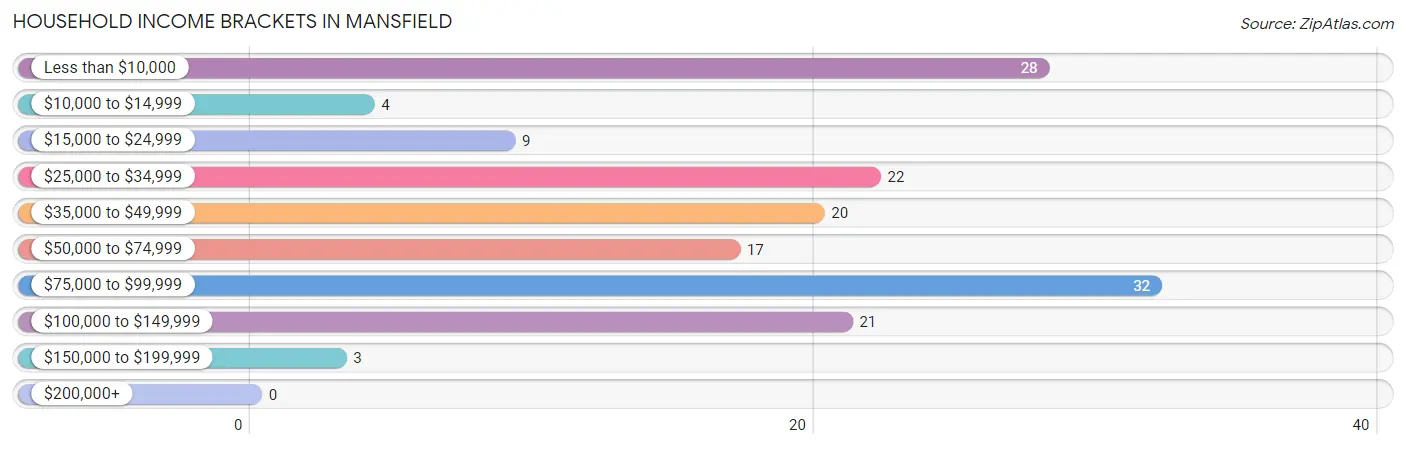
| Income Bracket | # Households | % Households |
| Less than $10,000 | 28 | 17.9% |
| $10,000 to $14,999 | 4 | 2.6% |
| $15,000 to $24,999 | 9 | 5.8% |
| $25,000 to $34,999 | 22 | 14.1% |
| $35,000 to $49,999 | 20 | 12.8% |
| $50,000 to $74,999 | 17 | 10.9% |
| $75,000 to $99,999 | 32 | 20.5% |
| $100,000 to $149,999 | 21 | 13.5% |
| $150,000 to $199,999 | 3 | 1.9% |
| $200,000+ | 0 | 0.0% |
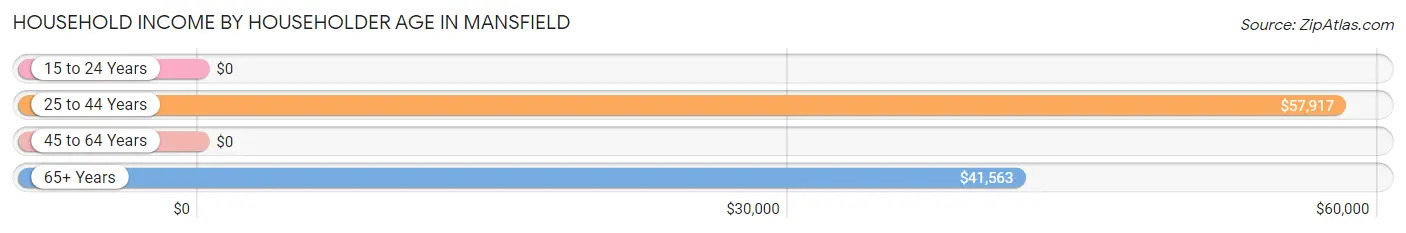
Household Income by Householder Age in Mansfield
The median household income in Mansfield is $43,000, with the highest median household income of $57,917 found in the 25 to 44 years age bracket for the primary householder. A total of 52 households (33.3%) fall into this category.
| Income Bracket | # Households | Median Income |
| 15 to 24 Years | 0 (0.0%) | $0 |
| 25 to 44 Years | 52 (33.3%) | $57,917 |
| 45 to 64 Years | 37 (23.7%) | $0 |
| 65+ Years | 67 (42.9%) | $41,563 |
| Total | 156 (100.0%) | $43,000 |
Poverty in Mansfield
Income Below Poverty by Sex and Age in Mansfield
With 7.4% poverty level for males and 23.3% for females among the residents of Mansfield, 6 to 11 year old males and 45 to 54 year old females are the most vulnerable to poverty, with 8 males (26.7%) and 10 females (58.8%) in their respective age groups living below the poverty level.
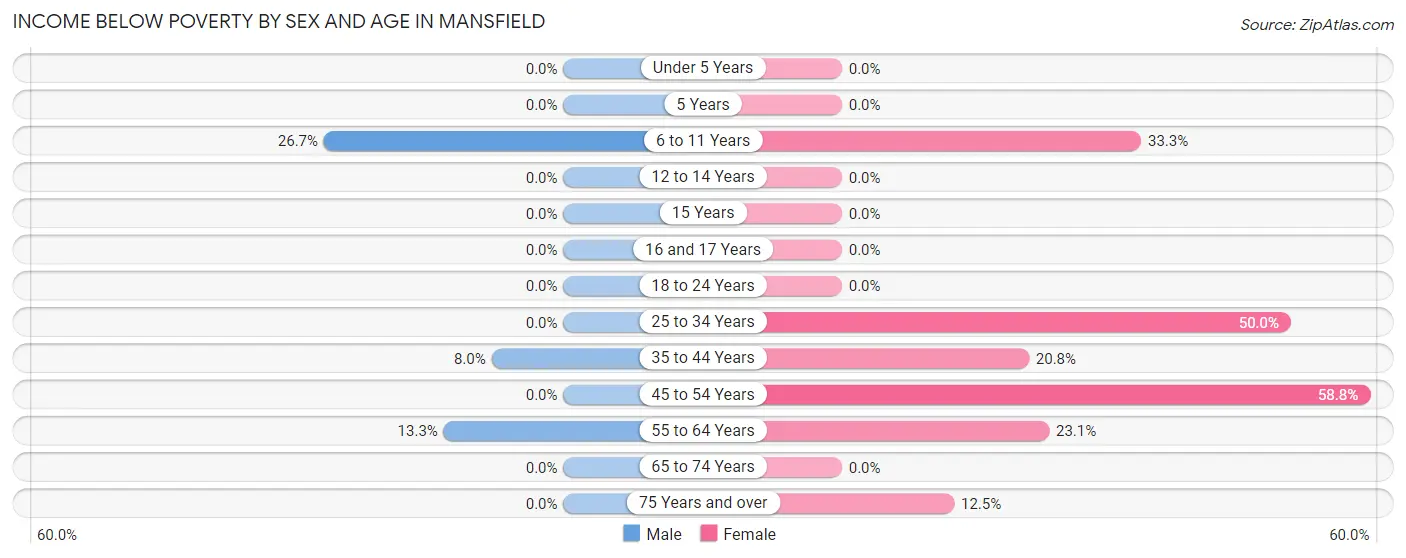
| Age Bracket | Male | Female |
| Under 5 Years | 0 (0.0%) | 0 (0.0%) |
| 5 Years | 0 (0.0%) | 0 (0.0%) |
| 6 to 11 Years | 8 (26.7%) | 3 (33.3%) |
| 12 to 14 Years | 0 (0.0%) | 0 (0.0%) |
| 15 Years | 0 (0.0%) | 0 (0.0%) |
| 16 and 17 Years | 0 (0.0%) | 0 (0.0%) |
| 18 to 24 Years | 0 (0.0%) | 0 (0.0%) |
| 25 to 34 Years | 0 (0.0%) | 10 (50.0%) |
| 35 to 44 Years | 2 (8.0%) | 5 (20.8%) |
| 45 to 54 Years | 0 (0.0%) | 10 (58.8%) |
| 55 to 64 Years | 2 (13.3%) | 6 (23.1%) |
| 65 to 74 Years | 0 (0.0%) | 0 (0.0%) |
| 75 Years and over | 0 (0.0%) | 4 (12.5%) |
| Total | 12 (7.4%) | 38 (23.3%) |
Income Above Poverty by Sex and Age in Mansfield
According to the poverty statistics in Mansfield, males aged under 5 years and females aged under 5 years are the age groups that are most secure financially, with 100.0% of males and 100.0% of females in these age groups living above the poverty line.
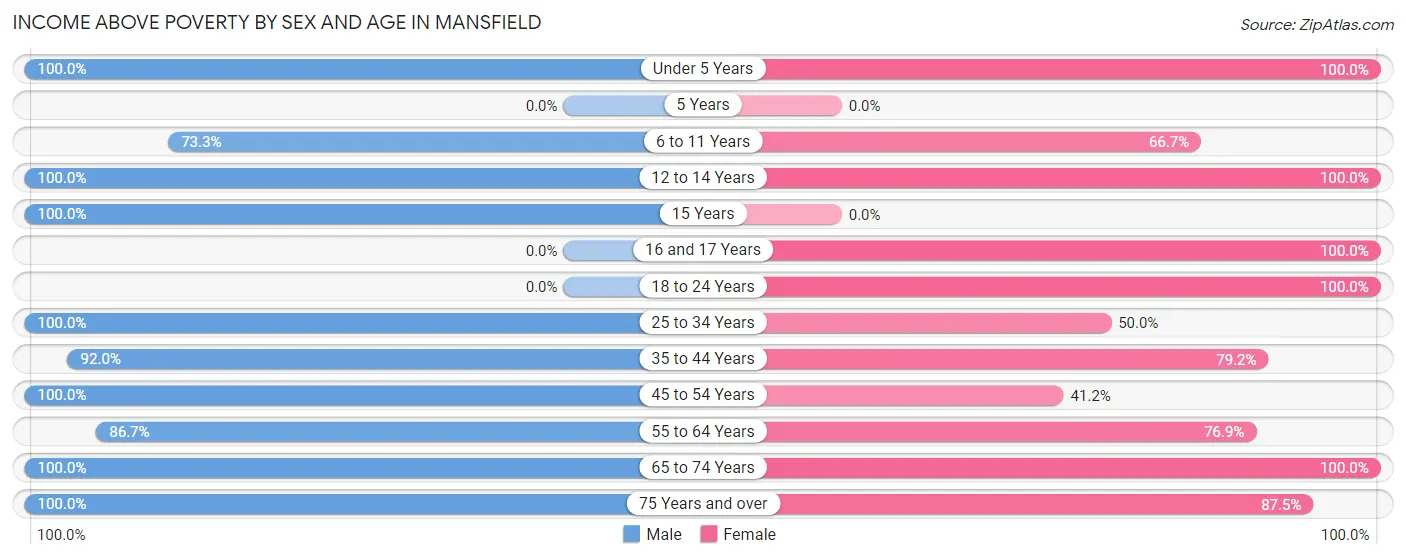
| Age Bracket | Male | Female |
| Under 5 Years | 1 (100.0%) | 3 (100.0%) |
| 5 Years | 0 (0.0%) | 0 (0.0%) |
| 6 to 11 Years | 22 (73.3%) | 6 (66.7%) |
| 12 to 14 Years | 5 (100.0%) | 10 (100.0%) |
| 15 Years | 1 (100.0%) | 0 (0.0%) |
| 16 and 17 Years | 0 (0.0%) | 5 (100.0%) |
| 18 to 24 Years | 0 (0.0%) | 3 (100.0%) |
| 25 to 34 Years | 13 (100.0%) | 10 (50.0%) |
| 35 to 44 Years | 23 (92.0%) | 19 (79.2%) |
| 45 to 54 Years | 3 (100.0%) | 7 (41.2%) |
| 55 to 64 Years | 13 (86.7%) | 20 (76.9%) |
| 65 to 74 Years | 27 (100.0%) | 14 (100.0%) |
| 75 Years and over | 41 (100.0%) | 28 (87.5%) |
| Total | 149 (92.5%) | 125 (76.7%) |
Income Below Poverty Among Married-Couple Families in Mansfield
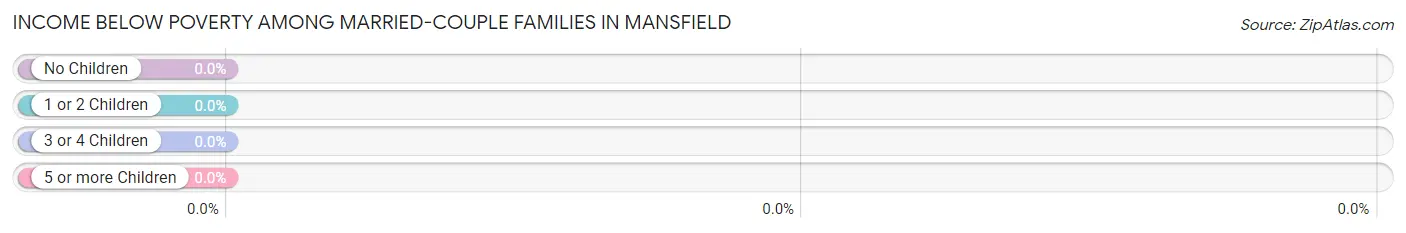
| Children | Above Poverty | Below Poverty |
| No Children | 61 (100.0%) | 0 (0.0%) |
| 1 or 2 Children | 8 (100.0%) | 0 (0.0%) |
| 3 or 4 Children | 8 (100.0%) | 0 (0.0%) |
| 5 or more Children | 0 (0.0%) | 0 (0.0%) |
| Total | 77 (100.0%) | 0 (0.0%) |
Income Below Poverty Among Single-Parent Households in Mansfield
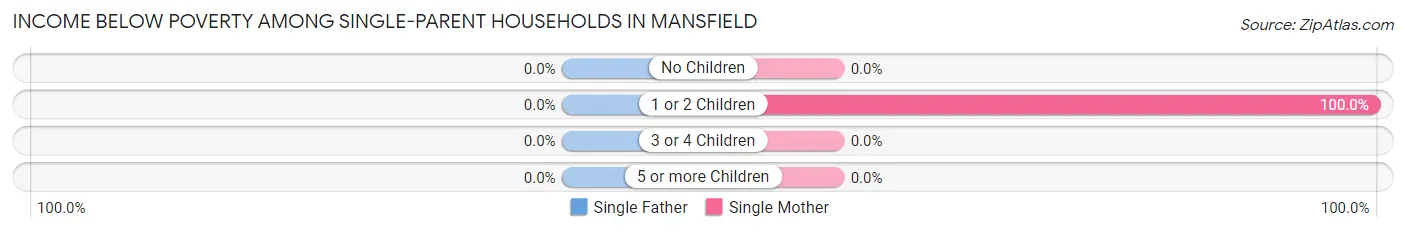
| Children | Single Father | Single Mother |
| No Children | 0 (0.0%) | 0 (0.0%) |
| 1 or 2 Children | 0 (0.0%) | 11 (100.0%) |
| 3 or 4 Children | 0 (0.0%) | 0 (0.0%) |
| 5 or more Children | 0 (0.0%) | 0 (0.0%) |
| Total | 0 (0.0%) | 11 (100.0%) |
Income Below Poverty Among Married-Couple vs Single-Parent Households in Mansfield
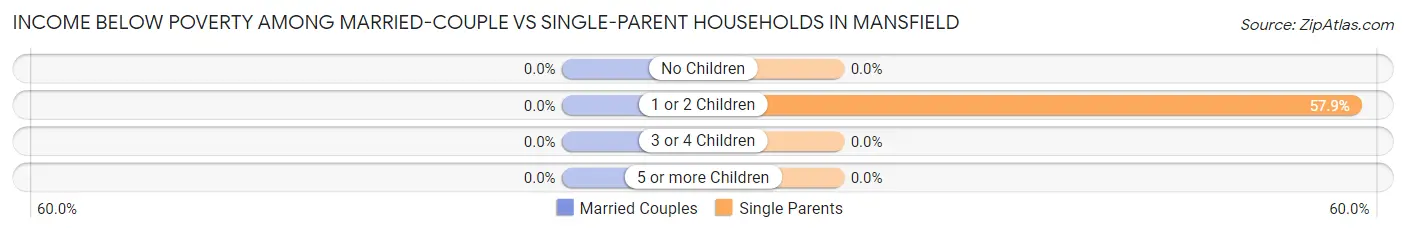
| Children | Married-Couple Families | Single-Parent Households |
| No Children | 0 (0.0%) | 0 (0.0%) |
| 1 or 2 Children | 0 (0.0%) | 11 (57.9%) |
| 3 or 4 Children | 0 (0.0%) | 0 (0.0%) |
| 5 or more Children | 0 (0.0%) | 0 (0.0%) |
| Total | 0 (0.0%) | 11 (50.0%) |
Race in Mansfield
The most populous races in Mansfield are White / Caucasian (300 | 92.6%), Hispanic or Latino (37 | 11.4%), and Some other Race (14 | 4.3%).
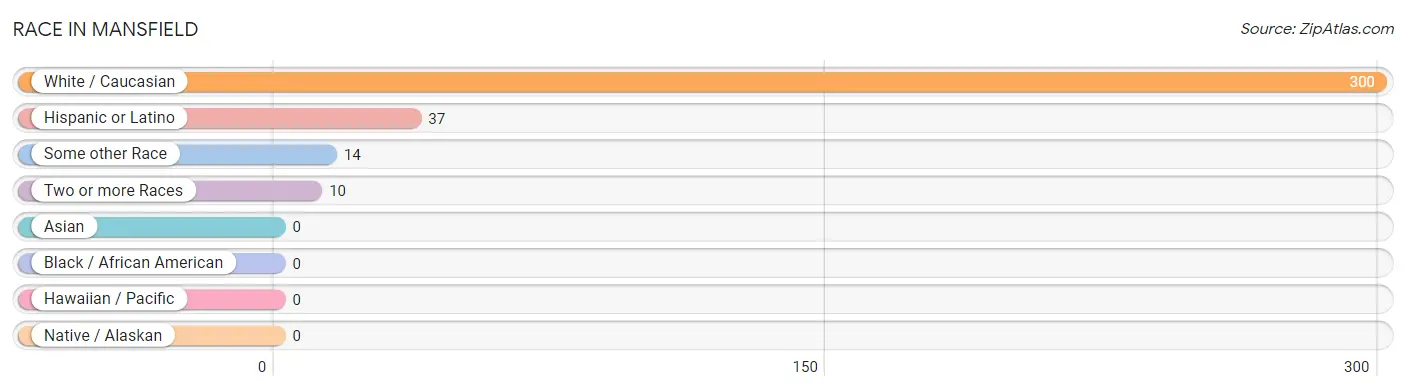
| Race | # Population | % Population |
| Asian | 0 | 0.0% |
| Black / African American | 0 | 0.0% |
| Hawaiian / Pacific | 0 | 0.0% |
| Hispanic or Latino | 37 | 11.4% |
| Native / Alaskan | 0 | 0.0% |
| White / Caucasian | 300 | 92.6% |
| Two or more Races | 10 | 3.1% |
| Some other Race | 14 | 4.3% |
| Total | 324 | 100.0% |
Ancestry in Mansfield
The most populous ancestries reported in Mansfield are German (55 | 17.0%), English (41 | 12.7%), Mexican (34 | 10.5%), Norwegian (34 | 10.5%), and Irish (32 | 9.9%), together accounting for 60.5% of all Mansfield residents.
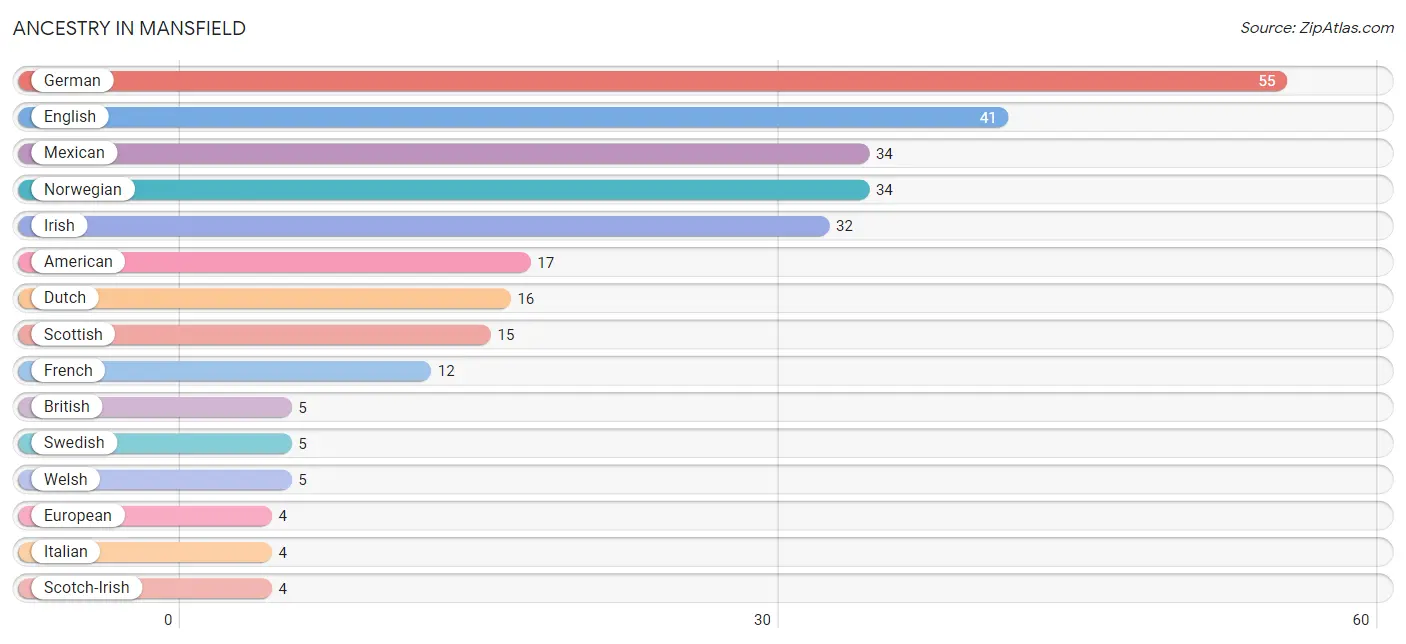
| Ancestry | # Population | % Population |
| American | 17 | 5.2% |
| British | 5 | 1.5% |
| Dutch | 16 | 4.9% |
| English | 41 | 12.7% |
| European | 4 | 1.2% |
| Finnish | 1 | 0.3% |
| French | 12 | 3.7% |
| German | 55 | 17.0% |
| Irish | 32 | 9.9% |
| Italian | 4 | 1.2% |
| Mexican | 34 | 10.5% |
| Norwegian | 34 | 10.5% |
| Scotch-Irish | 4 | 1.2% |
| Scottish | 15 | 4.6% |
| Swedish | 5 | 1.5% |
| Welsh | 5 | 1.5% | View All 16 Rows |
Immigrants in Mansfield
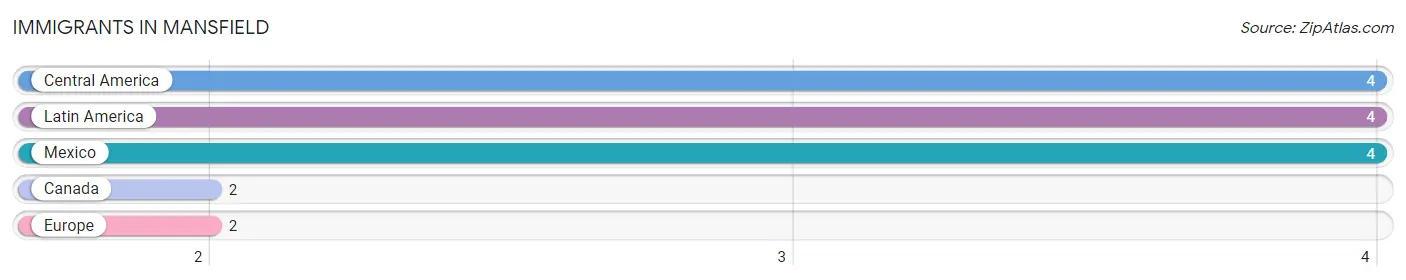
The most numerous immigrant groups reported in Mansfield came from Central America (4 | 1.2%), Latin America (4 | 1.2%), Mexico (4 | 1.2%), Canada (2 | 0.6%), and Europe (2 | 0.6%), together accounting for 4.9% of all Mansfield residents.
| Immigration Origin | # Population | % Population |
| Canada | 2 | 0.6% |
| Central America | 4 | 1.2% |
| Europe | 2 | 0.6% |
| Latin America | 4 | 1.2% |
| Mexico | 4 | 1.2% | View All 5 Rows |
Sex and Age in Mansfield
Sex and Age in Mansfield
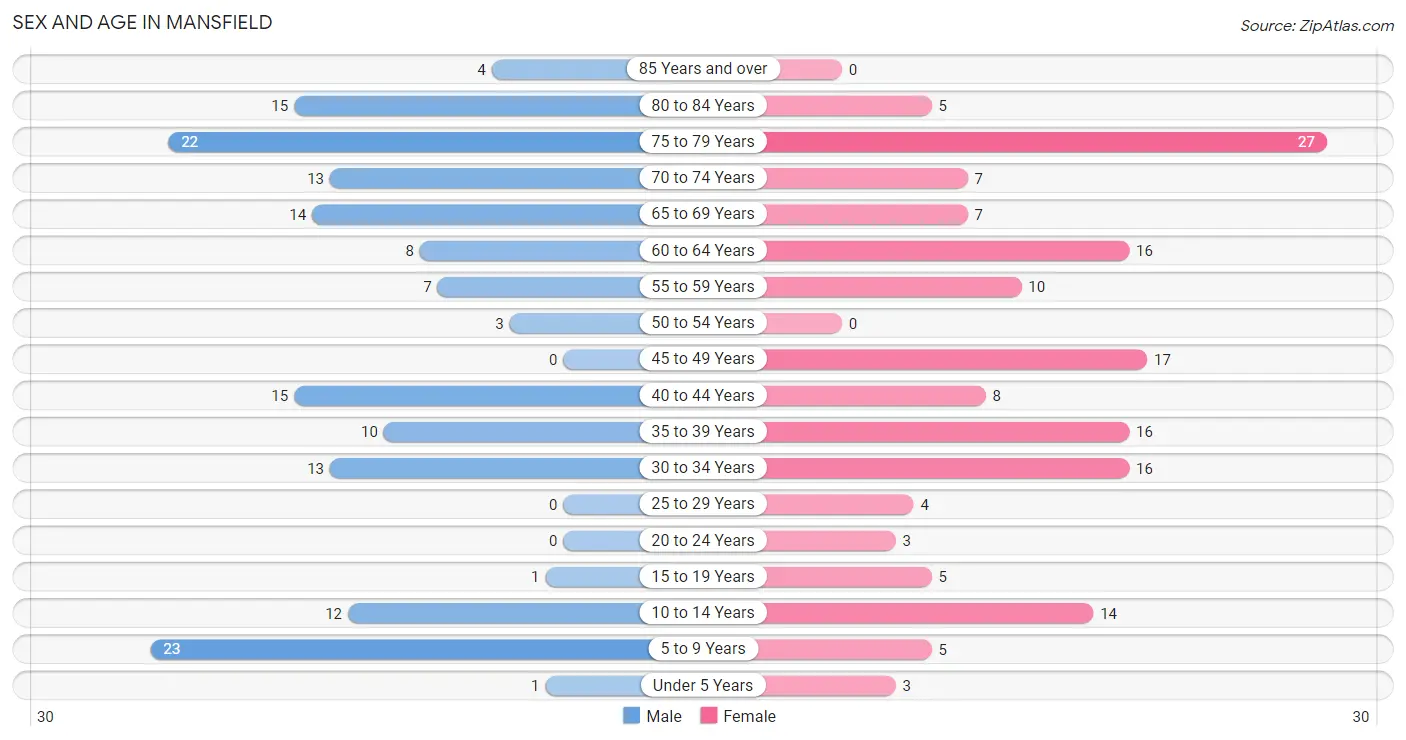
The most populous age groups in Mansfield are 5 to 9 Years (23 | 14.3%) for men and 75 to 79 Years (27 | 16.6%) for women.
| Age Bracket | Male | Female |
| Under 5 Years | 1 (0.6%) | 3 (1.8%) |
| 5 to 9 Years | 23 (14.3%) | 5 (3.1%) |
| 10 to 14 Years | 12 (7.4%) | 14 (8.6%) |
| 15 to 19 Years | 1 (0.6%) | 5 (3.1%) |
| 20 to 24 Years | 0 (0.0%) | 3 (1.8%) |
| 25 to 29 Years | 0 (0.0%) | 4 (2.5%) |
| 30 to 34 Years | 13 (8.1%) | 16 (9.8%) |
| 35 to 39 Years | 10 (6.2%) | 16 (9.8%) |
| 40 to 44 Years | 15 (9.3%) | 8 (4.9%) |
| 45 to 49 Years | 0 (0.0%) | 17 (10.4%) |
| 50 to 54 Years | 3 (1.9%) | 0 (0.0%) |
| 55 to 59 Years | 7 (4.3%) | 10 (6.1%) |
| 60 to 64 Years | 8 (5.0%) | 16 (9.8%) |
| 65 to 69 Years | 14 (8.7%) | 7 (4.3%) |
| 70 to 74 Years | 13 (8.1%) | 7 (4.3%) |
| 75 to 79 Years | 22 (13.7%) | 27 (16.6%) |
| 80 to 84 Years | 15 (9.3%) | 5 (3.1%) |
| 85 Years and over | 4 (2.5%) | 0 (0.0%) |
| Total | 161 (100.0%) | 163 (100.0%) |
Families and Households in Mansfield
Median Family Size in Mansfield
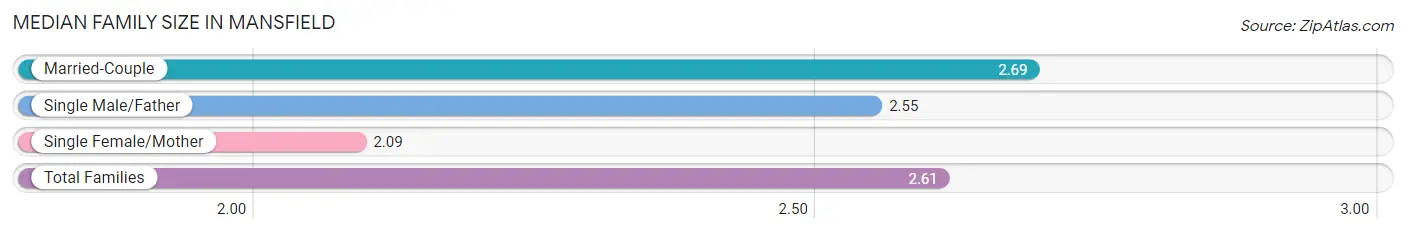
The median family size in Mansfield is 2.61 persons per family, with married-couple families (77 | 77.8%) accounting for the largest median family size of 2.69 persons per family. On the other hand, single female/mother families (11 | 11.1%) represent the smallest median family size with 2.09 persons per family.
| Family Type | # Families | Family Size |
| Married-Couple | 77 (77.8%) | 2.69 |
| Single Male/Father | 11 (11.1%) | 2.55 |
| Single Female/Mother | 11 (11.1%) | 2.09 |
| Total Families | 99 (100.0%) | 2.61 |
Median Household Size in Mansfield
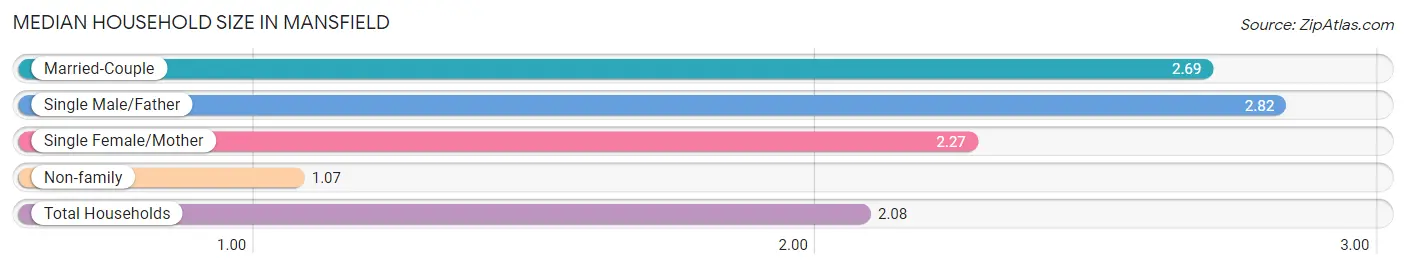
The median household size in Mansfield is 2.08 persons per household, with single male/father households (11 | 7.0%) accounting for the largest median household size of 2.82 persons per household. non-family households (57 | 36.5%) represent the smallest median household size with 1.07 persons per household.
| Household Type | # Households | Household Size |
| Married-Couple | 77 (49.4%) | 2.69 |
| Single Male/Father | 11 (7.0%) | 2.82 |
| Single Female/Mother | 11 (7.0%) | 2.27 |
| Non-family | 57 (36.5%) | 1.07 |
| Total Households | 156 (100.0%) | 2.08 |
Household Size by Marriage Status in Mansfield
Out of a total of 156 households in Mansfield, 99 (63.5%) are family households, while 57 (36.5%) are nonfamily households. The most numerous type of family households are 2-person households, comprising 71, and the most common type of nonfamily households are 1-person households, comprising 52.
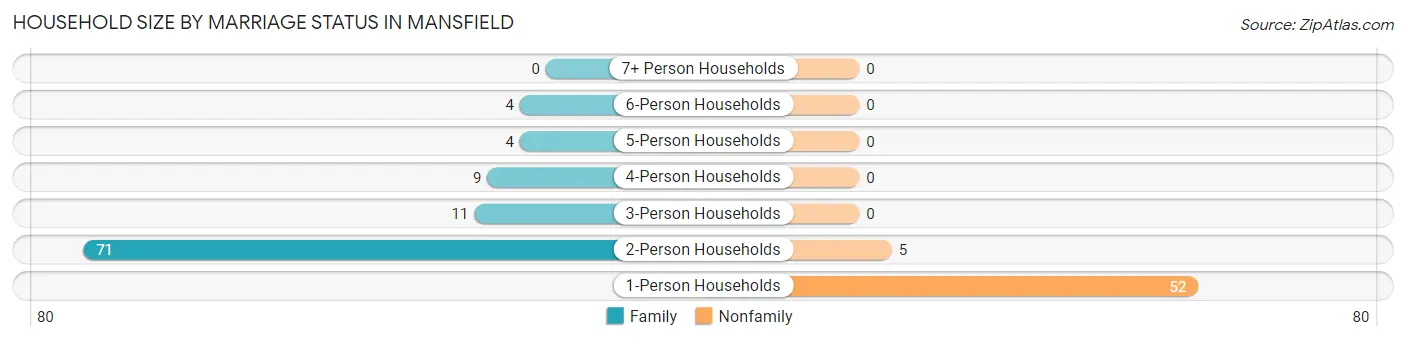
| Household Size | Family Households | Nonfamily Households |
| 1-Person Households | - | 52 (33.3%) |
| 2-Person Households | 71 (45.5%) | 5 (3.2%) |
| 3-Person Households | 11 (7.0%) | 0 (0.0%) |
| 4-Person Households | 9 (5.8%) | 0 (0.0%) |
| 5-Person Households | 4 (2.6%) | 0 (0.0%) |
| 6-Person Households | 4 (2.6%) | 0 (0.0%) |
| 7+ Person Households | 0 (0.0%) | 0 (0.0%) |
| Total | 99 (63.5%) | 57 (36.5%) |
Female Fertility in Mansfield
Fertility by Age in Mansfield
Average fertility rate in Mansfield is 43.0 births per 1,000 women. Women in the age bracket of 20 to 34 years have the highest fertility rate with 130.0 births per 1,000 women. Women in the age bracket of 20 to 34 years acount for 100.0% of all women with births.
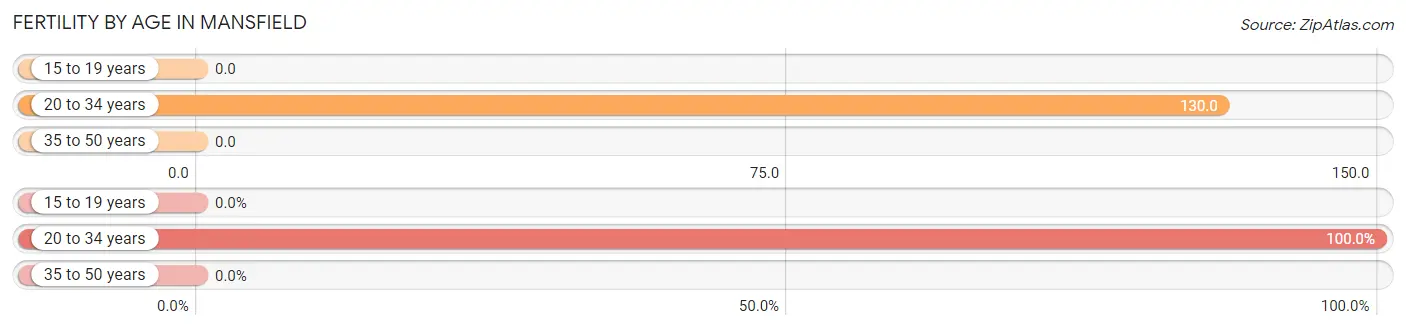
| Age Bracket | Women with Births | Births / 1,000 Women |
| 15 to 19 years | 0 (0.0%) | 0.0 |
| 20 to 34 years | 3 (100.0%) | 130.0 |
| 35 to 50 years | 0 (0.0%) | 0.0 |
| Total | 3 (100.0%) | 43.0 |
Fertility by Age by Marriage Status in Mansfield
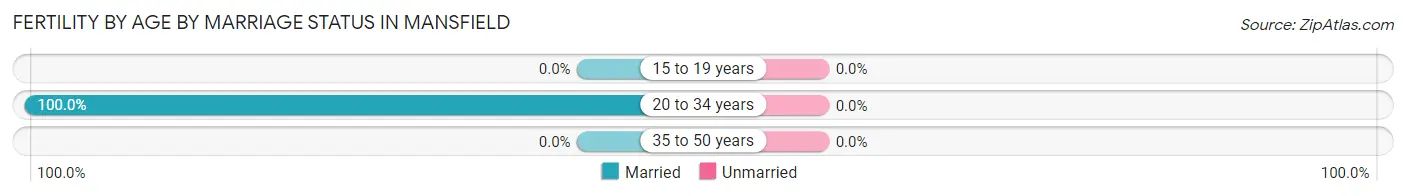
| Age Bracket | Married | Unmarried |
| 15 to 19 years | 0 (0.0%) | 0 (0.0%) |
| 20 to 34 years | 3 (100.0%) | 0 (0.0%) |
| 35 to 50 years | 0 (0.0%) | 0 (0.0%) |
| Total | 3 (100.0%) | 0 (0.0%) |
Fertility by Education in Mansfield
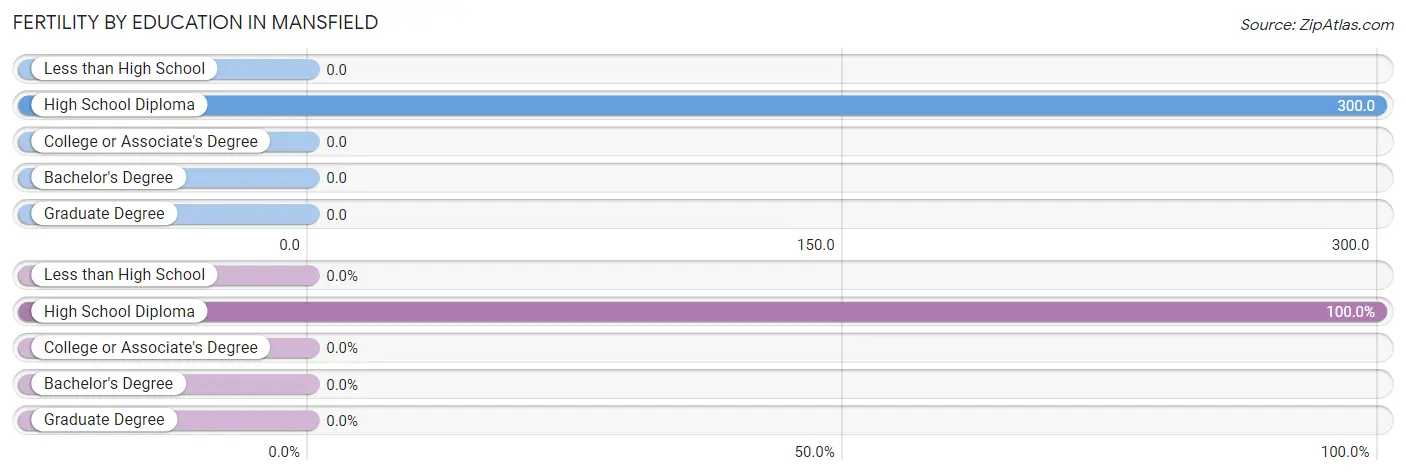
| Educational Attainment | Women with Births | Births / 1,000 Women |
| Less than High School | 0 (0.0%) | 0.0 |
| High School Diploma | 3 (100.0%) | 300.0 |
| College or Associate's Degree | 0 (0.0%) | 0.0 |
| Bachelor's Degree | 0 (0.0%) | 0.0 |
| Graduate Degree | 0 (0.0%) | 0.0 |
| Total | 3 (100.0%) | 43.0 |
Fertility by Education by Marriage Status in Mansfield
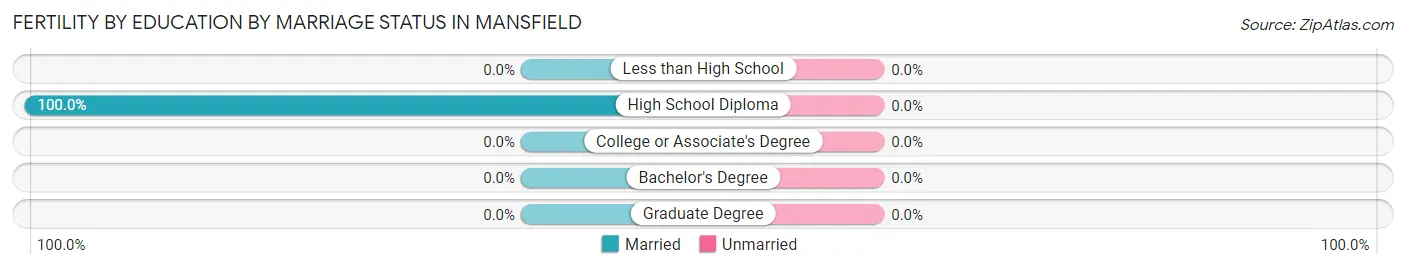
| Educational Attainment | Married | Unmarried |
| Less than High School | 0 (0.0%) | 0 (0.0%) |
| High School Diploma | 3 (100.0%) | 0 (0.0%) |
| College or Associate's Degree | 0 (0.0%) | 0 (0.0%) |
| Bachelor's Degree | 0 (0.0%) | 0 (0.0%) |
| Graduate Degree | 0 (0.0%) | 0 (0.0%) |
| Total | 3 (100.0%) | 0 (0.0%) |
Employment Characteristics in Mansfield
Employment by Class of Employer in Mansfield
Among the 95 employed individuals in Mansfield, local government employees (44 | 46.3%), private company employees (32 | 33.7%), and self-employed (not incorporated) (8 | 8.4%) make up the most common classes of employment.
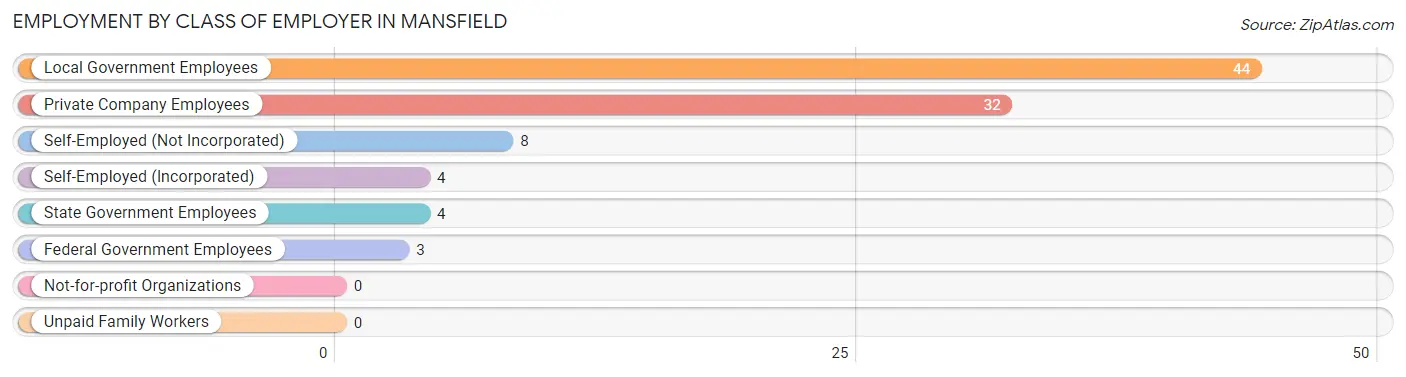
| Employer Class | # Employees | % Employees |
| Private Company Employees | 32 | 33.7% |
| Self-Employed (Incorporated) | 4 | 4.2% |
| Self-Employed (Not Incorporated) | 8 | 8.4% |
| Not-for-profit Organizations | 0 | 0.0% |
| Local Government Employees | 44 | 46.3% |
| State Government Employees | 4 | 4.2% |
| Federal Government Employees | 3 | 3.2% |
| Unpaid Family Workers | 0 | 0.0% |
| Total | 95 | 100.0% |
Employment Status by Age in Mansfield
According to the labor force statistics for Mansfield, out of the total population over 16 years of age (265), 37.4% or 99 individuals are in the labor force, with 4.0% or 4 of them unemployed. The age group with the highest labor force participation rate is 55 to 59 years, with 100.0% or 17 individuals in the labor force. Within the labor force, the 65 to 74 years age range has the highest percentage of unemployed individuals, with 30.8% or 4 of them being unemployed.
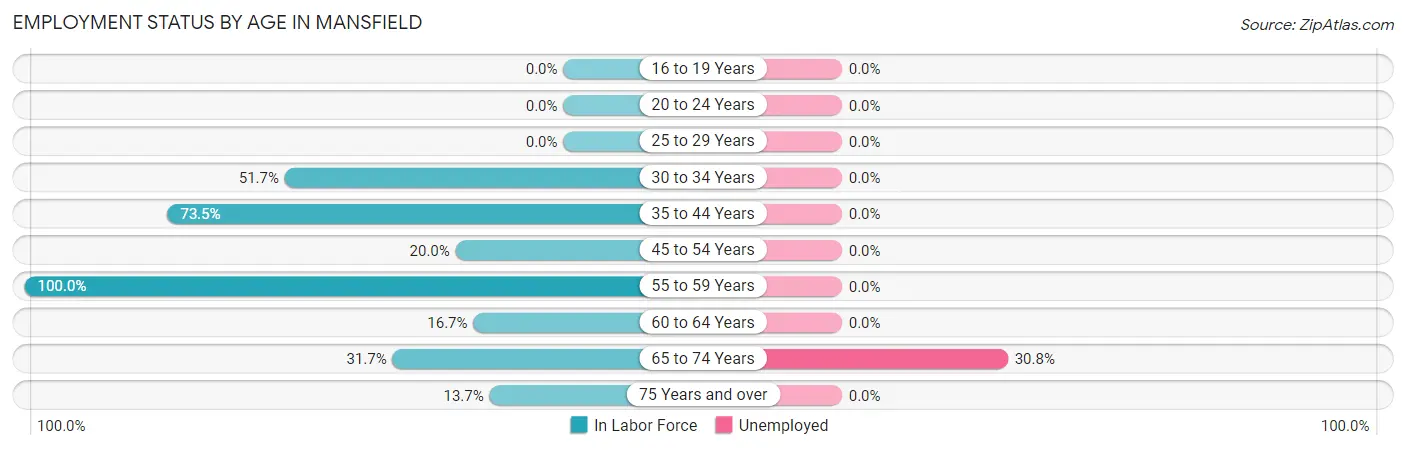
| Age Bracket | In Labor Force | Unemployed |
| 16 to 19 Years | 0 (0.0%) | 0 (0.0%) |
| 20 to 24 Years | 0 (0.0%) | 0 (0.0%) |
| 25 to 29 Years | 0 (0.0%) | 0 (0.0%) |
| 30 to 34 Years | 15 (51.7%) | 0 (0.0%) |
| 35 to 44 Years | 36 (73.5%) | 0 (0.0%) |
| 45 to 54 Years | 4 (20.0%) | 0 (0.0%) |
| 55 to 59 Years | 17 (100.0%) | 0 (0.0%) |
| 60 to 64 Years | 4 (16.7%) | 0 (0.0%) |
| 65 to 74 Years | 13 (31.7%) | 4 (30.8%) |
| 75 Years and over | 10 (13.7%) | 0 (0.0%) |
| Total | 99 (37.4%) | 4 (4.0%) |
Employment Status by Educational Attainment in Mansfield
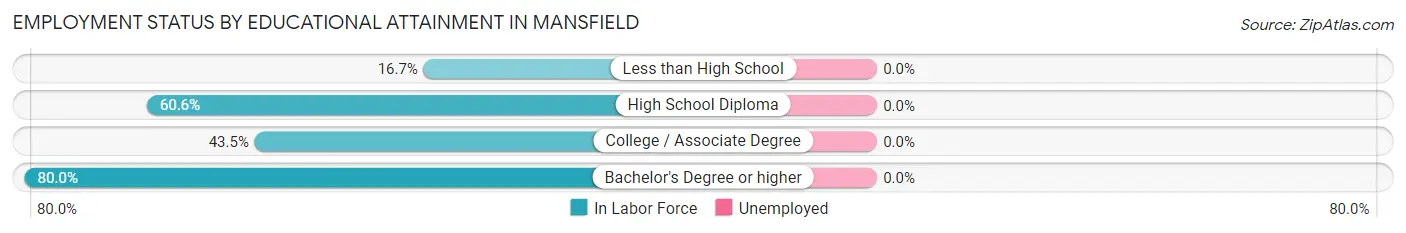
| Educational Attainment | In Labor Force | Unemployed |
| Less than High School | 4 (16.7%) | 0 (0.0%) |
| High School Diploma | 20 (60.6%) | 0 (0.0%) |
| College / Associate Degree | 20 (43.5%) | 0 (0.0%) |
| Bachelor's Degree or higher | 32 (80.0%) | 0 (0.0%) |
| Total | 76 (53.1%) | 0 (0.0%) |
Employment Occupations by Sex in Mansfield
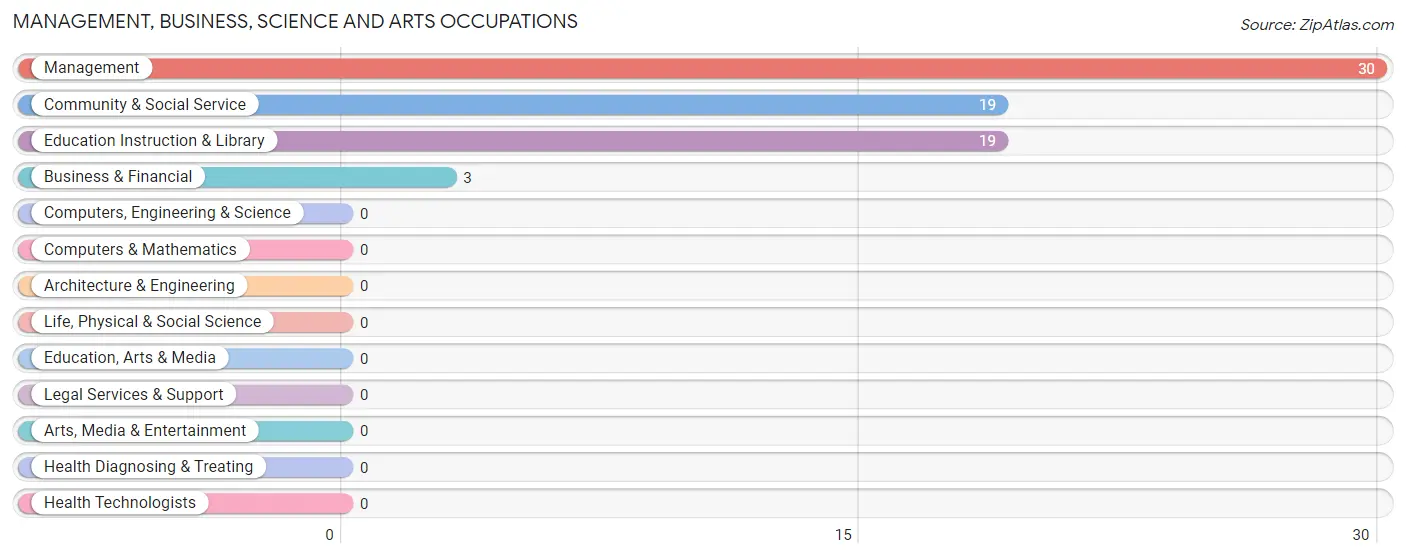
Management, Business, Science and Arts Occupations
The most common Management, Business, Science and Arts occupations in Mansfield are Management (30 | 31.6%), Community & Social Service (19 | 20.0%), Education Instruction & Library (19 | 20.0%), and Business & Financial (3 | 3.2%).
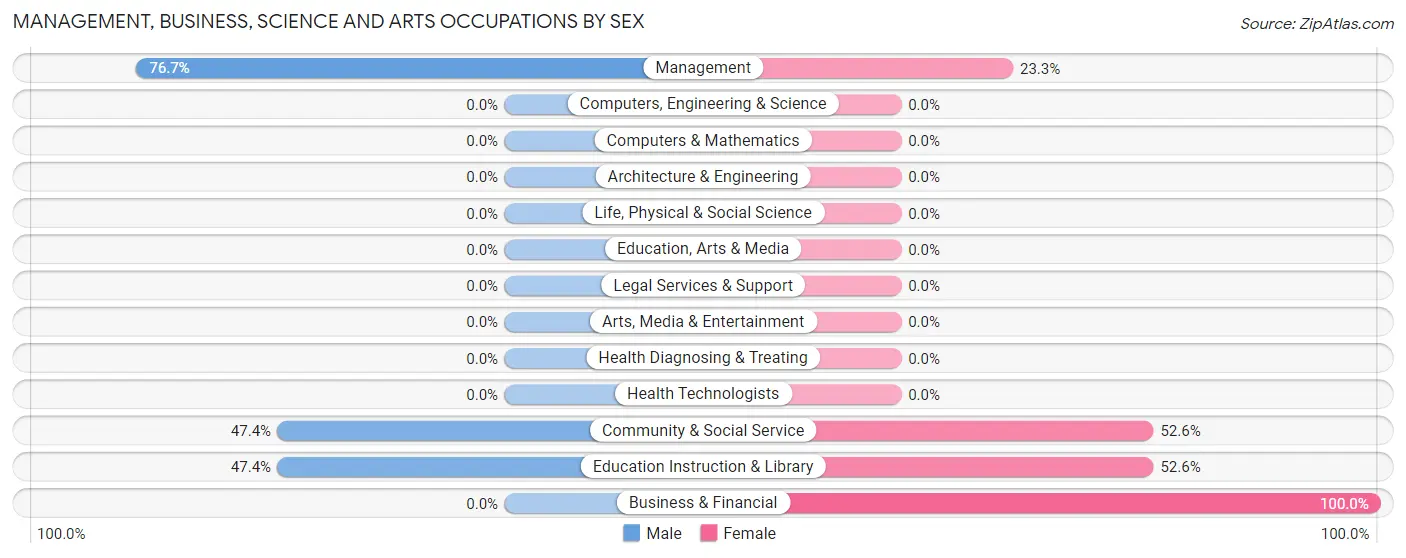
Management, Business, Science and Arts Occupations by Sex
Within the Management, Business, Science and Arts occupations in Mansfield, the most male-oriented occupations are Management (76.7%), Community & Social Service (47.4%), and Education Instruction & Library (47.4%), while the most female-oriented occupations are Business & Financial (100.0%), Community & Social Service (52.6%), and Education Instruction & Library (52.6%).
| Occupation | Male | Female |
| Management | 23 (76.7%) | 7 (23.3%) |
| Business & Financial | 0 (0.0%) | 3 (100.0%) |
| Computers, Engineering & Science | 0 (0.0%) | 0 (0.0%) |
| Computers & Mathematics | 0 (0.0%) | 0 (0.0%) |
| Architecture & Engineering | 0 (0.0%) | 0 (0.0%) |
| Life, Physical & Social Science | 0 (0.0%) | 0 (0.0%) |
| Community & Social Service | 9 (47.4%) | 10 (52.6%) |
| Education, Arts & Media | 0 (0.0%) | 0 (0.0%) |
| Legal Services & Support | 0 (0.0%) | 0 (0.0%) |
| Education Instruction & Library | 9 (47.4%) | 10 (52.6%) |
| Arts, Media & Entertainment | 0 (0.0%) | 0 (0.0%) |
| Health Diagnosing & Treating | 0 (0.0%) | 0 (0.0%) |
| Health Technologists | 0 (0.0%) | 0 (0.0%) |
| Total (Category) | 32 (61.5%) | 20 (38.5%) |
| Total (Overall) | 56 (59.0%) | 39 (41.0%) |
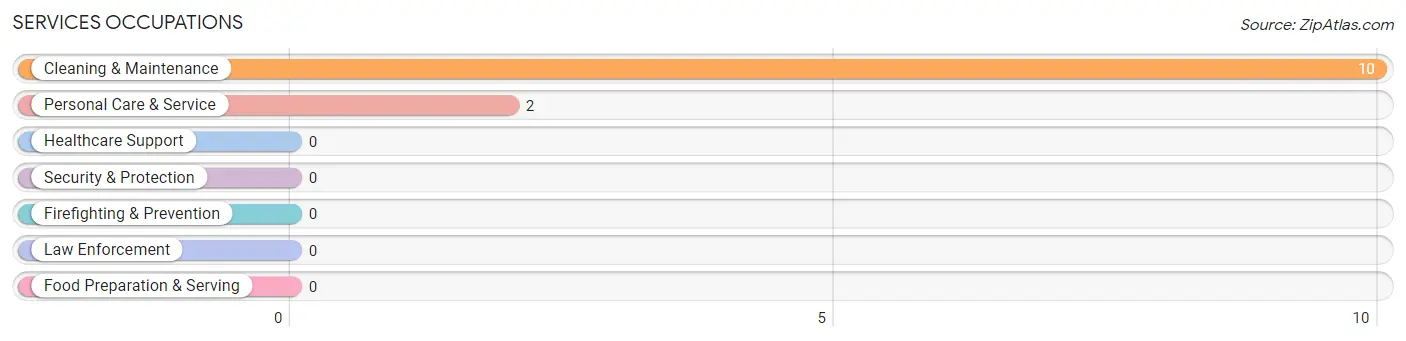
Services Occupations
The most common Services occupations in Mansfield are Cleaning & Maintenance (10 | 10.5%), and Personal Care & Service (2 | 2.1%).
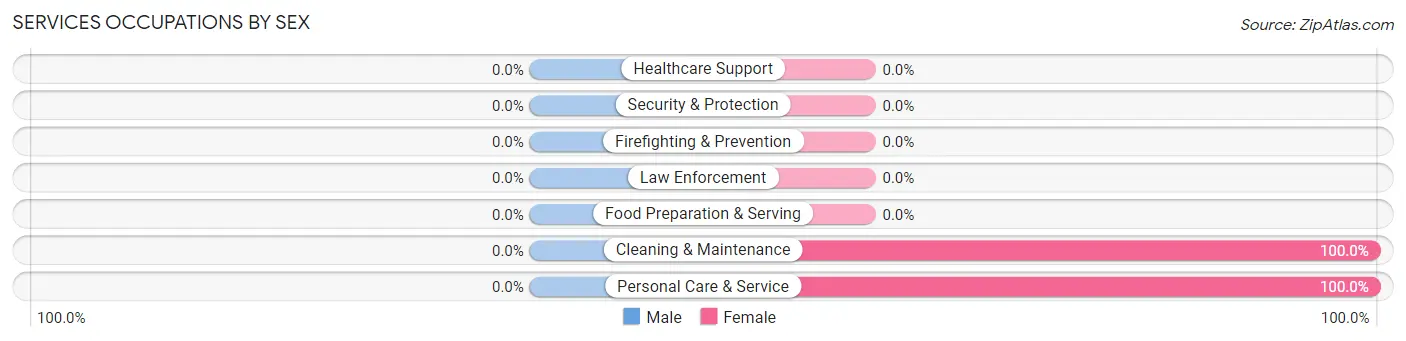
Services Occupations by Sex
| Occupation | Male | Female |
| Healthcare Support | 0 (0.0%) | 0 (0.0%) |
| Security & Protection | 0 (0.0%) | 0 (0.0%) |
| Firefighting & Prevention | 0 (0.0%) | 0 (0.0%) |
| Law Enforcement | 0 (0.0%) | 0 (0.0%) |
| Food Preparation & Serving | 0 (0.0%) | 0 (0.0%) |
| Cleaning & Maintenance | 0 (0.0%) | 10 (100.0%) |
| Personal Care & Service | 0 (0.0%) | 2 (100.0%) |
| Total (Category) | 0 (0.0%) | 12 (100.0%) |
| Total (Overall) | 56 (59.0%) | 39 (41.0%) |
Sales and Office Occupations
The most common Sales and Office occupations in Mansfield are Office & Administration (5 | 5.3%), and Sales & Related (2 | 2.1%).
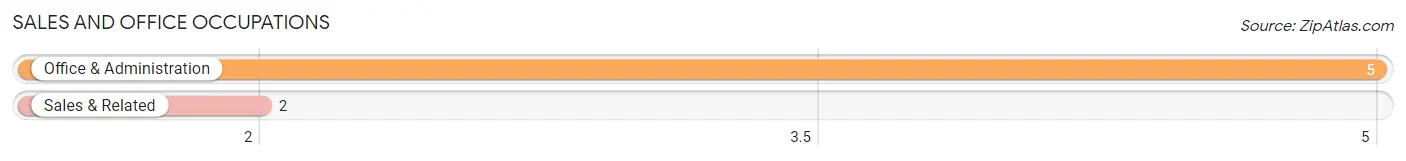
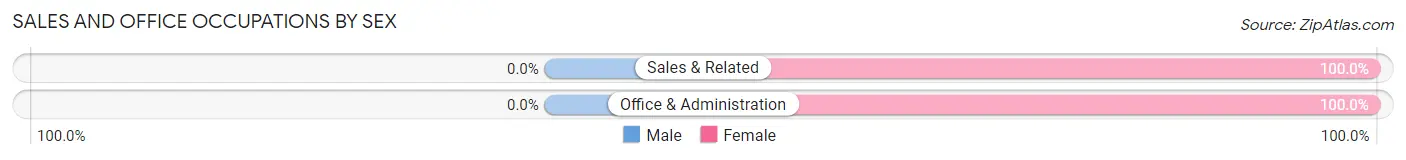
Sales and Office Occupations by Sex
| Occupation | Male | Female |
| Sales & Related | 0 (0.0%) | 2 (100.0%) |
| Office & Administration | 0 (0.0%) | 5 (100.0%) |
| Total (Category) | 0 (0.0%) | 7 (100.0%) |
| Total (Overall) | 56 (59.0%) | 39 (41.0%) |
Natural Resources, Construction and Maintenance Occupations
The most common Natural Resources, Construction and Maintenance occupations in Mansfield are , and Construction & Extraction (11 | 11.6%).
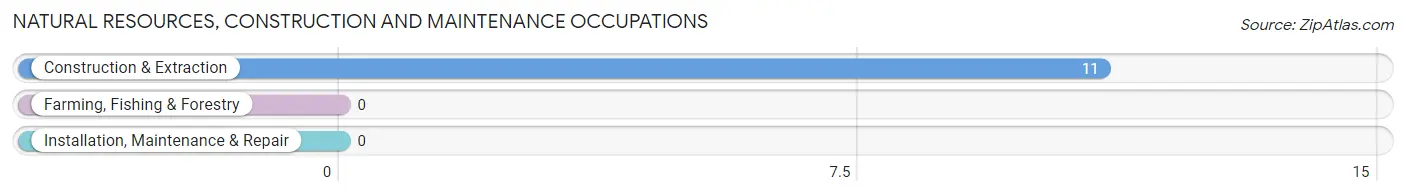
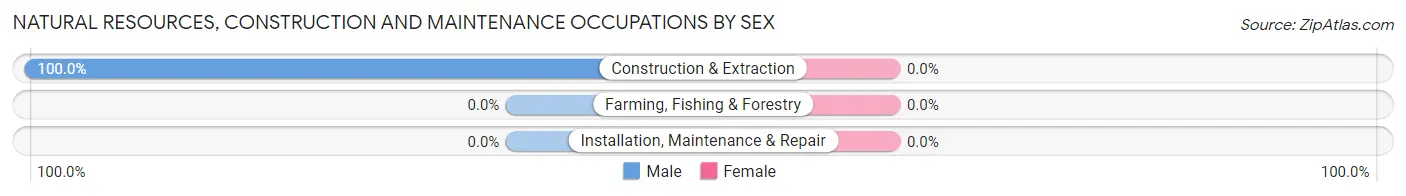
Natural Resources, Construction and Maintenance Occupations by Sex
| Occupation | Male | Female |
| Farming, Fishing & Forestry | 0 (0.0%) | 0 (0.0%) |
| Construction & Extraction | 11 (100.0%) | 0 (0.0%) |
| Installation, Maintenance & Repair | 0 (0.0%) | 0 (0.0%) |
| Total (Category) | 11 (100.0%) | 0 (0.0%) |
| Total (Overall) | 56 (59.0%) | 39 (41.0%) |
Production, Transportation and Moving Occupations
The most common Production, Transportation and Moving occupations in Mansfield are Production (6 | 6.3%), Transportation (5 | 5.3%), and Material Moving (2 | 2.1%).
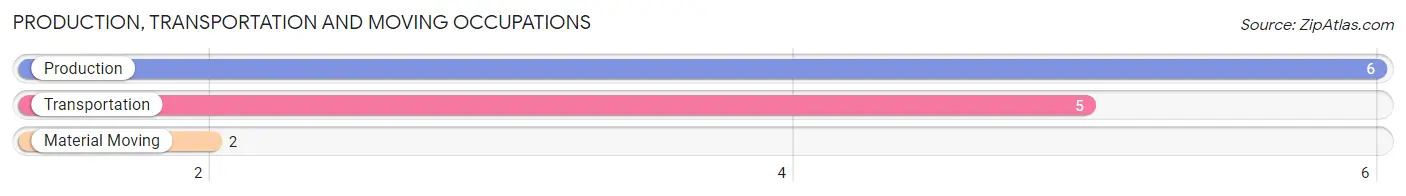
Production, Transportation and Moving Occupations by Sex
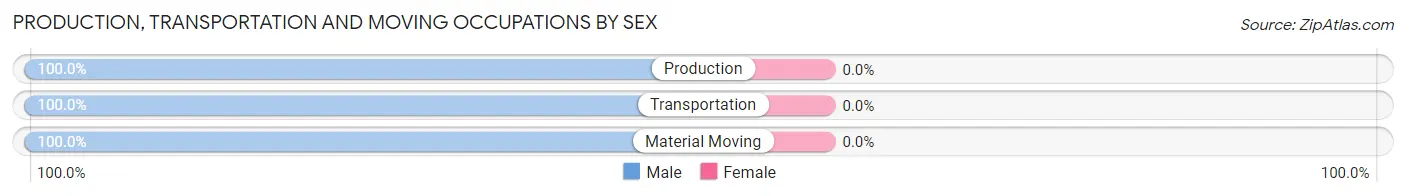
| Occupation | Male | Female |
| Production | 6 (100.0%) | 0 (0.0%) |
| Transportation | 5 (100.0%) | 0 (0.0%) |
| Material Moving | 2 (100.0%) | 0 (0.0%) |
| Total (Category) | 13 (100.0%) | 0 (0.0%) |
| Total (Overall) | 56 (59.0%) | 39 (41.0%) |
Employment Industries by Sex in Mansfield
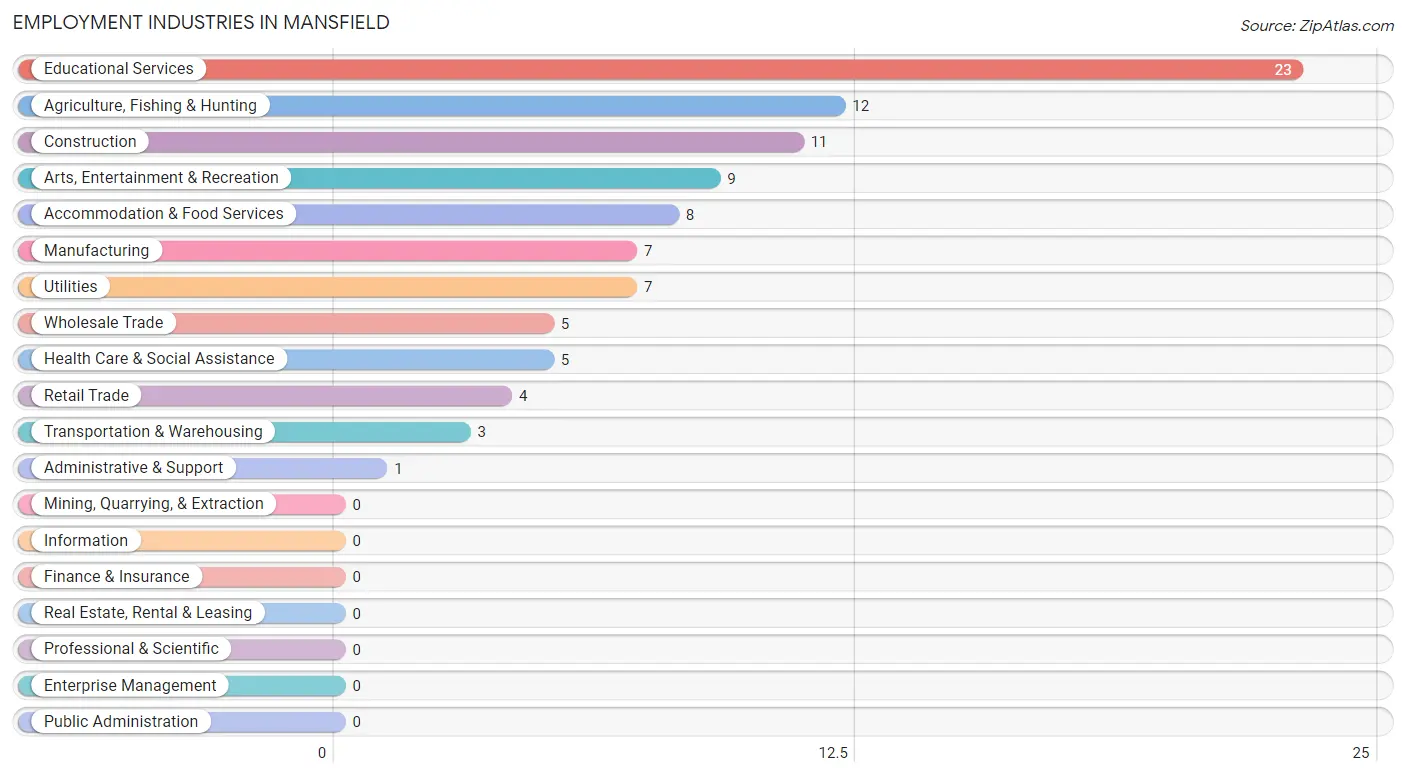
Employment Industries in Mansfield
The major employment industries in Mansfield include Educational Services (23 | 24.2%), Agriculture, Fishing & Hunting (12 | 12.6%), Construction (11 | 11.6%), Arts, Entertainment & Recreation (9 | 9.5%), and Accommodation & Food Services (8 | 8.4%).
Employment Industries by Sex in Mansfield
The Mansfield industries that see more men than women are Construction (100.0%), Manufacturing (100.0%), and Wholesale Trade (100.0%), whereas the industries that tend to have a higher number of women are Health Care & Social Assistance (100.0%), Arts, Entertainment & Recreation (100.0%), and Agriculture, Fishing & Hunting (50.0%).
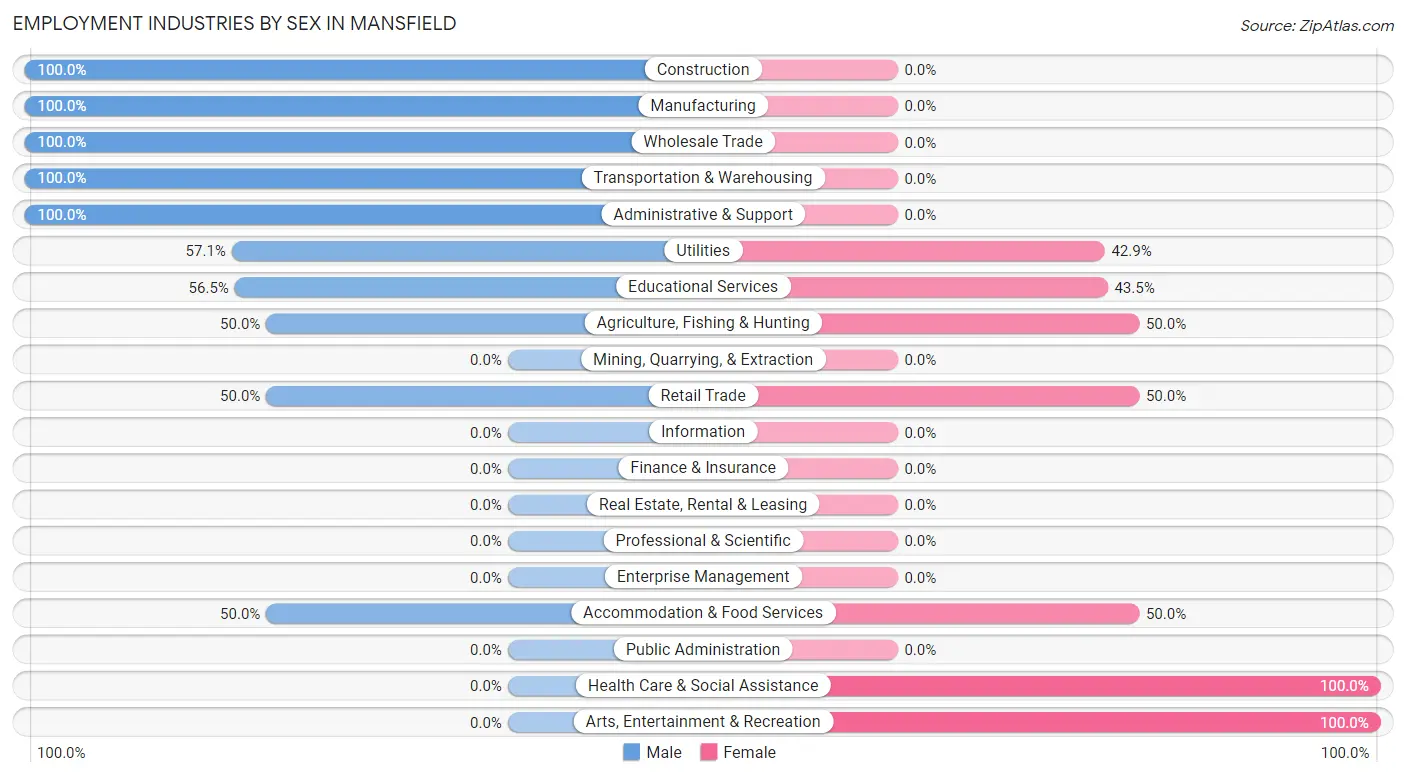
| Industry | Male | Female |
| Agriculture, Fishing & Hunting | 6 (50.0%) | 6 (50.0%) |
| Mining, Quarrying, & Extraction | 0 (0.0%) | 0 (0.0%) |
| Construction | 11 (100.0%) | 0 (0.0%) |
| Manufacturing | 7 (100.0%) | 0 (0.0%) |
| Wholesale Trade | 5 (100.0%) | 0 (0.0%) |
| Retail Trade | 2 (50.0%) | 2 (50.0%) |
| Transportation & Warehousing | 3 (100.0%) | 0 (0.0%) |
| Utilities | 4 (57.1%) | 3 (42.9%) |
| Information | 0 (0.0%) | 0 (0.0%) |
| Finance & Insurance | 0 (0.0%) | 0 (0.0%) |
| Real Estate, Rental & Leasing | 0 (0.0%) | 0 (0.0%) |
| Professional & Scientific | 0 (0.0%) | 0 (0.0%) |
| Enterprise Management | 0 (0.0%) | 0 (0.0%) |
| Administrative & Support | 1 (100.0%) | 0 (0.0%) |
| Educational Services | 13 (56.5%) | 10 (43.5%) |
| Health Care & Social Assistance | 0 (0.0%) | 5 (100.0%) |
| Arts, Entertainment & Recreation | 0 (0.0%) | 9 (100.0%) |
| Accommodation & Food Services | 4 (50.0%) | 4 (50.0%) |
| Public Administration | 0 (0.0%) | 0 (0.0%) |
| Total | 56 (59.0%) | 39 (41.0%) |
Education in Mansfield
School Enrollment in Mansfield
The most common levels of schooling among the 56 students in Mansfield are middle school (20 | 35.7%), elementary school (18 | 32.1%), and kindergarten (7 | 12.5%).
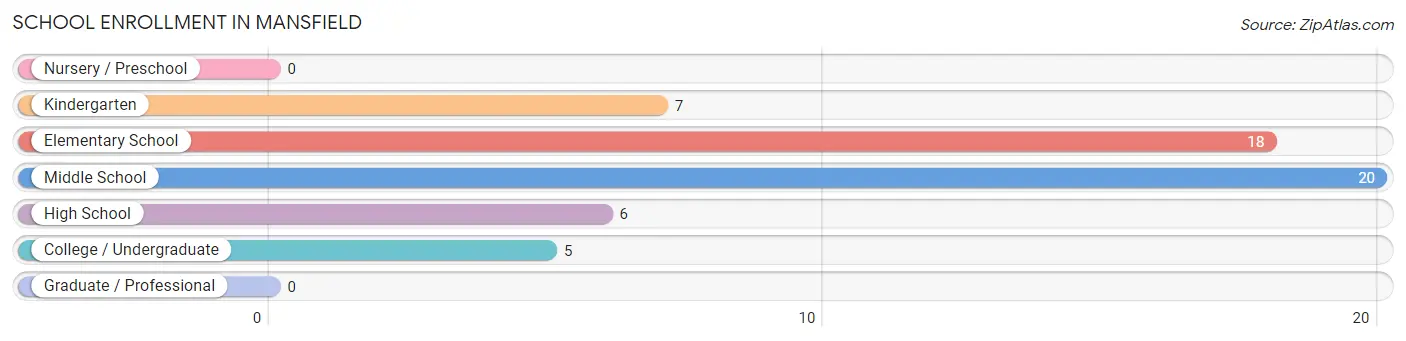
| School Level | # Students | % Students |
| Nursery / Preschool | 0 | 0.0% |
| Kindergarten | 7 | 12.5% |
| Elementary School | 18 | 32.1% |
| Middle School | 20 | 35.7% |
| High School | 6 | 10.7% |
| College / Undergraduate | 5 | 8.9% |
| Graduate / Professional | 0 | 0.0% |
| Total | 56 | 100.0% |
School Enrollment by Age by Funding Source in Mansfield
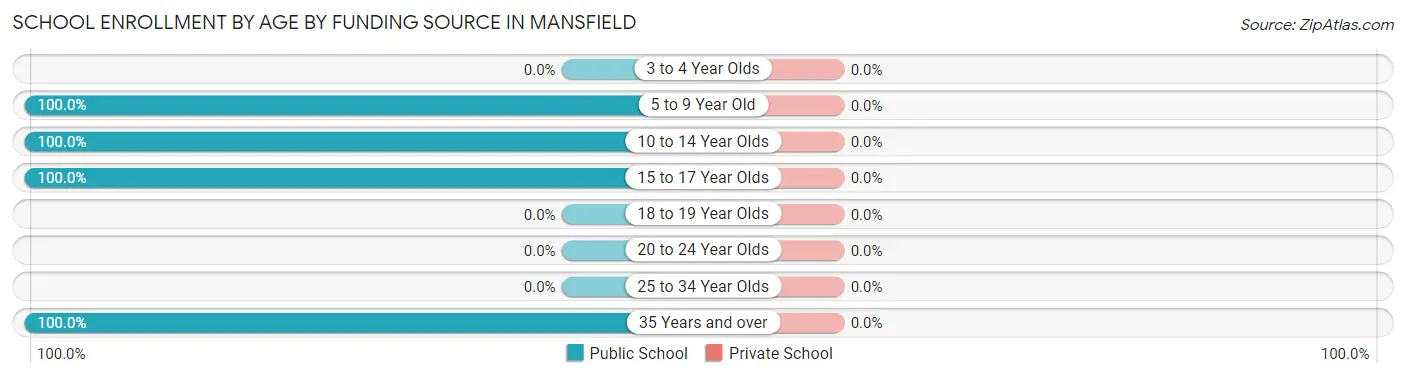
| Age Bracket | Public School | Private School |
| 3 to 4 Year Olds | 0 (0.0%) | 0 (0.0%) |
| 5 to 9 Year Old | 19 (100.0%) | 0 (0.0%) |
| 10 to 14 Year Olds | 26 (100.0%) | 0 (0.0%) |
| 15 to 17 Year Olds | 6 (100.0%) | 0 (0.0%) |
| 18 to 19 Year Olds | 0 (0.0%) | 0 (0.0%) |
| 20 to 24 Year Olds | 0 (0.0%) | 0 (0.0%) |
| 25 to 34 Year Olds | 0 (0.0%) | 0 (0.0%) |
| 35 Years and over | 5 (100.0%) | 0 (0.0%) |
| Total | 56 (100.0%) | 0 (0.0%) |
Educational Attainment by Field of Study in Mansfield
Education (16 | 29.1%), business (11 | 20.0%), bio, nature & agricultural (9 | 16.4%), social sciences (6 | 10.9%), and arts & humanities (6 | 10.9%) are the most common fields of study among 55 individuals in Mansfield who have obtained a bachelor's degree or higher.
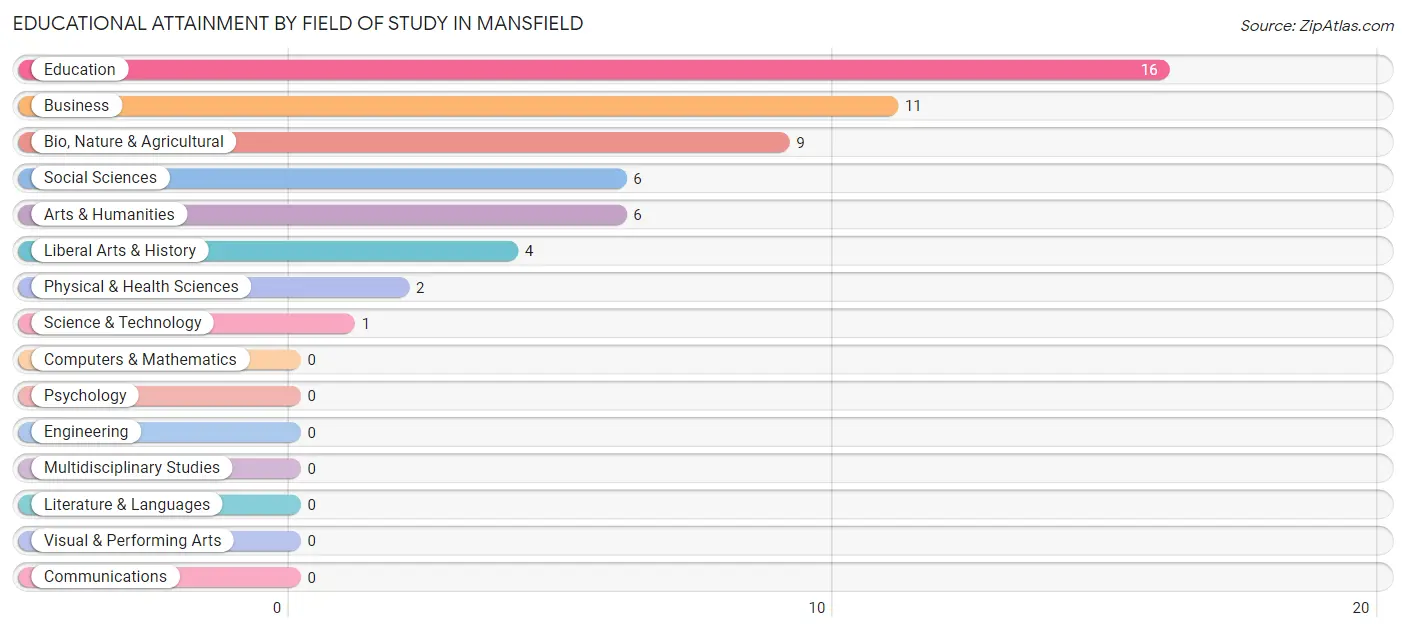
| Field of Study | # Graduates | % Graduates |
| Computers & Mathematics | 0 | 0.0% |
| Bio, Nature & Agricultural | 9 | 16.4% |
| Physical & Health Sciences | 2 | 3.6% |
| Psychology | 0 | 0.0% |
| Social Sciences | 6 | 10.9% |
| Engineering | 0 | 0.0% |
| Multidisciplinary Studies | 0 | 0.0% |
| Science & Technology | 1 | 1.8% |
| Business | 11 | 20.0% |
| Education | 16 | 29.1% |
| Literature & Languages | 0 | 0.0% |
| Liberal Arts & History | 4 | 7.3% |
| Visual & Performing Arts | 0 | 0.0% |
| Communications | 0 | 0.0% |
| Arts & Humanities | 6 | 10.9% |
| Total | 55 | 100.0% |
Transportation & Commute in Mansfield
Vehicle Availability by Sex in Mansfield
The most prevalent vehicle ownership categories in Mansfield are males with 2 vehicles (20, accounting for 35.7%) and females with 2 vehicles (15, making up 51.3%).
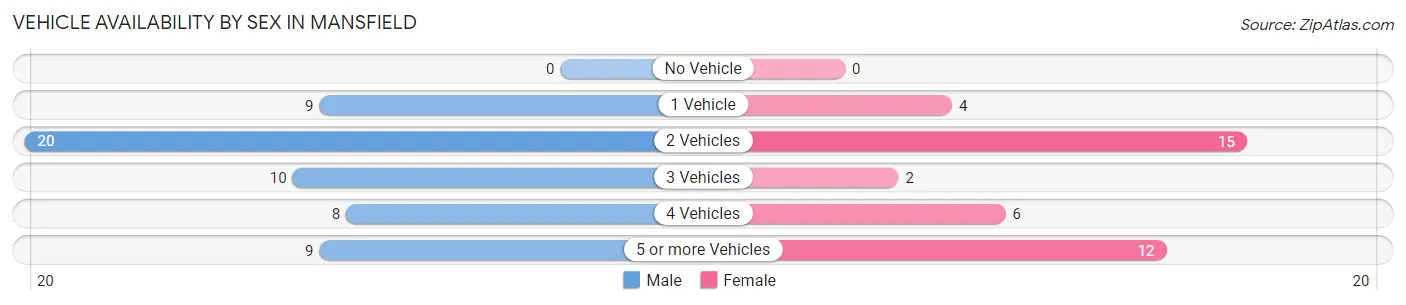
| Vehicles Available | Male | Female |
| No Vehicle | 0 (0.0%) | 0 (0.0%) |
| 1 Vehicle | 9 (16.1%) | 4 (10.3%) |
| 2 Vehicles | 20 (35.7%) | 15 (38.5%) |
| 3 Vehicles | 10 (17.9%) | 2 (5.1%) |
| 4 Vehicles | 8 (14.3%) | 6 (15.4%) |
| 5 or more Vehicles | 9 (16.1%) | 12 (30.8%) |
| Total | 56 (100.0%) | 39 (100.0%) |
Commute Time in Mansfield
The most frequently occuring commute durations in Mansfield are 5 to 9 minutes (22 commuters, 23.9%), 45 to 59 minutes (13 commuters, 14.1%), and 30 to 34 minutes (12 commuters, 13.0%).
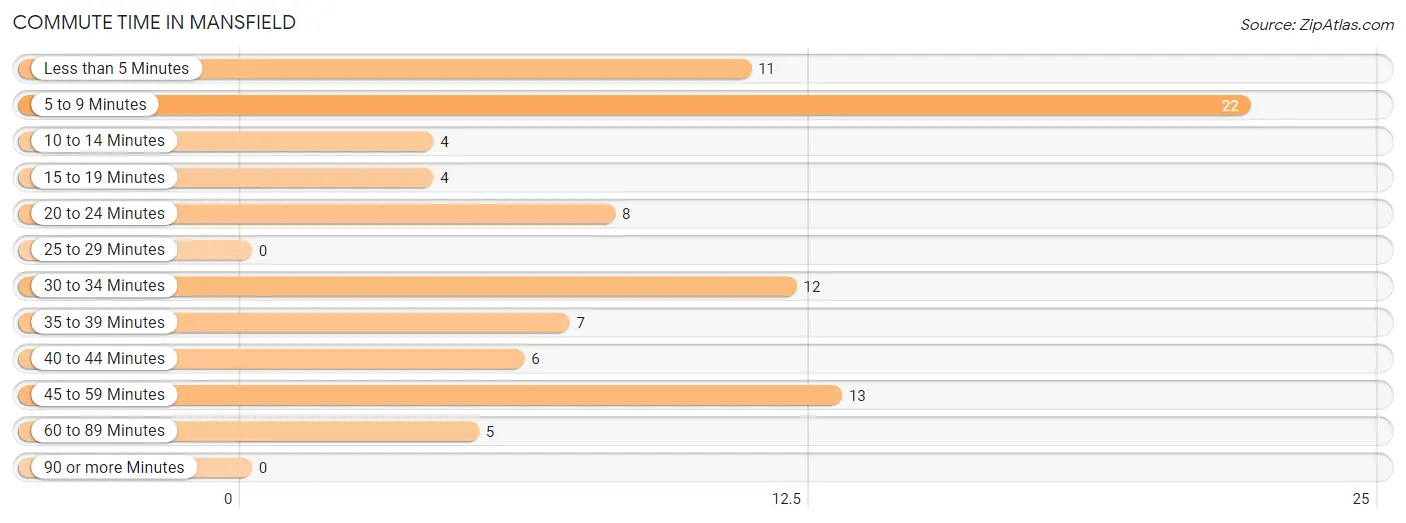
| Commute Time | # Commuters | % Commuters |
| Less than 5 Minutes | 11 | 12.0% |
| 5 to 9 Minutes | 22 | 23.9% |
| 10 to 14 Minutes | 4 | 4.3% |
| 15 to 19 Minutes | 4 | 4.3% |
| 20 to 24 Minutes | 8 | 8.7% |
| 25 to 29 Minutes | 0 | 0.0% |
| 30 to 34 Minutes | 12 | 13.0% |
| 35 to 39 Minutes | 7 | 7.6% |
| 40 to 44 Minutes | 6 | 6.5% |
| 45 to 59 Minutes | 13 | 14.1% |
| 60 to 89 Minutes | 5 | 5.4% |
| 90 or more Minutes | 0 | 0.0% |
Commute Time by Sex in Mansfield
The most common commute times in Mansfield are 5 to 9 minutes (18 commuters, 32.1%) for males and less than 5 minutes (7 commuters, 19.4%) for females.
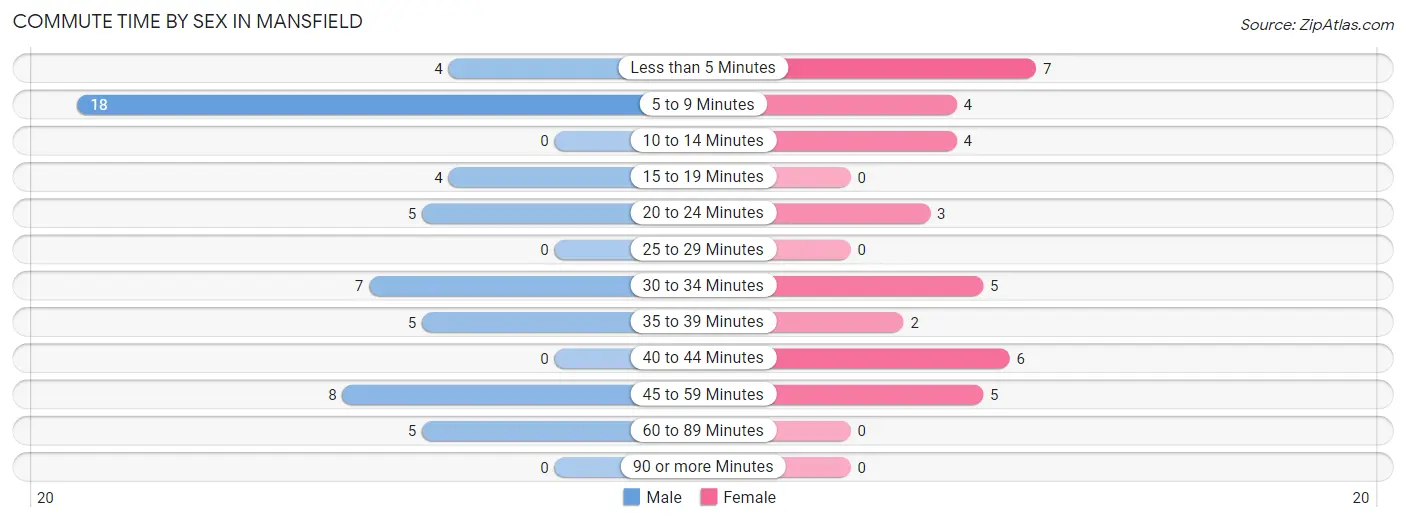
| Commute Time | Male | Female |
| Less than 5 Minutes | 4 (7.1%) | 7 (19.4%) |
| 5 to 9 Minutes | 18 (32.1%) | 4 (11.1%) |
| 10 to 14 Minutes | 0 (0.0%) | 4 (11.1%) |
| 15 to 19 Minutes | 4 (7.1%) | 0 (0.0%) |
| 20 to 24 Minutes | 5 (8.9%) | 3 (8.3%) |
| 25 to 29 Minutes | 0 (0.0%) | 0 (0.0%) |
| 30 to 34 Minutes | 7 (12.5%) | 5 (13.9%) |
| 35 to 39 Minutes | 5 (8.9%) | 2 (5.6%) |
| 40 to 44 Minutes | 0 (0.0%) | 6 (16.7%) |
| 45 to 59 Minutes | 8 (14.3%) | 5 (13.9%) |
| 60 to 89 Minutes | 5 (8.9%) | 0 (0.0%) |
| 90 or more Minutes | 0 (0.0%) | 0 (0.0%) |
Time of Departure to Work by Sex in Mansfield
The most frequent times of departure to work in Mansfield are 7:00 AM to 7:29 AM (16, 28.6%) for males and 7:00 AM to 7:29 AM (10, 27.8%) for females.
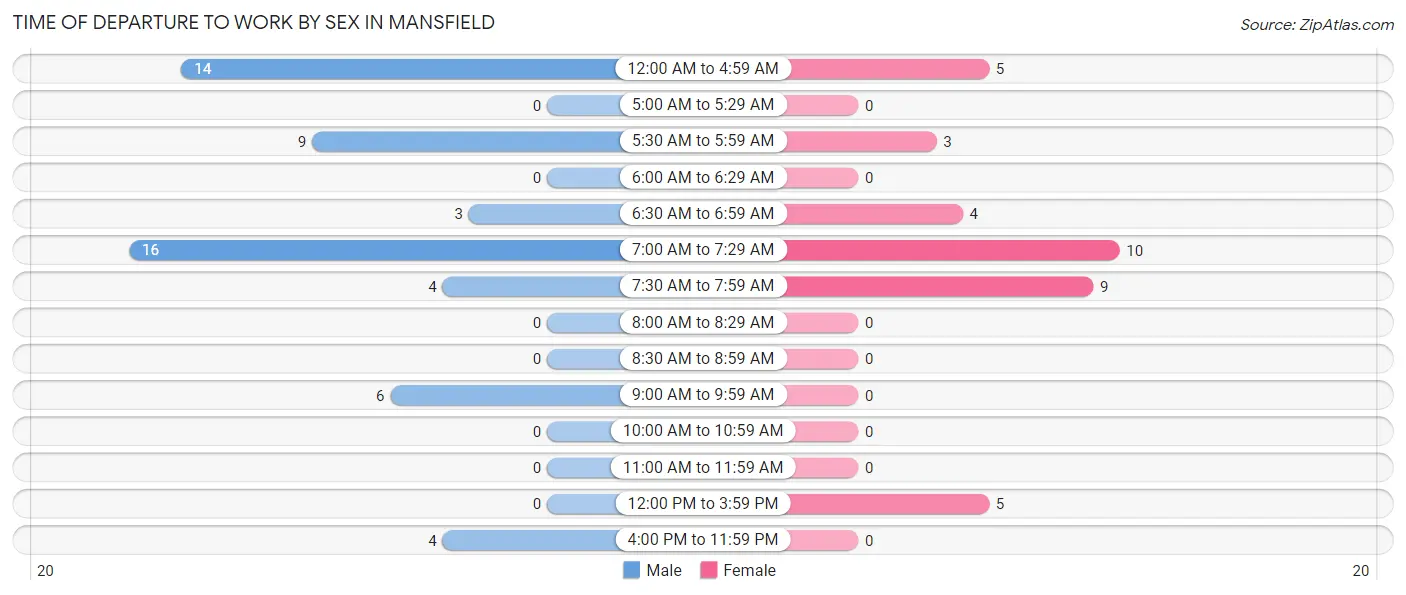
| Time of Departure | Male | Female |
| 12:00 AM to 4:59 AM | 14 (25.0%) | 5 (13.9%) |
| 5:00 AM to 5:29 AM | 0 (0.0%) | 0 (0.0%) |
| 5:30 AM to 5:59 AM | 9 (16.1%) | 3 (8.3%) |
| 6:00 AM to 6:29 AM | 0 (0.0%) | 0 (0.0%) |
| 6:30 AM to 6:59 AM | 3 (5.4%) | 4 (11.1%) |
| 7:00 AM to 7:29 AM | 16 (28.6%) | 10 (27.8%) |
| 7:30 AM to 7:59 AM | 4 (7.1%) | 9 (25.0%) |
| 8:00 AM to 8:29 AM | 0 (0.0%) | 0 (0.0%) |
| 8:30 AM to 8:59 AM | 0 (0.0%) | 0 (0.0%) |
| 9:00 AM to 9:59 AM | 6 (10.7%) | 0 (0.0%) |
| 10:00 AM to 10:59 AM | 0 (0.0%) | 0 (0.0%) |
| 11:00 AM to 11:59 AM | 0 (0.0%) | 0 (0.0%) |
| 12:00 PM to 3:59 PM | 0 (0.0%) | 5 (13.9%) |
| 4:00 PM to 11:59 PM | 4 (7.1%) | 0 (0.0%) |
| Total | 56 (100.0%) | 36 (100.0%) |
Housing Occupancy in Mansfield
Occupancy by Ownership in Mansfield
Of the total 156 dwellings in Mansfield, owner-occupied units account for 102 (65.4%), while renter-occupied units make up 54 (34.6%).
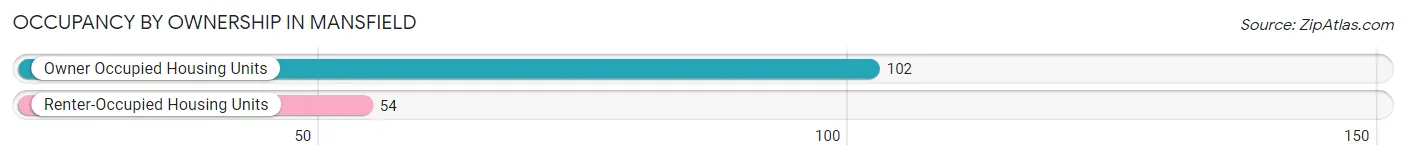
| Occupancy | # Housing Units | % Housing Units |
| Owner Occupied Housing Units | 102 | 65.4% |
| Renter-Occupied Housing Units | 54 | 34.6% |
| Total Occupied Housing Units | 156 | 100.0% |
Occupancy by Household Size in Mansfield
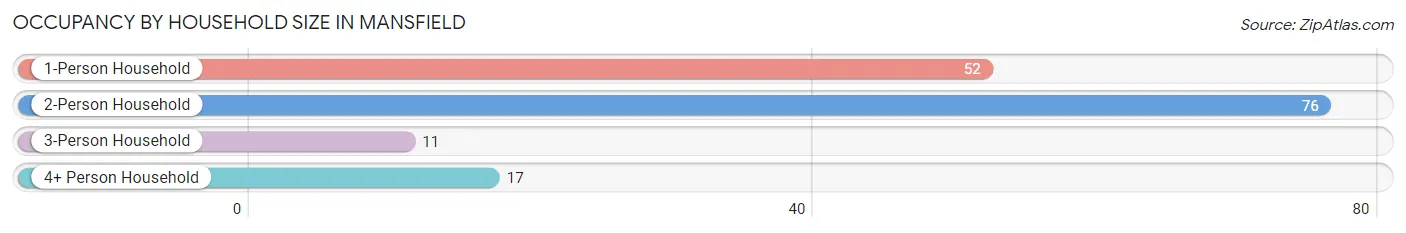
| Household Size | # Housing Units | % Housing Units |
| 1-Person Household | 52 | 33.3% |
| 2-Person Household | 76 | 48.7% |
| 3-Person Household | 11 | 7.0% |
| 4+ Person Household | 17 | 10.9% |
| Total Housing Units | 156 | 100.0% |
Occupancy by Ownership by Household Size in Mansfield
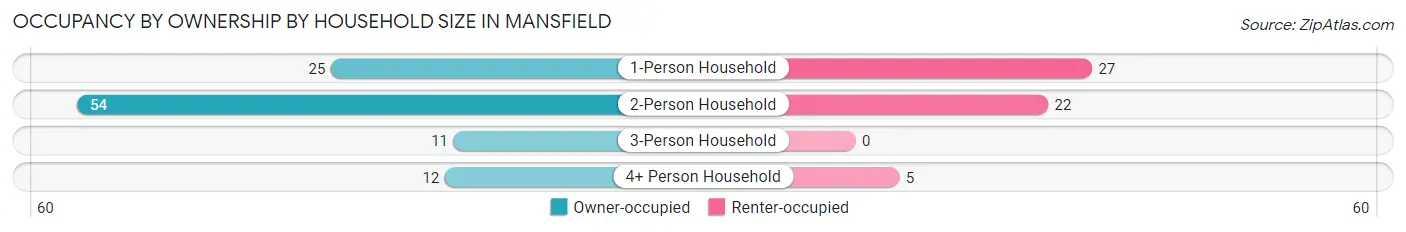
| Household Size | Owner-occupied | Renter-occupied |
| 1-Person Household | 25 (48.1%) | 27 (51.9%) |
| 2-Person Household | 54 (71.1%) | 22 (28.9%) |
| 3-Person Household | 11 (100.0%) | 0 (0.0%) |
| 4+ Person Household | 12 (70.6%) | 5 (29.4%) |
| Total Housing Units | 102 (65.4%) | 54 (34.6%) |
Occupancy by Educational Attainment in Mansfield
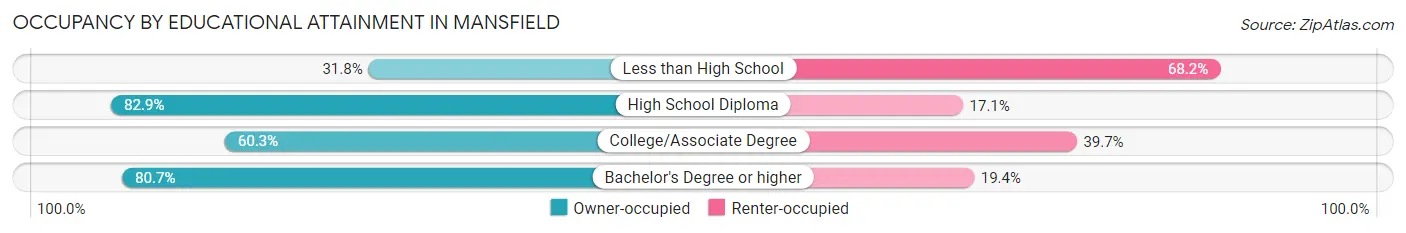
| Household Size | Owner-occupied | Renter-occupied |
| Less than High School | 7 (31.8%) | 15 (68.2%) |
| High School Diploma | 29 (82.9%) | 6 (17.1%) |
| College/Associate Degree | 41 (60.3%) | 27 (39.7%) |
| Bachelor's Degree or higher | 25 (80.6%) | 6 (19.4%) |
Occupancy by Age of Householder in Mansfield
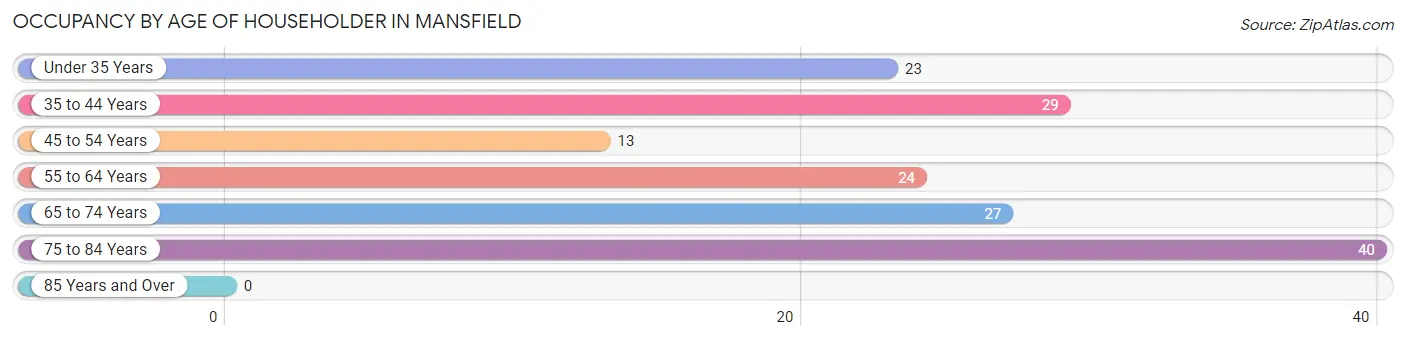
| Age Bracket | # Households | % Households |
| Under 35 Years | 23 | 14.7% |
| 35 to 44 Years | 29 | 18.6% |
| 45 to 54 Years | 13 | 8.3% |
| 55 to 64 Years | 24 | 15.4% |
| 65 to 74 Years | 27 | 17.3% |
| 75 to 84 Years | 40 | 25.6% |
| 85 Years and Over | 0 | 0.0% |
| Total | 156 | 100.0% |
Housing Finances in Mansfield
Median Income by Occupancy in Mansfield
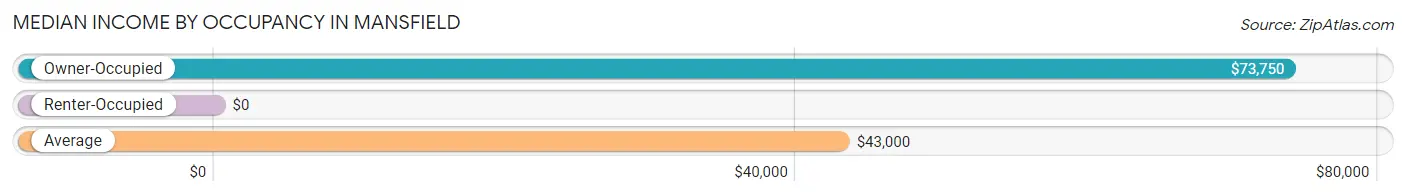
| Occupancy Type | # Households | Median Income |
| Owner-Occupied | 102 (65.4%) | $73,750 |
| Renter-Occupied | 54 (34.6%) | $0 |
| Average | 156 (100.0%) | $43,000 |
Occupancy by Householder Income Bracket in Mansfield
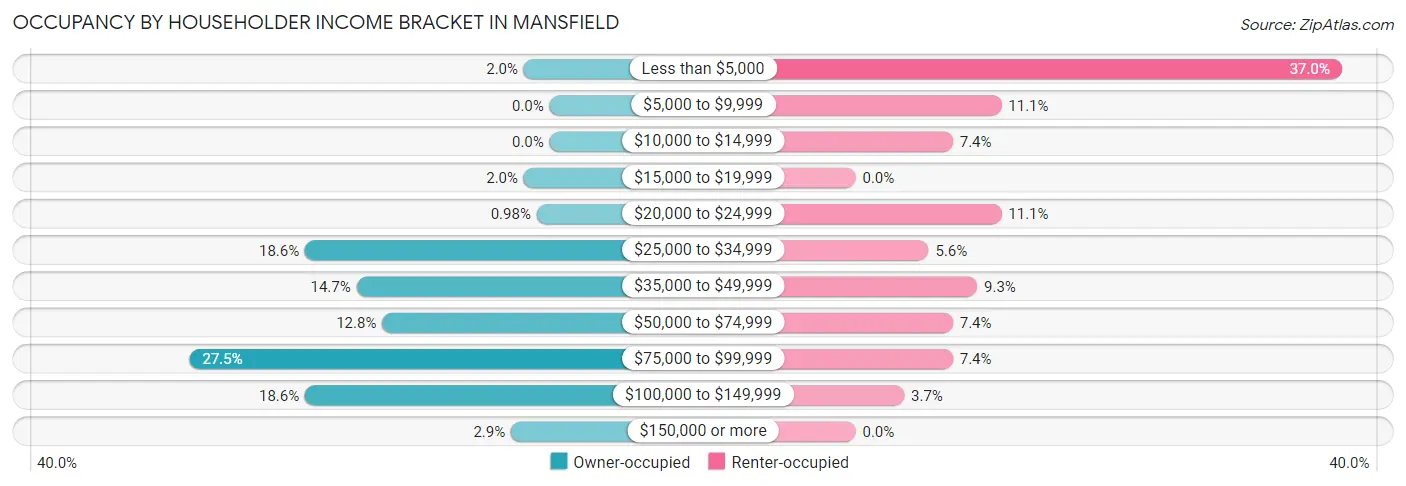
| Income Bracket | Owner-occupied | Renter-occupied |
| Less than $5,000 | 2 (2.0%) | 20 (37.0%) |
| $5,000 to $9,999 | 0 (0.0%) | 6 (11.1%) |
| $10,000 to $14,999 | 0 (0.0%) | 4 (7.4%) |
| $15,000 to $19,999 | 2 (2.0%) | 0 (0.0%) |
| $20,000 to $24,999 | 1 (1.0%) | 6 (11.1%) |
| $25,000 to $34,999 | 19 (18.6%) | 3 (5.6%) |
| $35,000 to $49,999 | 15 (14.7%) | 5 (9.3%) |
| $50,000 to $74,999 | 13 (12.8%) | 4 (7.4%) |
| $75,000 to $99,999 | 28 (27.5%) | 4 (7.4%) |
| $100,000 to $149,999 | 19 (18.6%) | 2 (3.7%) |
| $150,000 or more | 3 (2.9%) | 0 (0.0%) |
| Total | 102 (100.0%) | 54 (100.0%) |
Monthly Housing Cost Tiers in Mansfield
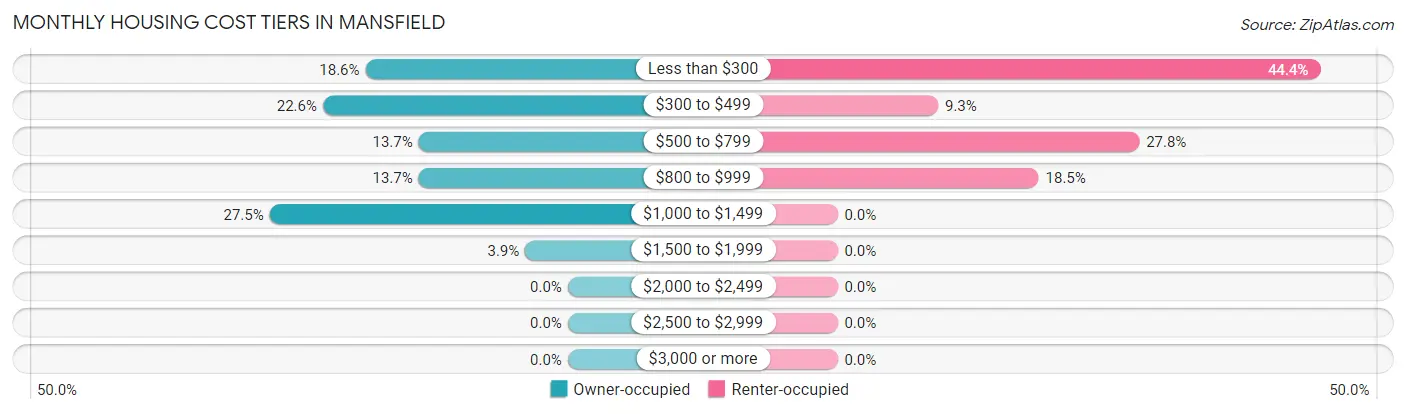
| Monthly Cost | Owner-occupied | Renter-occupied |
| Less than $300 | 19 (18.6%) | 24 (44.4%) |
| $300 to $499 | 23 (22.6%) | 5 (9.3%) |
| $500 to $799 | 14 (13.7%) | 15 (27.8%) |
| $800 to $999 | 14 (13.7%) | 10 (18.5%) |
| $1,000 to $1,499 | 28 (27.5%) | 0 (0.0%) |
| $1,500 to $1,999 | 4 (3.9%) | 0 (0.0%) |
| $2,000 to $2,499 | 0 (0.0%) | 0 (0.0%) |
| $2,500 to $2,999 | 0 (0.0%) | 0 (0.0%) |
| $3,000 or more | 0 (0.0%) | 0 (0.0%) |
| Total | 102 (100.0%) | 54 (100.0%) |
Physical Housing Characteristics in Mansfield
Housing Structures in Mansfield
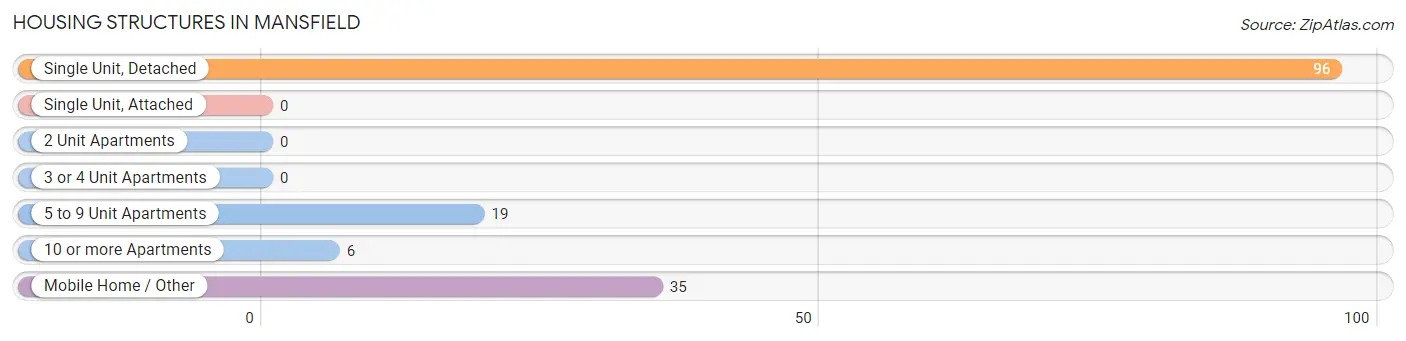
| Structure Type | # Housing Units | % Housing Units |
| Single Unit, Detached | 96 | 61.5% |
| Single Unit, Attached | 0 | 0.0% |
| 2 Unit Apartments | 0 | 0.0% |
| 3 or 4 Unit Apartments | 0 | 0.0% |
| 5 to 9 Unit Apartments | 19 | 12.2% |
| 10 or more Apartments | 6 | 3.8% |
| Mobile Home / Other | 35 | 22.4% |
| Total | 156 | 100.0% |
Housing Structures by Occupancy in Mansfield
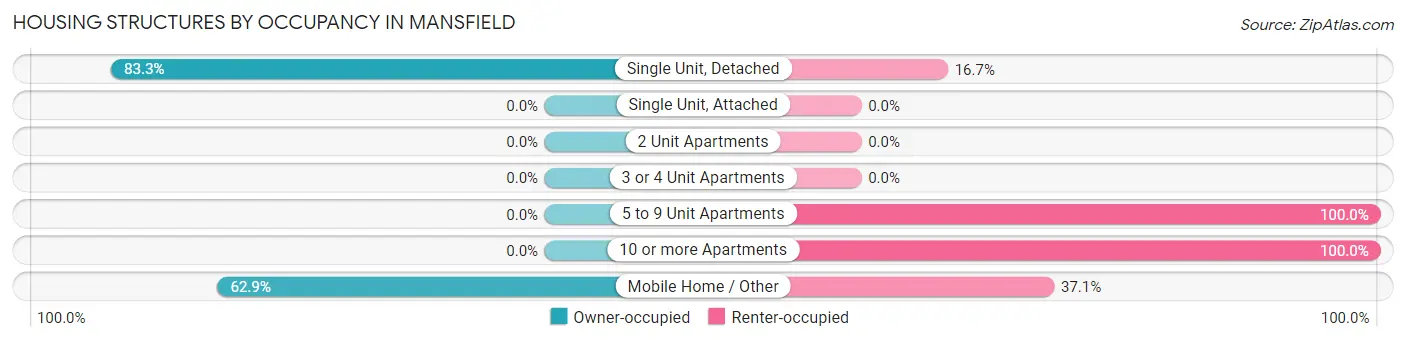
| Structure Type | Owner-occupied | Renter-occupied |
| Single Unit, Detached | 80 (83.3%) | 16 (16.7%) |
| Single Unit, Attached | 0 (0.0%) | 0 (0.0%) |
| 2 Unit Apartments | 0 (0.0%) | 0 (0.0%) |
| 3 or 4 Unit Apartments | 0 (0.0%) | 0 (0.0%) |
| 5 to 9 Unit Apartments | 0 (0.0%) | 19 (100.0%) |
| 10 or more Apartments | 0 (0.0%) | 6 (100.0%) |
| Mobile Home / Other | 22 (62.9%) | 13 (37.1%) |
| Total | 102 (65.4%) | 54 (34.6%) |
Housing Structures by Number of Rooms in Mansfield
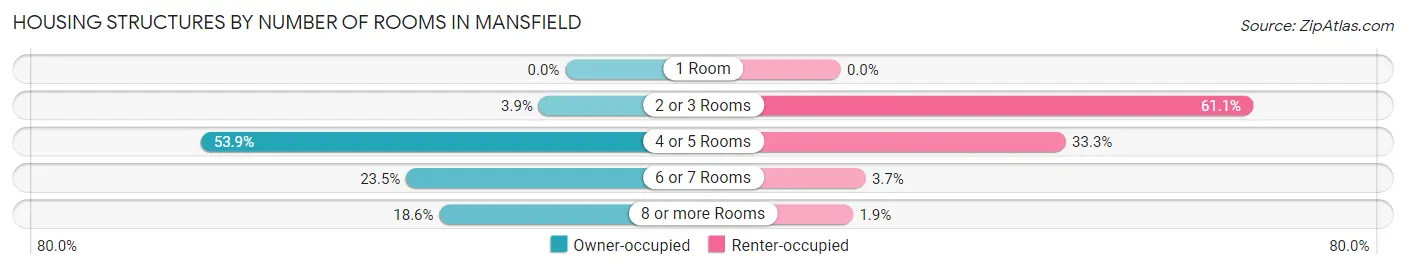
| Number of Rooms | Owner-occupied | Renter-occupied |
| 1 Room | 0 (0.0%) | 0 (0.0%) |
| 2 or 3 Rooms | 4 (3.9%) | 33 (61.1%) |
| 4 or 5 Rooms | 55 (53.9%) | 18 (33.3%) |
| 6 or 7 Rooms | 24 (23.5%) | 2 (3.7%) |
| 8 or more Rooms | 19 (18.6%) | 1 (1.8%) |
| Total | 102 (100.0%) | 54 (100.0%) |
Housing Structure by Heating Type in Mansfield
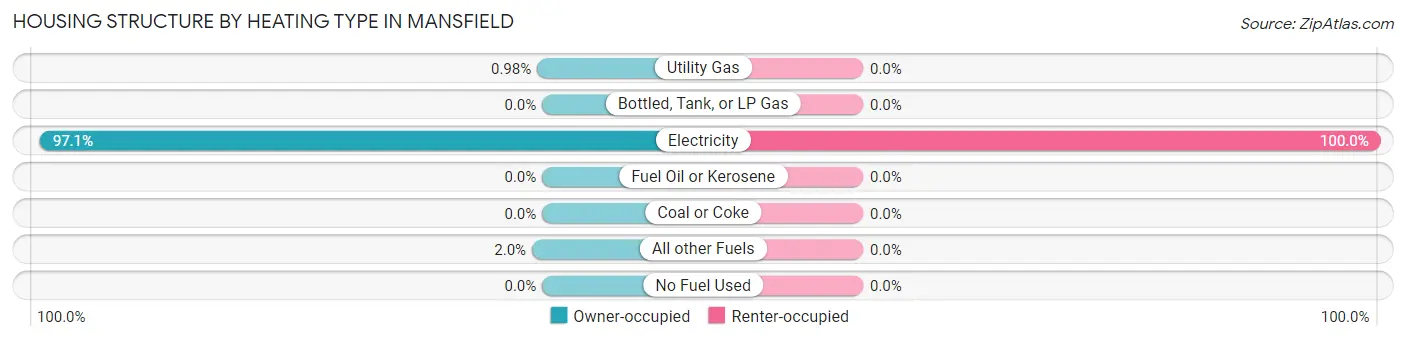
| Heating Type | Owner-occupied | Renter-occupied |
| Utility Gas | 1 (1.0%) | 0 (0.0%) |
| Bottled, Tank, or LP Gas | 0 (0.0%) | 0 (0.0%) |
| Electricity | 99 (97.1%) | 54 (100.0%) |
| Fuel Oil or Kerosene | 0 (0.0%) | 0 (0.0%) |
| Coal or Coke | 0 (0.0%) | 0 (0.0%) |
| All other Fuels | 2 (2.0%) | 0 (0.0%) |
| No Fuel Used | 0 (0.0%) | 0 (0.0%) |
| Total | 102 (100.0%) | 54 (100.0%) |
Household Vehicle Usage in Mansfield
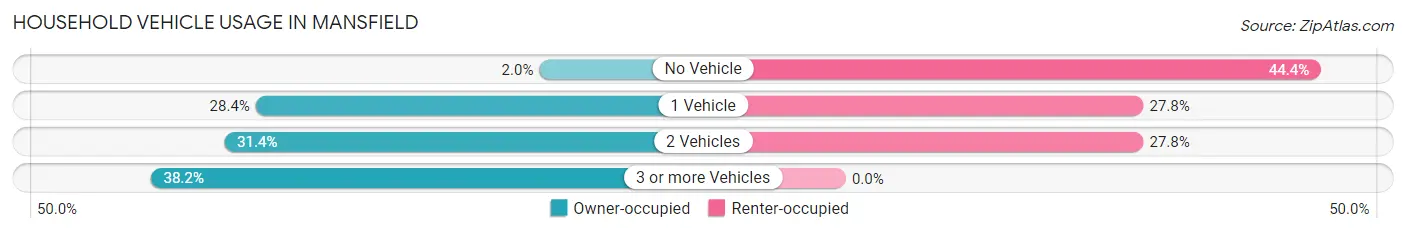
| Vehicles per Household | Owner-occupied | Renter-occupied |
| No Vehicle | 2 (2.0%) | 24 (44.4%) |
| 1 Vehicle | 29 (28.4%) | 15 (27.8%) |
| 2 Vehicles | 32 (31.4%) | 15 (27.8%) |
| 3 or more Vehicles | 39 (38.2%) | 0 (0.0%) |
| Total | 102 (100.0%) | 54 (100.0%) |
Real Estate & Mortgages in Mansfield
Real Estate and Mortgage Overview in Mansfield
| Characteristic | Without Mortgage | With Mortgage |
| Housing Units | 51 | 51 |
| Median Property Value | $127,500 | $220,500 |
| Median Household Income | $54,375 | $0 |
| Monthly Housing Costs | $341 | $0 |
| Real Estate Taxes | $1,050 | $0 |
Property Value by Mortgage Status in Mansfield
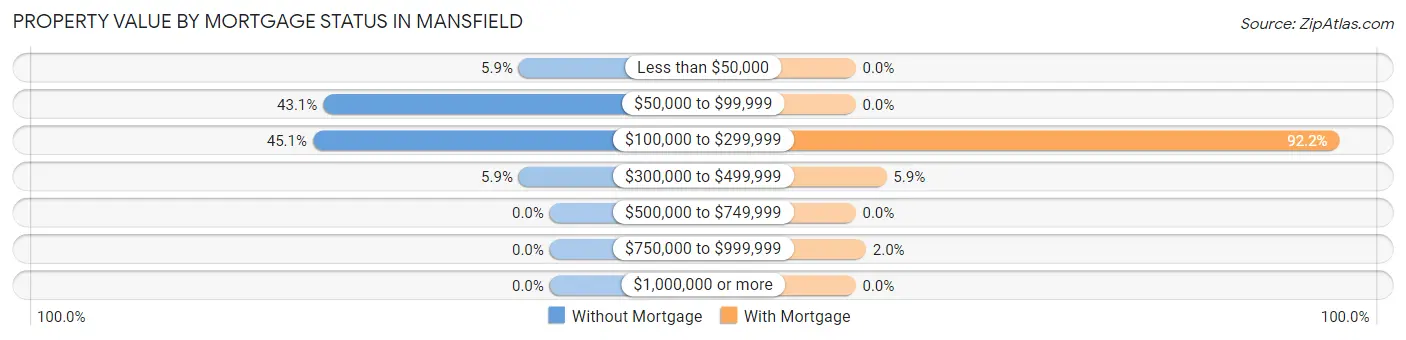
| Property Value | Without Mortgage | With Mortgage |
| Less than $50,000 | 3 (5.9%) | 0 (0.0%) |
| $50,000 to $99,999 | 22 (43.1%) | 0 (0.0%) |
| $100,000 to $299,999 | 23 (45.1%) | 47 (92.2%) |
| $300,000 to $499,999 | 3 (5.9%) | 3 (5.9%) |
| $500,000 to $749,999 | 0 (0.0%) | 0 (0.0%) |
| $750,000 to $999,999 | 0 (0.0%) | 1 (2.0%) |
| $1,000,000 or more | 0 (0.0%) | 0 (0.0%) |
| Total | 51 (100.0%) | 51 (100.0%) |
Household Income by Mortgage Status in Mansfield
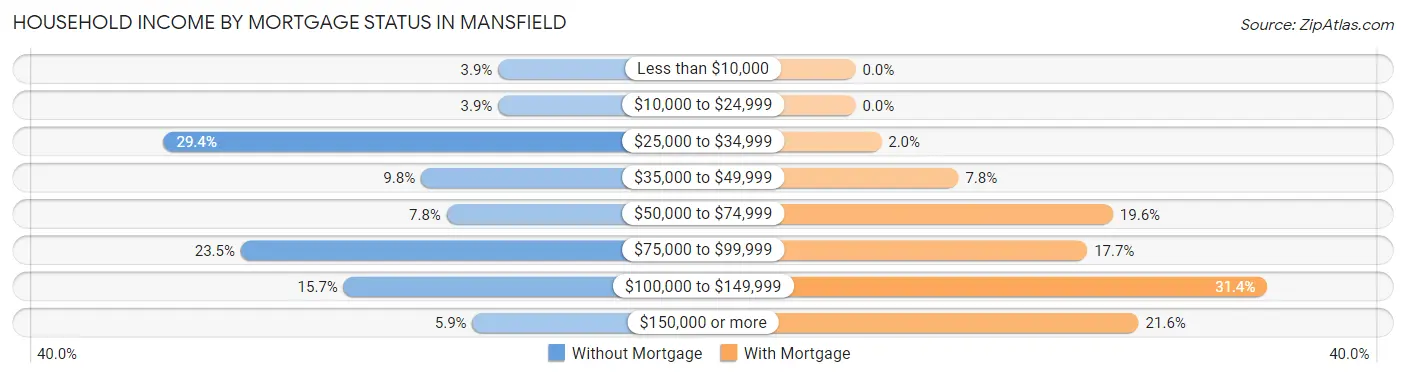
| Household Income | Without Mortgage | With Mortgage |
| Less than $10,000 | 2 (3.9%) | 0 (0.0%) |
| $10,000 to $24,999 | 2 (3.9%) | 0 (0.0%) |
| $25,000 to $34,999 | 15 (29.4%) | 1 (2.0%) |
| $35,000 to $49,999 | 5 (9.8%) | 4 (7.8%) |
| $50,000 to $74,999 | 4 (7.8%) | 10 (19.6%) |
| $75,000 to $99,999 | 12 (23.5%) | 9 (17.6%) |
| $100,000 to $149,999 | 8 (15.7%) | 16 (31.4%) |
| $150,000 or more | 3 (5.9%) | 11 (21.6%) |
| Total | 51 (100.0%) | 51 (100.0%) |
Property Value to Household Income Ratio in Mansfield
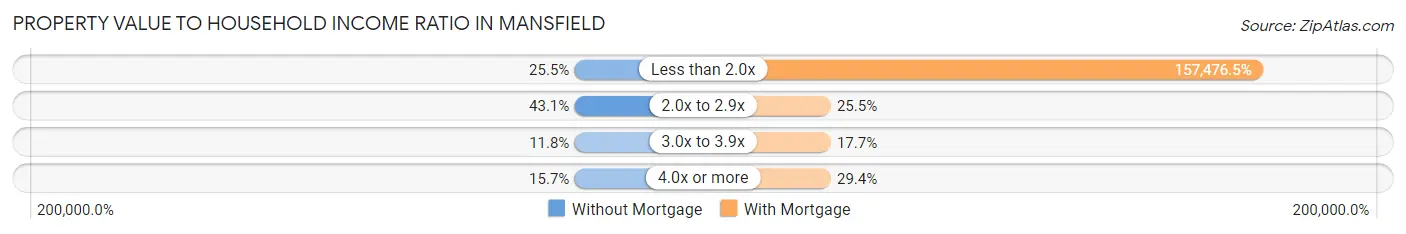
| Value-to-Income Ratio | Without Mortgage | With Mortgage |
| Less than 2.0x | 13 (25.5%) | 80,313 (157,476.5%) |
| 2.0x to 2.9x | 22 (43.1%) | 13 (25.5%) |
| 3.0x to 3.9x | 6 (11.8%) | 9 (17.6%) |
| 4.0x or more | 8 (15.7%) | 15 (29.4%) |
| Total | 51 (100.0%) | 51 (100.0%) |
Real Estate Taxes by Mortgage Status in Mansfield
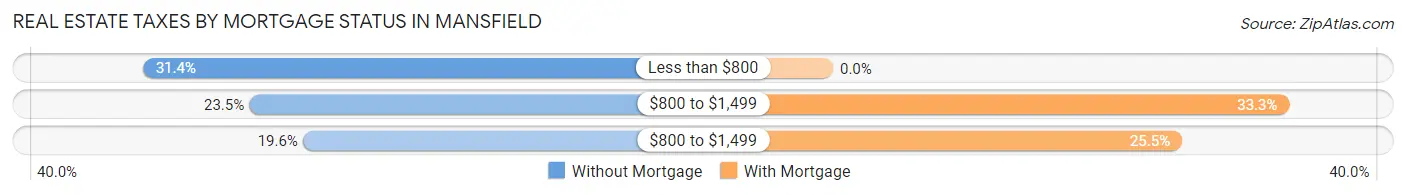
| Property Taxes | Without Mortgage | With Mortgage |
| Less than $800 | 16 (31.4%) | 0 (0.0%) |
| $800 to $1,499 | 12 (23.5%) | 17 (33.3%) |
| $800 to $1,499 | 10 (19.6%) | 13 (25.5%) |
| Total | 51 (100.0%) | 51 (100.0%) |
Health & Disability in Mansfield
Health Insurance Coverage by Age in Mansfield
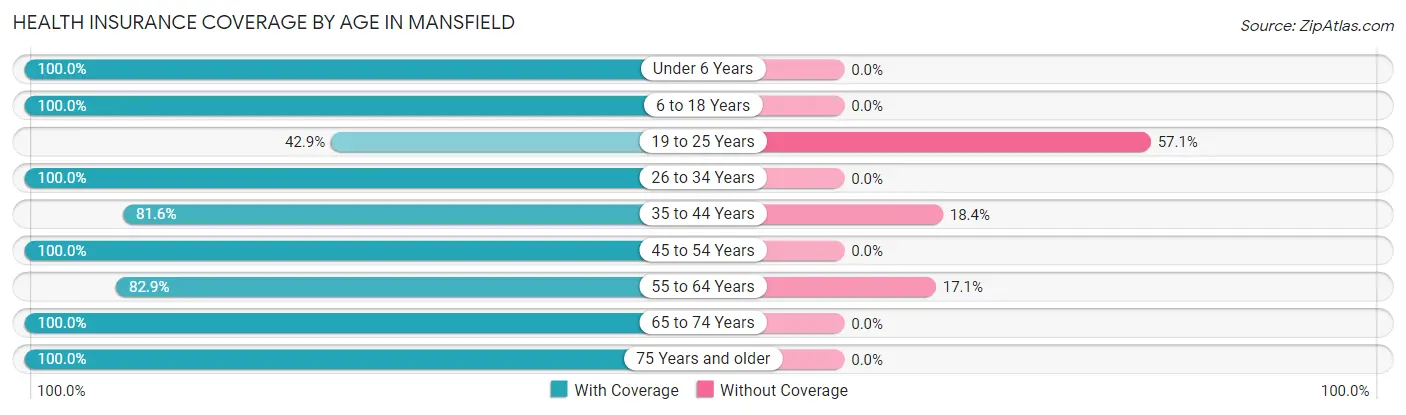
| Age Bracket | With Coverage | Without Coverage |
| Under 6 Years | 4 (100.0%) | 0 (0.0%) |
| 6 to 18 Years | 60 (100.0%) | 0 (0.0%) |
| 19 to 25 Years | 3 (42.9%) | 4 (57.1%) |
| 26 to 34 Years | 29 (100.0%) | 0 (0.0%) |
| 35 to 44 Years | 40 (81.6%) | 9 (18.4%) |
| 45 to 54 Years | 20 (100.0%) | 0 (0.0%) |
| 55 to 64 Years | 34 (82.9%) | 7 (17.1%) |
| 65 to 74 Years | 41 (100.0%) | 0 (0.0%) |
| 75 Years and older | 73 (100.0%) | 0 (0.0%) |
| Total | 304 (93.8%) | 20 (6.2%) |
Health Insurance Coverage by Citizenship Status in Mansfield
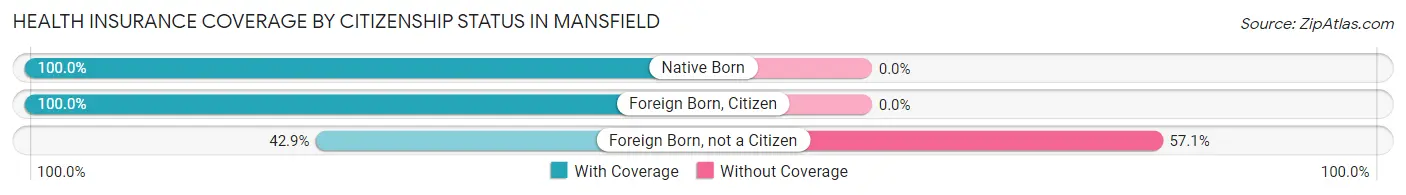
| Citizenship Status | With Coverage | Without Coverage |
| Native Born | 4 (100.0%) | 0 (0.0%) |
| Foreign Born, Citizen | 60 (100.0%) | 0 (0.0%) |
| Foreign Born, not a Citizen | 3 (42.9%) | 4 (57.1%) |
Health Insurance Coverage by Household Income in Mansfield
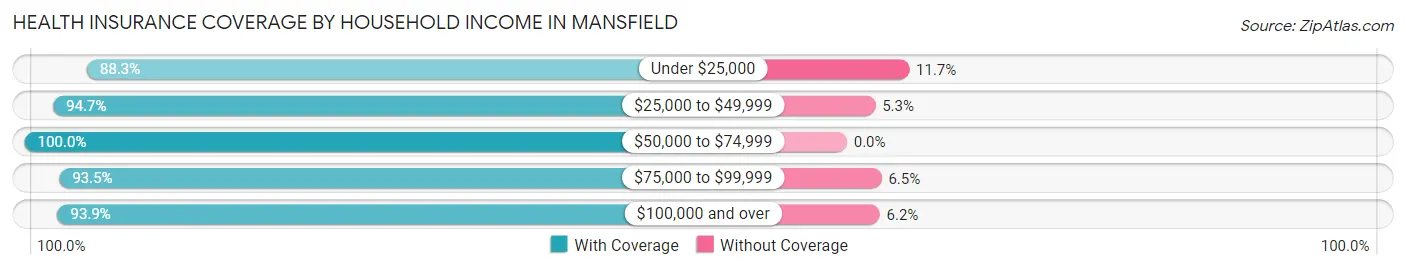
| Household Income | With Coverage | Without Coverage |
| Under $25,000 | 53 (88.3%) | 7 (11.7%) |
| $25,000 to $49,999 | 71 (94.7%) | 4 (5.3%) |
| $50,000 to $74,999 | 47 (100.0%) | 0 (0.0%) |
| $75,000 to $99,999 | 72 (93.5%) | 5 (6.5%) |
| $100,000 and over | 61 (93.9%) | 4 (6.1%) |
Public vs Private Health Insurance Coverage by Age in Mansfield
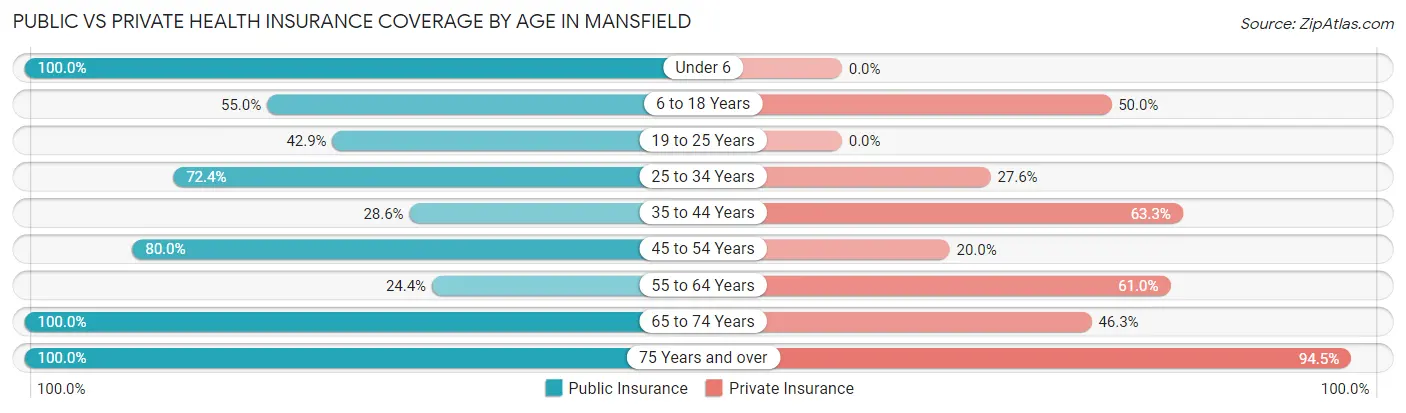
| Age Bracket | Public Insurance | Private Insurance |
| Under 6 | 4 (100.0%) | 0 (0.0%) |
| 6 to 18 Years | 33 (55.0%) | 30 (50.0%) |
| 19 to 25 Years | 3 (42.9%) | 0 (0.0%) |
| 25 to 34 Years | 21 (72.4%) | 8 (27.6%) |
| 35 to 44 Years | 14 (28.6%) | 31 (63.3%) |
| 45 to 54 Years | 16 (80.0%) | 4 (20.0%) |
| 55 to 64 Years | 10 (24.4%) | 25 (61.0%) |
| 65 to 74 Years | 41 (100.0%) | 19 (46.3%) |
| 75 Years and over | 73 (100.0%) | 69 (94.5%) |
| Total | 215 (66.4%) | 186 (57.4%) |
Disability Status by Sex by Age in Mansfield
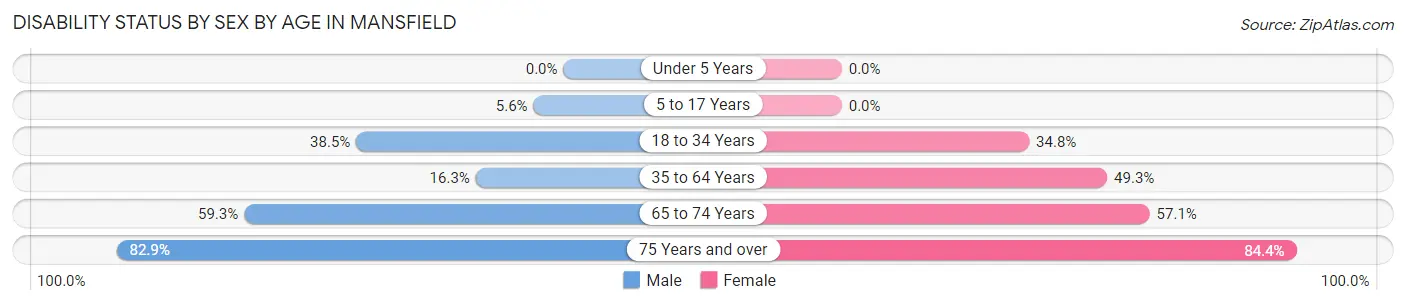
| Age Bracket | Male | Female |
| Under 5 Years | 0 (0.0%) | 0 (0.0%) |
| 5 to 17 Years | 2 (5.6%) | 0 (0.0%) |
| 18 to 34 Years | 5 (38.5%) | 8 (34.8%) |
| 35 to 64 Years | 7 (16.3%) | 33 (49.2%) |
| 65 to 74 Years | 16 (59.3%) | 8 (57.1%) |
| 75 Years and over | 34 (82.9%) | 27 (84.4%) |
Disability Class by Sex by Age in Mansfield
Disability Class: Hearing Difficulty
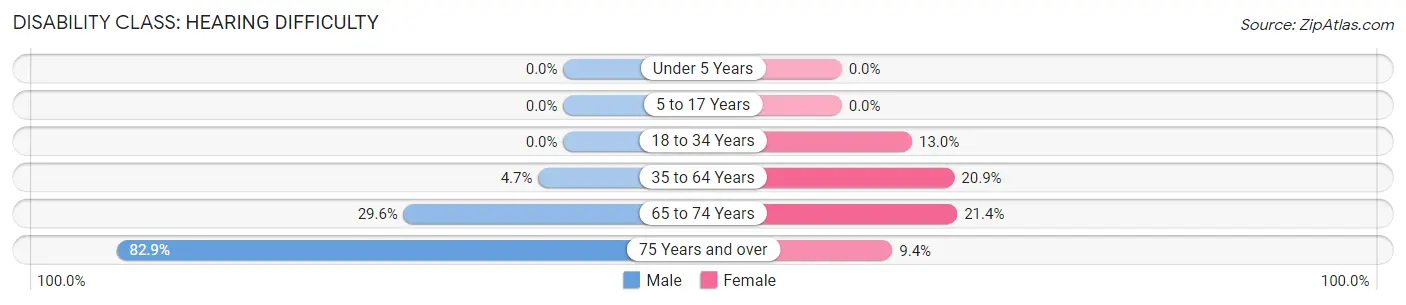
| Age Bracket | Male | Female |
| Under 5 Years | 0 (0.0%) | 0 (0.0%) |
| 5 to 17 Years | 0 (0.0%) | 0 (0.0%) |
| 18 to 34 Years | 0 (0.0%) | 3 (13.0%) |
| 35 to 64 Years | 2 (4.6%) | 14 (20.9%) |
| 65 to 74 Years | 8 (29.6%) | 3 (21.4%) |
| 75 Years and over | 34 (82.9%) | 3 (9.4%) |
Disability Class: Vision Difficulty
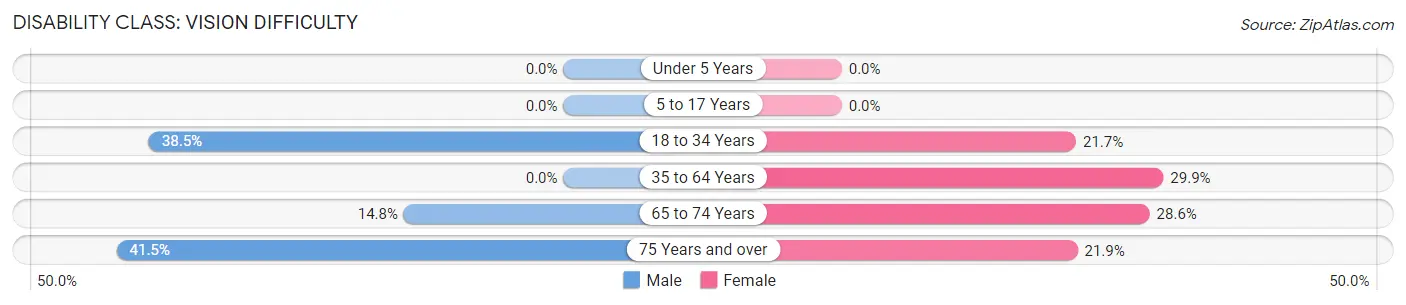
| Age Bracket | Male | Female |
| Under 5 Years | 0 (0.0%) | 0 (0.0%) |
| 5 to 17 Years | 0 (0.0%) | 0 (0.0%) |
| 18 to 34 Years | 5 (38.5%) | 5 (21.7%) |
| 35 to 64 Years | 0 (0.0%) | 20 (29.8%) |
| 65 to 74 Years | 4 (14.8%) | 4 (28.6%) |
| 75 Years and over | 17 (41.5%) | 7 (21.9%) |
Disability Class: Cognitive Difficulty
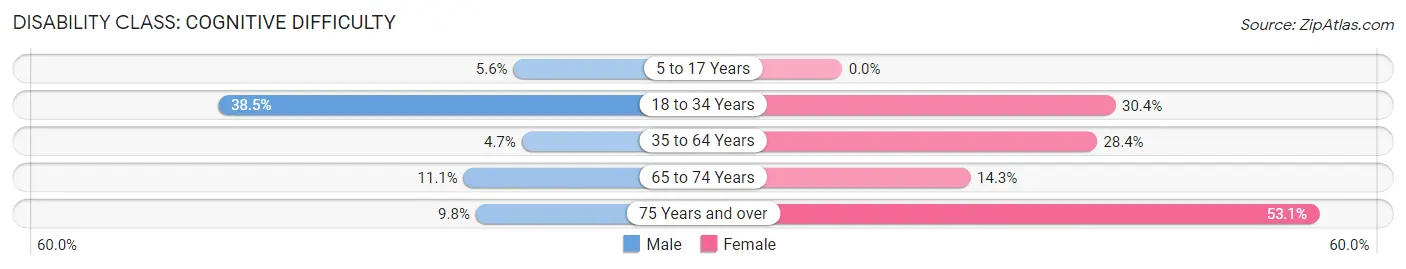
| Age Bracket | Male | Female |
| 5 to 17 Years | 2 (5.6%) | 0 (0.0%) |
| 18 to 34 Years | 5 (38.5%) | 7 (30.4%) |
| 35 to 64 Years | 2 (4.6%) | 19 (28.4%) |
| 65 to 74 Years | 3 (11.1%) | 2 (14.3%) |
| 75 Years and over | 4 (9.8%) | 17 (53.1%) |
Disability Class: Ambulatory Difficulty
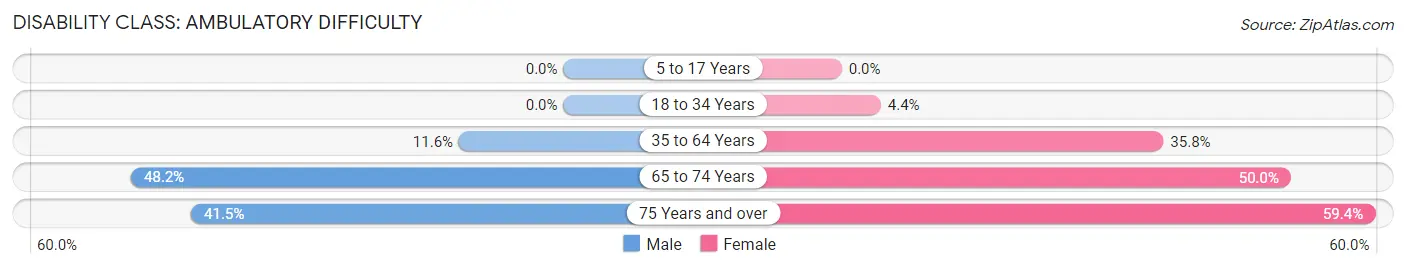
| Age Bracket | Male | Female |
| 5 to 17 Years | 0 (0.0%) | 0 (0.0%) |
| 18 to 34 Years | 0 (0.0%) | 1 (4.3%) |
| 35 to 64 Years | 5 (11.6%) | 24 (35.8%) |
| 65 to 74 Years | 13 (48.1%) | 7 (50.0%) |
| 75 Years and over | 17 (41.5%) | 19 (59.4%) |
Disability Class: Self-Care Difficulty
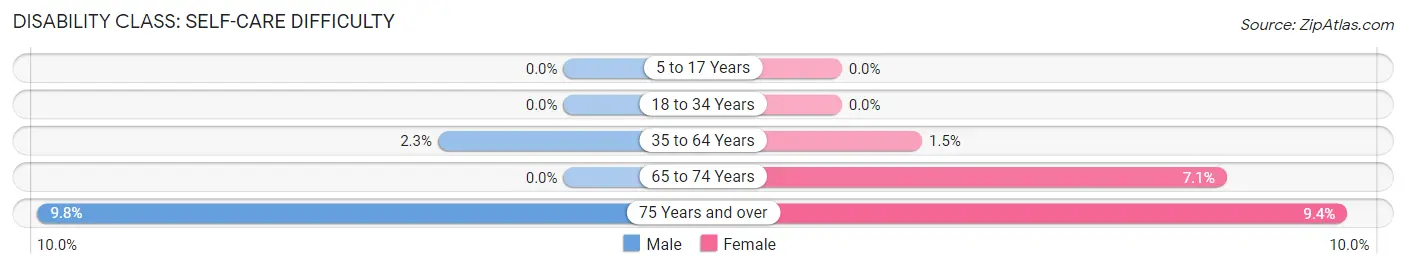
| Age Bracket | Male | Female |
| 5 to 17 Years | 0 (0.0%) | 0 (0.0%) |
| 18 to 34 Years | 0 (0.0%) | 0 (0.0%) |
| 35 to 64 Years | 1 (2.3%) | 1 (1.5%) |
| 65 to 74 Years | 0 (0.0%) | 1 (7.1%) |
| 75 Years and over | 4 (9.8%) | 3 (9.4%) |
Technology Access in Mansfield
Computing Device Access in Mansfield
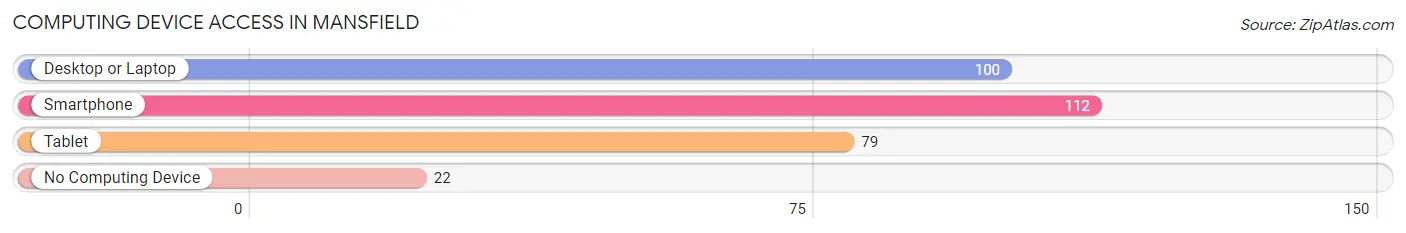
| Device Type | # Households | % Households |
| Desktop or Laptop | 100 | 64.1% |
| Smartphone | 112 | 71.8% |
| Tablet | 79 | 50.6% |
| No Computing Device | 22 | 14.1% |
| Total | 156 | 100.0% |
Internet Access in Mansfield
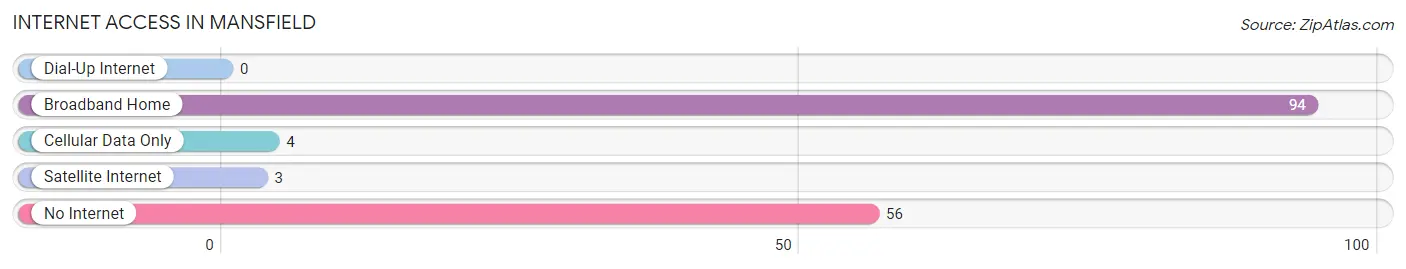
| Internet Type | # Households | % Households |
| Dial-Up Internet | 0 | 0.0% |
| Broadband Home | 94 | 60.3% |
| Cellular Data Only | 4 | 2.6% |
| Satellite Internet | 3 | 1.9% |
| No Internet | 56 | 35.9% |
| Total | 156 | 100.0% |
Mansfield Summary
Mansfield is a small town located in the state of Washington, United States. It is situated in the foothills of the Cascade Mountains, approximately 30 miles east of Seattle. The town has a population of approximately 1,500 people and is part of the Seattle metropolitan area.
History
Mansfield was founded in 1891 by a group of settlers from the Midwest. The town was named after the nearby mountain, Mount Mansfield, which was named after the town of Mansfield, Ohio. The settlers were attracted to the area due to its abundance of natural resources, including timber, water, and fertile soil.
The town quickly grew and by the early 1900s, it had become a thriving logging and farming community. The town was also home to several sawmills and a large lumber mill. The town’s economy was further bolstered by the construction of a railroad line in the early 1900s, which connected Mansfield to Seattle and other nearby towns.
In the 1920s, the town began to experience a decline in its economy as the logging industry began to decline. The town’s population also began to decline as people moved away in search of better economic opportunities.
Geography
Mansfield is located in the foothills of the Cascade Mountains, approximately 30 miles east of Seattle. The town is situated at an elevation of 1,000 feet and is surrounded by lush forests and rolling hills. The town is located in the Snoqualmie Valley, which is known for its picturesque scenery and abundant wildlife.
The town is located near several rivers, including the Snoqualmie River, the Skykomish River, and the Tolt River. The town is also located near several lakes, including Lake Sammamish, Lake Washington, and Lake Stevens.
Economy
Mansfield’s economy is largely based on tourism and agriculture. The town is home to several wineries, breweries, and distilleries, which attract visitors from all over the world. The town is also home to several farms, which produce a variety of fruits and vegetables.
The town is also home to several small businesses, including restaurants, shops, and galleries. The town is also home to several manufacturing companies, which produce a variety of products, including furniture, clothing, and electronics.
Demographics
As of the 2010 census, the population of Mansfield was 1,500 people. The town is predominantly white, with approximately 90% of the population identifying as Caucasian. The town is also home to a small Hispanic population, with approximately 5% of the population identifying as Hispanic or Latino.
The median household income in Mansfield is approximately $50,000, which is slightly lower than the national average. The town also has a higher than average poverty rate, with approximately 15% of the population living below the poverty line.
Conclusion
Mansfield is a small town located in the state of Washington, United States. It is situated in the foothills of the Cascade Mountains, approximately 30 miles east of Seattle. The town has a population of approximately 1,500 people and is part of the Seattle metropolitan area. The town’s economy is largely based on tourism and agriculture, and it is home to several wineries, breweries, and distilleries. The town is predominantly white, with approximately 90% of the population identifying as Caucasian. The median household income in Mansfield is approximately $50,000, which is slightly lower than the national average.
Common Questions
What is Per Capita Income in Mansfield?
Per Capita income in Mansfield is $27,799.
What is the Median Family Income in Mansfield?
Median Family Income in Mansfield is $59,792.
What is the Median Household income in Mansfield?
Median Household Income in Mansfield is $43,000.
What is Income or Wage Gap in Mansfield?
Income or Wage Gap in Mansfield is 41.4%.
Women in Mansfield earn 58.6 cents for every dollar earned by a man.
What is Family Income Deficit in Mansfield?
Family Income Deficit in Mansfield is $14,545.
Families that are below poverty line in Mansfield earn $14,545 less on average than the poverty threshold level.
What is Inequality or Gini Index in Mansfield?
Inequality or Gini Index in Mansfield is 0.43.
What is the Total Population of Mansfield?
Total Population of Mansfield is 324.
What is the Total Male Population of Mansfield?
Total Male Population of Mansfield is 161.
What is the Total Female Population of Mansfield?
Total Female Population of Mansfield is 163.
What is the Ratio of Males per 100 Females in Mansfield?
There are 98.77 Males per 100 Females in Mansfield.
What is the Ratio of Females per 100 Males in Mansfield?
There are 101.24 Females per 100 Males in Mansfield.
What is the Median Population Age in Mansfield?
Median Population Age in Mansfield is 46.8 Years.
What is the Average Family Size in Mansfield
Average Family Size in Mansfield is 2.6 People.
What is the Average Household Size in Mansfield
Average Household Size in Mansfield is 2.1 People.
How Large is the Labor Force in Mansfield?
There are 99 People in the Labor Forcein in Mansfield.
What is the Percentage of People in the Labor Force in Mansfield?
37.4% of People are in the Labor Force in Mansfield.
What is the Unemployment Rate in Mansfield?
Unemployment Rate in Mansfield is 4.0%.