Longbranch, WA Map & Demographics
Longbranch Map
Longbranch Overview
$59,476
PER CAPITA INCOME
$91,422
AVG FAMILY INCOME
$91,563
AVG HOUSEHOLD INCOME
41.4%
WAGE / INCOME GAP [ % ]
58.6¢/ $1
WAGE / INCOME GAP [ $ ]
0.49
INEQUALITY / GINI INDEX
4,081
TOTAL POPULATION
2,190
MALE POPULATION
1,891
FEMALE POPULATION
115.81
MALES / 100 FEMALES
86.35
FEMALES / 100 MALES
53.2
MEDIAN AGE
2.5
AVG FAMILY SIZE
2.1
AVG HOUSEHOLD SIZE
1,959
LABOR FORCE [ PEOPLE ]
54.0%
PERCENT IN LABOR FORCE
3.9%
UNEMPLOYMENT RATE
Longbranch Zip Codes
Longbranch Area Codes
Income in Longbranch
Income Overview in Longbranch
Per Capita Income in Longbranch is $59,476, while median incomes of families and households are $91,422 and $91,563 respectively.
| Characteristic | Number | Measure |
| Per Capita Income | 4,081 | $59,476 |
| Median Family Income | 1,233 | $91,422 |
| Mean Family Income | 1,233 | $141,914 |
| Median Household Income | 1,916 | $91,563 |
| Mean Household Income | 1,916 | $127,015 |
| Income Deficit | 1,233 | $0 |
| Wage / Income Gap (%) | 4,081 | 41.35% |
| Wage / Income Gap ($) | 4,081 | 58.65¢ per $1 |
| Gini / Inequality Index | 4,081 | 0.49 |
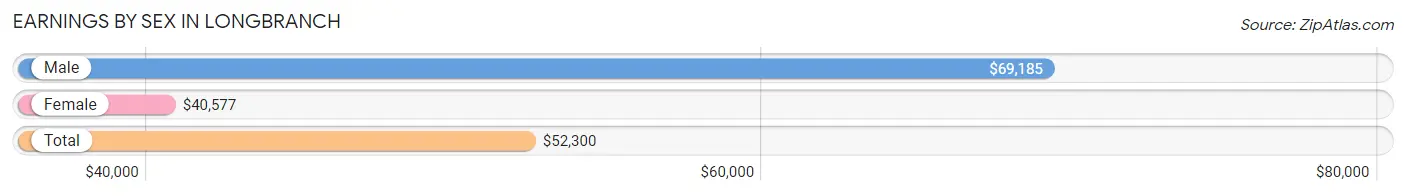
Earnings by Sex in Longbranch
Average Earnings in Longbranch are $52,300, $69,185 for men and $40,577 for women, a difference of 41.3%.
| Sex | Number | Average Earnings |
| Male | 1,069 (52.4%) | $69,185 |
| Female | 970 (47.6%) | $40,577 |
| Total | 2,039 (100.0%) | $52,300 |
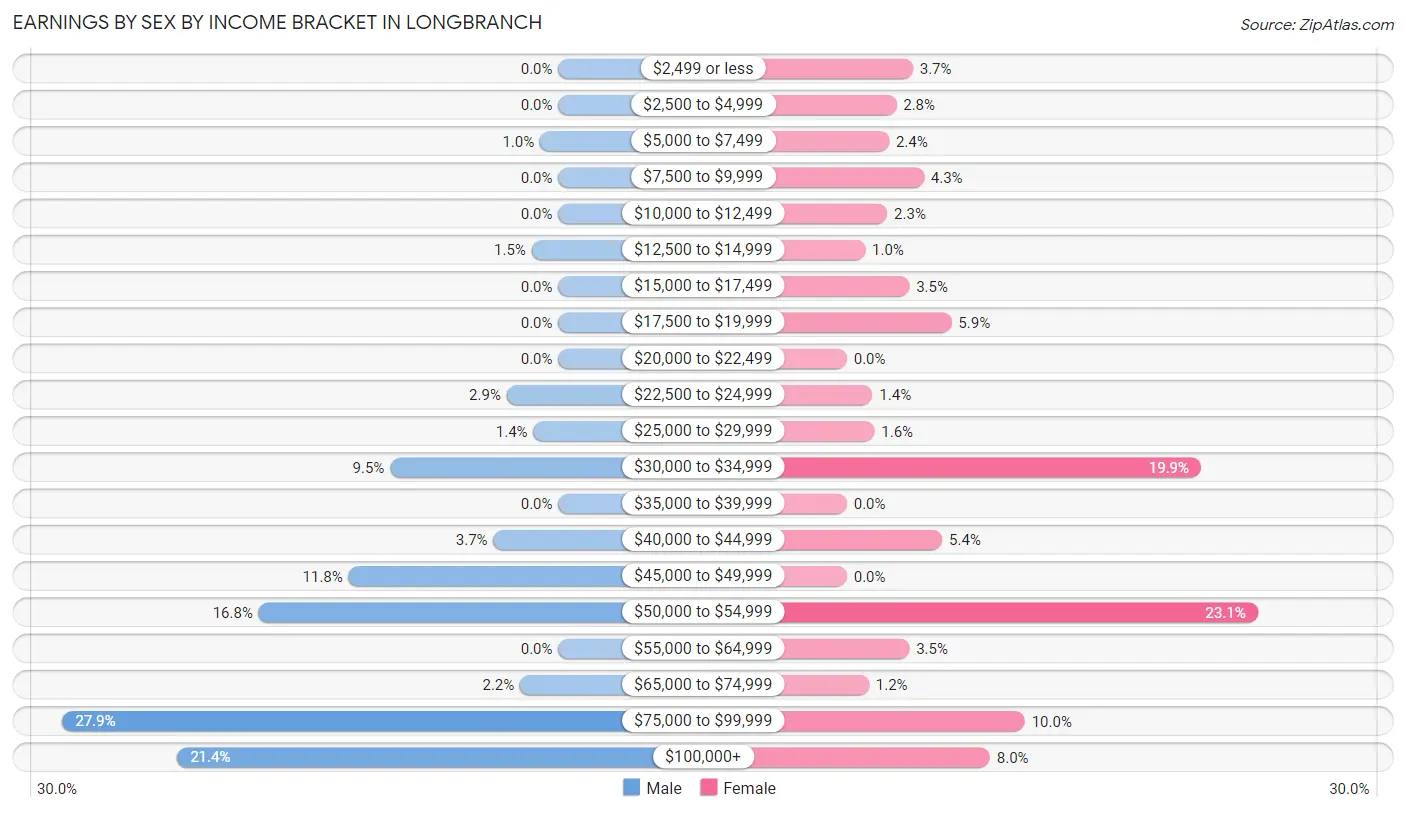
Earnings by Sex by Income Bracket in Longbranch
The most common earnings brackets in Longbranch are $75,000 to $99,999 for men (298 | 27.9%) and $50,000 to $54,999 for women (224 | 23.1%).
| Income | Male | Female |
| $2,499 or less | 0 (0.0%) | 36 (3.7%) |
| $2,500 to $4,999 | 0 (0.0%) | 27 (2.8%) |
| $5,000 to $7,499 | 11 (1.0%) | 23 (2.4%) |
| $7,500 to $9,999 | 0 (0.0%) | 42 (4.3%) |
| $10,000 to $12,499 | 0 (0.0%) | 22 (2.3%) |
| $12,500 to $14,999 | 16 (1.5%) | 10 (1.0%) |
| $15,000 to $17,499 | 0 (0.0%) | 34 (3.5%) |
| $17,500 to $19,999 | 0 (0.0%) | 57 (5.9%) |
| $20,000 to $22,499 | 0 (0.0%) | 0 (0.0%) |
| $22,500 to $24,999 | 31 (2.9%) | 14 (1.4%) |
| $25,000 to $29,999 | 15 (1.4%) | 15 (1.5%) |
| $30,000 to $34,999 | 101 (9.5%) | 193 (19.9%) |
| $35,000 to $39,999 | 0 (0.0%) | 0 (0.0%) |
| $40,000 to $44,999 | 39 (3.6%) | 52 (5.4%) |
| $45,000 to $49,999 | 126 (11.8%) | 0 (0.0%) |
| $50,000 to $54,999 | 180 (16.8%) | 224 (23.1%) |
| $55,000 to $64,999 | 0 (0.0%) | 34 (3.5%) |
| $65,000 to $74,999 | 23 (2.1%) | 12 (1.2%) |
| $75,000 to $99,999 | 298 (27.9%) | 97 (10.0%) |
| $100,000+ | 229 (21.4%) | 78 (8.0%) |
| Total | 1,069 (100.0%) | 970 (100.0%) |
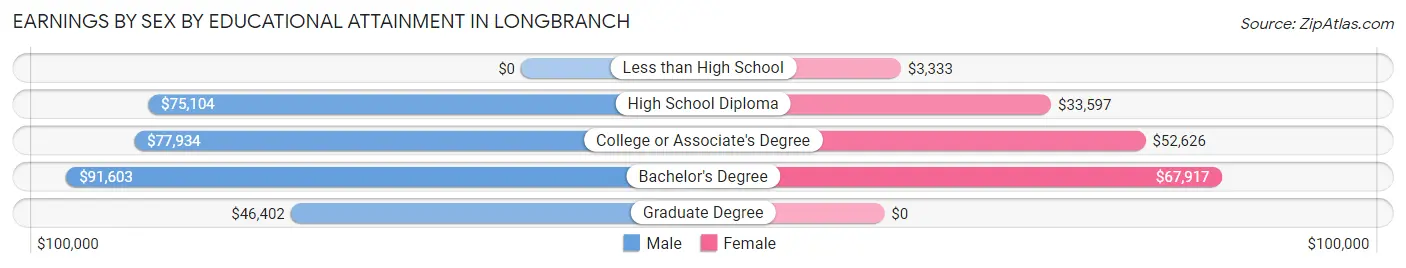
Earnings by Sex by Educational Attainment in Longbranch
Average earnings in Longbranch are $69,185 for men and $40,577 for women, a difference of 41.3%. Men with an educational attainment of bachelor's degree enjoy the highest average annual earnings of $91,603, while those with graduate degree education earn the least with $46,402. Women with an educational attainment of bachelor's degree earn the most with the average annual earnings of $67,917, while those with less than high school education have the smallest earnings of $3,333.
| Educational Attainment | Male Income | Female Income |
| Less than High School | - | - |
| High School Diploma | $75,104 | $33,597 |
| College or Associate's Degree | $77,934 | $52,626 |
| Bachelor's Degree | $91,603 | $67,917 |
| Graduate Degree | $46,402 | $0 |
| Total | $69,185 | $40,577 |
Family Income in Longbranch
Family Income Brackets in Longbranch
According to the Longbranch family income data, there are 256 families falling into the $75,000 to $99,999 income range, which is the most common income bracket and makes up 20.8% of all families.
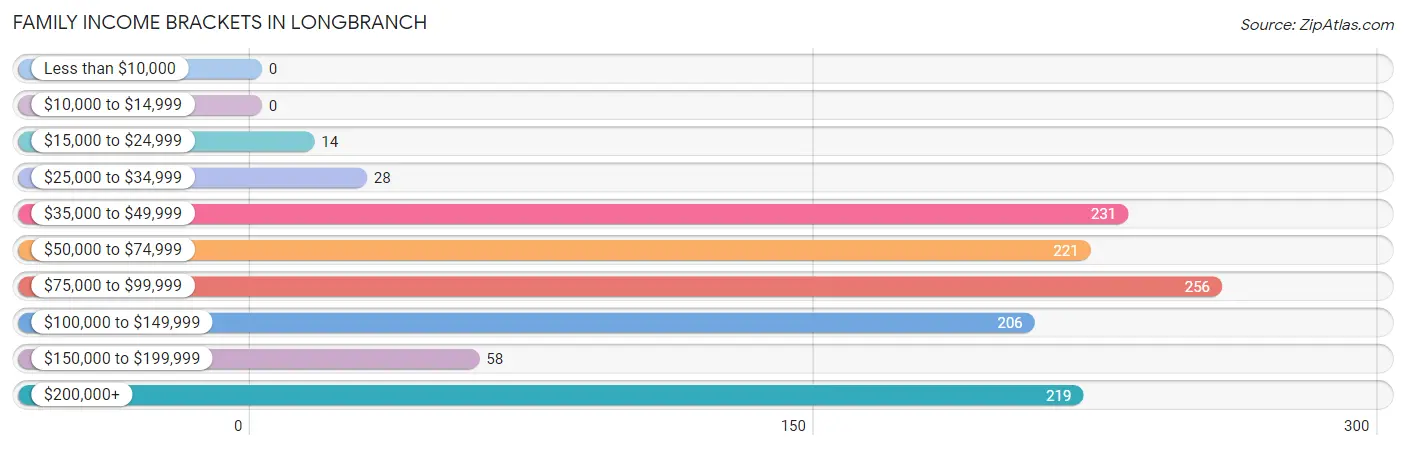
| Income Bracket | # Families | % Families |
| Less than $10,000 | 0 | 0.0% |
| $10,000 to $14,999 | 0 | 0.0% |
| $15,000 to $24,999 | 14 | 1.1% |
| $25,000 to $34,999 | 28 | 2.3% |
| $35,000 to $49,999 | 231 | 18.7% |
| $50,000 to $74,999 | 221 | 17.9% |
| $75,000 to $99,999 | 256 | 20.8% |
| $100,000 to $149,999 | 206 | 16.7% |
| $150,000 to $199,999 | 58 | 4.7% |
| $200,000+ | 219 | 17.8% |
Family Income by Famaliy Size in Longbranch
3-person families (245 | 19.9%) account for the highest median family income in Longbranch with $93,168 per family, while 2-person families (834 | 67.6%) have the highest median income of $43,314 per family member.
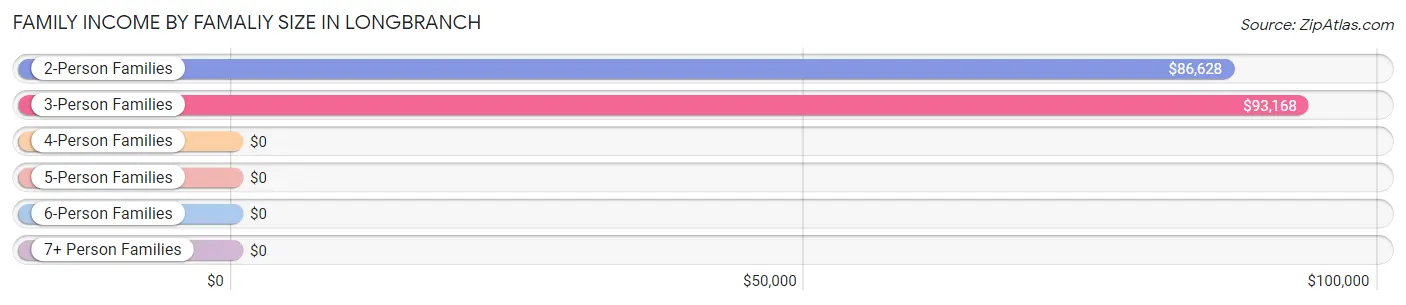
| Income Bracket | # Families | Median Income |
| 2-Person Families | 834 (67.6%) | $86,628 |
| 3-Person Families | 245 (19.9%) | $93,168 |
| 4-Person Families | 63 (5.1%) | $0 |
| 5-Person Families | 57 (4.6%) | $0 |
| 6-Person Families | 34 (2.8%) | $0 |
| 7+ Person Families | 0 (0.0%) | $0 |
| Total | 1,233 (100.0%) | $91,422 |
Family Income by Number of Earners in Longbranch
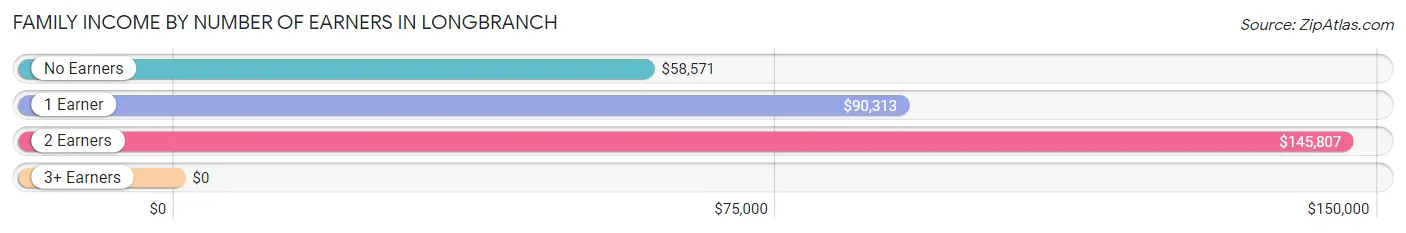
| Number of Earners | # Families | Median Income |
| No Earners | 400 (32.4%) | $58,571 |
| 1 Earner | 338 (27.4%) | $90,313 |
| 2 Earners | 495 (40.2%) | $145,807 |
| 3+ Earners | 0 (0.0%) | $0 |
| Total | 1,233 (100.0%) | $91,422 |
Household Income in Longbranch
Household Income Brackets in Longbranch
With 423 households falling in the category, the $100,000 to $149,999 income range is the most frequent in Longbranch, accounting for 22.1% of all households.
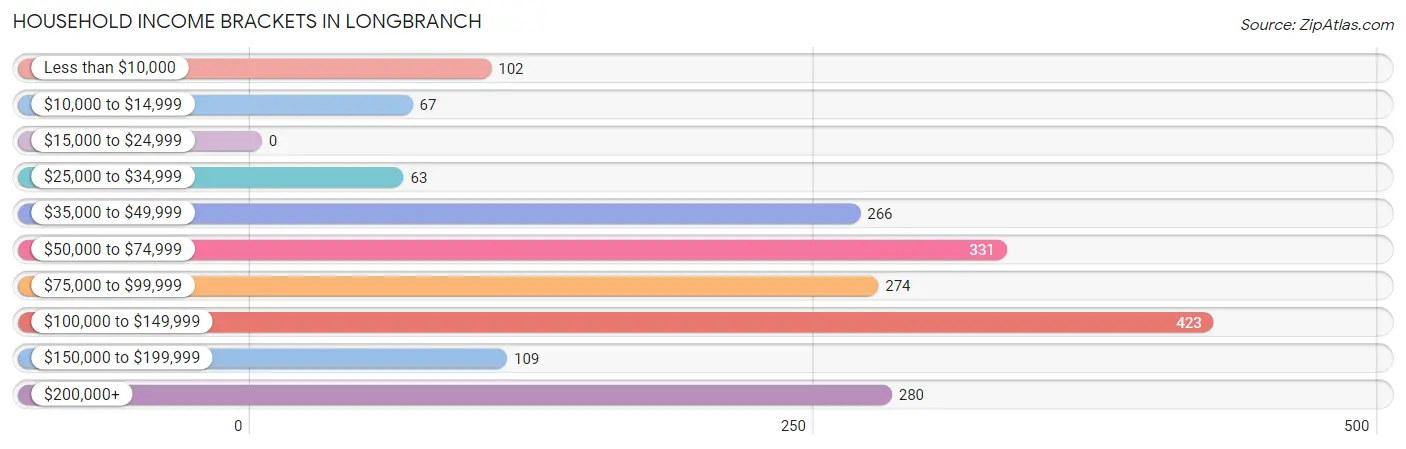
| Income Bracket | # Households | % Households |
| Less than $10,000 | 102 | 5.3% |
| $10,000 to $14,999 | 67 | 3.5% |
| $15,000 to $24,999 | 0 | 0.0% |
| $25,000 to $34,999 | 63 | 3.3% |
| $35,000 to $49,999 | 266 | 13.9% |
| $50,000 to $74,999 | 331 | 17.3% |
| $75,000 to $99,999 | 274 | 14.3% |
| $100,000 to $149,999 | 423 | 22.1% |
| $150,000 to $199,999 | 109 | 5.7% |
| $200,000+ | 280 | 14.6% |
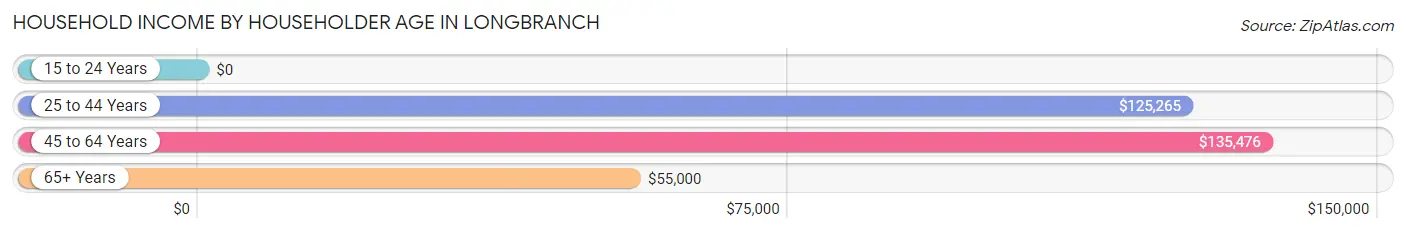
Household Income by Householder Age in Longbranch
The median household income in Longbranch is $91,563, with the highest median household income of $135,476 found in the 45 to 64 years age bracket for the primary householder. A total of 614 households (32.1%) fall into this category.
| Income Bracket | # Households | Median Income |
| 15 to 24 Years | 0 (0.0%) | $0 |
| 25 to 44 Years | 498 (26.0%) | $125,265 |
| 45 to 64 Years | 614 (32.1%) | $135,476 |
| 65+ Years | 804 (42.0%) | $55,000 |
| Total | 1,916 (100.0%) | $91,563 |
Poverty in Longbranch
Income Below Poverty by Sex and Age in Longbranch
With 5.7% poverty level for males and 5.7% for females among the residents of Longbranch, 65 to 74 year old males and 45 to 54 year old females are the most vulnerable to poverty, with 114 males (18.3%) and 42 females (15.8%) in their respective age groups living below the poverty level.
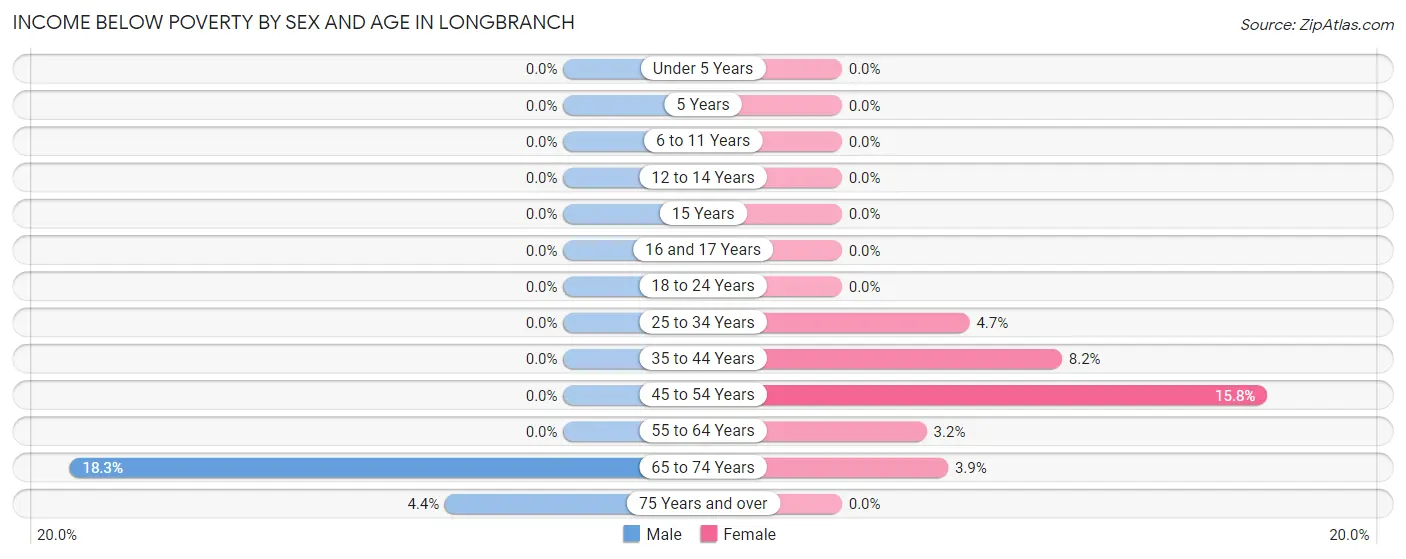
| Age Bracket | Male | Female |
| Under 5 Years | 0 (0.0%) | 0 (0.0%) |
| 5 Years | 0 (0.0%) | 0 (0.0%) |
| 6 to 11 Years | 0 (0.0%) | 0 (0.0%) |
| 12 to 14 Years | 0 (0.0%) | 0 (0.0%) |
| 15 Years | 0 (0.0%) | 0 (0.0%) |
| 16 and 17 Years | 0 (0.0%) | 0 (0.0%) |
| 18 to 24 Years | 0 (0.0%) | 0 (0.0%) |
| 25 to 34 Years | 0 (0.0%) | 22 (4.7%) |
| 35 to 44 Years | 0 (0.0%) | 17 (8.2%) |
| 45 to 54 Years | 0 (0.0%) | 42 (15.8%) |
| 55 to 64 Years | 0 (0.0%) | 13 (3.2%) |
| 65 to 74 Years | 114 (18.3%) | 13 (3.9%) |
| 75 Years and over | 10 (4.4%) | 0 (0.0%) |
| Total | 124 (5.7%) | 107 (5.7%) |
Income Above Poverty by Sex and Age in Longbranch
According to the poverty statistics in Longbranch, males aged under 5 years and females aged 6 to 11 years are the age groups that are most secure financially, with 100.0% of males and 100.0% of females in these age groups living above the poverty line.
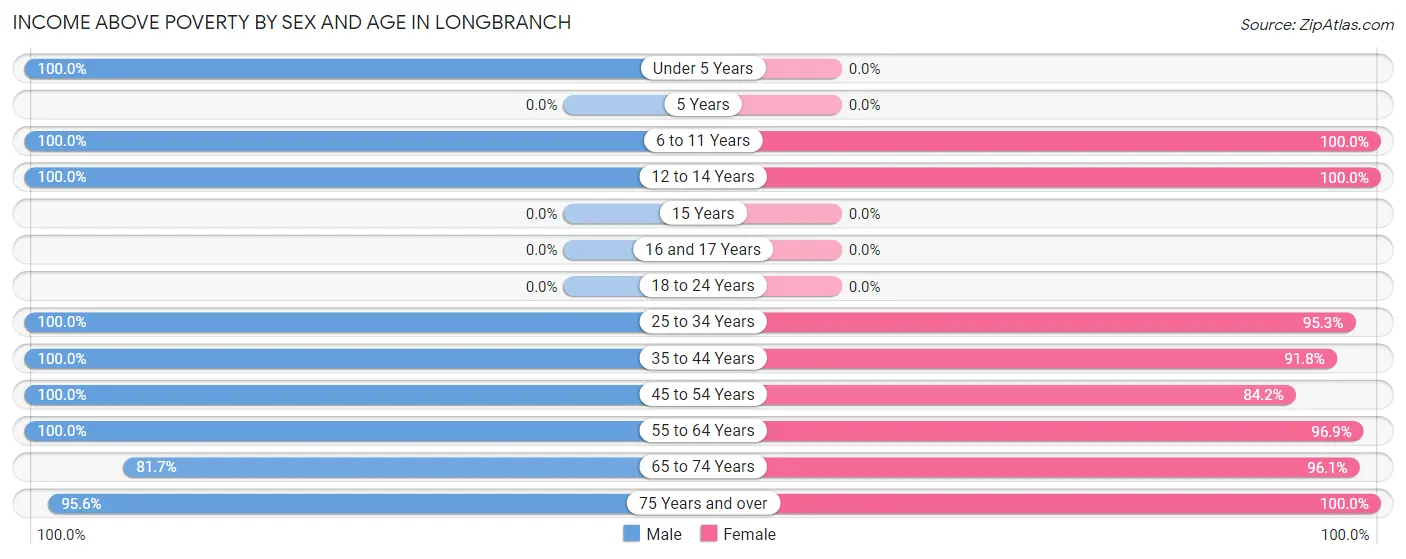
| Age Bracket | Male | Female |
| Under 5 Years | 84 (100.0%) | 0 (0.0%) |
| 5 Years | 0 (0.0%) | 0 (0.0%) |
| 6 to 11 Years | 112 (100.0%) | 82 (100.0%) |
| 12 to 14 Years | 114 (100.0%) | 61 (100.0%) |
| 15 Years | 0 (0.0%) | 0 (0.0%) |
| 16 and 17 Years | 0 (0.0%) | 0 (0.0%) |
| 18 to 24 Years | 0 (0.0%) | 0 (0.0%) |
| 25 to 34 Years | 405 (100.0%) | 442 (95.3%) |
| 35 to 44 Years | 250 (100.0%) | 191 (91.8%) |
| 45 to 54 Years | 159 (100.0%) | 224 (84.2%) |
| 55 to 64 Years | 216 (100.0%) | 400 (96.9%) |
| 65 to 74 Years | 508 (81.7%) | 317 (96.1%) |
| 75 Years and over | 218 (95.6%) | 67 (100.0%) |
| Total | 2,066 (94.3%) | 1,784 (94.3%) |
Income Below Poverty Among Married-Couple Families in Longbranch
The poverty statistics for married-couple families in Longbranch show that 1.2% or 13 of the total 1,098 families live below the poverty line. Families with no children have the highest poverty rate of 1.5%, comprising of 13 families. On the other hand, families with 1 or 2 children have the lowest poverty rate of 0.0%, which includes 0 families.
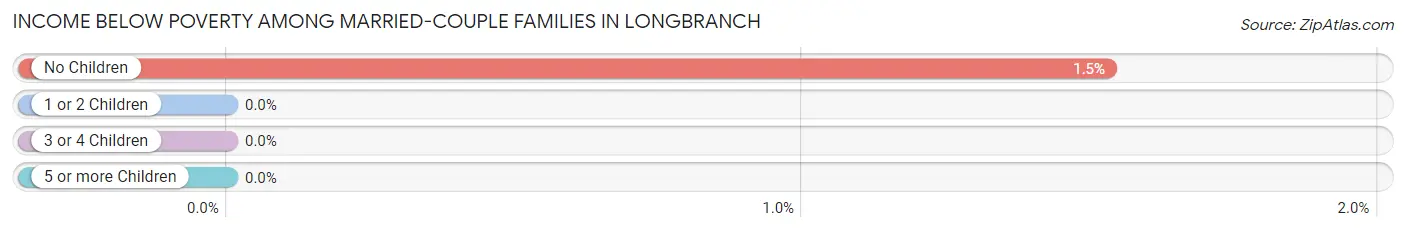
| Children | Above Poverty | Below Poverty |
| No Children | 834 (98.5%) | 13 (1.5%) |
| 1 or 2 Children | 196 (100.0%) | 0 (0.0%) |
| 3 or 4 Children | 55 (100.0%) | 0 (0.0%) |
| 5 or more Children | 0 (0.0%) | 0 (0.0%) |
| Total | 1,085 (98.8%) | 13 (1.2%) |
Income Below Poverty Among Single-Parent Households in Longbranch
| Children | Single Father | Single Mother |
| No Children | 0 (0.0%) | 0 (0.0%) |
| 1 or 2 Children | 0 (0.0%) | 0 (0.0%) |
| 3 or 4 Children | 0 (0.0%) | 0 (0.0%) |
| 5 or more Children | 0 (0.0%) | 0 (0.0%) |
| Total | 0 (0.0%) | 0 (0.0%) |
Income Below Poverty Among Married-Couple vs Single-Parent Households in Longbranch
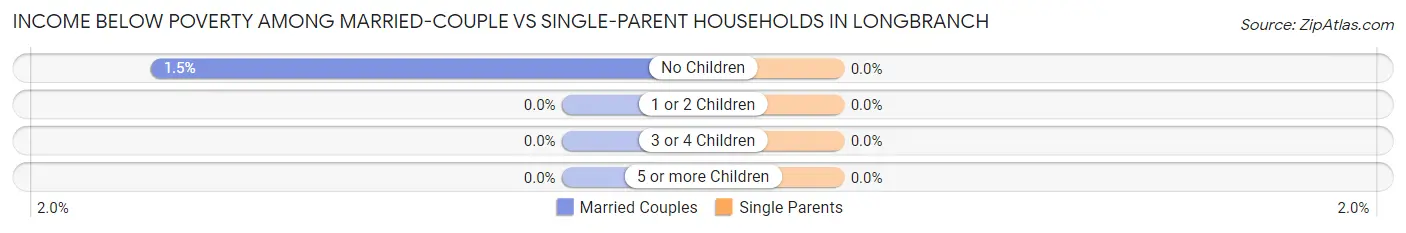
| Children | Married-Couple Families | Single-Parent Households |
| No Children | 13 (1.5%) | 0 (0.0%) |
| 1 or 2 Children | 0 (0.0%) | 0 (0.0%) |
| 3 or 4 Children | 0 (0.0%) | 0 (0.0%) |
| 5 or more Children | 0 (0.0%) | 0 (0.0%) |
| Total | 13 (1.2%) | 0 (0.0%) |
Race in Longbranch
The most populous races in Longbranch are White / Caucasian (3,258 | 79.8%), Two or more Races (515 | 12.6%), and Asian (188 | 4.6%).
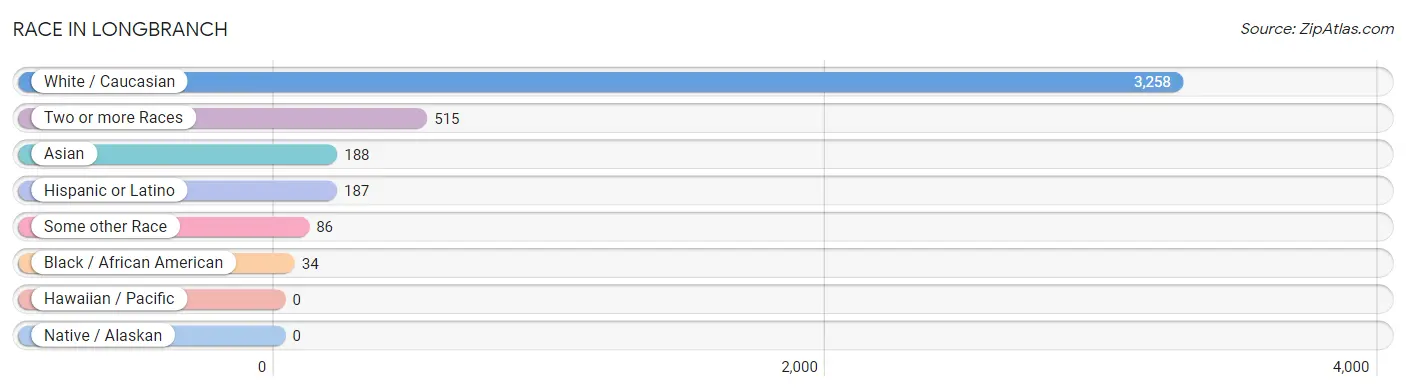
| Race | # Population | % Population |
| Asian | 188 | 4.6% |
| Black / African American | 34 | 0.8% |
| Hawaiian / Pacific | 0 | 0.0% |
| Hispanic or Latino | 187 | 4.6% |
| Native / Alaskan | 0 | 0.0% |
| White / Caucasian | 3,258 | 79.8% |
| Two or more Races | 515 | 12.6% |
| Some other Race | 86 | 2.1% |
| Total | 4,081 | 100.0% |
Ancestry in Longbranch
The most populous ancestries reported in Longbranch are German (962 | 23.6%), Irish (798 | 19.6%), English (528 | 12.9%), Swedish (251 | 6.1%), and Italian (216 | 5.3%), together accounting for 67.5% of all Longbranch residents.
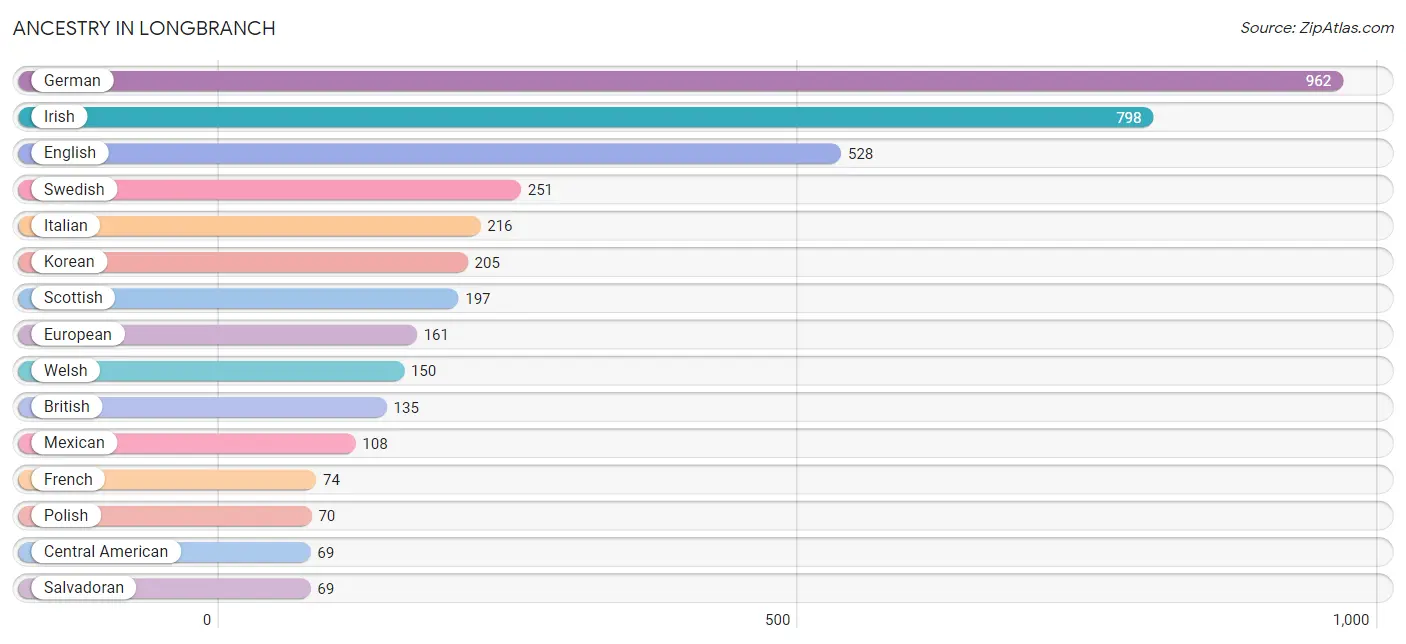
| Ancestry | # Population | % Population |
| American | 10 | 0.3% |
| Armenian | 17 | 0.4% |
| Belgian | 22 | 0.5% |
| Bhutanese | 59 | 1.5% |
| Brazilian | 19 | 0.5% |
| British | 135 | 3.3% |
| Central American | 69 | 1.7% |
| Cherokee | 14 | 0.3% |
| Danish | 17 | 0.4% |
| Delaware | 36 | 0.9% |
| Dutch | 14 | 0.3% |
| English | 528 | 12.9% |
| European | 161 | 4.0% |
| French | 74 | 1.8% |
| French Canadian | 37 | 0.9% |
| German | 962 | 23.6% |
| Greek | 31 | 0.8% |
| Hungarian | 13 | 0.3% |
| Irish | 798 | 19.6% |
| Italian | 216 | 5.3% |
| Korean | 205 | 5.0% |
| Mexican | 108 | 2.6% |
| Nigerian | 17 | 0.4% |
| Northern European | 38 | 0.9% |
| Norwegian | 27 | 0.7% |
| Polish | 70 | 1.7% |
| Salvadoran | 69 | 1.7% |
| Scandinavian | 14 | 0.3% |
| Scotch-Irish | 14 | 0.3% |
| Scottish | 197 | 4.8% |
| Spanish | 10 | 0.3% |
| Subsaharan African | 17 | 0.4% |
| Swedish | 251 | 6.1% |
| Welsh | 150 | 3.7% |
| Yugoslavian | 45 | 1.1% | View All 35 Rows |
Immigrants in Longbranch
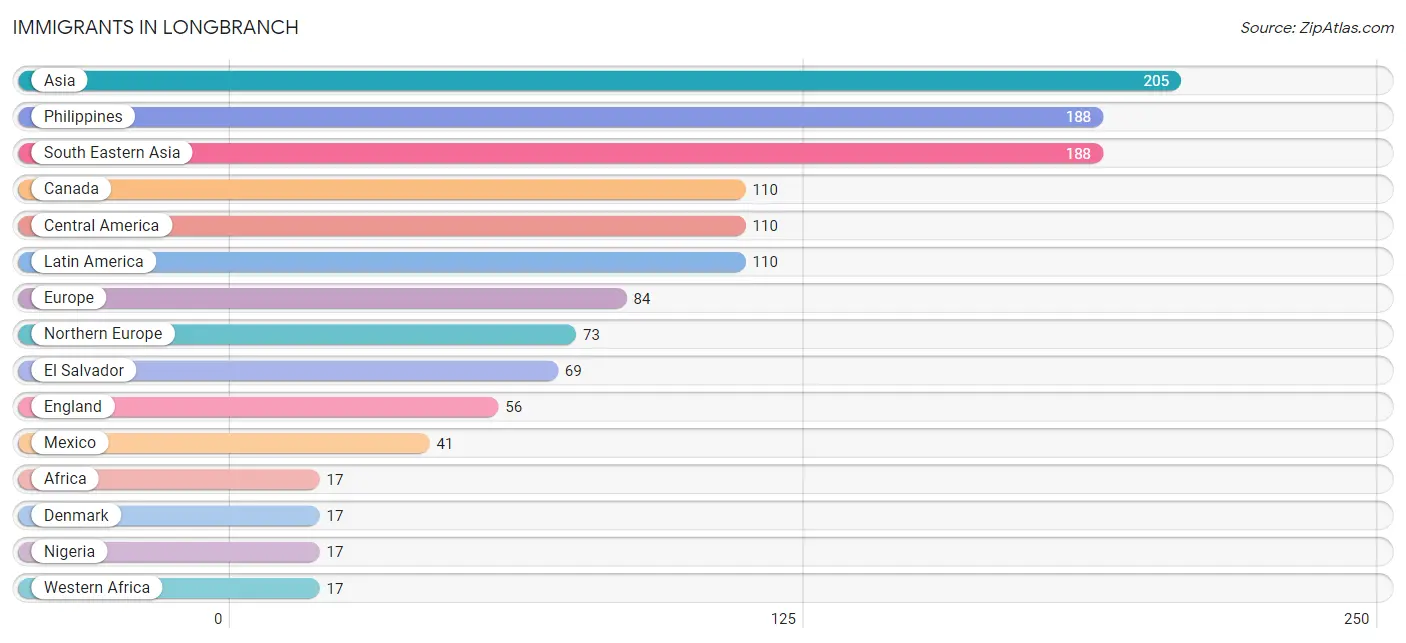
The most numerous immigrant groups reported in Longbranch came from Asia (205 | 5.0%), Philippines (188 | 4.6%), South Eastern Asia (188 | 4.6%), Canada (110 | 2.7%), and Central America (110 | 2.7%), together accounting for 19.6% of all Longbranch residents.
| Immigration Origin | # Population | % Population |
| Africa | 17 | 0.4% |
| Asia | 205 | 5.0% |
| Canada | 110 | 2.7% |
| Central America | 110 | 2.7% |
| Denmark | 17 | 0.4% |
| Eastern Europe | 11 | 0.3% |
| El Salvador | 69 | 1.7% |
| England | 56 | 1.4% |
| Europe | 84 | 2.1% |
| Latin America | 110 | 2.7% |
| Mexico | 41 | 1.0% |
| Nigeria | 17 | 0.4% |
| Northern Europe | 73 | 1.8% |
| Philippines | 188 | 4.6% |
| South Eastern Asia | 188 | 4.6% |
| Ukraine | 11 | 0.3% |
| Western Africa | 17 | 0.4% |
| Western Asia | 17 | 0.4% | View All 18 Rows |
Sex and Age in Longbranch
Sex and Age in Longbranch
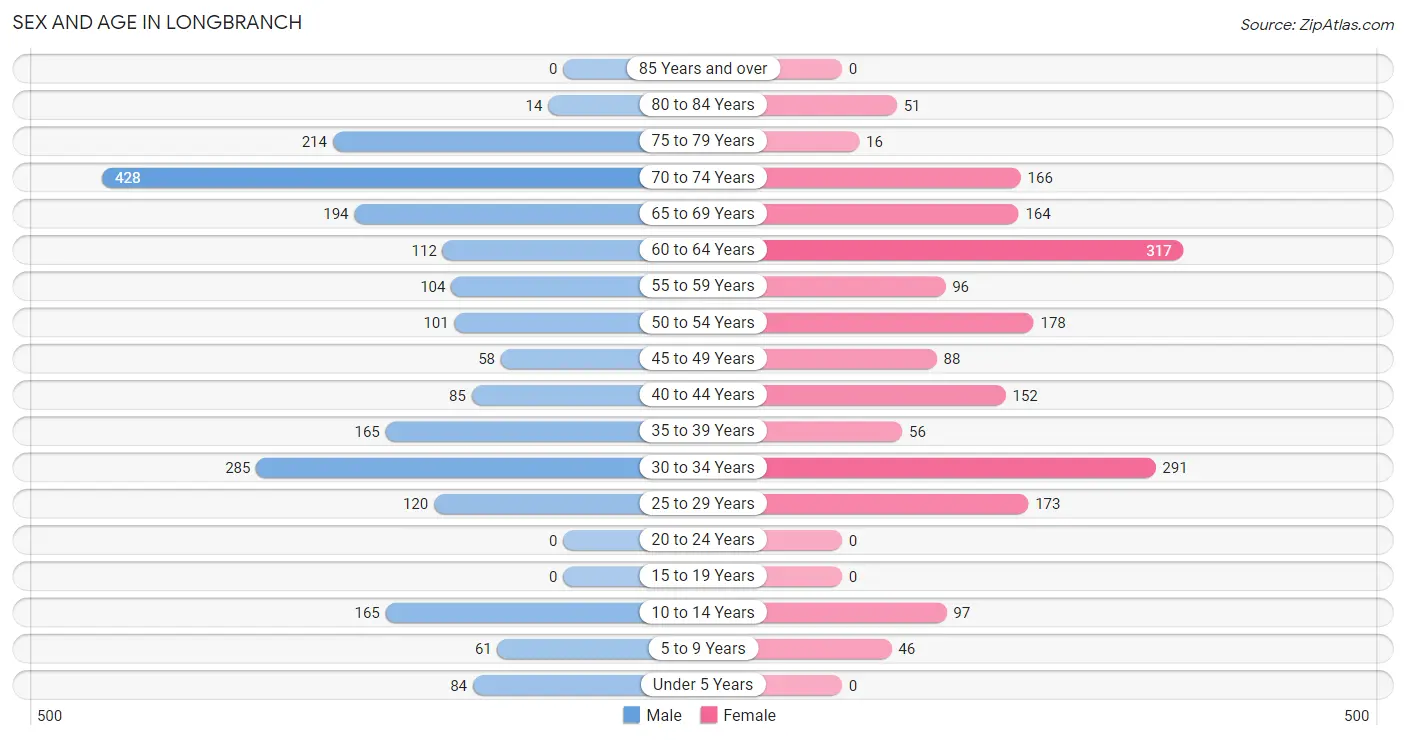
The most populous age groups in Longbranch are 70 to 74 Years (428 | 19.5%) for men and 60 to 64 Years (317 | 16.8%) for women.
| Age Bracket | Male | Female |
| Under 5 Years | 84 (3.8%) | 0 (0.0%) |
| 5 to 9 Years | 61 (2.8%) | 46 (2.4%) |
| 10 to 14 Years | 165 (7.5%) | 97 (5.1%) |
| 15 to 19 Years | 0 (0.0%) | 0 (0.0%) |
| 20 to 24 Years | 0 (0.0%) | 0 (0.0%) |
| 25 to 29 Years | 120 (5.5%) | 173 (9.1%) |
| 30 to 34 Years | 285 (13.0%) | 291 (15.4%) |
| 35 to 39 Years | 165 (7.5%) | 56 (3.0%) |
| 40 to 44 Years | 85 (3.9%) | 152 (8.0%) |
| 45 to 49 Years | 58 (2.6%) | 88 (4.6%) |
| 50 to 54 Years | 101 (4.6%) | 178 (9.4%) |
| 55 to 59 Years | 104 (4.8%) | 96 (5.1%) |
| 60 to 64 Years | 112 (5.1%) | 317 (16.8%) |
| 65 to 69 Years | 194 (8.9%) | 164 (8.7%) |
| 70 to 74 Years | 428 (19.5%) | 166 (8.8%) |
| 75 to 79 Years | 214 (9.8%) | 16 (0.9%) |
| 80 to 84 Years | 14 (0.6%) | 51 (2.7%) |
| 85 Years and over | 0 (0.0%) | 0 (0.0%) |
| Total | 2,190 (100.0%) | 1,891 (100.0%) |
Families and Households in Longbranch
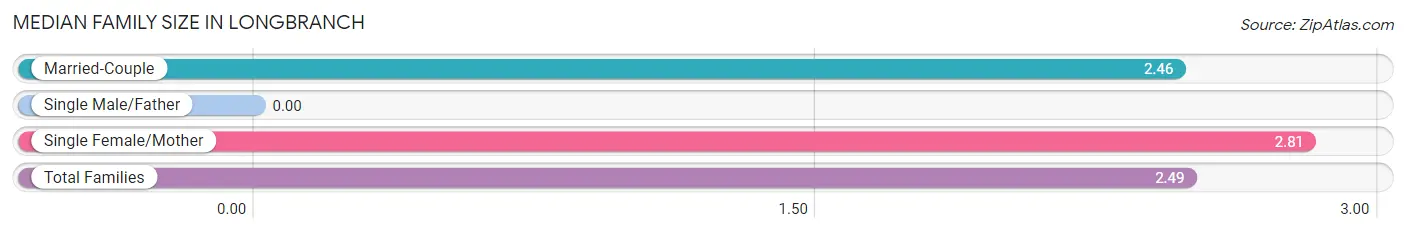
Median Family Size in Longbranch
| Family Type | # Families | Family Size |
| Married-Couple | 1,098 (89.0%) | 2.46 |
| Single Male/Father | 0 (0.0%) | - |
| Single Female/Mother | 135 (11.0%) | 2.81 |
| Total Families | 1,233 (100.0%) | 2.49 |
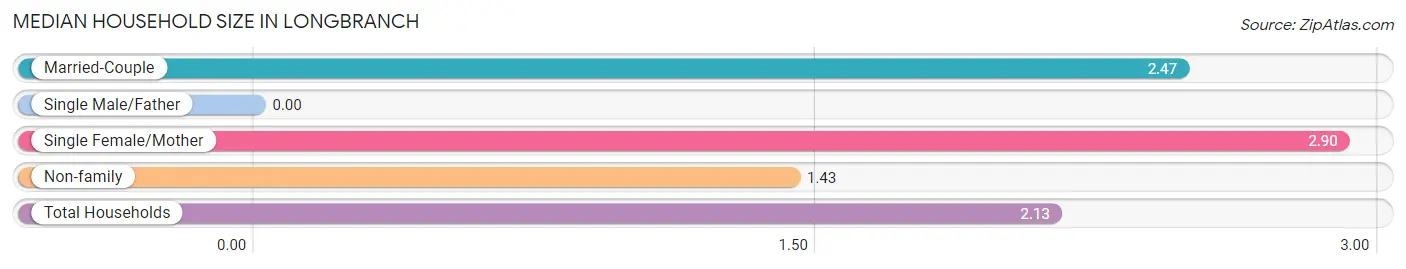
Median Household Size in Longbranch
| Household Type | # Households | Household Size |
| Married-Couple | 1,098 (57.3%) | 2.47 |
| Single Male/Father | 0 (0.0%) | - |
| Single Female/Mother | 135 (7.0%) | 2.90 |
| Non-family | 683 (35.6%) | 1.43 |
| Total Households | 1,916 (100.0%) | 2.13 |
Household Size by Marriage Status in Longbranch
Out of a total of 1,916 households in Longbranch, 1,233 (64.3%) are family households, while 683 (35.6%) are nonfamily households. The most numerous type of family households are 2-person households, comprising 821, and the most common type of nonfamily households are 1-person households, comprising 390.
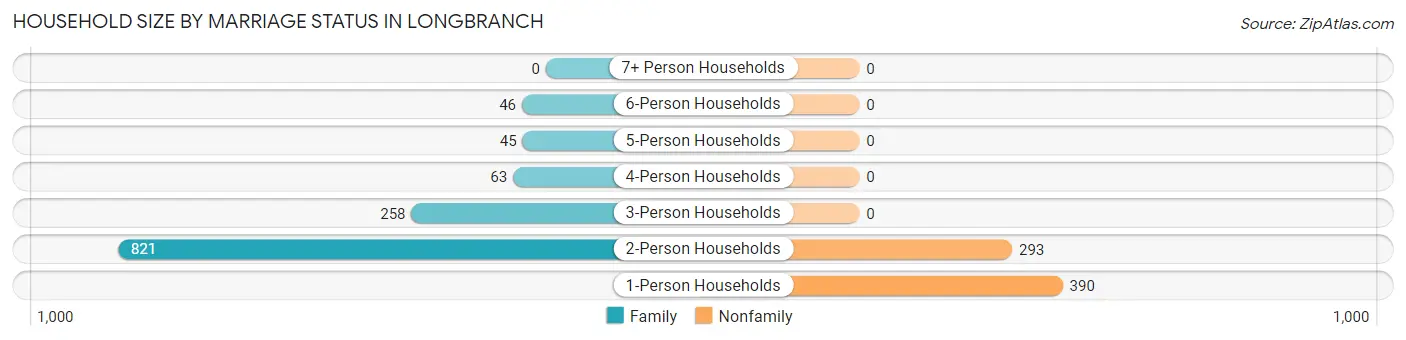
| Household Size | Family Households | Nonfamily Households |
| 1-Person Households | - | 390 (20.3%) |
| 2-Person Households | 821 (42.8%) | 293 (15.3%) |
| 3-Person Households | 258 (13.5%) | 0 (0.0%) |
| 4-Person Households | 63 (3.3%) | 0 (0.0%) |
| 5-Person Households | 45 (2.4%) | 0 (0.0%) |
| 6-Person Households | 46 (2.4%) | 0 (0.0%) |
| 7+ Person Households | 0 (0.0%) | 0 (0.0%) |
| Total | 1,233 (64.3%) | 683 (35.6%) |
Female Fertility in Longbranch
Fertility by Age in Longbranch
| Age Bracket | Women with Births | Births / 1,000 Women |
| 15 to 19 years | 0 (0.0%) | 0.0 |
| 20 to 34 years | 0 (0.0%) | 0.0 |
| 35 to 50 years | 0 (0.0%) | 0.0 |
| Total | 0 (0.0%) | 0.0 |
Fertility by Age by Marriage Status in Longbranch
| Age Bracket | Married | Unmarried |
| 15 to 19 years | 0 (0.0%) | 0 (0.0%) |
| 20 to 34 years | 0 (0.0%) | 0 (0.0%) |
| 35 to 50 years | 0 (0.0%) | 0 (0.0%) |
| Total | 0 (0.0%) | 0 (0.0%) |
Fertility by Education in Longbranch
| Educational Attainment | Women with Births | Births / 1,000 Women |
| Less than High School | 0 (0.0%) | 0.0 |
| High School Diploma | 0 (0.0%) | 0.0 |
| College or Associate's Degree | 0 (0.0%) | 0.0 |
| Bachelor's Degree | 0 (0.0%) | 0.0 |
| Graduate Degree | 0 (0.0%) | 0.0 |
| Total | 0 (0.0%) | 0.0 |
Fertility by Education by Marriage Status in Longbranch
| Educational Attainment | Married | Unmarried |
| Less than High School | 0 (0.0%) | 0 (0.0%) |
| High School Diploma | 0 (0.0%) | 0 (0.0%) |
| College or Associate's Degree | 0 (0.0%) | 0 (0.0%) |
| Bachelor's Degree | 0 (0.0%) | 0 (0.0%) |
| Graduate Degree | 0 (0.0%) | 0 (0.0%) |
| Total | 0 (0.0%) | 0 (0.0%) |
Employment Characteristics in Longbranch
Employment by Class of Employer in Longbranch
Among the 1,532 employed individuals in Longbranch, private company employees (629 | 41.1%), federal government employees (414 | 27.0%), and self-employed (not incorporated) (178 | 11.6%) make up the most common classes of employment.
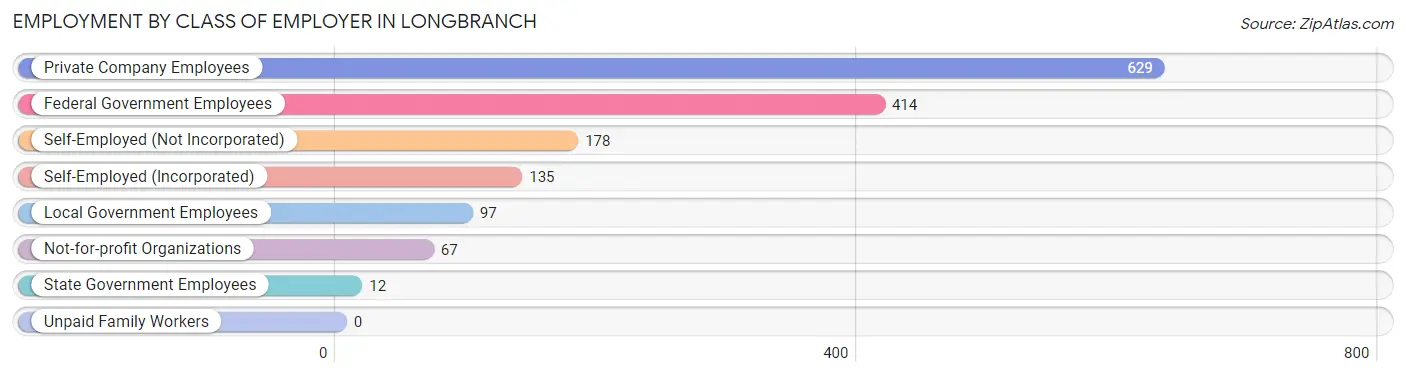
| Employer Class | # Employees | % Employees |
| Private Company Employees | 629 | 41.1% |
| Self-Employed (Incorporated) | 135 | 8.8% |
| Self-Employed (Not Incorporated) | 178 | 11.6% |
| Not-for-profit Organizations | 67 | 4.4% |
| Local Government Employees | 97 | 6.3% |
| State Government Employees | 12 | 0.8% |
| Federal Government Employees | 414 | 27.0% |
| Unpaid Family Workers | 0 | 0.0% |
| Total | 1,532 | 100.0% |
Employment Status by Age in Longbranch
According to the labor force statistics for Longbranch, out of the total population over 16 years of age (3,628), 54.0% or 1,959 individuals are in the labor force, with 3.9% or 76 of them unemployed. The age group with the highest labor force participation rate is 30 to 34 years, with 96.2% or 554 individuals in the labor force. Within the labor force, the 60 to 64 years age range has the highest percentage of unemployed individuals, with 21.3% or 50 of them being unemployed.
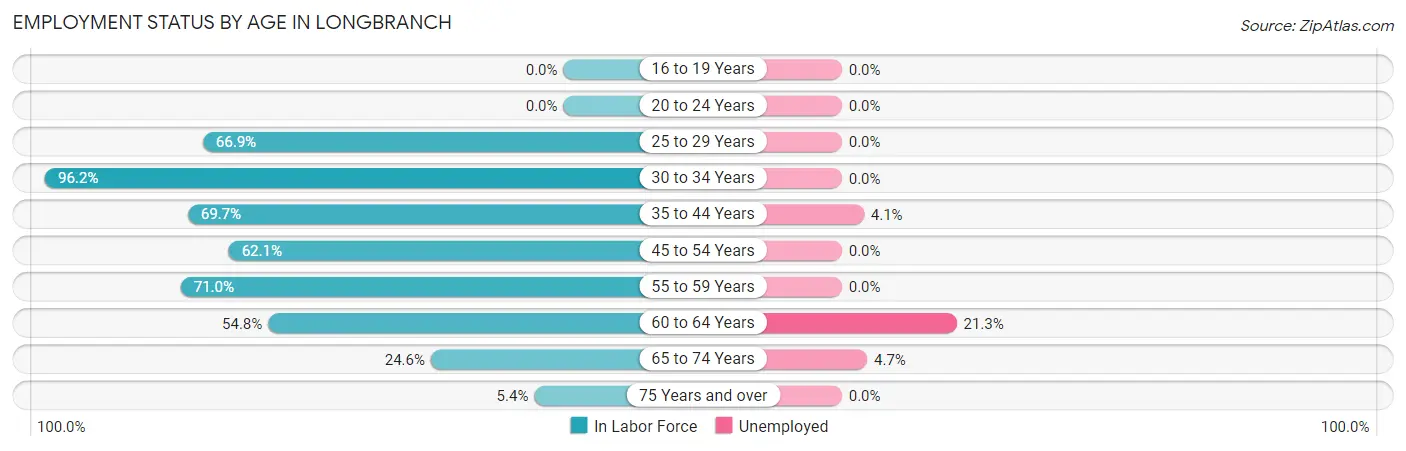
| Age Bracket | In Labor Force | Unemployed |
| 16 to 19 Years | 0 (0.0%) | 0 (0.0%) |
| 20 to 24 Years | 0 (0.0%) | 0 (0.0%) |
| 25 to 29 Years | 196 (66.9%) | 0 (0.0%) |
| 30 to 34 Years | 554 (96.2%) | 0 (0.0%) |
| 35 to 44 Years | 319 (69.7%) | 13 (4.1%) |
| 45 to 54 Years | 264 (62.1%) | 0 (0.0%) |
| 55 to 59 Years | 142 (71.0%) | 0 (0.0%) |
| 60 to 64 Years | 235 (54.8%) | 50 (21.3%) |
| 65 to 74 Years | 234 (24.6%) | 11 (4.7%) |
| 75 Years and over | 16 (5.4%) | 0 (0.0%) |
| Total | 1,959 (54.0%) | 76 (3.9%) |
Employment Status by Educational Attainment in Longbranch
According to labor force statistics for Longbranch, 71.8% of individuals (1,710) out of the total population between 25 and 64 years of age (2,381) are in the labor force, with 3.8% or 65 of them being unemployed. The group with the highest labor force participation rate are those with the educational attainment of college / associate degree, with 85.4% or 933 individuals in the labor force. Within the labor force, individuals with less than high school education have the highest percentage of unemployment, with 26.5% or 13 of them being unemployed.
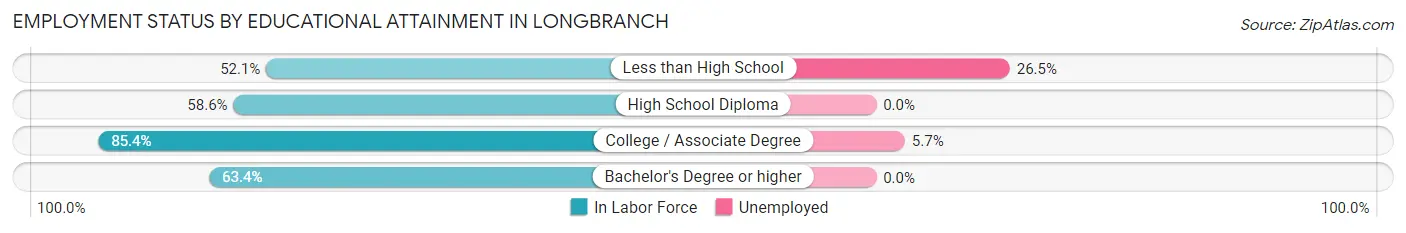
| Educational Attainment | In Labor Force | Unemployed |
| Less than High School | 49 (52.1%) | 25 (26.5%) |
| High School Diploma | 364 (58.6%) | 0 (0.0%) |
| College / Associate Degree | 933 (85.4%) | 62 (5.7%) |
| Bachelor's Degree or higher | 364 (63.4%) | 0 (0.0%) |
| Total | 1,710 (71.8%) | 90 (3.8%) |
Employment Occupations by Sex in Longbranch
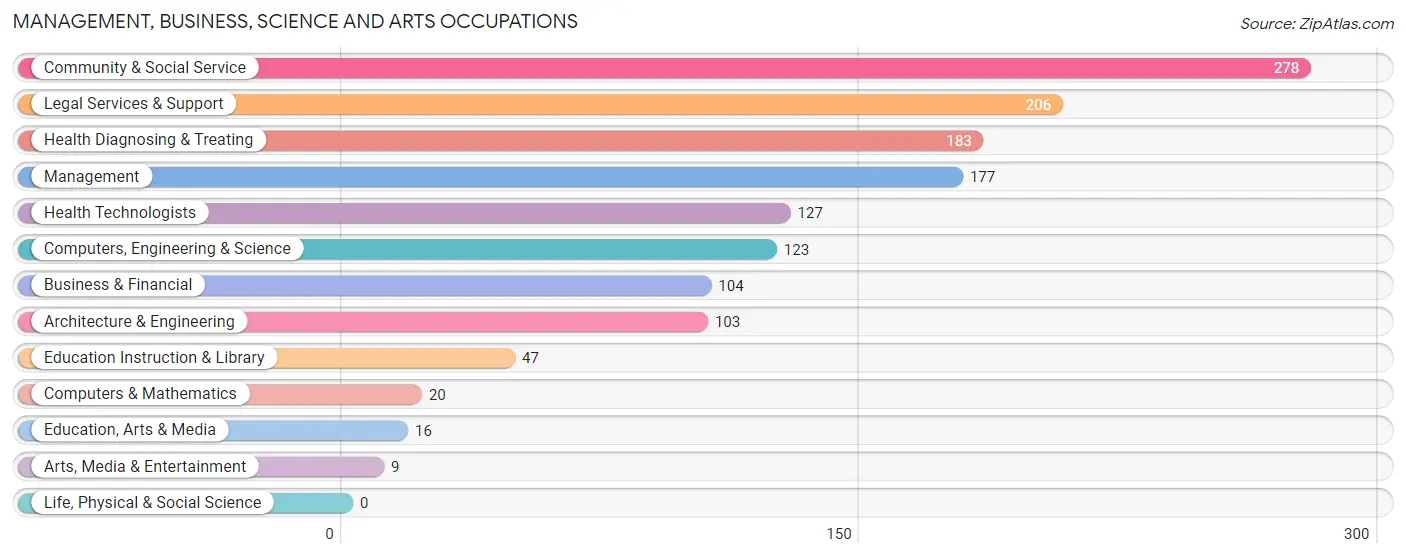
Management, Business, Science and Arts Occupations
The most common Management, Business, Science and Arts occupations in Longbranch are Community & Social Service (278 | 15.2%), Legal Services & Support (206 | 11.3%), Health Diagnosing & Treating (183 | 10.0%), Management (177 | 9.7%), and Health Technologists (127 | 7.0%).
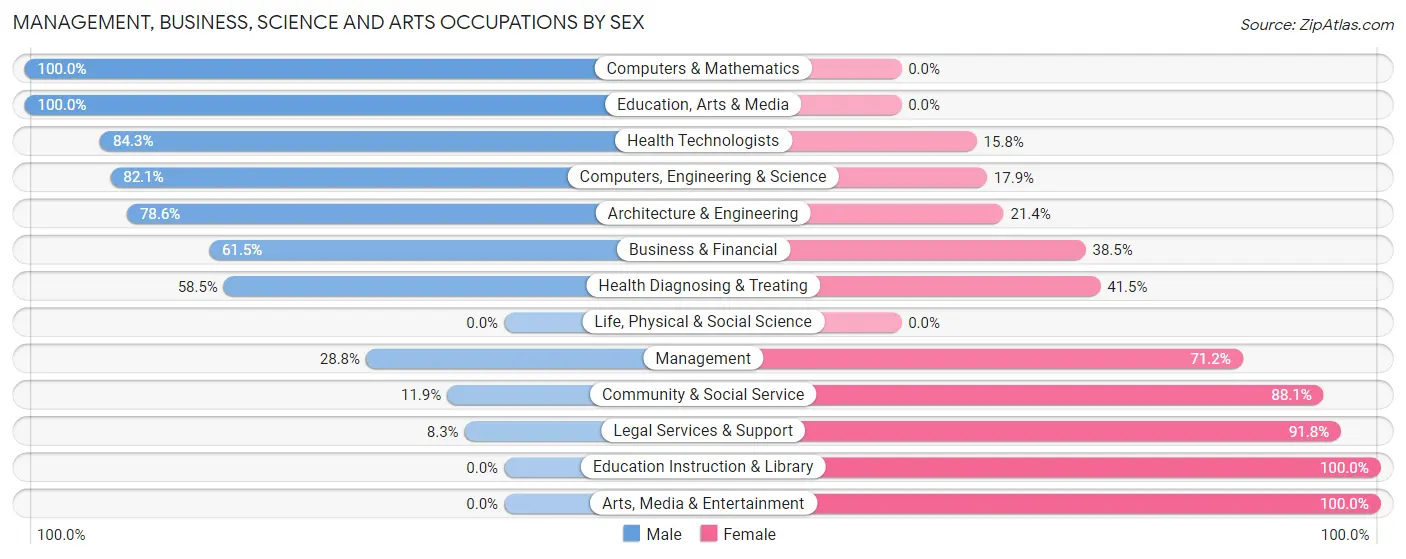
Management, Business, Science and Arts Occupations by Sex
Within the Management, Business, Science and Arts occupations in Longbranch, the most male-oriented occupations are Computers & Mathematics (100.0%), Education, Arts & Media (100.0%), and Health Technologists (84.3%), while the most female-oriented occupations are Education Instruction & Library (100.0%), Arts, Media & Entertainment (100.0%), and Legal Services & Support (91.7%).
| Occupation | Male | Female |
| Management | 51 (28.8%) | 126 (71.2%) |
| Business & Financial | 64 (61.5%) | 40 (38.5%) |
| Computers, Engineering & Science | 101 (82.1%) | 22 (17.9%) |
| Computers & Mathematics | 20 (100.0%) | 0 (0.0%) |
| Architecture & Engineering | 81 (78.6%) | 22 (21.4%) |
| Life, Physical & Social Science | 0 (0.0%) | 0 (0.0%) |
| Community & Social Service | 33 (11.9%) | 245 (88.1%) |
| Education, Arts & Media | 16 (100.0%) | 0 (0.0%) |
| Legal Services & Support | 17 (8.3%) | 189 (91.7%) |
| Education Instruction & Library | 0 (0.0%) | 47 (100.0%) |
| Arts, Media & Entertainment | 0 (0.0%) | 9 (100.0%) |
| Health Diagnosing & Treating | 107 (58.5%) | 76 (41.5%) |
| Health Technologists | 107 (84.3%) | 20 (15.8%) |
| Total (Category) | 356 (41.2%) | 509 (58.8%) |
| Total (Overall) | 894 (48.9%) | 934 (51.1%) |
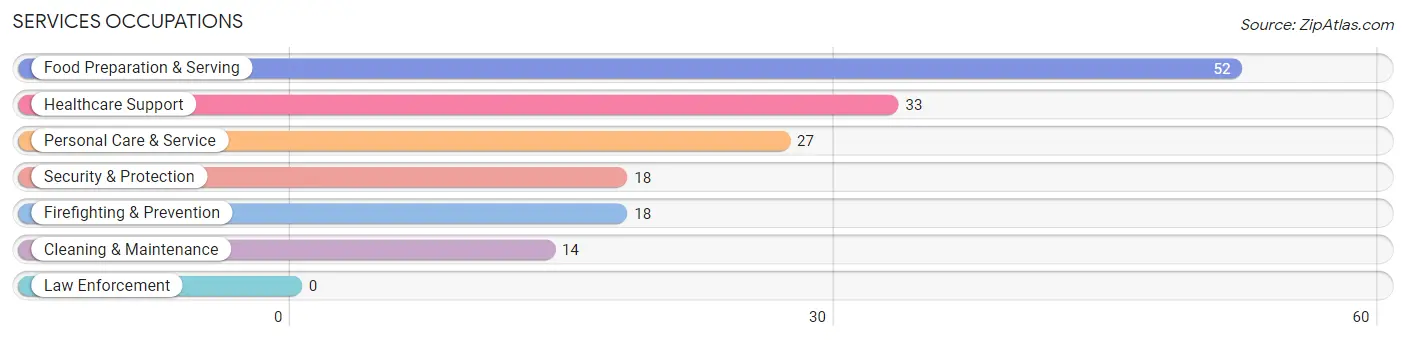
Services Occupations
The most common Services occupations in Longbranch are Food Preparation & Serving (52 | 2.8%), Healthcare Support (33 | 1.8%), Personal Care & Service (27 | 1.5%), Security & Protection (18 | 1.0%), and Firefighting & Prevention (18 | 1.0%).
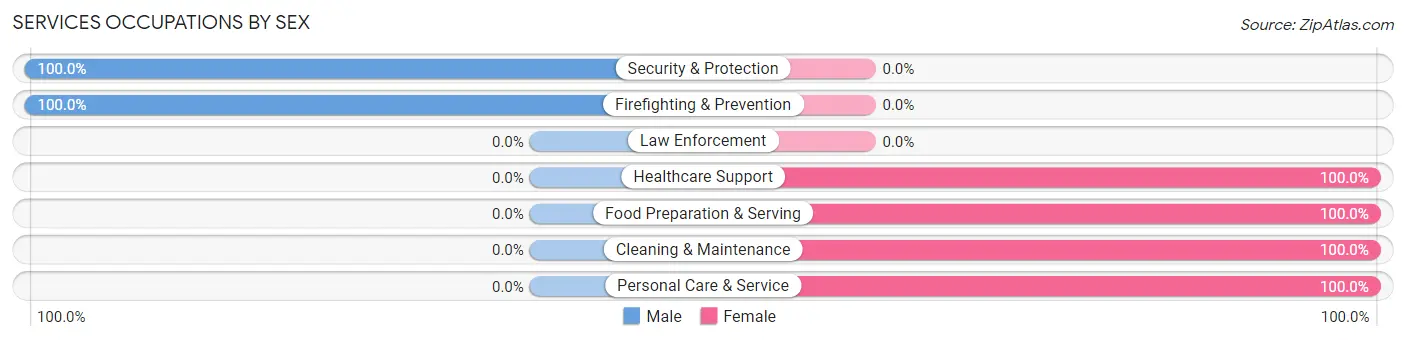
Services Occupations by Sex
Within the Services occupations in Longbranch, the most male-oriented occupations are Security & Protection (100.0%), and Firefighting & Prevention (100.0%), while the most female-oriented occupations are Healthcare Support (100.0%), Food Preparation & Serving (100.0%), and Cleaning & Maintenance (100.0%).
| Occupation | Male | Female |
| Healthcare Support | 0 (0.0%) | 33 (100.0%) |
| Security & Protection | 18 (100.0%) | 0 (0.0%) |
| Firefighting & Prevention | 18 (100.0%) | 0 (0.0%) |
| Law Enforcement | 0 (0.0%) | 0 (0.0%) |
| Food Preparation & Serving | 0 (0.0%) | 52 (100.0%) |
| Cleaning & Maintenance | 0 (0.0%) | 14 (100.0%) |
| Personal Care & Service | 0 (0.0%) | 27 (100.0%) |
| Total (Category) | 18 (12.5%) | 126 (87.5%) |
| Total (Overall) | 894 (48.9%) | 934 (51.1%) |
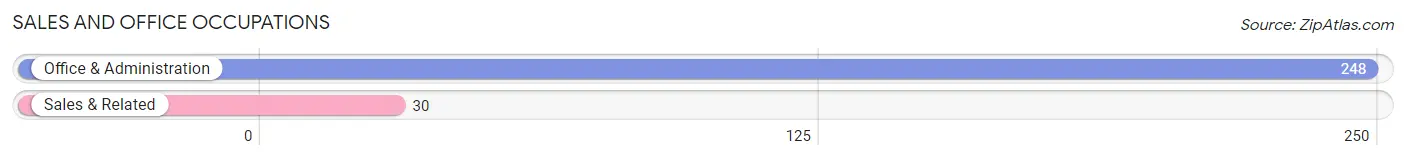
Sales and Office Occupations
The most common Sales and Office occupations in Longbranch are Office & Administration (248 | 13.6%), and Sales & Related (30 | 1.6%).
Sales and Office Occupations by Sex
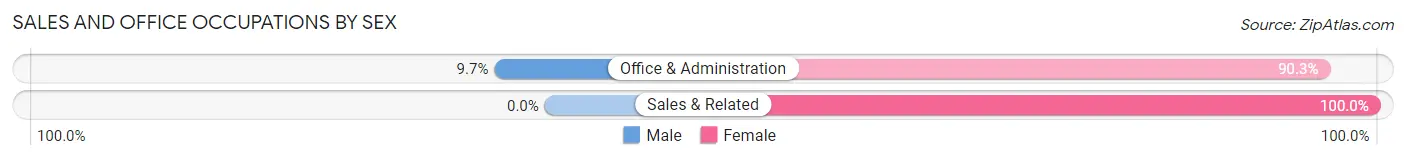
| Occupation | Male | Female |
| Sales & Related | 0 (0.0%) | 30 (100.0%) |
| Office & Administration | 24 (9.7%) | 224 (90.3%) |
| Total (Category) | 24 (8.6%) | 254 (91.4%) |
| Total (Overall) | 894 (48.9%) | 934 (51.1%) |
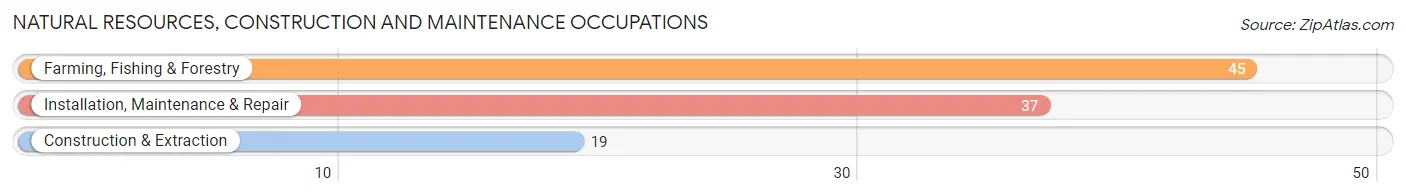
Natural Resources, Construction and Maintenance Occupations
The most common Natural Resources, Construction and Maintenance occupations in Longbranch are Farming, Fishing & Forestry (45 | 2.5%), Installation, Maintenance & Repair (37 | 2.0%), and Construction & Extraction (19 | 1.0%).
Natural Resources, Construction and Maintenance Occupations by Sex
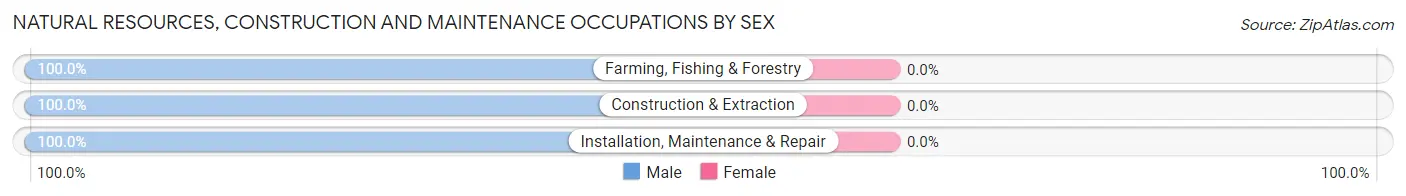
| Occupation | Male | Female |
| Farming, Fishing & Forestry | 45 (100.0%) | 0 (0.0%) |
| Construction & Extraction | 19 (100.0%) | 0 (0.0%) |
| Installation, Maintenance & Repair | 37 (100.0%) | 0 (0.0%) |
| Total (Category) | 101 (100.0%) | 0 (0.0%) |
| Total (Overall) | 894 (48.9%) | 934 (51.1%) |
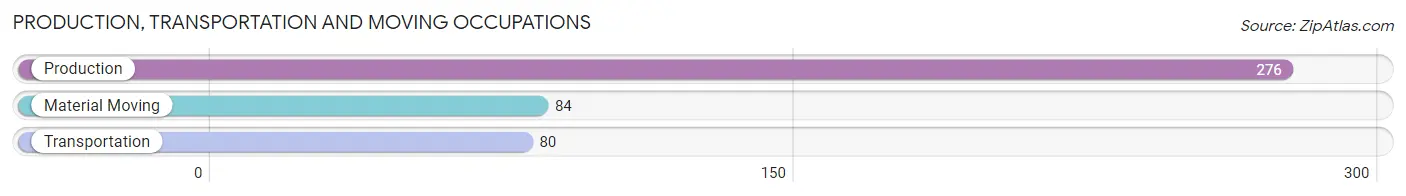
Production, Transportation and Moving Occupations
The most common Production, Transportation and Moving occupations in Longbranch are Production (276 | 15.1%), Material Moving (84 | 4.6%), and Transportation (80 | 4.4%).
Production, Transportation and Moving Occupations by Sex
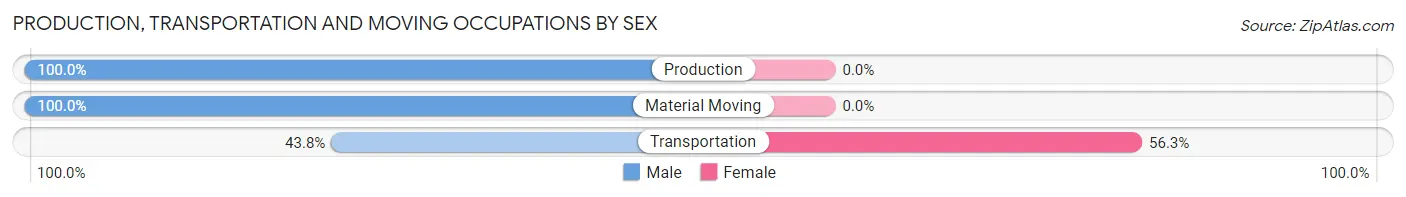
| Occupation | Male | Female |
| Production | 276 (100.0%) | 0 (0.0%) |
| Transportation | 35 (43.8%) | 45 (56.2%) |
| Material Moving | 84 (100.0%) | 0 (0.0%) |
| Total (Category) | 395 (89.8%) | 45 (10.2%) |
| Total (Overall) | 894 (48.9%) | 934 (51.1%) |
Employment Industries by Sex in Longbranch
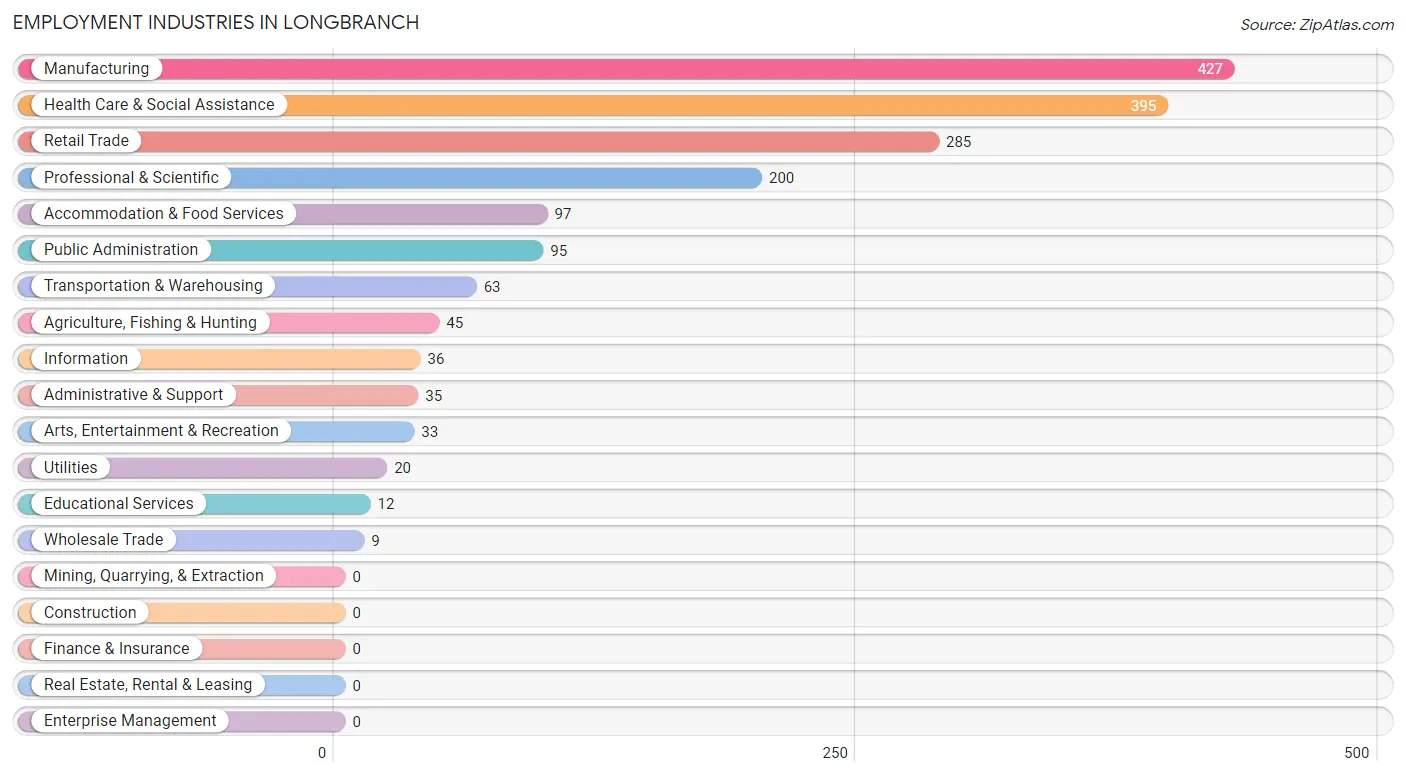
Employment Industries in Longbranch
The major employment industries in Longbranch include Manufacturing (427 | 23.4%), Health Care & Social Assistance (395 | 21.6%), Retail Trade (285 | 15.6%), Professional & Scientific (200 | 10.9%), and Accommodation & Food Services (97 | 5.3%).
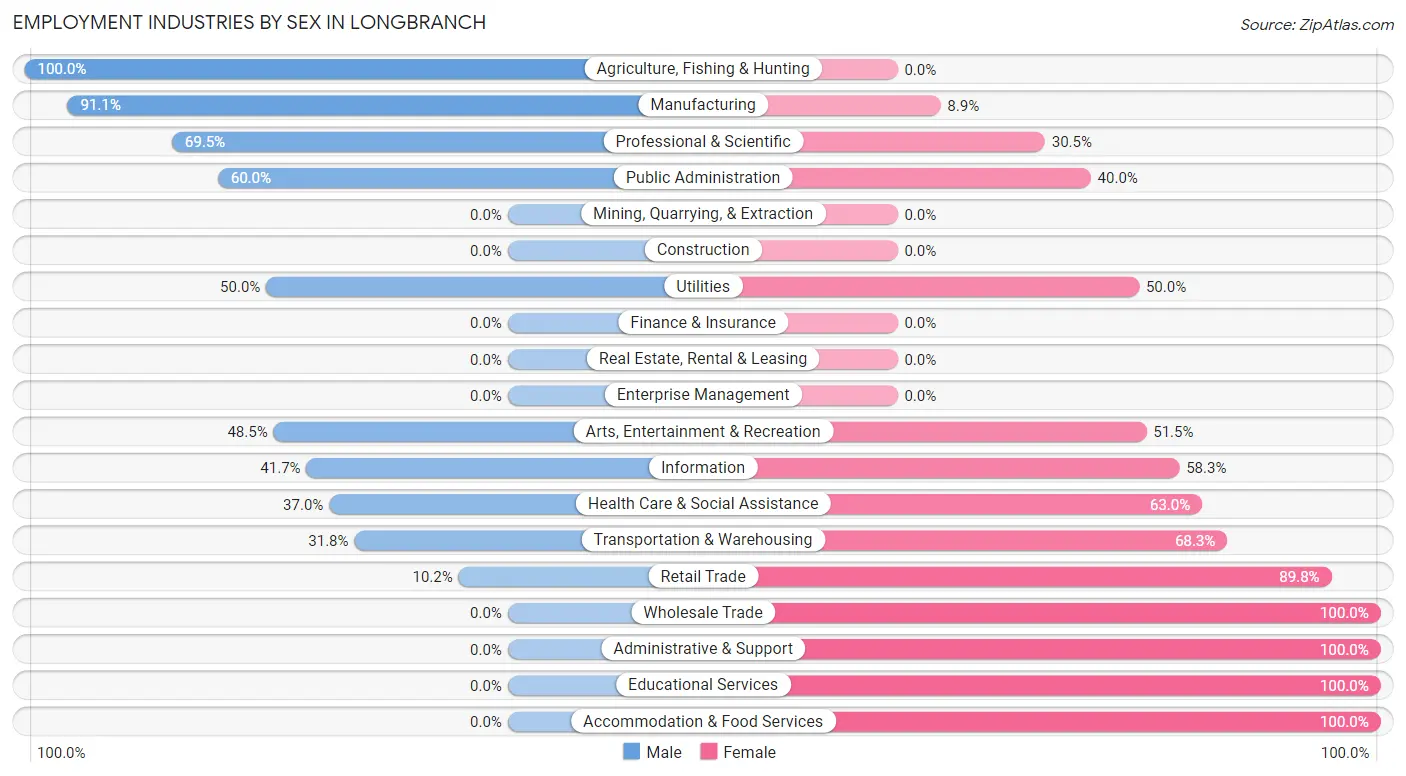
Employment Industries by Sex in Longbranch
The Longbranch industries that see more men than women are Agriculture, Fishing & Hunting (100.0%), Manufacturing (91.1%), and Professional & Scientific (69.5%), whereas the industries that tend to have a higher number of women are Wholesale Trade (100.0%), Administrative & Support (100.0%), and Educational Services (100.0%).
| Industry | Male | Female |
| Agriculture, Fishing & Hunting | 45 (100.0%) | 0 (0.0%) |
| Mining, Quarrying, & Extraction | 0 (0.0%) | 0 (0.0%) |
| Construction | 0 (0.0%) | 0 (0.0%) |
| Manufacturing | 389 (91.1%) | 38 (8.9%) |
| Wholesale Trade | 0 (0.0%) | 9 (100.0%) |
| Retail Trade | 29 (10.2%) | 256 (89.8%) |
| Transportation & Warehousing | 20 (31.8%) | 43 (68.2%) |
| Utilities | 10 (50.0%) | 10 (50.0%) |
| Information | 15 (41.7%) | 21 (58.3%) |
| Finance & Insurance | 0 (0.0%) | 0 (0.0%) |
| Real Estate, Rental & Leasing | 0 (0.0%) | 0 (0.0%) |
| Professional & Scientific | 139 (69.5%) | 61 (30.5%) |
| Enterprise Management | 0 (0.0%) | 0 (0.0%) |
| Administrative & Support | 0 (0.0%) | 35 (100.0%) |
| Educational Services | 0 (0.0%) | 12 (100.0%) |
| Health Care & Social Assistance | 146 (37.0%) | 249 (63.0%) |
| Arts, Entertainment & Recreation | 16 (48.5%) | 17 (51.5%) |
| Accommodation & Food Services | 0 (0.0%) | 97 (100.0%) |
| Public Administration | 57 (60.0%) | 38 (40.0%) |
| Total | 894 (48.9%) | 934 (51.1%) |
Education in Longbranch
School Enrollment in Longbranch
The most common levels of schooling among the 524 students in Longbranch are middle school (235 | 44.9%), elementary school (124 | 23.7%), and college / undergraduate (58 | 11.1%).
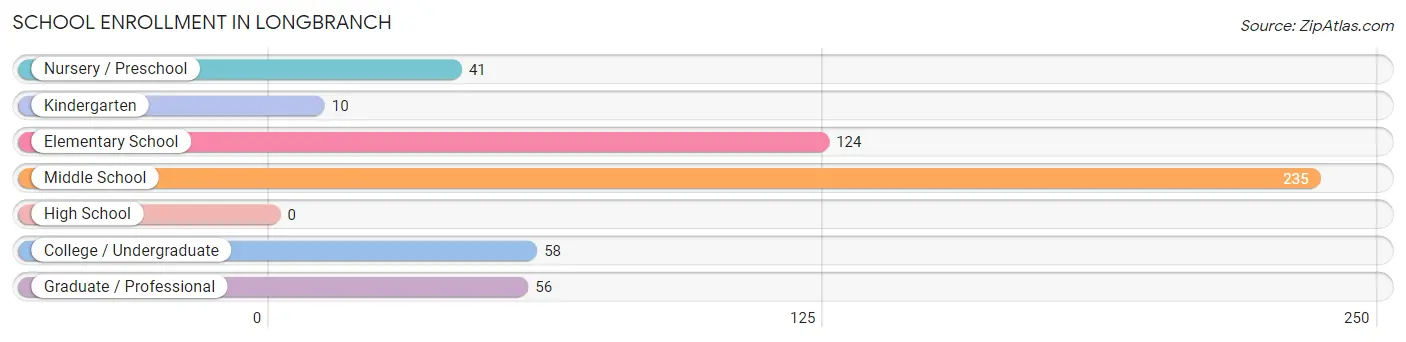
| School Level | # Students | % Students |
| Nursery / Preschool | 41 | 7.8% |
| Kindergarten | 10 | 1.9% |
| Elementary School | 124 | 23.7% |
| Middle School | 235 | 44.9% |
| High School | 0 | 0.0% |
| College / Undergraduate | 58 | 11.1% |
| Graduate / Professional | 56 | 10.7% |
| Total | 524 | 100.0% |
School Enrollment by Age by Funding Source in Longbranch
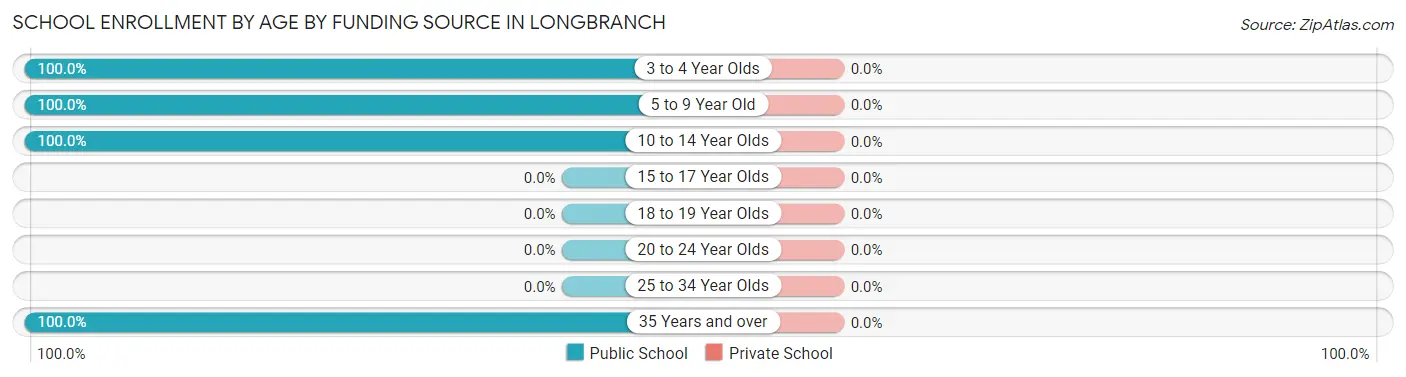
| Age Bracket | Public School | Private School |
| 3 to 4 Year Olds | 41 (100.0%) | 0 (0.0%) |
| 5 to 9 Year Old | 107 (100.0%) | 0 (0.0%) |
| 10 to 14 Year Olds | 262 (100.0%) | 0 (0.0%) |
| 15 to 17 Year Olds | 0 (0.0%) | 0 (0.0%) |
| 18 to 19 Year Olds | 0 (0.0%) | 0 (0.0%) |
| 20 to 24 Year Olds | 0 (0.0%) | 0 (0.0%) |
| 25 to 34 Year Olds | 0 (0.0%) | 0 (0.0%) |
| 35 Years and over | 114 (100.0%) | 0 (0.0%) |
| Total | 524 (100.0%) | 0 (0.0%) |
Educational Attainment by Field of Study in Longbranch
Engineering (204 | 22.6%), science & technology (162 | 17.9%), business (126 | 13.9%), social sciences (98 | 10.8%), and psychology (79 | 8.7%) are the most common fields of study among 904 individuals in Longbranch who have obtained a bachelor's degree or higher.
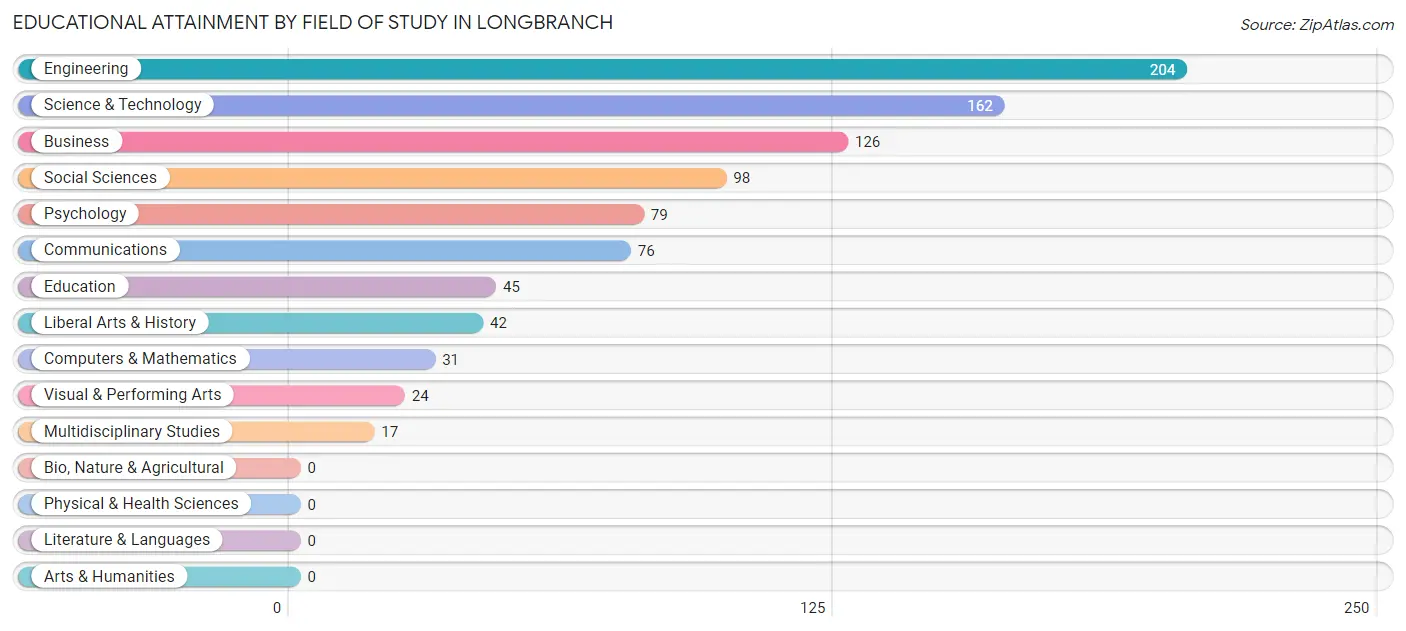
| Field of Study | # Graduates | % Graduates |
| Computers & Mathematics | 31 | 3.4% |
| Bio, Nature & Agricultural | 0 | 0.0% |
| Physical & Health Sciences | 0 | 0.0% |
| Psychology | 79 | 8.7% |
| Social Sciences | 98 | 10.8% |
| Engineering | 204 | 22.6% |
| Multidisciplinary Studies | 17 | 1.9% |
| Science & Technology | 162 | 17.9% |
| Business | 126 | 13.9% |
| Education | 45 | 5.0% |
| Literature & Languages | 0 | 0.0% |
| Liberal Arts & History | 42 | 4.6% |
| Visual & Performing Arts | 24 | 2.6% |
| Communications | 76 | 8.4% |
| Arts & Humanities | 0 | 0.0% |
| Total | 904 | 100.0% |
Transportation & Commute in Longbranch
Vehicle Availability by Sex in Longbranch
The most prevalent vehicle ownership categories in Longbranch are males with 2 vehicles (392, accounting for 41.2%) and females with 2 vehicles (152, making up 67.6%).
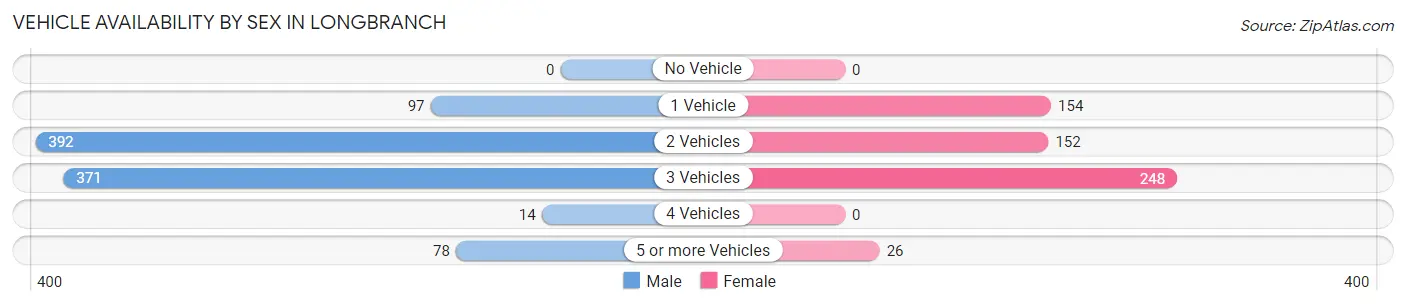
| Vehicles Available | Male | Female |
| No Vehicle | 0 (0.0%) | 0 (0.0%) |
| 1 Vehicle | 97 (10.2%) | 154 (26.6%) |
| 2 Vehicles | 392 (41.2%) | 152 (26.2%) |
| 3 Vehicles | 371 (39.0%) | 248 (42.8%) |
| 4 Vehicles | 14 (1.5%) | 0 (0.0%) |
| 5 or more Vehicles | 78 (8.2%) | 26 (4.5%) |
| Total | 952 (100.0%) | 580 (100.0%) |
Commute Time in Longbranch
The most frequently occuring commute durations in Longbranch are 60 to 89 minutes (388 commuters, 32.7%), 40 to 44 minutes (288 commuters, 24.3%), and 45 to 59 minutes (204 commuters, 17.2%).
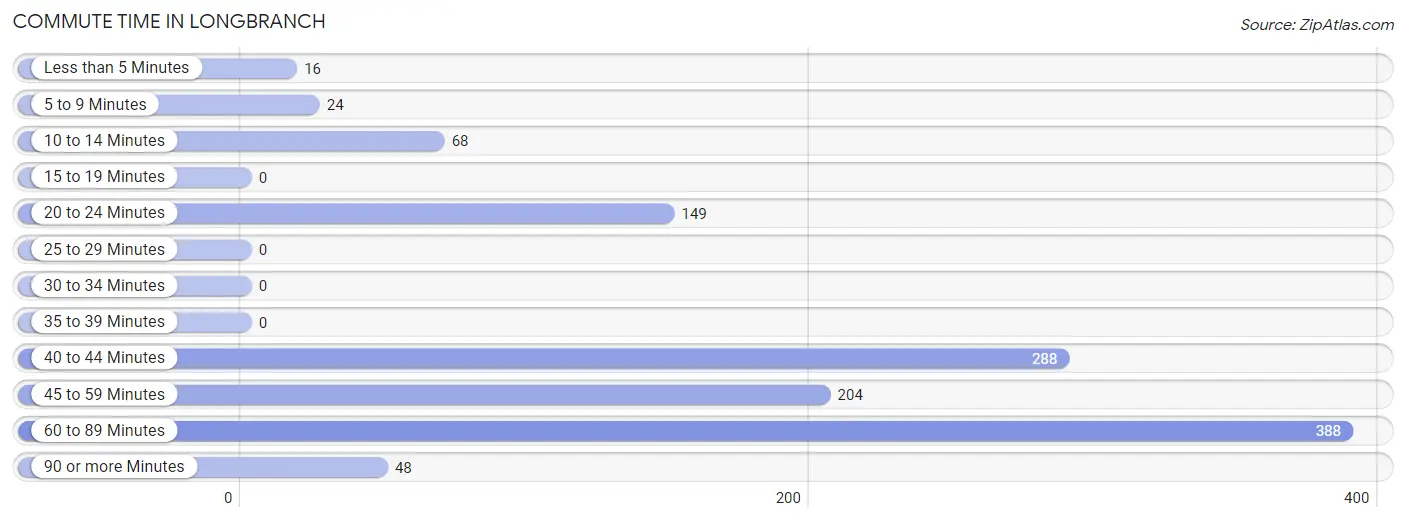
| Commute Time | # Commuters | % Commuters |
| Less than 5 Minutes | 16 | 1.3% |
| 5 to 9 Minutes | 24 | 2.0% |
| 10 to 14 Minutes | 68 | 5.7% |
| 15 to 19 Minutes | 0 | 0.0% |
| 20 to 24 Minutes | 149 | 12.6% |
| 25 to 29 Minutes | 0 | 0.0% |
| 30 to 34 Minutes | 0 | 0.0% |
| 35 to 39 Minutes | 0 | 0.0% |
| 40 to 44 Minutes | 288 | 24.3% |
| 45 to 59 Minutes | 204 | 17.2% |
| 60 to 89 Minutes | 388 | 32.7% |
| 90 or more Minutes | 48 | 4.1% |
Commute Time by Sex in Longbranch
The most common commute times in Longbranch are 60 to 89 minutes (213 commuters, 27.1%) for males and 60 to 89 minutes (175 commuters, 44.0%) for females.
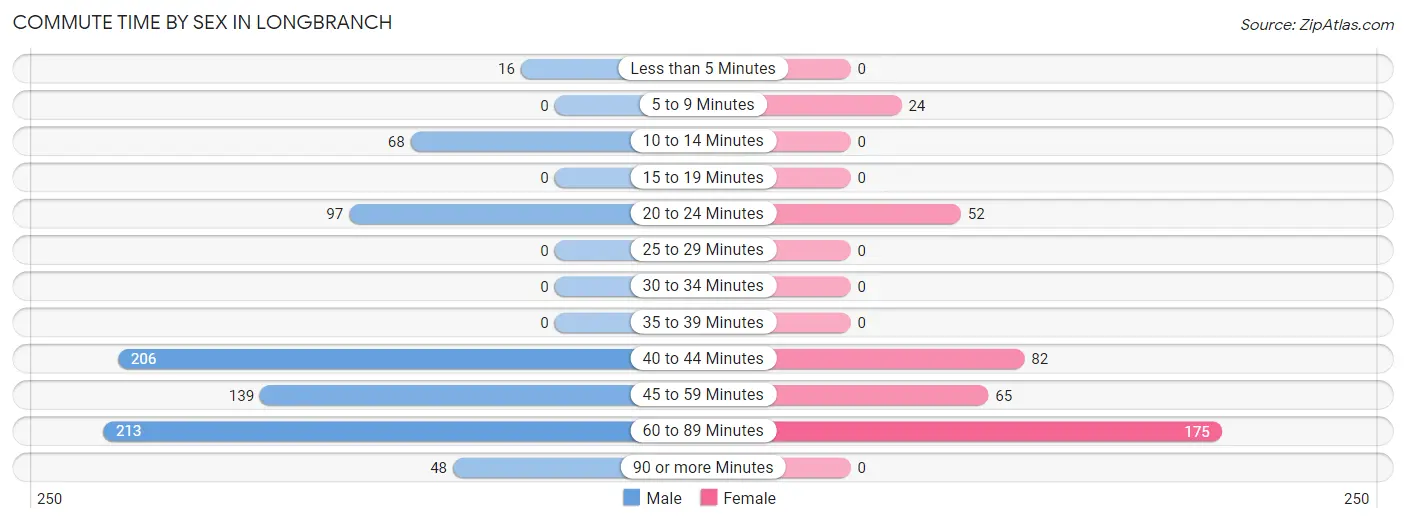
| Commute Time | Male | Female |
| Less than 5 Minutes | 16 (2.0%) | 0 (0.0%) |
| 5 to 9 Minutes | 0 (0.0%) | 24 (6.0%) |
| 10 to 14 Minutes | 68 (8.6%) | 0 (0.0%) |
| 15 to 19 Minutes | 0 (0.0%) | 0 (0.0%) |
| 20 to 24 Minutes | 97 (12.3%) | 52 (13.1%) |
| 25 to 29 Minutes | 0 (0.0%) | 0 (0.0%) |
| 30 to 34 Minutes | 0 (0.0%) | 0 (0.0%) |
| 35 to 39 Minutes | 0 (0.0%) | 0 (0.0%) |
| 40 to 44 Minutes | 206 (26.2%) | 82 (20.6%) |
| 45 to 59 Minutes | 139 (17.7%) | 65 (16.3%) |
| 60 to 89 Minutes | 213 (27.1%) | 175 (44.0%) |
| 90 or more Minutes | 48 (6.1%) | 0 (0.0%) |
Time of Departure to Work by Sex in Longbranch
The most frequent times of departure to work in Longbranch are 12:00 AM to 4:59 AM (252, 32.0%) for males and 6:30 AM to 6:59 AM (102, 25.6%) for females.
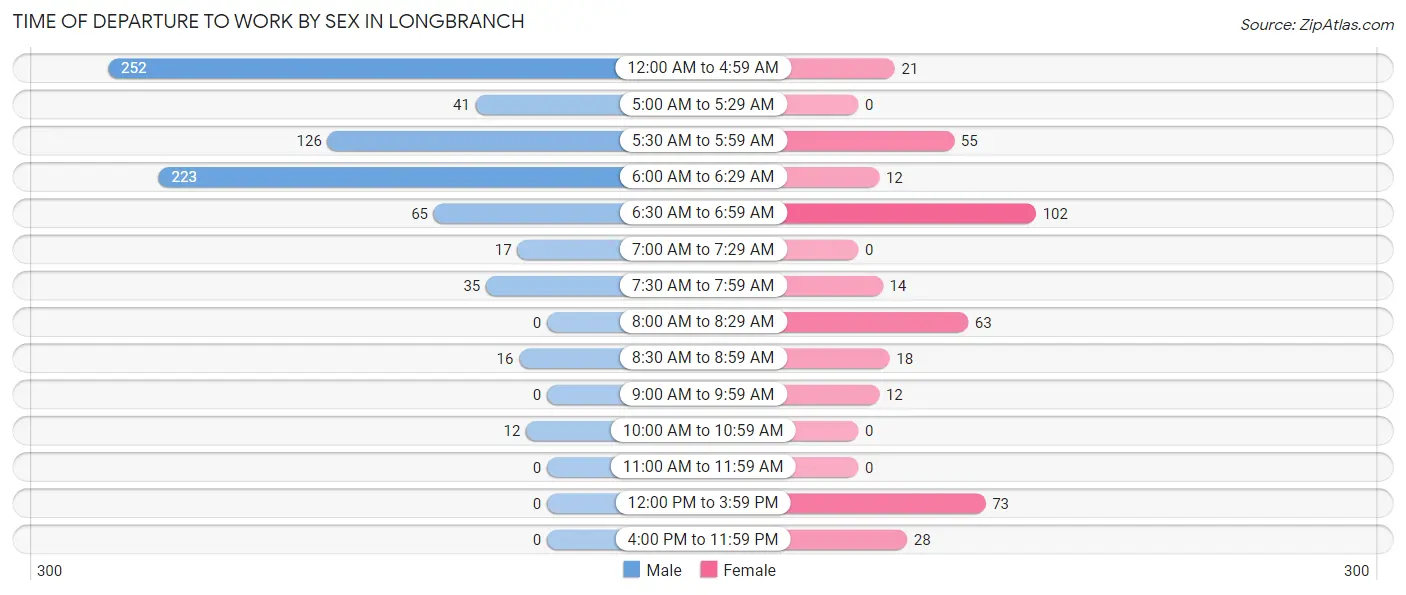
| Time of Departure | Male | Female |
| 12:00 AM to 4:59 AM | 252 (32.0%) | 21 (5.3%) |
| 5:00 AM to 5:29 AM | 41 (5.2%) | 0 (0.0%) |
| 5:30 AM to 5:59 AM | 126 (16.0%) | 55 (13.8%) |
| 6:00 AM to 6:29 AM | 223 (28.3%) | 12 (3.0%) |
| 6:30 AM to 6:59 AM | 65 (8.3%) | 102 (25.6%) |
| 7:00 AM to 7:29 AM | 17 (2.2%) | 0 (0.0%) |
| 7:30 AM to 7:59 AM | 35 (4.4%) | 14 (3.5%) |
| 8:00 AM to 8:29 AM | 0 (0.0%) | 63 (15.8%) |
| 8:30 AM to 8:59 AM | 16 (2.0%) | 18 (4.5%) |
| 9:00 AM to 9:59 AM | 0 (0.0%) | 12 (3.0%) |
| 10:00 AM to 10:59 AM | 12 (1.5%) | 0 (0.0%) |
| 11:00 AM to 11:59 AM | 0 (0.0%) | 0 (0.0%) |
| 12:00 PM to 3:59 PM | 0 (0.0%) | 73 (18.3%) |
| 4:00 PM to 11:59 PM | 0 (0.0%) | 28 (7.0%) |
| Total | 787 (100.0%) | 398 (100.0%) |
Housing Occupancy in Longbranch
Occupancy by Ownership in Longbranch
Of the total 1,916 dwellings in Longbranch, owner-occupied units account for 1,614 (84.2%), while renter-occupied units make up 302 (15.8%).
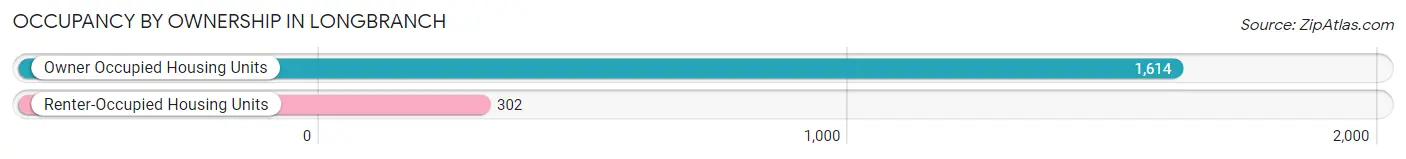
| Occupancy | # Housing Units | % Housing Units |
| Owner Occupied Housing Units | 1,614 | 84.2% |
| Renter-Occupied Housing Units | 302 | 15.8% |
| Total Occupied Housing Units | 1,916 | 100.0% |
Occupancy by Household Size in Longbranch
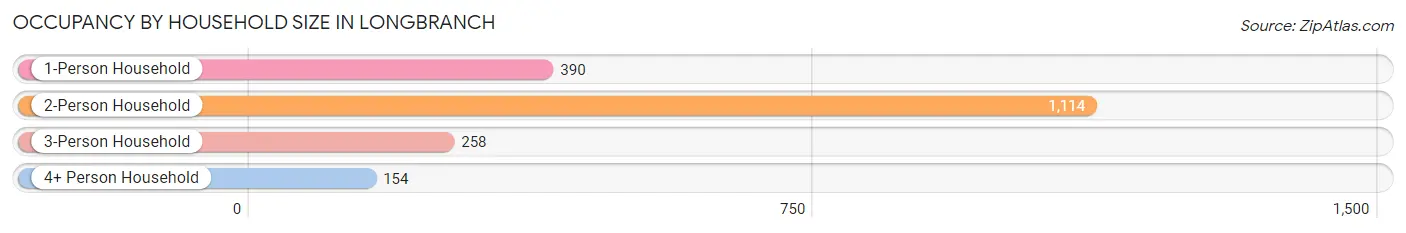
| Household Size | # Housing Units | % Housing Units |
| 1-Person Household | 390 | 20.3% |
| 2-Person Household | 1,114 | 58.1% |
| 3-Person Household | 258 | 13.5% |
| 4+ Person Household | 154 | 8.0% |
| Total Housing Units | 1,916 | 100.0% |
Occupancy by Ownership by Household Size in Longbranch
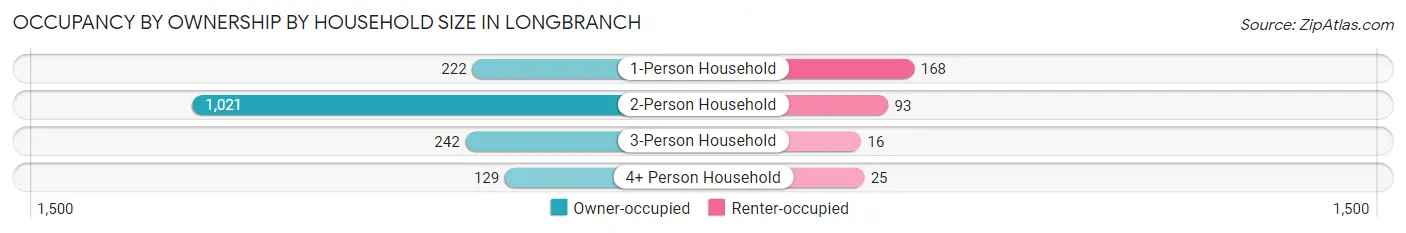
| Household Size | Owner-occupied | Renter-occupied |
| 1-Person Household | 222 (56.9%) | 168 (43.1%) |
| 2-Person Household | 1,021 (91.6%) | 93 (8.4%) |
| 3-Person Household | 242 (93.8%) | 16 (6.2%) |
| 4+ Person Household | 129 (83.8%) | 25 (16.2%) |
| Total Housing Units | 1,614 (84.2%) | 302 (15.8%) |
Occupancy by Educational Attainment in Longbranch
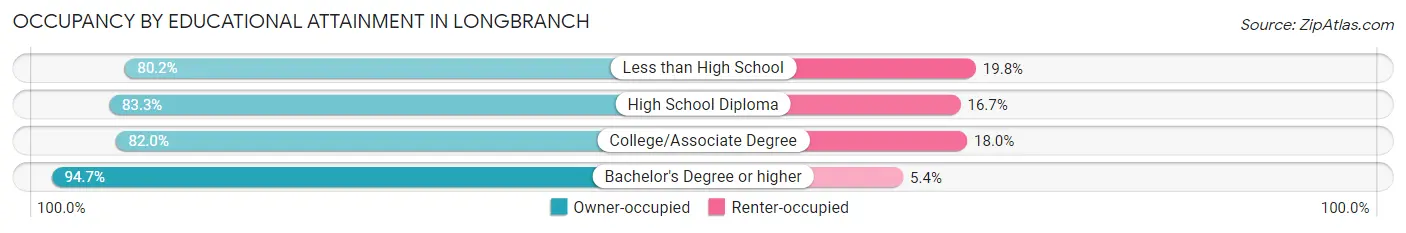
| Household Size | Owner-occupied | Renter-occupied |
| Less than High School | 69 (80.2%) | 17 (19.8%) |
| High School Diploma | 453 (83.3%) | 91 (16.7%) |
| College/Associate Degree | 809 (82.0%) | 178 (18.0%) |
| Bachelor's Degree or higher | 283 (94.7%) | 16 (5.3%) |
Occupancy by Age of Householder in Longbranch
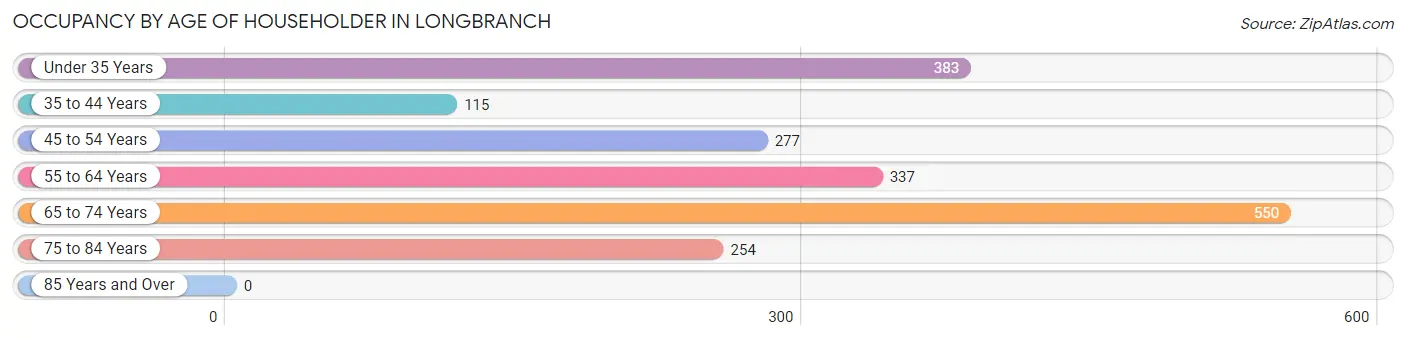
| Age Bracket | # Households | % Households |
| Under 35 Years | 383 | 20.0% |
| 35 to 44 Years | 115 | 6.0% |
| 45 to 54 Years | 277 | 14.5% |
| 55 to 64 Years | 337 | 17.6% |
| 65 to 74 Years | 550 | 28.7% |
| 75 to 84 Years | 254 | 13.3% |
| 85 Years and Over | 0 | 0.0% |
| Total | 1,916 | 100.0% |
Housing Finances in Longbranch
Median Income by Occupancy in Longbranch
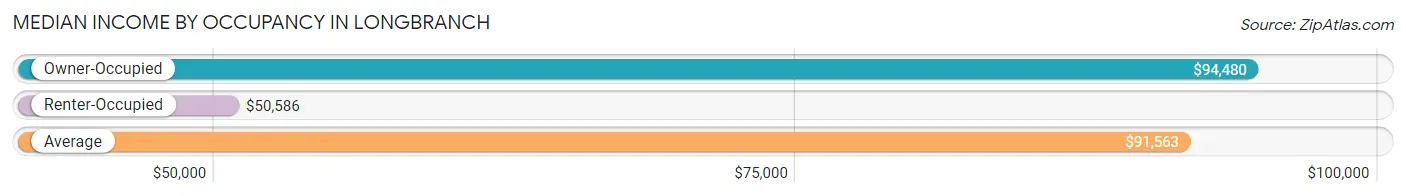
| Occupancy Type | # Households | Median Income |
| Owner-Occupied | 1,614 (84.2%) | $94,480 |
| Renter-Occupied | 302 (15.8%) | $50,586 |
| Average | 1,916 (100.0%) | $91,563 |
Occupancy by Householder Income Bracket in Longbranch
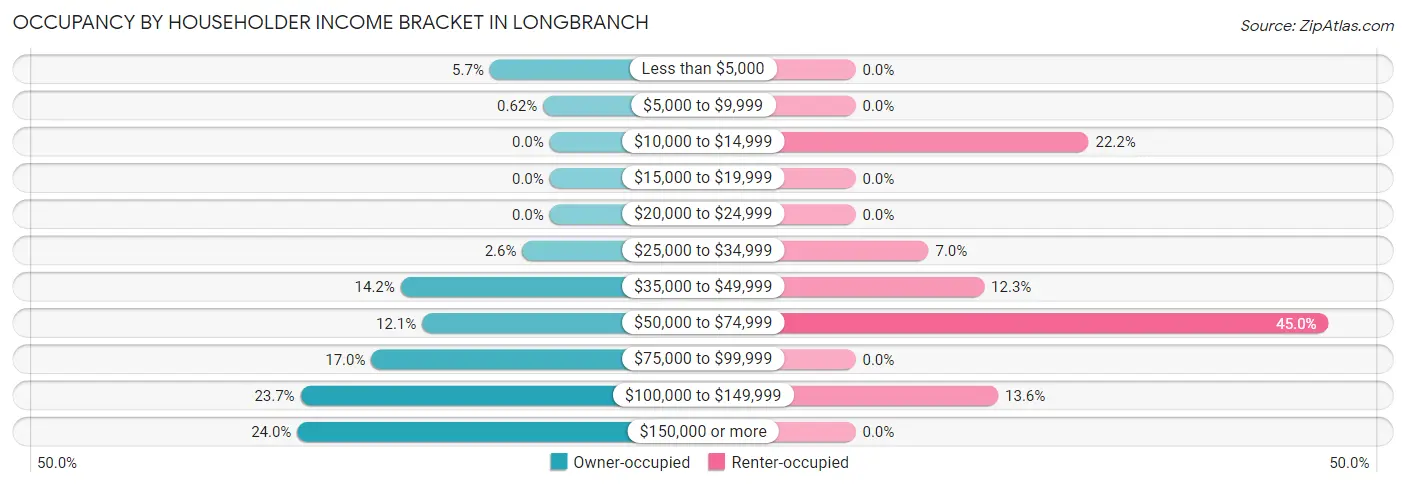
| Income Bracket | Owner-occupied | Renter-occupied |
| Less than $5,000 | 92 (5.7%) | 0 (0.0%) |
| $5,000 to $9,999 | 10 (0.6%) | 0 (0.0%) |
| $10,000 to $14,999 | 0 (0.0%) | 67 (22.2%) |
| $15,000 to $19,999 | 0 (0.0%) | 0 (0.0%) |
| $20,000 to $24,999 | 0 (0.0%) | 0 (0.0%) |
| $25,000 to $34,999 | 42 (2.6%) | 21 (7.0%) |
| $35,000 to $49,999 | 229 (14.2%) | 37 (12.2%) |
| $50,000 to $74,999 | 196 (12.1%) | 136 (45.0%) |
| $75,000 to $99,999 | 274 (17.0%) | 0 (0.0%) |
| $100,000 to $149,999 | 383 (23.7%) | 41 (13.6%) |
| $150,000 or more | 388 (24.0%) | 0 (0.0%) |
| Total | 1,614 (100.0%) | 302 (100.0%) |
Monthly Housing Cost Tiers in Longbranch
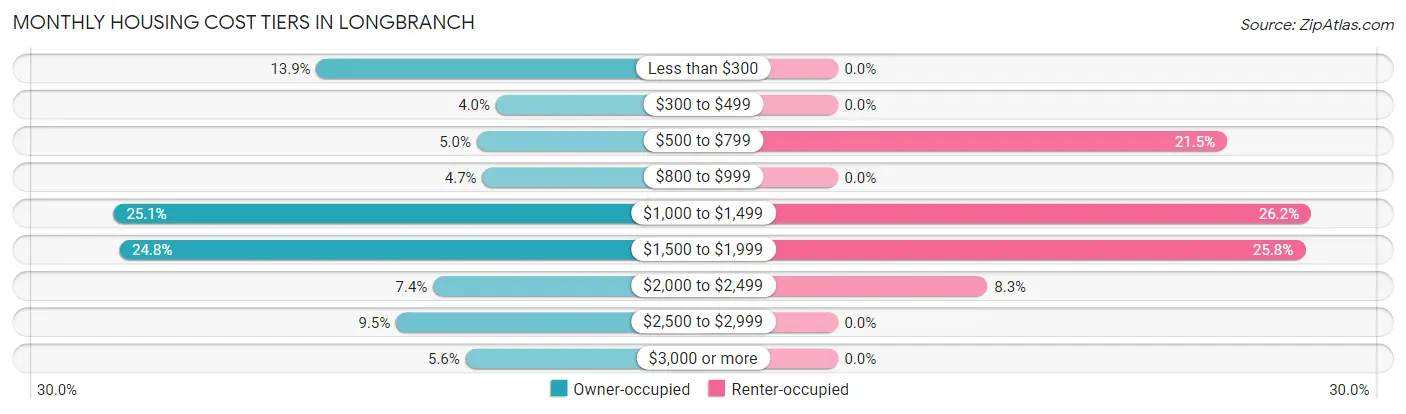
| Monthly Cost | Owner-occupied | Renter-occupied |
| Less than $300 | 224 (13.9%) | 0 (0.0%) |
| $300 to $499 | 64 (4.0%) | 0 (0.0%) |
| $500 to $799 | 81 (5.0%) | 65 (21.5%) |
| $800 to $999 | 76 (4.7%) | 0 (0.0%) |
| $1,000 to $1,499 | 405 (25.1%) | 79 (26.2%) |
| $1,500 to $1,999 | 400 (24.8%) | 78 (25.8%) |
| $2,000 to $2,499 | 120 (7.4%) | 25 (8.3%) |
| $2,500 to $2,999 | 153 (9.5%) | 0 (0.0%) |
| $3,000 or more | 91 (5.6%) | 0 (0.0%) |
| Total | 1,614 (100.0%) | 302 (100.0%) |
Physical Housing Characteristics in Longbranch
Housing Structures in Longbranch
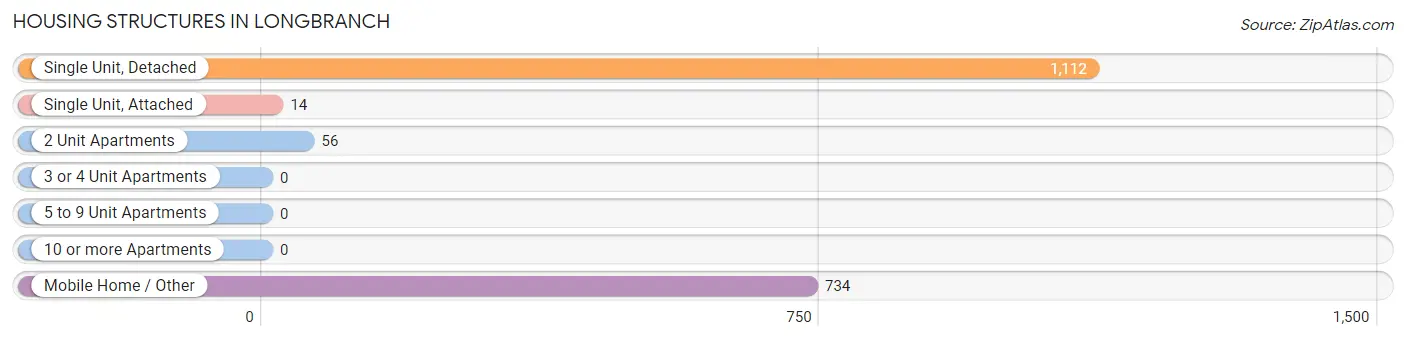
| Structure Type | # Housing Units | % Housing Units |
| Single Unit, Detached | 1,112 | 58.0% |
| Single Unit, Attached | 14 | 0.7% |
| 2 Unit Apartments | 56 | 2.9% |
| 3 or 4 Unit Apartments | 0 | 0.0% |
| 5 to 9 Unit Apartments | 0 | 0.0% |
| 10 or more Apartments | 0 | 0.0% |
| Mobile Home / Other | 734 | 38.3% |
| Total | 1,916 | 100.0% |
Housing Structures by Occupancy in Longbranch
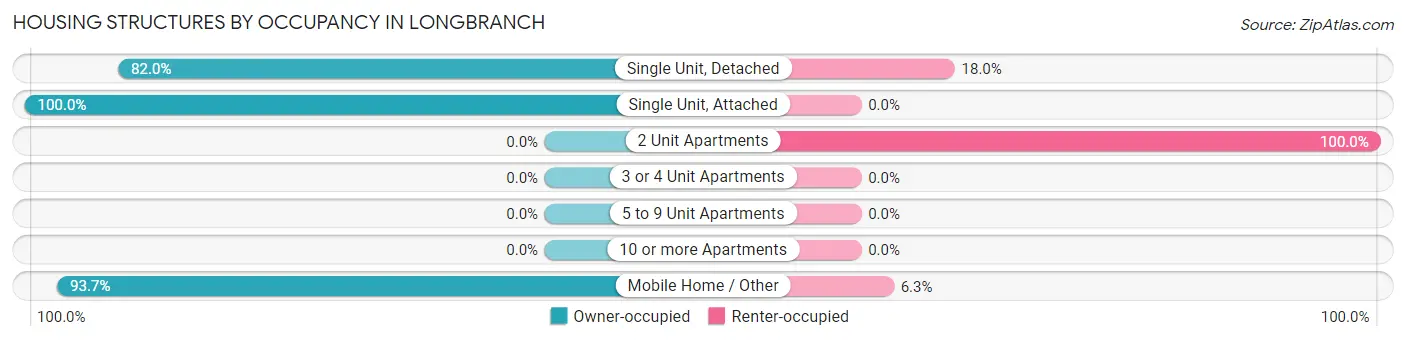
| Structure Type | Owner-occupied | Renter-occupied |
| Single Unit, Detached | 912 (82.0%) | 200 (18.0%) |
| Single Unit, Attached | 14 (100.0%) | 0 (0.0%) |
| 2 Unit Apartments | 0 (0.0%) | 56 (100.0%) |
| 3 or 4 Unit Apartments | 0 (0.0%) | 0 (0.0%) |
| 5 to 9 Unit Apartments | 0 (0.0%) | 0 (0.0%) |
| 10 or more Apartments | 0 (0.0%) | 0 (0.0%) |
| Mobile Home / Other | 688 (93.7%) | 46 (6.3%) |
| Total | 1,614 (84.2%) | 302 (15.8%) |
Housing Structures by Number of Rooms in Longbranch
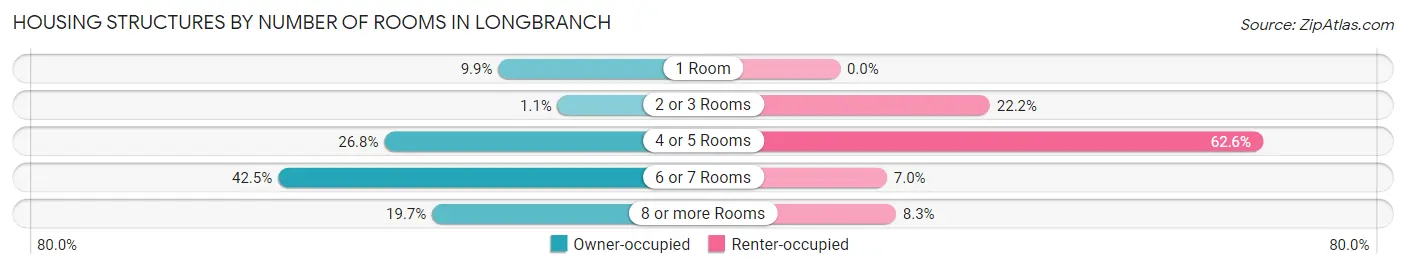
| Number of Rooms | Owner-occupied | Renter-occupied |
| 1 Room | 160 (9.9%) | 0 (0.0%) |
| 2 or 3 Rooms | 18 (1.1%) | 67 (22.2%) |
| 4 or 5 Rooms | 432 (26.8%) | 189 (62.6%) |
| 6 or 7 Rooms | 686 (42.5%) | 21 (7.0%) |
| 8 or more Rooms | 318 (19.7%) | 25 (8.3%) |
| Total | 1,614 (100.0%) | 302 (100.0%) |
Housing Structure by Heating Type in Longbranch
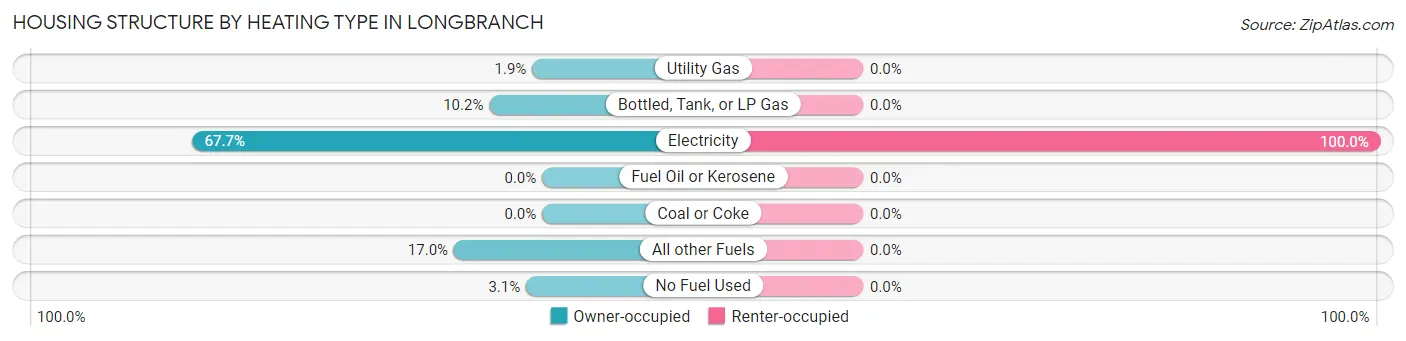
| Heating Type | Owner-occupied | Renter-occupied |
| Utility Gas | 31 (1.9%) | 0 (0.0%) |
| Bottled, Tank, or LP Gas | 165 (10.2%) | 0 (0.0%) |
| Electricity | 1,093 (67.7%) | 302 (100.0%) |
| Fuel Oil or Kerosene | 0 (0.0%) | 0 (0.0%) |
| Coal or Coke | 0 (0.0%) | 0 (0.0%) |
| All other Fuels | 275 (17.0%) | 0 (0.0%) |
| No Fuel Used | 50 (3.1%) | 0 (0.0%) |
| Total | 1,614 (100.0%) | 302 (100.0%) |
Household Vehicle Usage in Longbranch
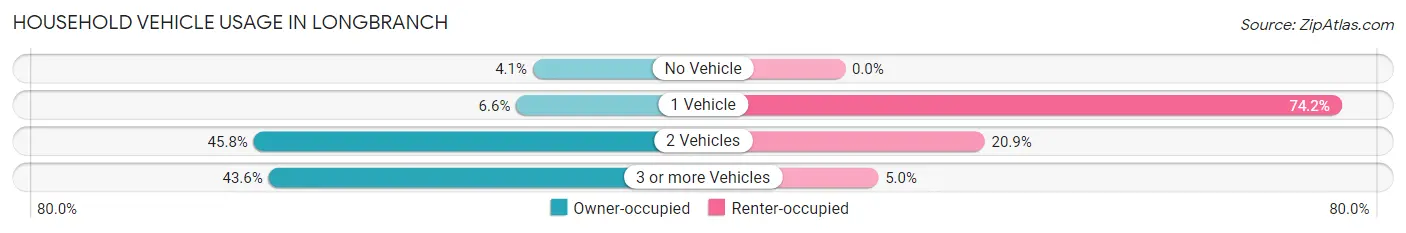
| Vehicles per Household | Owner-occupied | Renter-occupied |
| No Vehicle | 66 (4.1%) | 0 (0.0%) |
| 1 Vehicle | 106 (6.6%) | 224 (74.2%) |
| 2 Vehicles | 739 (45.8%) | 63 (20.9%) |
| 3 or more Vehicles | 703 (43.6%) | 15 (5.0%) |
| Total | 1,614 (100.0%) | 302 (100.0%) |
Real Estate & Mortgages in Longbranch
Real Estate and Mortgage Overview in Longbranch
| Characteristic | Without Mortgage | With Mortgage |
| Housing Units | 429 | 1,185 |
| Median Property Value | - | - |
| Median Household Income | - | - |
| Monthly Housing Costs | - | - |
| Real Estate Taxes | $2,675 | $0 |
Property Value by Mortgage Status in Longbranch
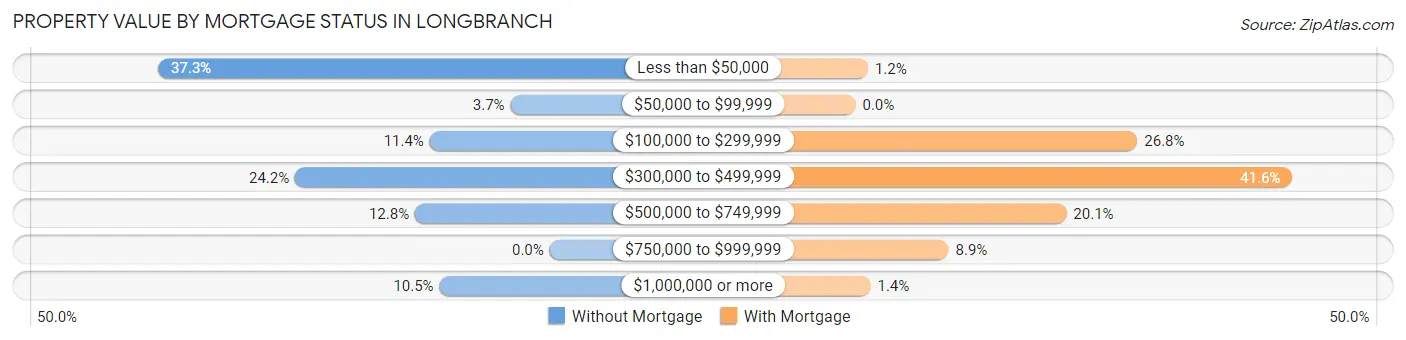
| Property Value | Without Mortgage | With Mortgage |
| Less than $50,000 | 160 (37.3%) | 14 (1.2%) |
| $50,000 to $99,999 | 16 (3.7%) | 0 (0.0%) |
| $100,000 to $299,999 | 49 (11.4%) | 318 (26.8%) |
| $300,000 to $499,999 | 104 (24.2%) | 493 (41.6%) |
| $500,000 to $749,999 | 55 (12.8%) | 238 (20.1%) |
| $750,000 to $999,999 | 0 (0.0%) | 105 (8.9%) |
| $1,000,000 or more | 45 (10.5%) | 17 (1.4%) |
| Total | 429 (100.0%) | 1,185 (100.0%) |
Household Income by Mortgage Status in Longbranch
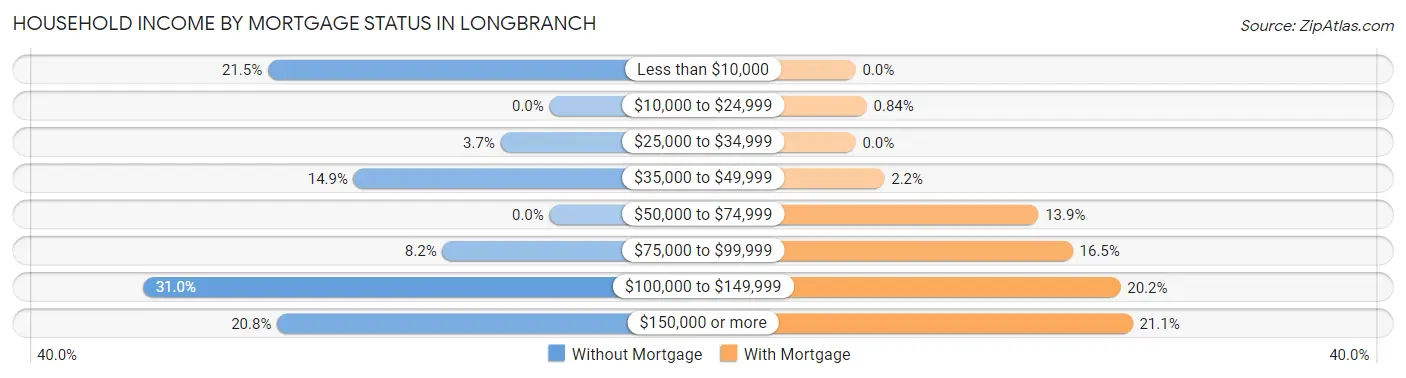
| Household Income | Without Mortgage | With Mortgage |
| Less than $10,000 | 92 (21.4%) | 0 (0.0%) |
| $10,000 to $24,999 | 0 (0.0%) | 10 (0.8%) |
| $25,000 to $34,999 | 16 (3.7%) | 0 (0.0%) |
| $35,000 to $49,999 | 64 (14.9%) | 26 (2.2%) |
| $50,000 to $74,999 | 0 (0.0%) | 165 (13.9%) |
| $75,000 to $99,999 | 35 (8.2%) | 196 (16.5%) |
| $100,000 to $149,999 | 133 (31.0%) | 239 (20.2%) |
| $150,000 or more | 89 (20.7%) | 250 (21.1%) |
| Total | 429 (100.0%) | 1,185 (100.0%) |
Property Value to Household Income Ratio in Longbranch
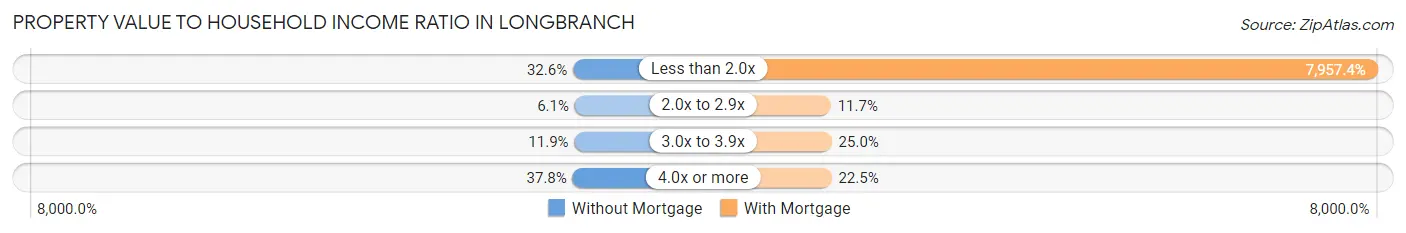
| Value-to-Income Ratio | Without Mortgage | With Mortgage |
| Less than 2.0x | 140 (32.6%) | 94,295 (7,957.4%) |
| 2.0x to 2.9x | 26 (6.1%) | 139 (11.7%) |
| 3.0x to 3.9x | 51 (11.9%) | 296 (25.0%) |
| 4.0x or more | 162 (37.8%) | 266 (22.5%) |
| Total | 429 (100.0%) | 1,185 (100.0%) |
Real Estate Taxes by Mortgage Status in Longbranch
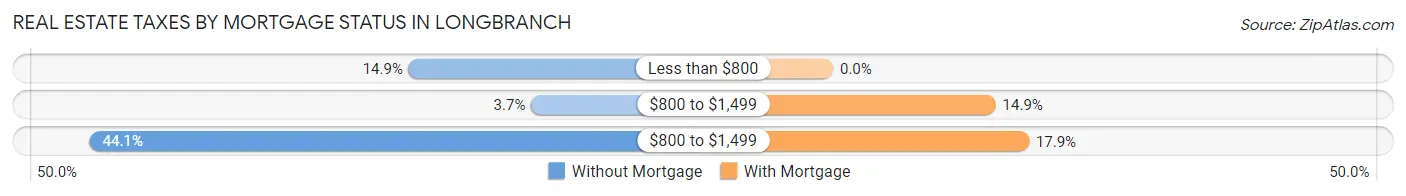
| Property Taxes | Without Mortgage | With Mortgage |
| Less than $800 | 64 (14.9%) | 0 (0.0%) |
| $800 to $1,499 | 16 (3.7%) | 176 (14.8%) |
| $800 to $1,499 | 189 (44.1%) | 212 (17.9%) |
| Total | 429 (100.0%) | 1,185 (100.0%) |
Health & Disability in Longbranch
Health Insurance Coverage by Age in Longbranch
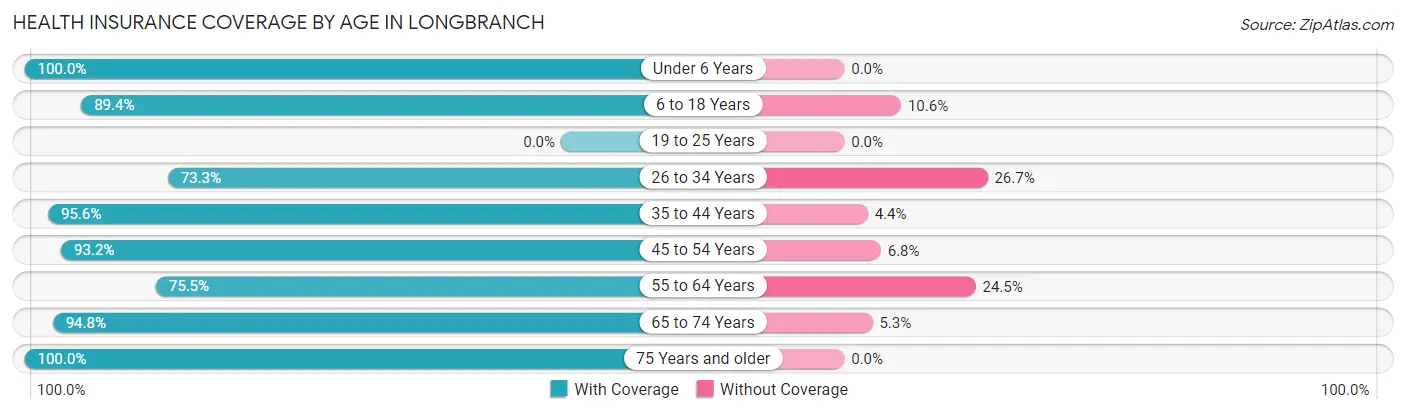
| Age Bracket | With Coverage | Without Coverage |
| Under 6 Years | 84 (100.0%) | 0 (0.0%) |
| 6 to 18 Years | 330 (89.4%) | 39 (10.6%) |
| 19 to 25 Years | 0 (0.0%) | 0 (0.0%) |
| 26 to 34 Years | 637 (73.3%) | 232 (26.7%) |
| 35 to 44 Years | 438 (95.6%) | 20 (4.4%) |
| 45 to 54 Years | 342 (93.2%) | 25 (6.8%) |
| 55 to 64 Years | 475 (75.5%) | 154 (24.5%) |
| 65 to 74 Years | 902 (94.8%) | 50 (5.2%) |
| 75 Years and older | 295 (100.0%) | 0 (0.0%) |
| Total | 3,503 (87.1%) | 520 (12.9%) |
Health Insurance Coverage by Citizenship Status in Longbranch
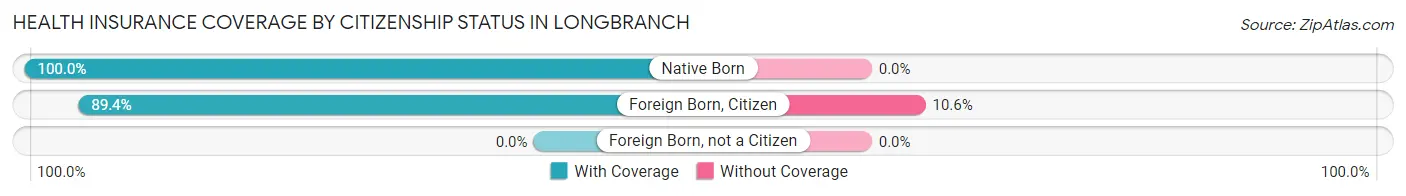
| Citizenship Status | With Coverage | Without Coverage |
| Native Born | 84 (100.0%) | 0 (0.0%) |
| Foreign Born, Citizen | 330 (89.4%) | 39 (10.6%) |
| Foreign Born, not a Citizen | 0 (0.0%) | 0 (0.0%) |
Health Insurance Coverage by Household Income in Longbranch
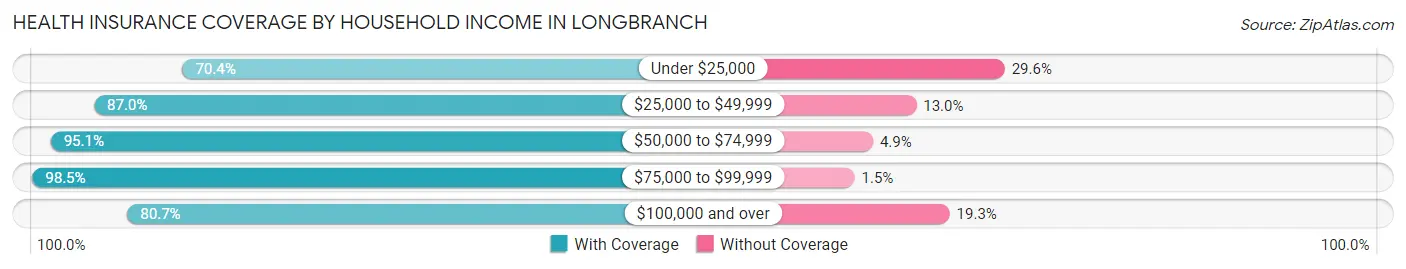
| Household Income | With Coverage | Without Coverage |
| Under $25,000 | 119 (70.4%) | 50 (29.6%) |
| $25,000 to $49,999 | 541 (87.0%) | 81 (13.0%) |
| $50,000 to $74,999 | 737 (95.1%) | 38 (4.9%) |
| $75,000 to $99,999 | 677 (98.5%) | 10 (1.5%) |
| $100,000 and over | 1,429 (80.7%) | 341 (19.3%) |
Public vs Private Health Insurance Coverage by Age in Longbranch
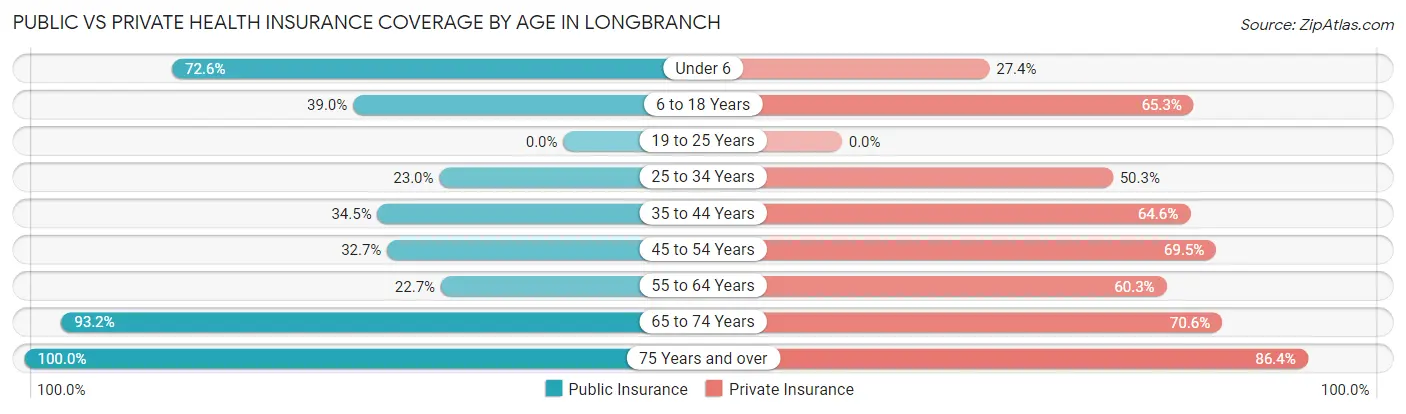
| Age Bracket | Public Insurance | Private Insurance |
| Under 6 | 61 (72.6%) | 23 (27.4%) |
| 6 to 18 Years | 144 (39.0%) | 241 (65.3%) |
| 19 to 25 Years | 0 (0.0%) | 0 (0.0%) |
| 25 to 34 Years | 200 (23.0%) | 437 (50.3%) |
| 35 to 44 Years | 158 (34.5%) | 296 (64.6%) |
| 45 to 54 Years | 120 (32.7%) | 255 (69.5%) |
| 55 to 64 Years | 143 (22.7%) | 379 (60.3%) |
| 65 to 74 Years | 887 (93.2%) | 672 (70.6%) |
| 75 Years and over | 295 (100.0%) | 255 (86.4%) |
| Total | 2,008 (49.9%) | 2,558 (63.6%) |
Disability Status by Sex by Age in Longbranch
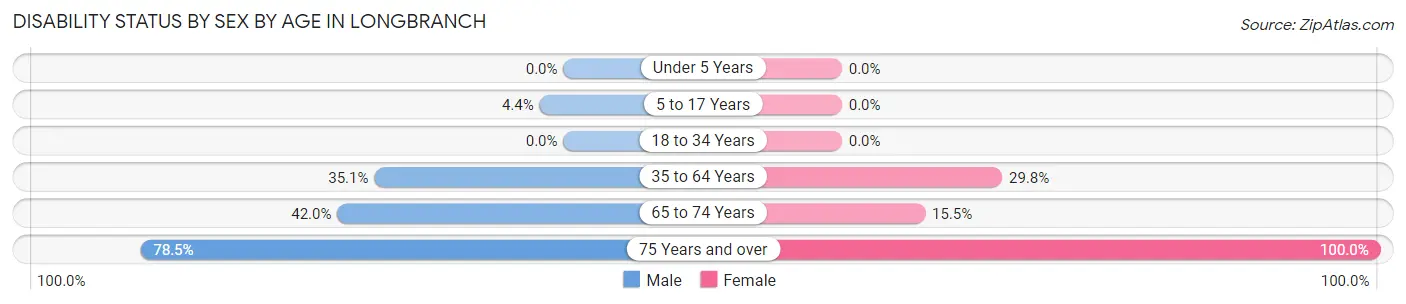
| Age Bracket | Male | Female |
| Under 5 Years | 0 (0.0%) | 0 (0.0%) |
| 5 to 17 Years | 10 (4.4%) | 0 (0.0%) |
| 18 to 34 Years | 0 (0.0%) | 0 (0.0%) |
| 35 to 64 Years | 199 (35.1%) | 264 (29.8%) |
| 65 to 74 Years | 261 (42.0%) | 51 (15.4%) |
| 75 Years and over | 179 (78.5%) | 67 (100.0%) |
Disability Class by Sex by Age in Longbranch
Disability Class: Hearing Difficulty
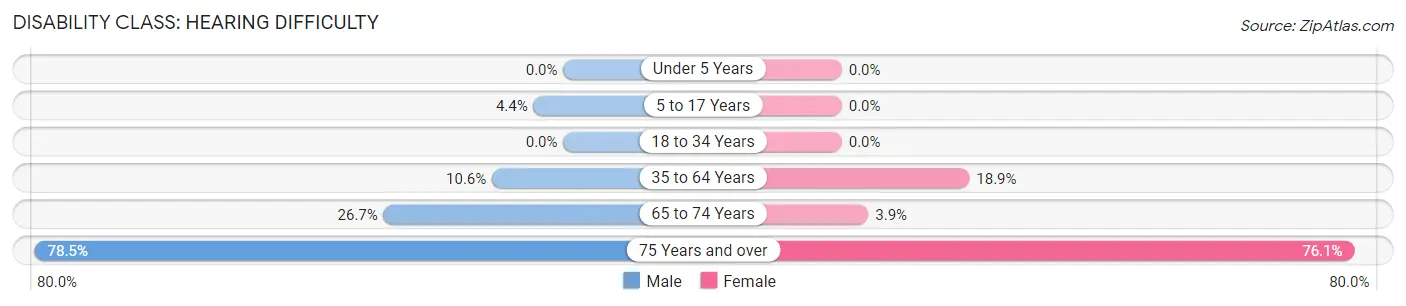
| Age Bracket | Male | Female |
| Under 5 Years | 0 (0.0%) | 0 (0.0%) |
| 5 to 17 Years | 10 (4.4%) | 0 (0.0%) |
| 18 to 34 Years | 0 (0.0%) | 0 (0.0%) |
| 35 to 64 Years | 60 (10.6%) | 168 (18.9%) |
| 65 to 74 Years | 166 (26.7%) | 13 (3.9%) |
| 75 Years and over | 179 (78.5%) | 51 (76.1%) |
Disability Class: Vision Difficulty
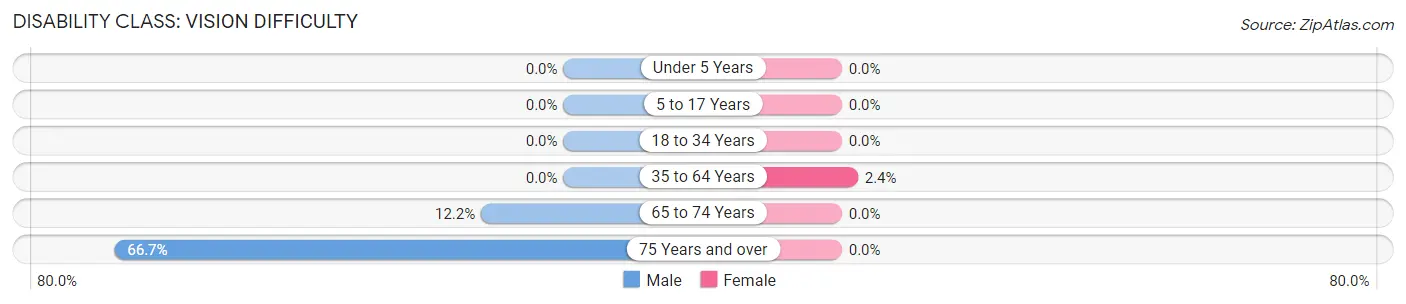
| Age Bracket | Male | Female |
| Under 5 Years | 0 (0.0%) | 0 (0.0%) |
| 5 to 17 Years | 0 (0.0%) | 0 (0.0%) |
| 18 to 34 Years | 0 (0.0%) | 0 (0.0%) |
| 35 to 64 Years | 0 (0.0%) | 21 (2.4%) |
| 65 to 74 Years | 76 (12.2%) | 0 (0.0%) |
| 75 Years and over | 152 (66.7%) | 0 (0.0%) |
Disability Class: Cognitive Difficulty
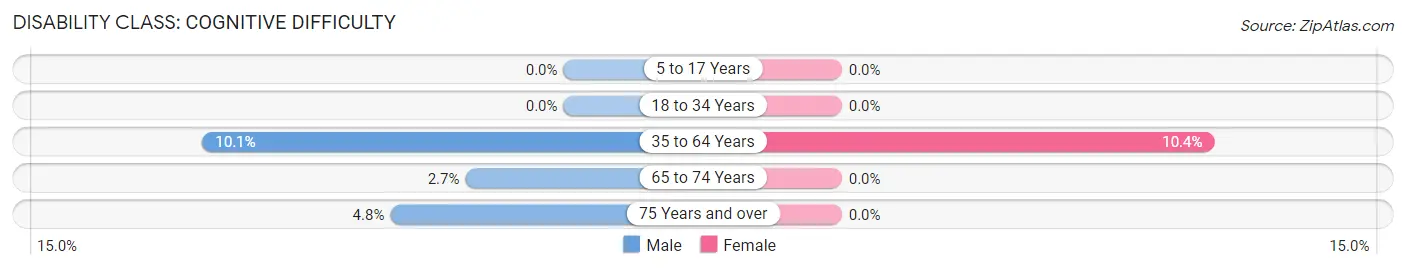
| Age Bracket | Male | Female |
| 5 to 17 Years | 0 (0.0%) | 0 (0.0%) |
| 18 to 34 Years | 0 (0.0%) | 0 (0.0%) |
| 35 to 64 Years | 57 (10.1%) | 92 (10.4%) |
| 65 to 74 Years | 17 (2.7%) | 0 (0.0%) |
| 75 Years and over | 11 (4.8%) | 0 (0.0%) |
Disability Class: Ambulatory Difficulty
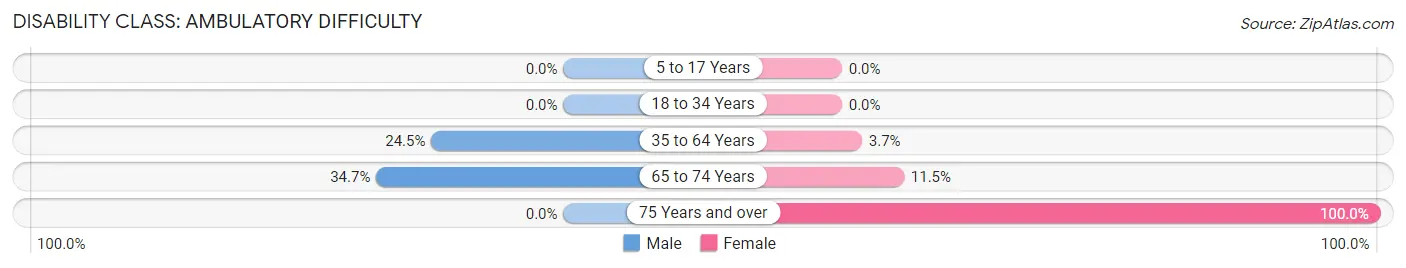
| Age Bracket | Male | Female |
| 5 to 17 Years | 0 (0.0%) | 0 (0.0%) |
| 18 to 34 Years | 0 (0.0%) | 0 (0.0%) |
| 35 to 64 Years | 139 (24.5%) | 33 (3.7%) |
| 65 to 74 Years | 216 (34.7%) | 38 (11.5%) |
| 75 Years and over | 0 (0.0%) | 67 (100.0%) |
Disability Class: Self-Care Difficulty
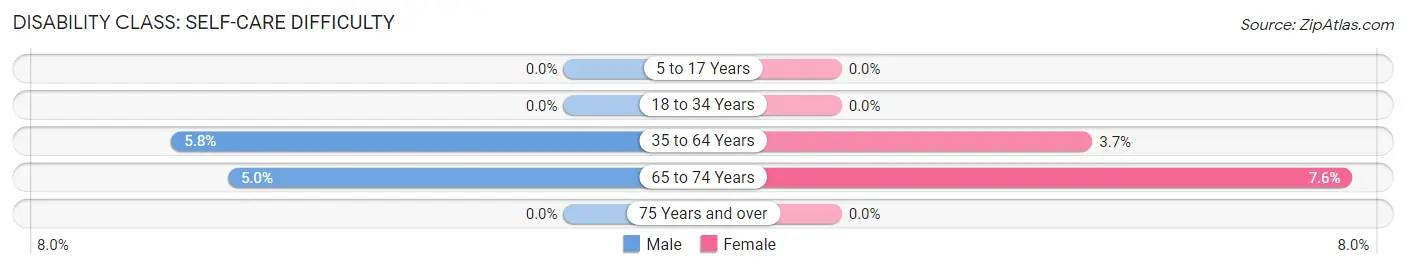
| Age Bracket | Male | Female |
| 5 to 17 Years | 0 (0.0%) | 0 (0.0%) |
| 18 to 34 Years | 0 (0.0%) | 0 (0.0%) |
| 35 to 64 Years | 33 (5.8%) | 33 (3.7%) |
| 65 to 74 Years | 31 (5.0%) | 25 (7.6%) |
| 75 Years and over | 0 (0.0%) | 0 (0.0%) |
Technology Access in Longbranch
Computing Device Access in Longbranch
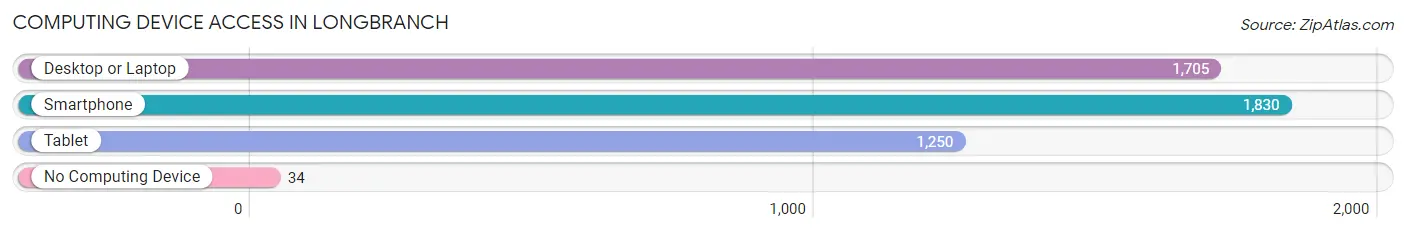
| Device Type | # Households | % Households |
| Desktop or Laptop | 1,705 | 89.0% |
| Smartphone | 1,830 | 95.5% |
| Tablet | 1,250 | 65.2% |
| No Computing Device | 34 | 1.8% |
| Total | 1,916 | 100.0% |
Internet Access in Longbranch
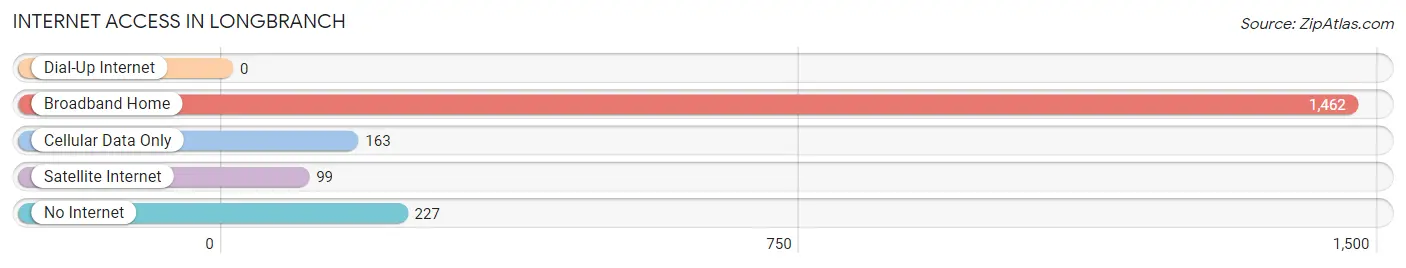
| Internet Type | # Households | % Households |
| Dial-Up Internet | 0 | 0.0% |
| Broadband Home | 1,462 | 76.3% |
| Cellular Data Only | 163 | 8.5% |
| Satellite Internet | 99 | 5.2% |
| No Internet | 227 | 11.8% |
| Total | 1,916 | 100.0% |
Longbranch Summary
Longbranch is a small unincorporated community located in Pierce County, Washington, United States. It is situated on the Key Peninsula, a narrow strip of land that separates Puget Sound from the Strait of Juan de Fuca. The community is located approximately 25 miles southwest of Tacoma and 40 miles northwest of Seattle.
History
Longbranch was first settled in the late 1800s by homesteaders who were attracted to the area by its abundant natural resources. The first post office was established in 1891 and the community was officially incorporated in 1909. The town was named after a nearby creek, which was named for its long, winding course.
The area was primarily a logging and fishing community until the 1950s, when the construction of the Longbranch Marina began. The marina was completed in 1959 and has since become a popular destination for boaters and fishermen.
Geography
Longbranch is located on the Key Peninsula, a narrow strip of land that separates Puget Sound from the Strait of Juan de Fuca. The community is situated on the western shore of the peninsula, approximately 25 miles southwest of Tacoma and 40 miles northwest of Seattle.
The area is characterized by its rugged coastline, dense forests, and numerous bays and inlets. The nearby Longbranch Marina is a popular destination for boaters and fishermen.
Economy
Longbranch is primarily a residential community, with most of its residents employed in the nearby cities of Tacoma and Seattle. The area is also home to a number of small businesses, including a marina, a general store, and a few restaurants.
The Longbranch Marina is the largest employer in the area, providing jobs for local residents as well as visitors. The marina is a popular destination for boaters and fishermen, and offers a variety of services, including boat rentals, fishing charters, and boat repair.
Demographics
As of the 2010 census, the population of Longbranch was 1,845. The racial makeup of the community was 94.3% White, 0.7% African American, 0.7% Native American, 0.7% Asian, 0.2% Pacific Islander, and 2.6% from other races. The median household income was $50,000, and the median age was 44.
Longbranch is a small, close-knit community with a strong sense of community spirit. The area is home to a variety of recreational activities, including fishing, boating, and hiking. The nearby Longbranch Marina is a popular destination for boaters and fishermen, and the area is also home to a number of small businesses.
Common Questions
What is Per Capita Income in Longbranch?
Per Capita income in Longbranch is $59,476.
What is the Median Family Income in Longbranch?
Median Family Income in Longbranch is $91,422.
What is the Median Household income in Longbranch?
Median Household Income in Longbranch is $91,563.
What is Income or Wage Gap in Longbranch?
Income or Wage Gap in Longbranch is 41.4%.
Women in Longbranch earn 58.6 cents for every dollar earned by a man.
What is Inequality or Gini Index in Longbranch?
Inequality or Gini Index in Longbranch is 0.49.
What is the Total Population of Longbranch?
Total Population of Longbranch is 4,081.
What is the Total Male Population of Longbranch?
Total Male Population of Longbranch is 2,190.
What is the Total Female Population of Longbranch?
Total Female Population of Longbranch is 1,891.
What is the Ratio of Males per 100 Females in Longbranch?
There are 115.81 Males per 100 Females in Longbranch.
What is the Ratio of Females per 100 Males in Longbranch?
There are 86.35 Females per 100 Males in Longbranch.
What is the Median Population Age in Longbranch?
Median Population Age in Longbranch is 53.2 Years.
What is the Average Family Size in Longbranch
Average Family Size in Longbranch is 2.5 People.
What is the Average Household Size in Longbranch
Average Household Size in Longbranch is 2.1 People.
How Large is the Labor Force in Longbranch?
There are 1,959 People in the Labor Forcein in Longbranch.
What is the Percentage of People in the Labor Force in Longbranch?
54.0% of People are in the Labor Force in Longbranch.
What is the Unemployment Rate in Longbranch?
Unemployment Rate in Longbranch is 3.9%.