Lofall, WA Map & Demographics
Lofall Map
Lofall Overview
$56,532
PER CAPITA INCOME
$118,125
AVG FAMILY INCOME
$110,250
AVG HOUSEHOLD INCOME
48.6%
WAGE / INCOME GAP [ % ]
51.4¢/ $1
WAGE / INCOME GAP [ $ ]
0.35
INEQUALITY / GINI INDEX
2,038
TOTAL POPULATION
1,094
MALE POPULATION
944
FEMALE POPULATION
115.89
MALES / 100 FEMALES
86.29
FEMALES / 100 MALES
44.6
MEDIAN AGE
2.8
AVG FAMILY SIZE
2.5
AVG HOUSEHOLD SIZE
1,124
LABOR FORCE [ PEOPLE ]
67.9%
PERCENT IN LABOR FORCE
3.4%
UNEMPLOYMENT RATE
Income in Lofall
Income Overview in Lofall
Per Capita Income in Lofall is $56,532, while median incomes of families and households are $118,125 and $110,250 respectively.
| Characteristic | Number | Measure |
| Per Capita Income | 2,038 | $56,532 |
| Median Family Income | 579 | $118,125 |
| Mean Family Income | 579 | $152,842 |
| Median Household Income | 830 | $110,250 |
| Mean Household Income | 830 | $138,027 |
| Income Deficit | 579 | $0 |
| Wage / Income Gap (%) | 2,038 | 48.58% |
| Wage / Income Gap ($) | 2,038 | 51.42¢ per $1 |
| Gini / Inequality Index | 2,038 | 0.35 |
Earnings by Sex in Lofall
Average Earnings in Lofall are $60,000, $79,896 for men and $41,083 for women, a difference of 48.6%.
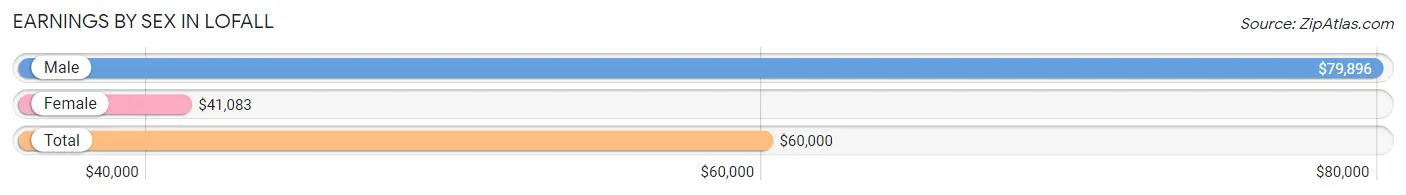
| Sex | Number | Average Earnings |
| Male | 698 (58.0%) | $79,896 |
| Female | 506 (42.0%) | $41,083 |
| Total | 1,204 (100.0%) | $60,000 |
Earnings by Sex by Income Bracket in Lofall
The most common earnings brackets in Lofall are $100,000+ for men (274 | 39.3%) and $100,000+ for women (79 | 15.6%).
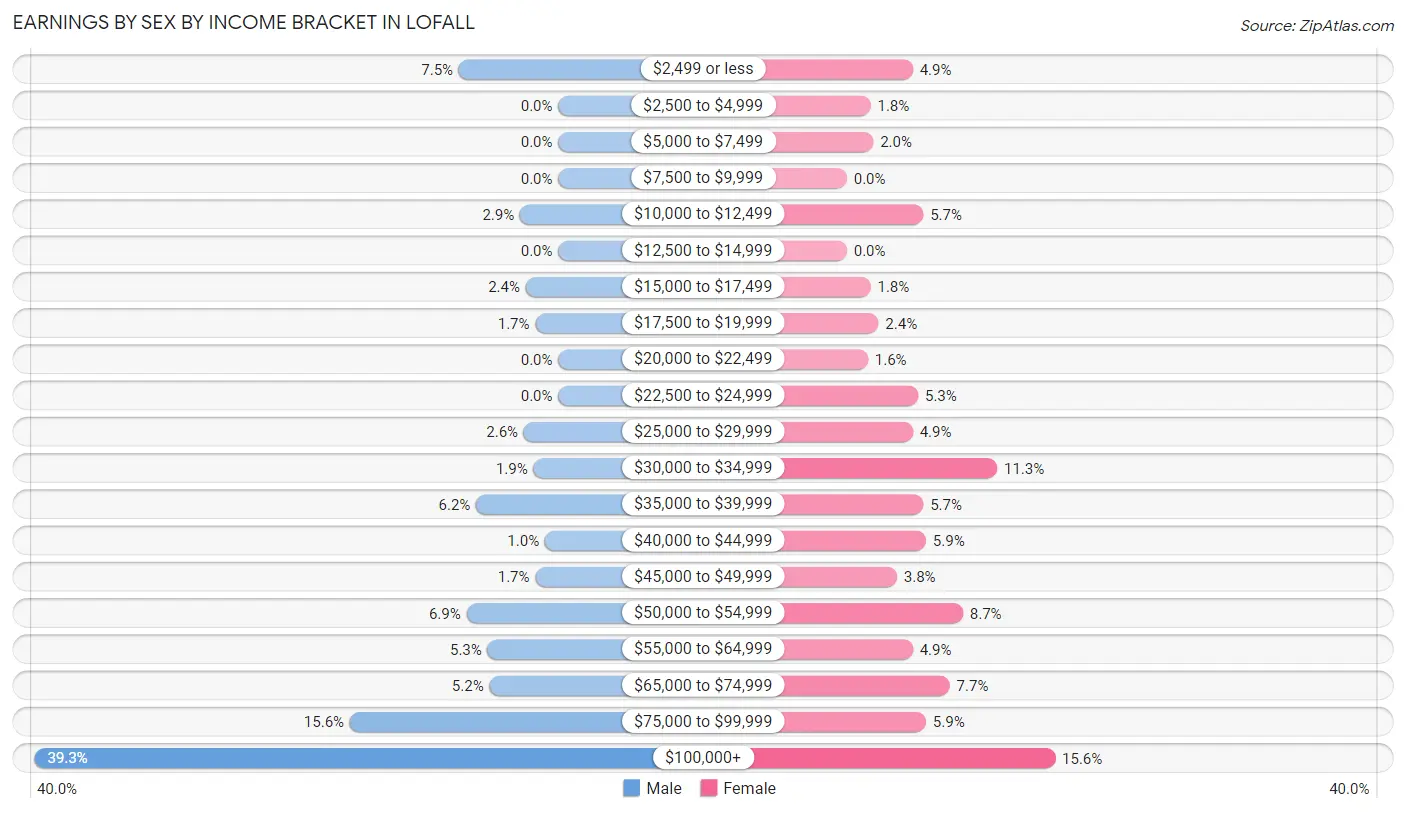
| Income | Male | Female |
| $2,499 or less | 52 (7.4%) | 25 (4.9%) |
| $2,500 to $4,999 | 0 (0.0%) | 9 (1.8%) |
| $5,000 to $7,499 | 0 (0.0%) | 10 (2.0%) |
| $7,500 to $9,999 | 0 (0.0%) | 0 (0.0%) |
| $10,000 to $12,499 | 20 (2.9%) | 29 (5.7%) |
| $12,500 to $14,999 | 0 (0.0%) | 0 (0.0%) |
| $15,000 to $17,499 | 17 (2.4%) | 9 (1.8%) |
| $17,500 to $19,999 | 12 (1.7%) | 12 (2.4%) |
| $20,000 to $22,499 | 0 (0.0%) | 8 (1.6%) |
| $22,500 to $24,999 | 0 (0.0%) | 27 (5.3%) |
| $25,000 to $29,999 | 18 (2.6%) | 25 (4.9%) |
| $30,000 to $34,999 | 13 (1.9%) | 57 (11.3%) |
| $35,000 to $39,999 | 43 (6.2%) | 29 (5.7%) |
| $40,000 to $44,999 | 7 (1.0%) | 30 (5.9%) |
| $45,000 to $49,999 | 12 (1.7%) | 19 (3.7%) |
| $50,000 to $54,999 | 48 (6.9%) | 44 (8.7%) |
| $55,000 to $64,999 | 37 (5.3%) | 25 (4.9%) |
| $65,000 to $74,999 | 36 (5.2%) | 39 (7.7%) |
| $75,000 to $99,999 | 109 (15.6%) | 30 (5.9%) |
| $100,000+ | 274 (39.3%) | 79 (15.6%) |
| Total | 698 (100.0%) | 506 (100.0%) |
Earnings by Sex by Educational Attainment in Lofall
Average earnings in Lofall are $90,446 for men and $45,781 for women, a difference of 49.4%. Men with an educational attainment of bachelor's degree enjoy the highest average annual earnings of $110,446, while those with high school diploma education earn the least with $39,154. Women with an educational attainment of high school diploma earn the most with the average annual earnings of $53,611, while those with bachelor's degree education have the smallest earnings of $45,156.
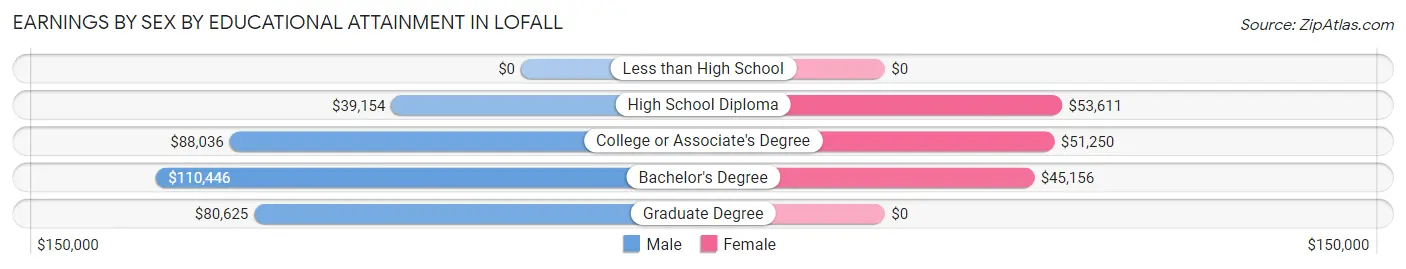
| Educational Attainment | Male Income | Female Income |
| Less than High School | - | - |
| High School Diploma | $39,154 | $53,611 |
| College or Associate's Degree | $88,036 | $51,250 |
| Bachelor's Degree | $110,446 | $45,156 |
| Graduate Degree | $80,625 | $0 |
| Total | $90,446 | $45,781 |
Family Income in Lofall
Family Income Brackets in Lofall
According to the Lofall family income data, there are 195 families falling into the $100,000 to $149,999 income range, which is the most common income bracket and makes up 33.7% of all families.
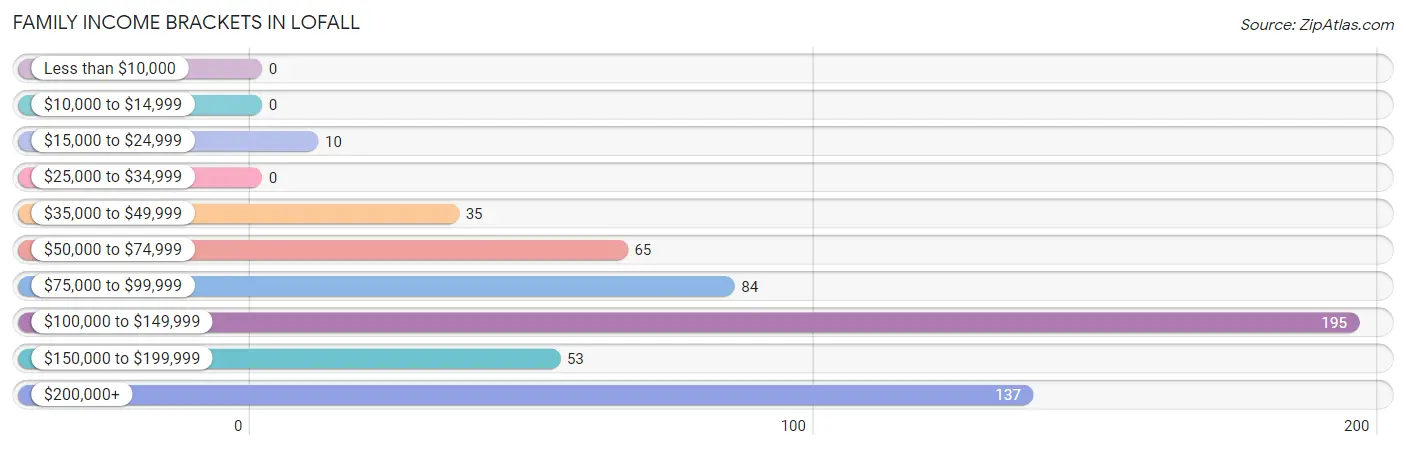
| Income Bracket | # Families | % Families |
| Less than $10,000 | 0 | 0.0% |
| $10,000 to $14,999 | 0 | 0.0% |
| $15,000 to $24,999 | 10 | 1.7% |
| $25,000 to $34,999 | 0 | 0.0% |
| $35,000 to $49,999 | 35 | 6.0% |
| $50,000 to $74,999 | 65 | 11.2% |
| $75,000 to $99,999 | 84 | 14.5% |
| $100,000 to $149,999 | 195 | 33.7% |
| $150,000 to $199,999 | 53 | 9.2% |
| $200,000+ | 137 | 23.7% |
Family Income by Famaliy Size in Lofall
4-person families (108 | 18.6%) account for the highest median family income in Lofall with $135,227 per family, while 2-person families (354 | 61.1%) have the highest median income of $58,875 per family member.
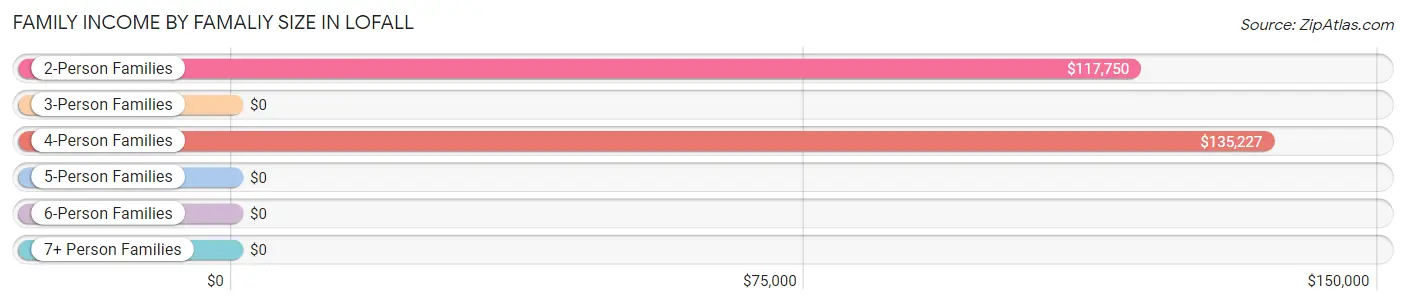
| Income Bracket | # Families | Median Income |
| 2-Person Families | 354 (61.1%) | $117,750 |
| 3-Person Families | 84 (14.5%) | $0 |
| 4-Person Families | 108 (18.6%) | $135,227 |
| 5-Person Families | 23 (4.0%) | $0 |
| 6-Person Families | 10 (1.7%) | $0 |
| 7+ Person Families | 0 (0.0%) | $0 |
| Total | 579 (100.0%) | $118,125 |
Family Income by Number of Earners in Lofall
The median family income in Lofall is $118,125, with families comprising 3+ earners (44) having the highest median family income of $250,001, while families with no earners (72) have the lowest median family income of $105,139, accounting for 7.6% and 12.4% of families, respectively.
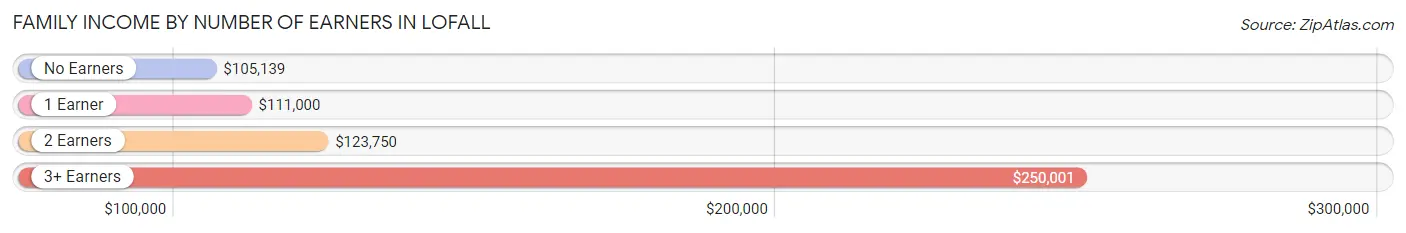
| Number of Earners | # Families | Median Income |
| No Earners | 72 (12.4%) | $105,139 |
| 1 Earner | 202 (34.9%) | $111,000 |
| 2 Earners | 261 (45.1%) | $123,750 |
| 3+ Earners | 44 (7.6%) | $250,001 |
| Total | 579 (100.0%) | $118,125 |
Household Income in Lofall
Household Income Brackets in Lofall
With 293 households falling in the category, the $100,000 to $149,999 income range is the most frequent in Lofall, accounting for 35.3% of all households.
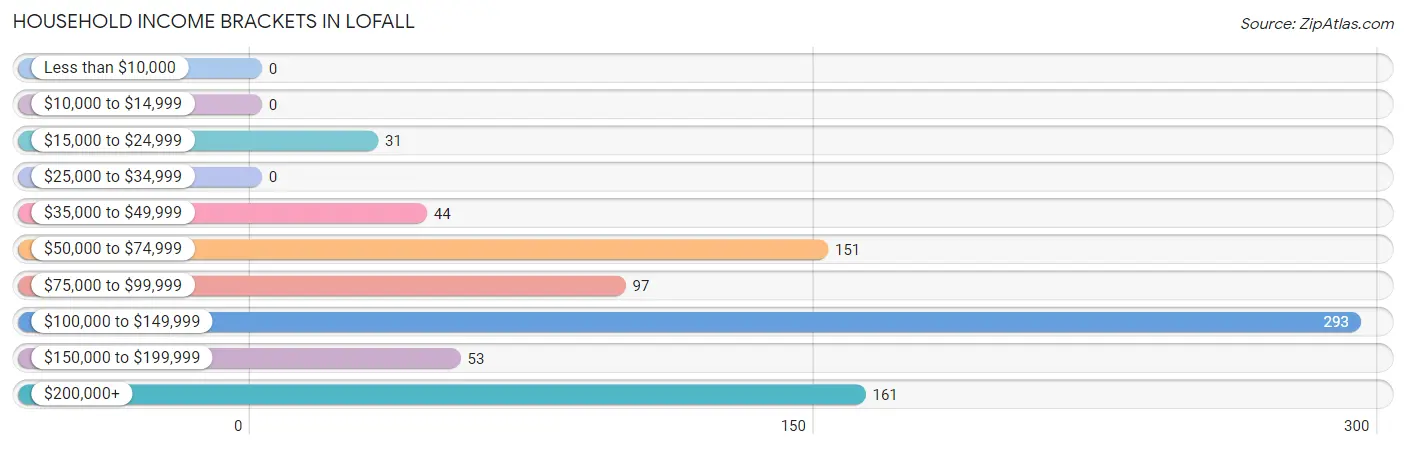
| Income Bracket | # Households | % Households |
| Less than $10,000 | 0 | 0.0% |
| $10,000 to $14,999 | 0 | 0.0% |
| $15,000 to $24,999 | 31 | 3.7% |
| $25,000 to $34,999 | 0 | 0.0% |
| $35,000 to $49,999 | 44 | 5.3% |
| $50,000 to $74,999 | 151 | 18.2% |
| $75,000 to $99,999 | 97 | 11.7% |
| $100,000 to $149,999 | 293 | 35.3% |
| $150,000 to $199,999 | 53 | 6.4% |
| $200,000+ | 161 | 19.4% |
Household Income by Householder Age in Lofall
The median household income in Lofall is $110,250, with the highest median household income of $135,156 found in the 25 to 44 years age bracket for the primary householder. A total of 246 households (29.6%) fall into this category. Meanwhile, the 15 to 24 years age bracket for the primary householder has the lowest median household income of $0, with 16 households (1.9%) in this group.
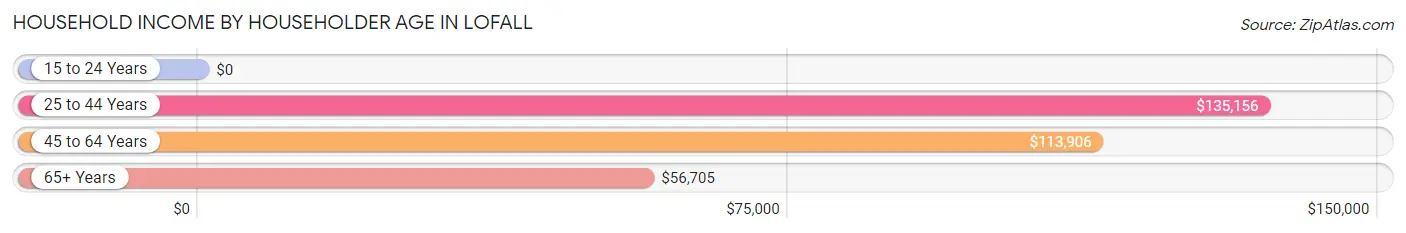
| Income Bracket | # Households | Median Income |
| 15 to 24 Years | 16 (1.9%) | $0 |
| 25 to 44 Years | 246 (29.6%) | $135,156 |
| 45 to 64 Years | 427 (51.4%) | $113,906 |
| 65+ Years | 141 (17.0%) | $56,705 |
| Total | 830 (100.0%) | $110,250 |
Poverty in Lofall
Income Below Poverty by Sex and Age in Lofall
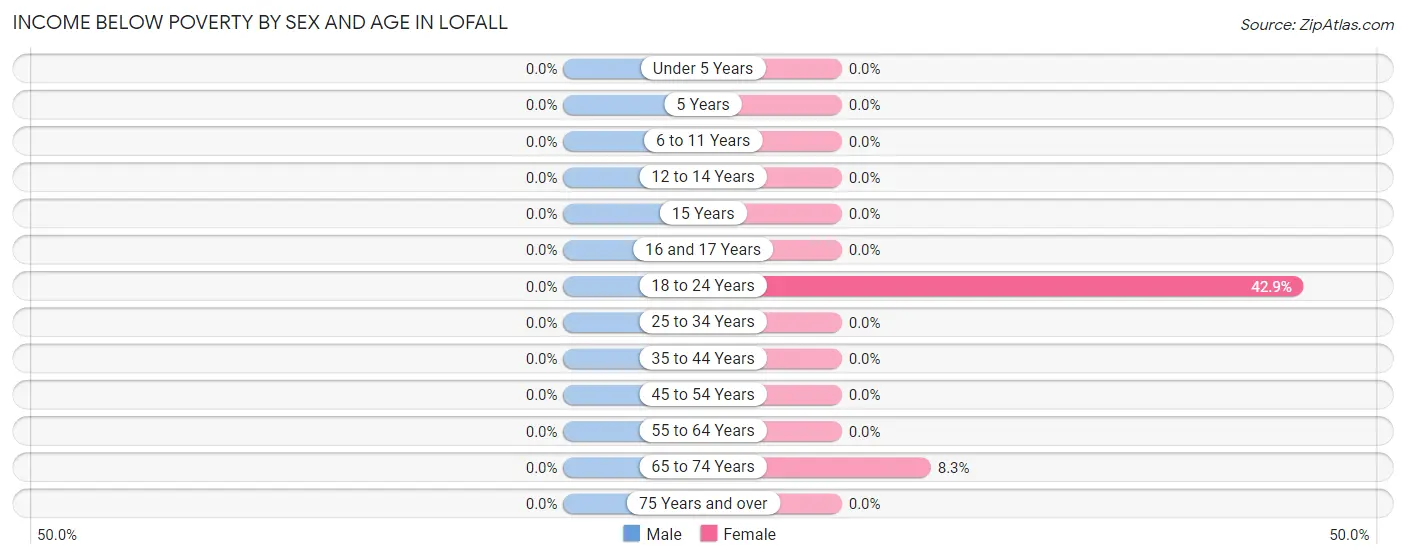
| Age Bracket | Male | Female |
| Under 5 Years | 0 (0.0%) | 0 (0.0%) |
| 5 Years | 0 (0.0%) | 0 (0.0%) |
| 6 to 11 Years | 0 (0.0%) | 0 (0.0%) |
| 12 to 14 Years | 0 (0.0%) | 0 (0.0%) |
| 15 Years | 0 (0.0%) | 0 (0.0%) |
| 16 and 17 Years | 0 (0.0%) | 0 (0.0%) |
| 18 to 24 Years | 0 (0.0%) | 12 (42.9%) |
| 25 to 34 Years | 0 (0.0%) | 0 (0.0%) |
| 35 to 44 Years | 0 (0.0%) | 0 (0.0%) |
| 45 to 54 Years | 0 (0.0%) | 0 (0.0%) |
| 55 to 64 Years | 0 (0.0%) | 0 (0.0%) |
| 65 to 74 Years | 0 (0.0%) | 9 (8.3%) |
| 75 Years and over | 0 (0.0%) | 0 (0.0%) |
| Total | 0 (0.0%) | 21 (2.2%) |
Income Above Poverty by Sex and Age in Lofall
According to the poverty statistics in Lofall, males aged under 5 years and females aged under 5 years are the age groups that are most secure financially, with 100.0% of males and 100.0% of females in these age groups living above the poverty line.
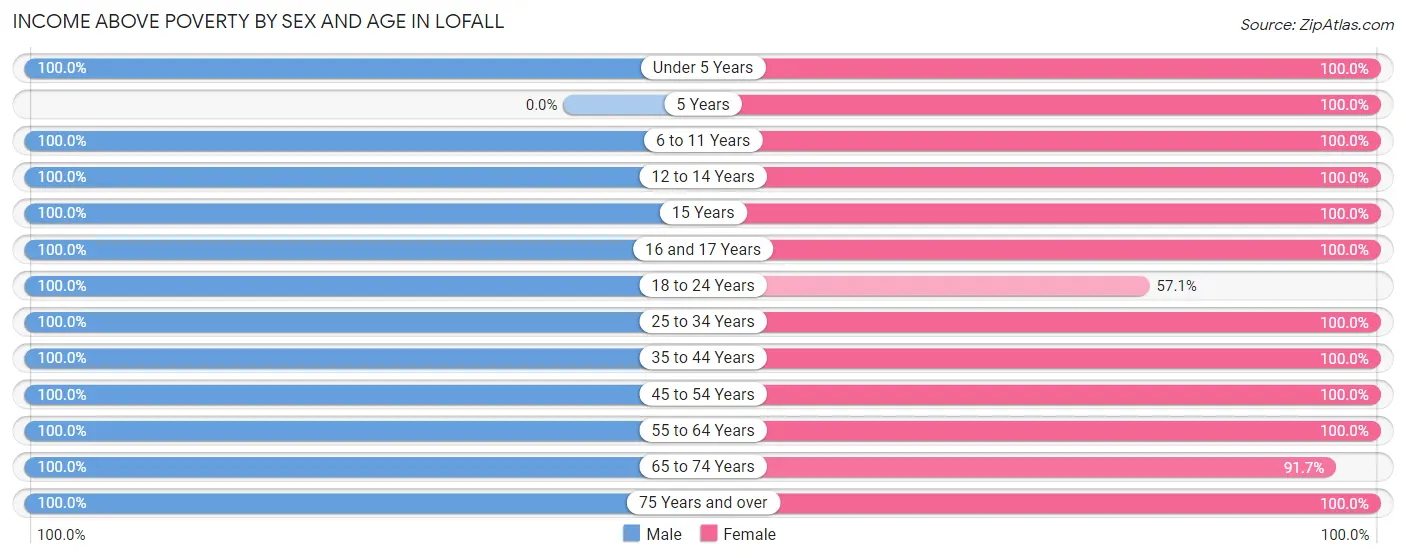
| Age Bracket | Male | Female |
| Under 5 Years | 61 (100.0%) | 20 (100.0%) |
| 5 Years | 0 (0.0%) | 21 (100.0%) |
| 6 to 11 Years | 88 (100.0%) | 48 (100.0%) |
| 12 to 14 Years | 46 (100.0%) | 22 (100.0%) |
| 15 Years | 44 (100.0%) | 9 (100.0%) |
| 16 and 17 Years | 10 (100.0%) | 21 (100.0%) |
| 18 to 24 Years | 71 (100.0%) | 16 (57.1%) |
| 25 to 34 Years | 120 (100.0%) | 128 (100.0%) |
| 35 to 44 Years | 170 (100.0%) | 94 (100.0%) |
| 45 to 54 Years | 116 (100.0%) | 135 (100.0%) |
| 55 to 64 Years | 190 (100.0%) | 279 (100.0%) |
| 65 to 74 Years | 133 (100.0%) | 100 (91.7%) |
| 75 Years and over | 21 (100.0%) | 30 (100.0%) |
| Total | 1,070 (100.0%) | 923 (97.8%) |
Income Below Poverty Among Married-Couple Families in Lofall
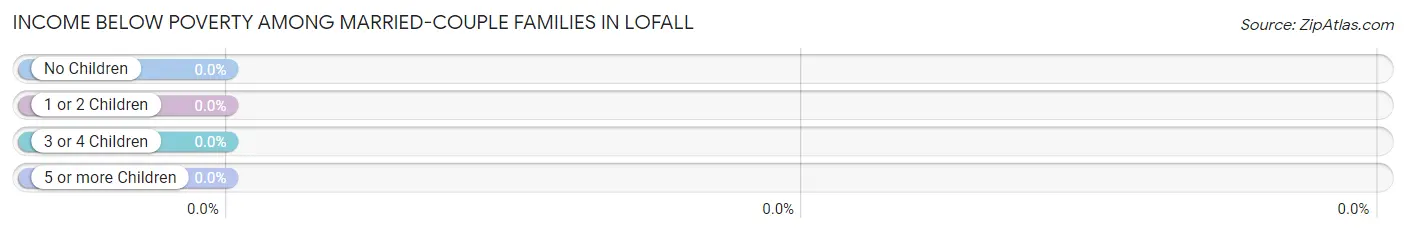
| Children | Above Poverty | Below Poverty |
| No Children | 322 (100.0%) | 0 (0.0%) |
| 1 or 2 Children | 164 (100.0%) | 0 (0.0%) |
| 3 or 4 Children | 20 (100.0%) | 0 (0.0%) |
| 5 or more Children | 0 (0.0%) | 0 (0.0%) |
| Total | 506 (100.0%) | 0 (0.0%) |
Income Below Poverty Among Single-Parent Households in Lofall
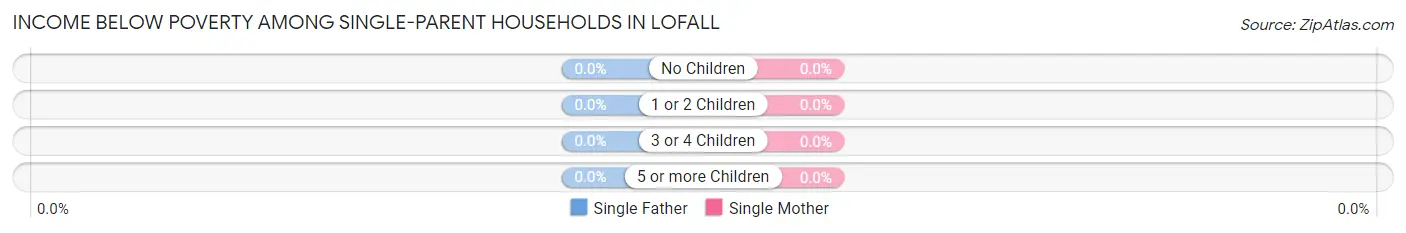
| Children | Single Father | Single Mother |
| No Children | 0 (0.0%) | 0 (0.0%) |
| 1 or 2 Children | 0 (0.0%) | 0 (0.0%) |
| 3 or 4 Children | 0 (0.0%) | 0 (0.0%) |
| 5 or more Children | 0 (0.0%) | 0 (0.0%) |
| Total | 0 (0.0%) | 0 (0.0%) |
Income Below Poverty Among Married-Couple vs Single-Parent Households in Lofall
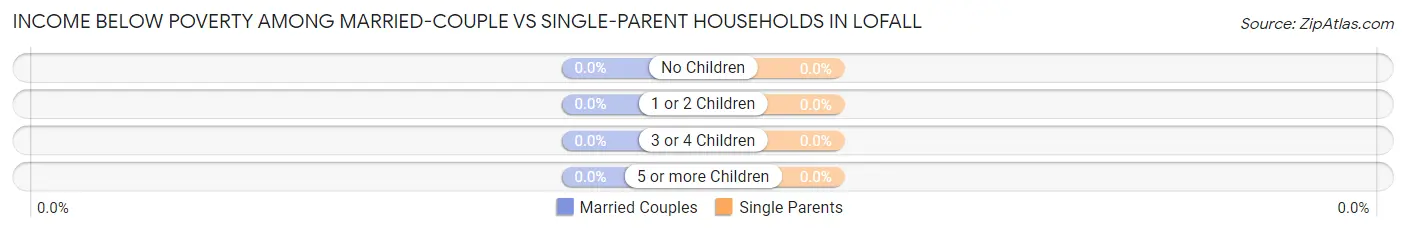
| Children | Married-Couple Families | Single-Parent Households |
| No Children | 0 (0.0%) | 0 (0.0%) |
| 1 or 2 Children | 0 (0.0%) | 0 (0.0%) |
| 3 or 4 Children | 0 (0.0%) | 0 (0.0%) |
| 5 or more Children | 0 (0.0%) | 0 (0.0%) |
| Total | 0 (0.0%) | 0 (0.0%) |
Race in Lofall
The most populous races in Lofall are White / Caucasian (1,737 | 85.2%), Two or more Races (154 | 7.6%), and Hispanic or Latino (116 | 5.7%).
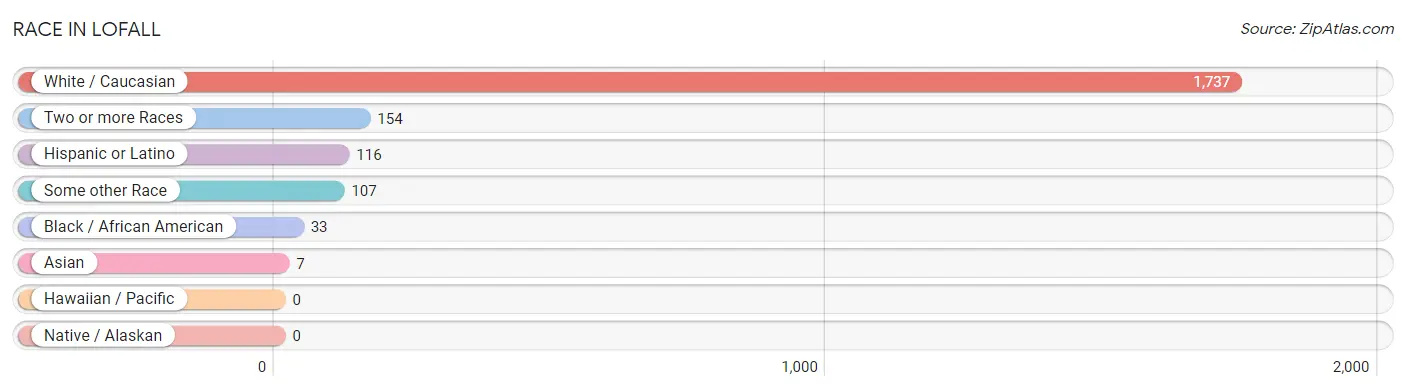
| Race | # Population | % Population |
| Asian | 7 | 0.3% |
| Black / African American | 33 | 1.6% |
| Hawaiian / Pacific | 0 | 0.0% |
| Hispanic or Latino | 116 | 5.7% |
| Native / Alaskan | 0 | 0.0% |
| White / Caucasian | 1,737 | 85.2% |
| Two or more Races | 154 | 7.6% |
| Some other Race | 107 | 5.2% |
| Total | 2,038 | 100.0% |
Ancestry in Lofall
The most populous ancestries reported in Lofall are German (505 | 24.8%), Irish (379 | 18.6%), English (287 | 14.1%), American (157 | 7.7%), and European (149 | 7.3%), together accounting for 72.5% of all Lofall residents.
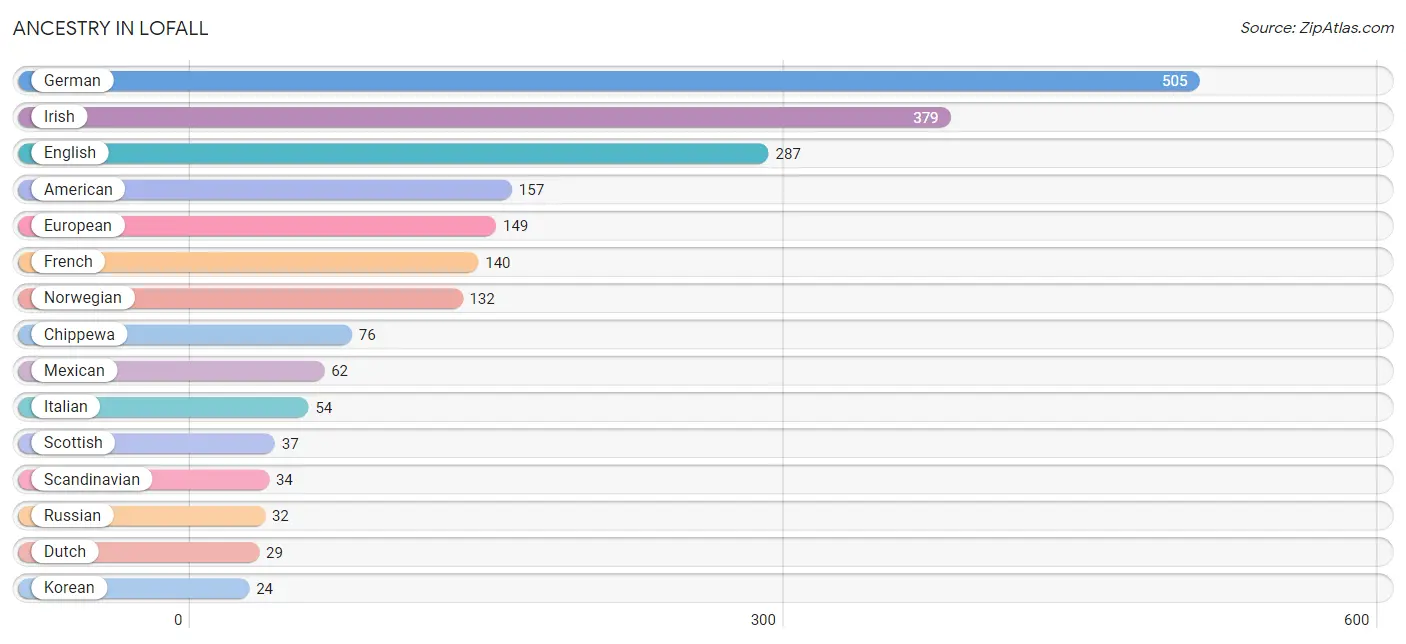
| Ancestry | # Population | % Population |
| American | 157 | 7.7% |
| Burmese | 7 | 0.3% |
| Chippewa | 76 | 3.7% |
| Czechoslovakian | 21 | 1.0% |
| Danish | 9 | 0.4% |
| Dominican | 23 | 1.1% |
| Dutch | 29 | 1.4% |
| English | 287 | 14.1% |
| European | 149 | 7.3% |
| French | 140 | 6.9% |
| German | 505 | 24.8% |
| Irish | 379 | 18.6% |
| Italian | 54 | 2.6% |
| Korean | 24 | 1.2% |
| Mexican | 62 | 3.0% |
| Northern European | 10 | 0.5% |
| Norwegian | 132 | 6.5% |
| Polish | 9 | 0.4% |
| Puget Sound Salish | 2 | 0.1% |
| Russian | 32 | 1.6% |
| Scandinavian | 34 | 1.7% |
| Scotch-Irish | 8 | 0.4% |
| Scottish | 37 | 1.8% |
| Slovak | 18 | 0.9% |
| Slovene | 24 | 1.2% |
| Swedish | 13 | 0.6% |
| Welsh | 18 | 0.9% |
| Yaqui | 1 | 0.1% | View All 28 Rows |
Immigrants in Lofall
The most numerous immigrant groups reported in Lofall came from Europe (27 | 1.3%), Germany (23 | 1.1%), Western Europe (23 | 1.1%), Africa (9 | 0.4%), and Eastern Africa (9 | 0.4%), together accounting for 4.5% of all Lofall residents.
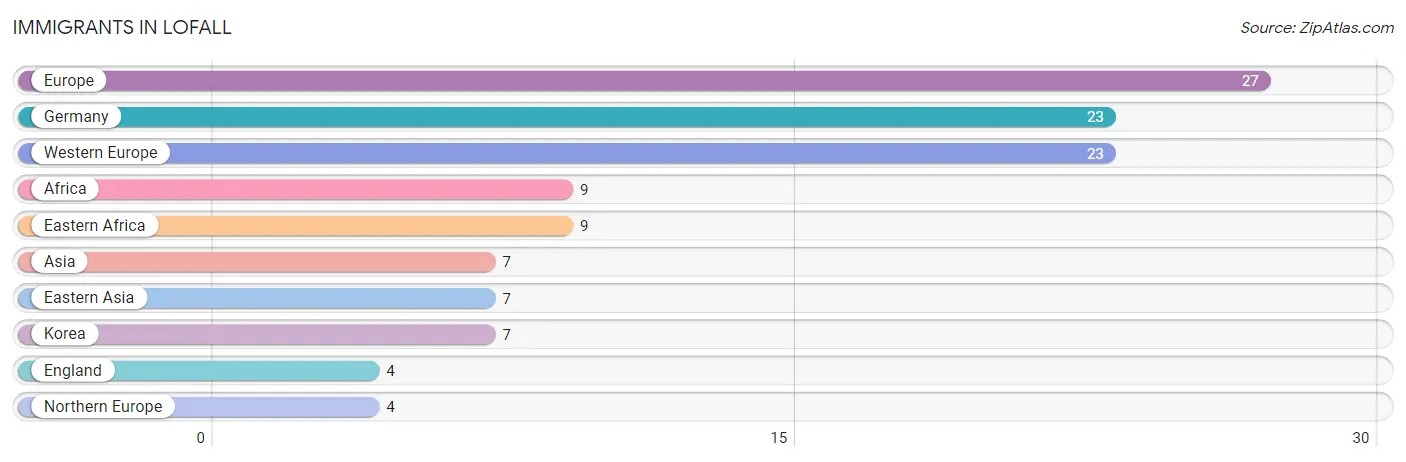
| Immigration Origin | # Population | % Population |
| Africa | 9 | 0.4% |
| Asia | 7 | 0.3% |
| Eastern Africa | 9 | 0.4% |
| Eastern Asia | 7 | 0.3% |
| England | 4 | 0.2% |
| Europe | 27 | 1.3% |
| Germany | 23 | 1.1% |
| Korea | 7 | 0.3% |
| Northern Europe | 4 | 0.2% |
| Western Europe | 23 | 1.1% | View All 10 Rows |
Sex and Age in Lofall
Sex and Age in Lofall
The most populous age groups in Lofall are 60 to 64 Years (119 | 10.9%) for men and 55 to 59 Years (154 | 16.3%) for women.
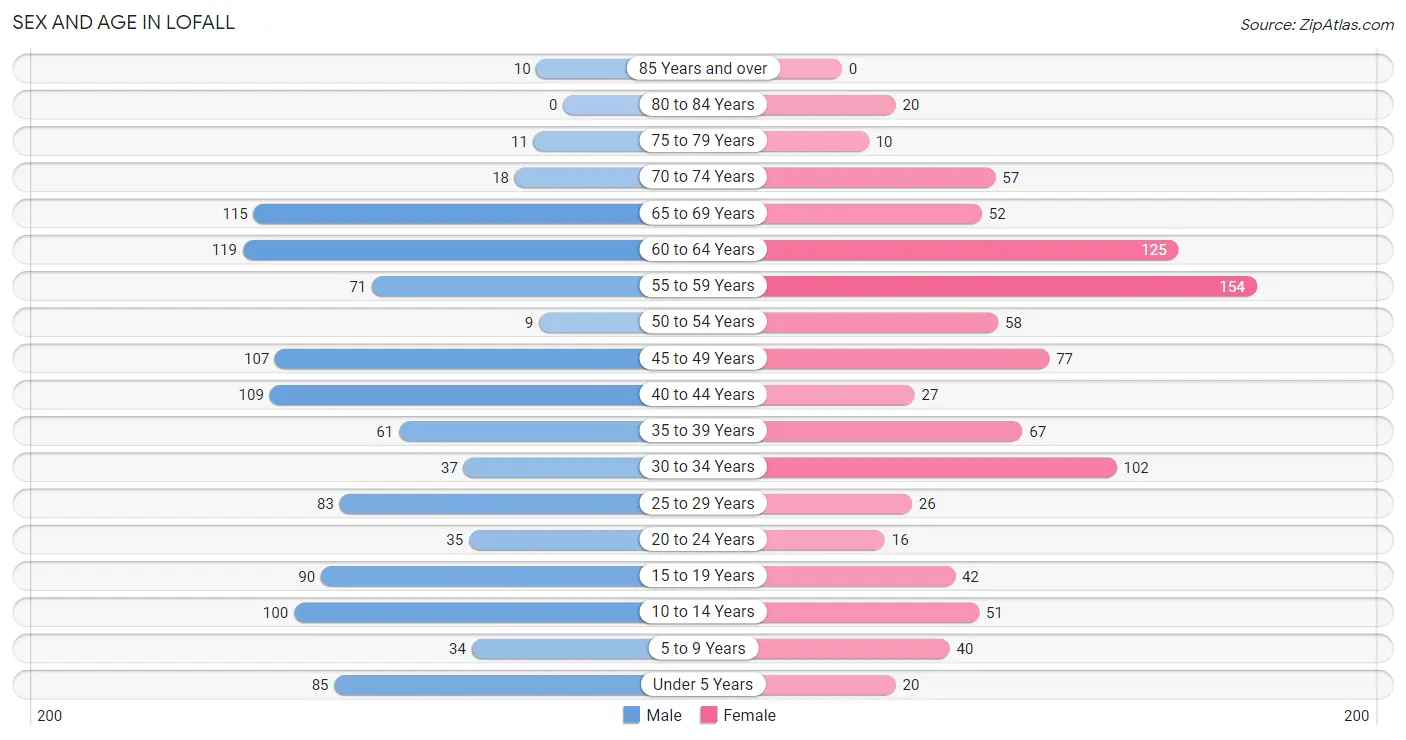
| Age Bracket | Male | Female |
| Under 5 Years | 85 (7.8%) | 20 (2.1%) |
| 5 to 9 Years | 34 (3.1%) | 40 (4.2%) |
| 10 to 14 Years | 100 (9.1%) | 51 (5.4%) |
| 15 to 19 Years | 90 (8.2%) | 42 (4.4%) |
| 20 to 24 Years | 35 (3.2%) | 16 (1.7%) |
| 25 to 29 Years | 83 (7.6%) | 26 (2.8%) |
| 30 to 34 Years | 37 (3.4%) | 102 (10.8%) |
| 35 to 39 Years | 61 (5.6%) | 67 (7.1%) |
| 40 to 44 Years | 109 (10.0%) | 27 (2.9%) |
| 45 to 49 Years | 107 (9.8%) | 77 (8.2%) |
| 50 to 54 Years | 9 (0.8%) | 58 (6.1%) |
| 55 to 59 Years | 71 (6.5%) | 154 (16.3%) |
| 60 to 64 Years | 119 (10.9%) | 125 (13.2%) |
| 65 to 69 Years | 115 (10.5%) | 52 (5.5%) |
| 70 to 74 Years | 18 (1.7%) | 57 (6.0%) |
| 75 to 79 Years | 11 (1.0%) | 10 (1.1%) |
| 80 to 84 Years | 0 (0.0%) | 20 (2.1%) |
| 85 Years and over | 10 (0.9%) | 0 (0.0%) |
| Total | 1,094 (100.0%) | 944 (100.0%) |
Families and Households in Lofall
Median Family Size in Lofall
The median family size in Lofall is 2.81 persons per family, with married-couple families (506 | 87.4%) accounting for the largest median family size of 2.86 persons per family. On the other hand, single male/father families (16 | 2.8%) represent the smallest median family size with 1.81 persons per family.
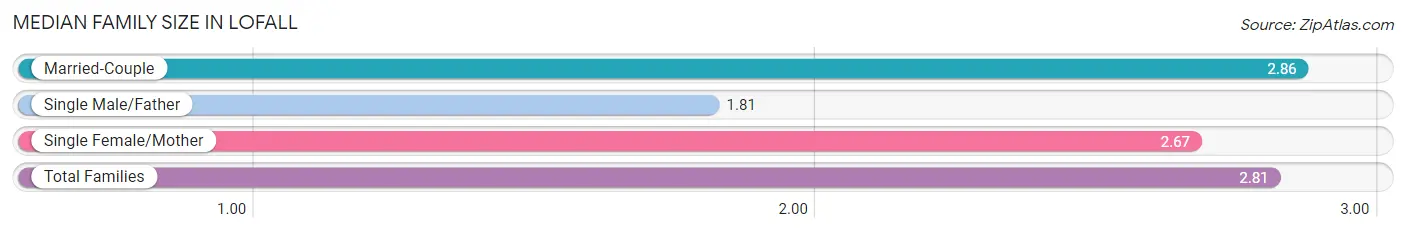
| Family Type | # Families | Family Size |
| Married-Couple | 506 (87.4%) | 2.86 |
| Single Male/Father | 16 (2.8%) | 1.81 |
| Single Female/Mother | 57 (9.8%) | 2.67 |
| Total Families | 579 (100.0%) | 2.81 |
Median Household Size in Lofall
The median household size in Lofall is 2.46 persons per household, with married-couple households (506 | 61.0%) accounting for the largest median household size of 2.86 persons per household. non-family households (251 | 30.2%) represent the smallest median household size with 1.63 persons per household.
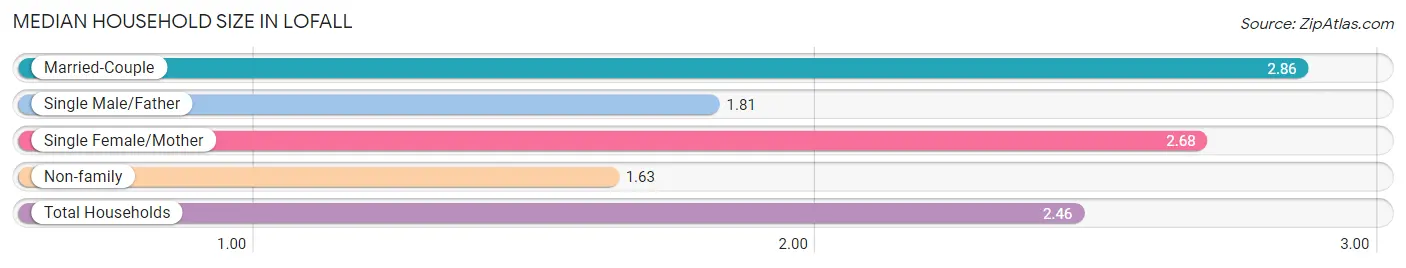
| Household Type | # Households | Household Size |
| Married-Couple | 506 (61.0%) | 2.86 |
| Single Male/Father | 16 (1.9%) | 1.81 |
| Single Female/Mother | 57 (6.9%) | 2.68 |
| Non-family | 251 (30.2%) | 1.63 |
| Total Households | 830 (100.0%) | 2.46 |
Household Size by Marriage Status in Lofall
Out of a total of 830 households in Lofall, 579 (69.8%) are family households, while 251 (30.2%) are nonfamily households. The most numerous type of family households are 2-person households, comprising 346, and the most common type of nonfamily households are 1-person households, comprising 166.
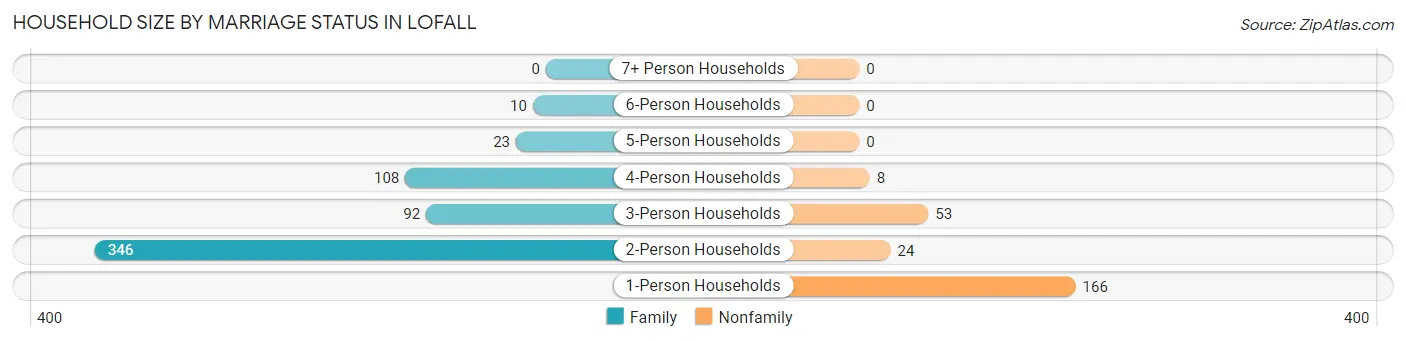
| Household Size | Family Households | Nonfamily Households |
| 1-Person Households | - | 166 (20.0%) |
| 2-Person Households | 346 (41.7%) | 24 (2.9%) |
| 3-Person Households | 92 (11.1%) | 53 (6.4%) |
| 4-Person Households | 108 (13.0%) | 8 (1.0%) |
| 5-Person Households | 23 (2.8%) | 0 (0.0%) |
| 6-Person Households | 10 (1.2%) | 0 (0.0%) |
| 7+ Person Households | 0 (0.0%) | 0 (0.0%) |
| Total | 579 (69.8%) | 251 (30.2%) |
Female Fertility in Lofall
Fertility by Age in Lofall
Average fertility rate in Lofall is 39.0 births per 1,000 women. Women in the age bracket of 20 to 34 years have the highest fertility rate with 97.0 births per 1,000 women. Women in the age bracket of 20 to 34 years acount for 100.0% of all women with births.
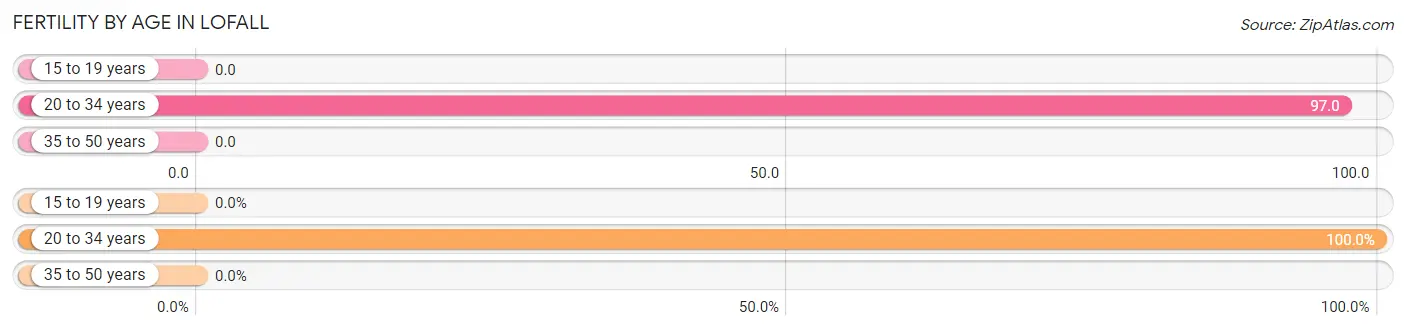
| Age Bracket | Women with Births | Births / 1,000 Women |
| 15 to 19 years | 0 (0.0%) | 0.0 |
| 20 to 34 years | 14 (100.0%) | 97.0 |
| 35 to 50 years | 0 (0.0%) | 0.0 |
| Total | 14 (100.0%) | 39.0 |
Fertility by Age by Marriage Status in Lofall
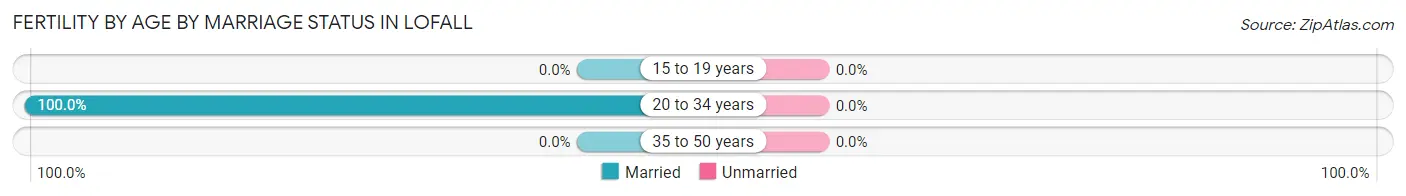
| Age Bracket | Married | Unmarried |
| 15 to 19 years | 0 (0.0%) | 0 (0.0%) |
| 20 to 34 years | 14 (100.0%) | 0 (0.0%) |
| 35 to 50 years | 0 (0.0%) | 0 (0.0%) |
| Total | 14 (100.0%) | 0 (0.0%) |
Fertility by Education in Lofall
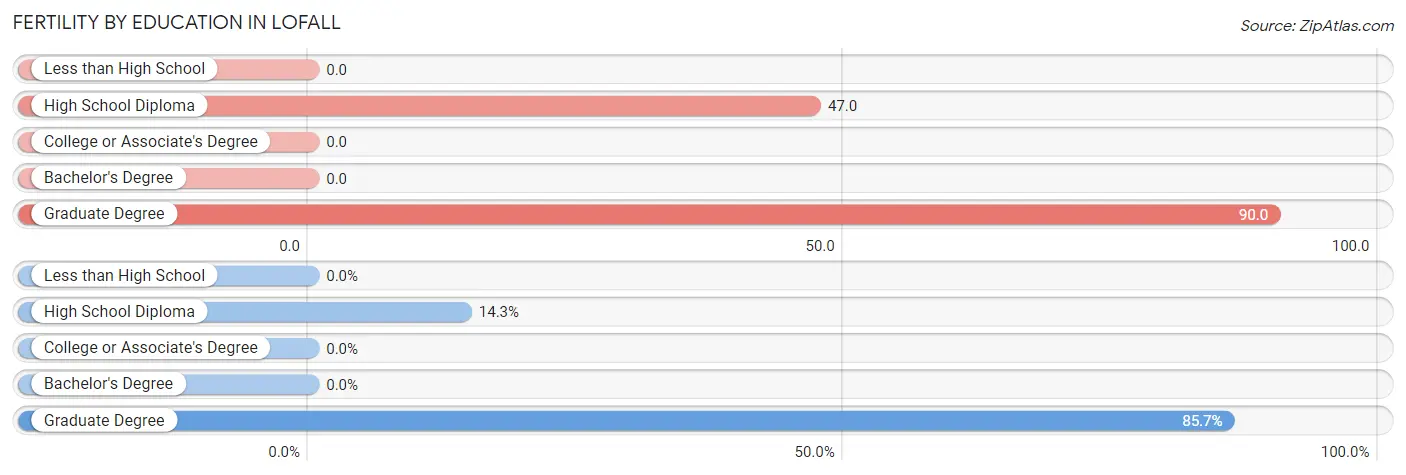
| Educational Attainment | Women with Births | Births / 1,000 Women |
| Less than High School | 0 (0.0%) | 0.0 |
| High School Diploma | 2 (14.3%) | 47.0 |
| College or Associate's Degree | 0 (0.0%) | 0.0 |
| Bachelor's Degree | 0 (0.0%) | 0.0 |
| Graduate Degree | 12 (85.7%) | 90.0 |
| Total | 14 (100.0%) | 39.0 |
Fertility by Education by Marriage Status in Lofall
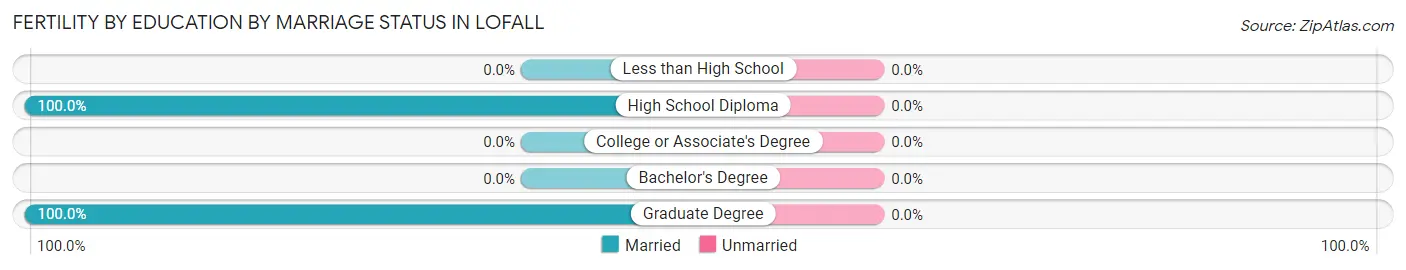
| Educational Attainment | Married | Unmarried |
| Less than High School | 0 (0.0%) | 0 (0.0%) |
| High School Diploma | 2 (100.0%) | 0 (0.0%) |
| College or Associate's Degree | 0 (0.0%) | 0 (0.0%) |
| Bachelor's Degree | 0 (0.0%) | 0 (0.0%) |
| Graduate Degree | 12 (100.0%) | 0 (0.0%) |
| Total | 14 (100.0%) | 0 (0.0%) |
Employment Characteristics in Lofall
Employment by Class of Employer in Lofall
Among the 1,074 employed individuals in Lofall, private company employees (527 | 49.1%), federal government employees (239 | 22.3%), and state government employees (116 | 10.8%) make up the most common classes of employment.
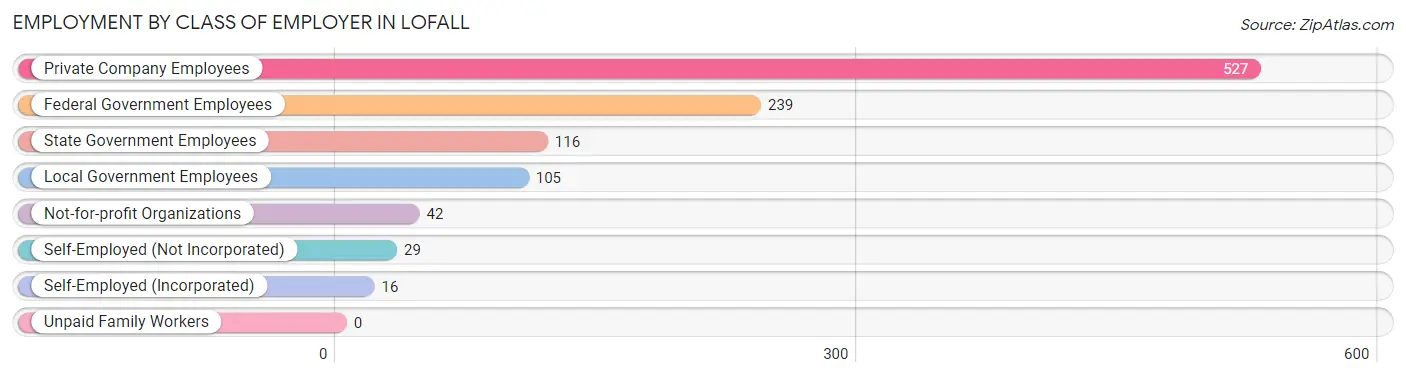
| Employer Class | # Employees | % Employees |
| Private Company Employees | 527 | 49.1% |
| Self-Employed (Incorporated) | 16 | 1.5% |
| Self-Employed (Not Incorporated) | 29 | 2.7% |
| Not-for-profit Organizations | 42 | 3.9% |
| Local Government Employees | 105 | 9.8% |
| State Government Employees | 116 | 10.8% |
| Federal Government Employees | 239 | 22.3% |
| Unpaid Family Workers | 0 | 0.0% |
| Total | 1,074 | 100.0% |
Employment Status by Age in Lofall
According to the labor force statistics for Lofall, out of the total population over 16 years of age (1,655), 67.9% or 1,124 individuals are in the labor force, with 3.4% or 38 of them unemployed. The age group with the highest labor force participation rate is 20 to 24 years, with 96.1% or 49 individuals in the labor force. Within the labor force, the 25 to 29 years age range has the highest percentage of unemployed individuals, with 22.8% or 18 of them being unemployed.
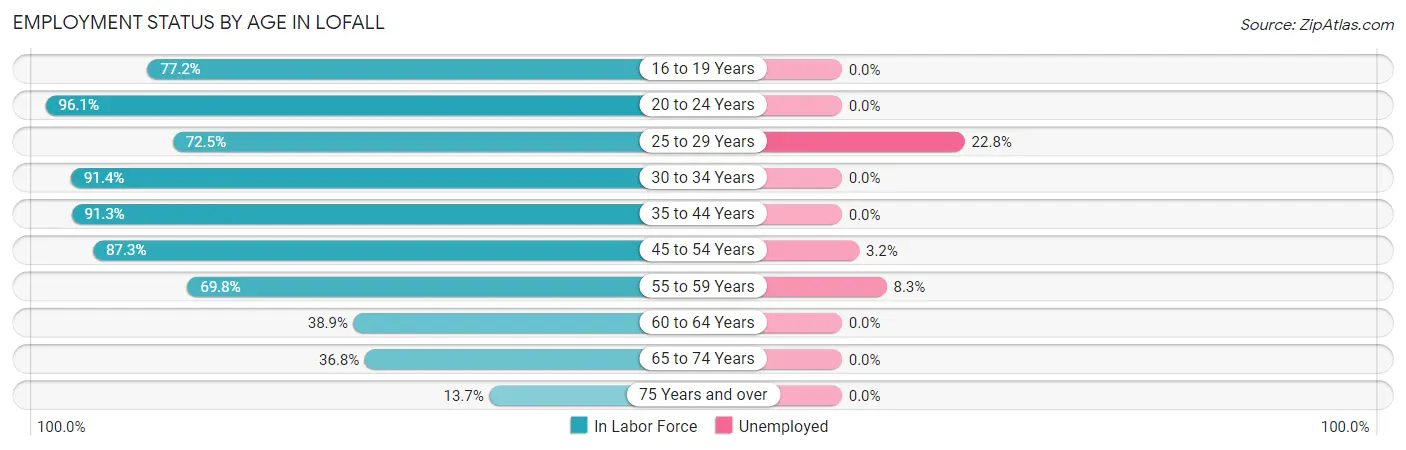
| Age Bracket | In Labor Force | Unemployed |
| 16 to 19 Years | 61 (77.2%) | 0 (0.0%) |
| 20 to 24 Years | 49 (96.1%) | 0 (0.0%) |
| 25 to 29 Years | 79 (72.5%) | 18 (22.8%) |
| 30 to 34 Years | 127 (91.4%) | 0 (0.0%) |
| 35 to 44 Years | 241 (91.3%) | 0 (0.0%) |
| 45 to 54 Years | 219 (87.3%) | 7 (3.2%) |
| 55 to 59 Years | 157 (69.8%) | 13 (8.3%) |
| 60 to 64 Years | 95 (38.9%) | 0 (0.0%) |
| 65 to 74 Years | 89 (36.8%) | 0 (0.0%) |
| 75 Years and over | 7 (13.7%) | 0 (0.0%) |
| Total | 1,124 (67.9%) | 38 (3.4%) |
Employment Status by Educational Attainment in Lofall
According to labor force statistics for Lofall, 74.5% of individuals (918) out of the total population between 25 and 64 years of age (1,232) are in the labor force, with 4.1% or 38 of them being unemployed. The group with the highest labor force participation rate are those with the educational attainment of less than high school, with 100.0% or 58 individuals in the labor force. Within the labor force, individuals with less than high school education have the highest percentage of unemployment, with 31.0% or 18 of them being unemployed.
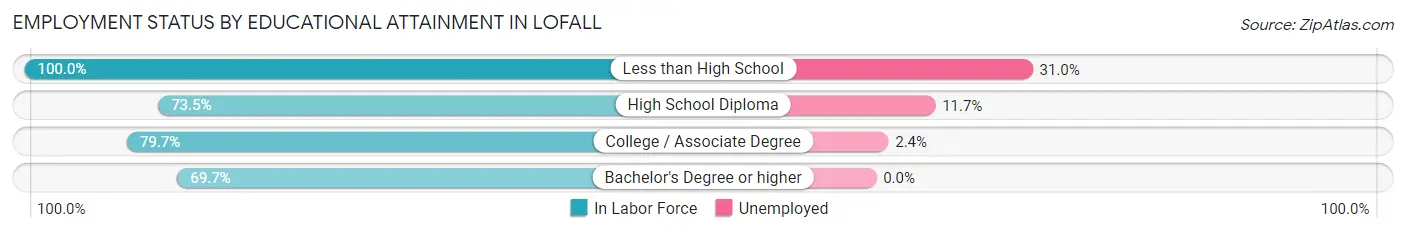
| Educational Attainment | In Labor Force | Unemployed |
| Less than High School | 58 (100.0%) | 18 (31.0%) |
| High School Diploma | 111 (73.5%) | 18 (11.7%) |
| College / Associate Degree | 286 (79.7%) | 9 (2.4%) |
| Bachelor's Degree or higher | 463 (69.7%) | 0 (0.0%) |
| Total | 918 (74.5%) | 51 (4.1%) |
Employment Occupations by Sex in Lofall
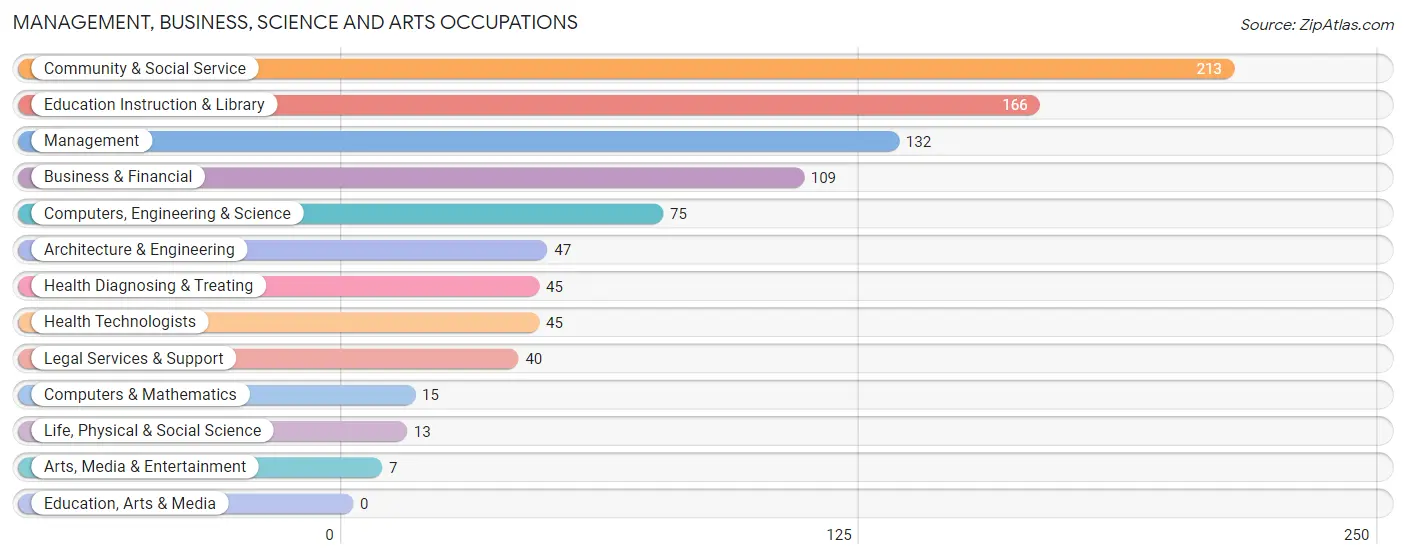
Management, Business, Science and Arts Occupations
The most common Management, Business, Science and Arts occupations in Lofall are Community & Social Service (213 | 19.6%), Education Instruction & Library (166 | 15.3%), Management (132 | 12.1%), Business & Financial (109 | 10.0%), and Computers, Engineering & Science (75 | 6.9%).
Management, Business, Science and Arts Occupations by Sex
Within the Management, Business, Science and Arts occupations in Lofall, the most male-oriented occupations are Business & Financial (100.0%), Computers & Mathematics (100.0%), and Life, Physical & Social Science (100.0%), while the most female-oriented occupations are Health Diagnosing & Treating (100.0%), Health Technologists (100.0%), and Education Instruction & Library (85.5%).
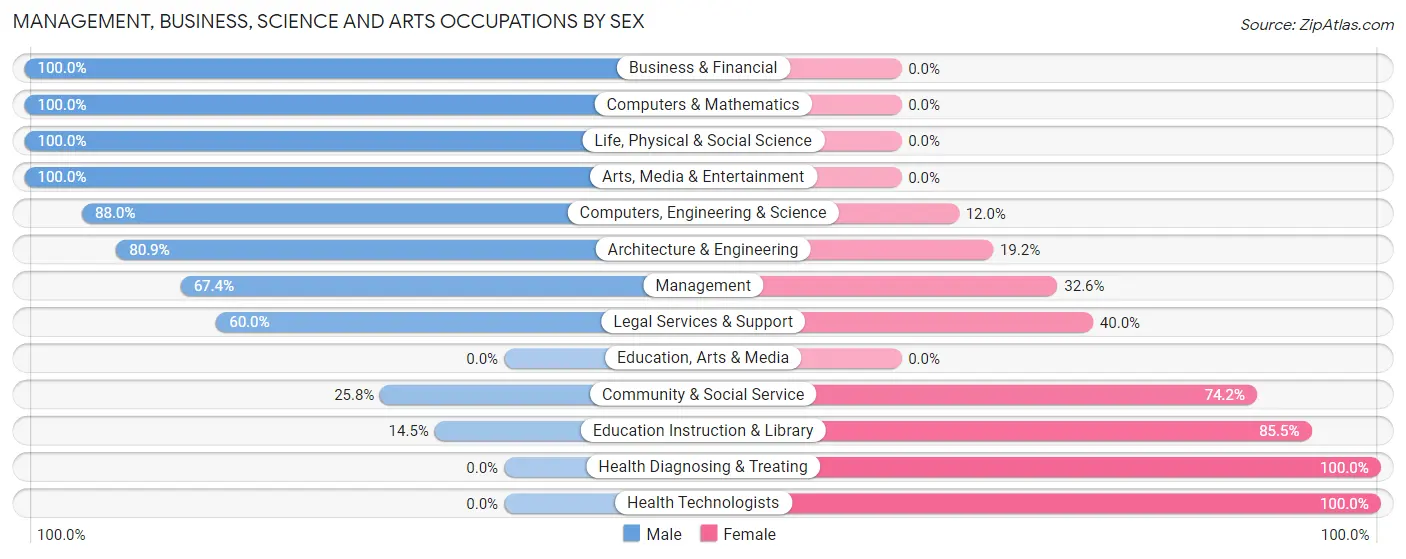
| Occupation | Male | Female |
| Management | 89 (67.4%) | 43 (32.6%) |
| Business & Financial | 109 (100.0%) | 0 (0.0%) |
| Computers, Engineering & Science | 66 (88.0%) | 9 (12.0%) |
| Computers & Mathematics | 15 (100.0%) | 0 (0.0%) |
| Architecture & Engineering | 38 (80.8%) | 9 (19.2%) |
| Life, Physical & Social Science | 13 (100.0%) | 0 (0.0%) |
| Community & Social Service | 55 (25.8%) | 158 (74.2%) |
| Education, Arts & Media | 0 (0.0%) | 0 (0.0%) |
| Legal Services & Support | 24 (60.0%) | 16 (40.0%) |
| Education Instruction & Library | 24 (14.5%) | 142 (85.5%) |
| Arts, Media & Entertainment | 7 (100.0%) | 0 (0.0%) |
| Health Diagnosing & Treating | 0 (0.0%) | 45 (100.0%) |
| Health Technologists | 0 (0.0%) | 45 (100.0%) |
| Total (Category) | 319 (55.6%) | 255 (44.4%) |
| Total (Overall) | 623 (57.4%) | 463 (42.6%) |
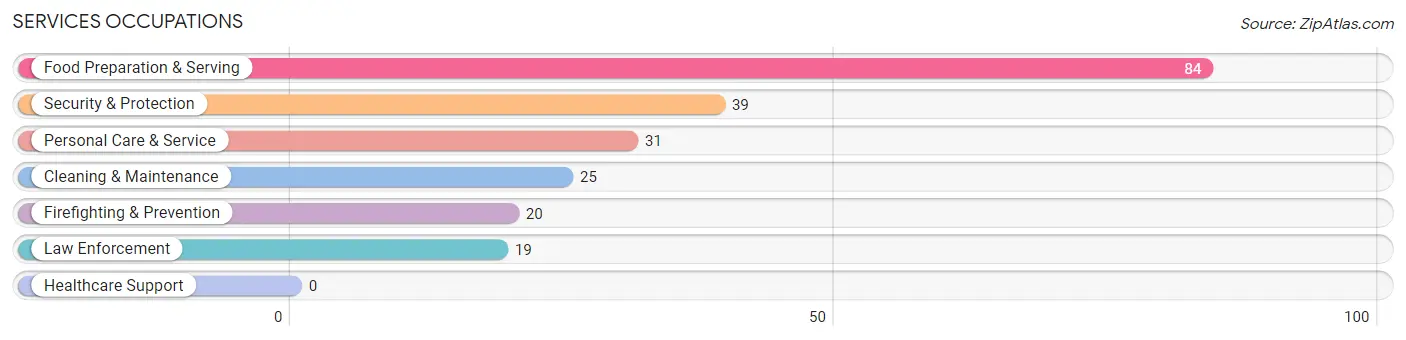
Services Occupations
The most common Services occupations in Lofall are Food Preparation & Serving (84 | 7.7%), Security & Protection (39 | 3.6%), Personal Care & Service (31 | 2.9%), Cleaning & Maintenance (25 | 2.3%), and Firefighting & Prevention (20 | 1.8%).
Services Occupations by Sex
Within the Services occupations in Lofall, the most male-oriented occupations are Firefighting & Prevention (100.0%), Food Preparation & Serving (85.7%), and Security & Protection (76.9%), while the most female-oriented occupations are Personal Care & Service (93.5%), Cleaning & Maintenance (56.0%), and Law Enforcement (47.4%).
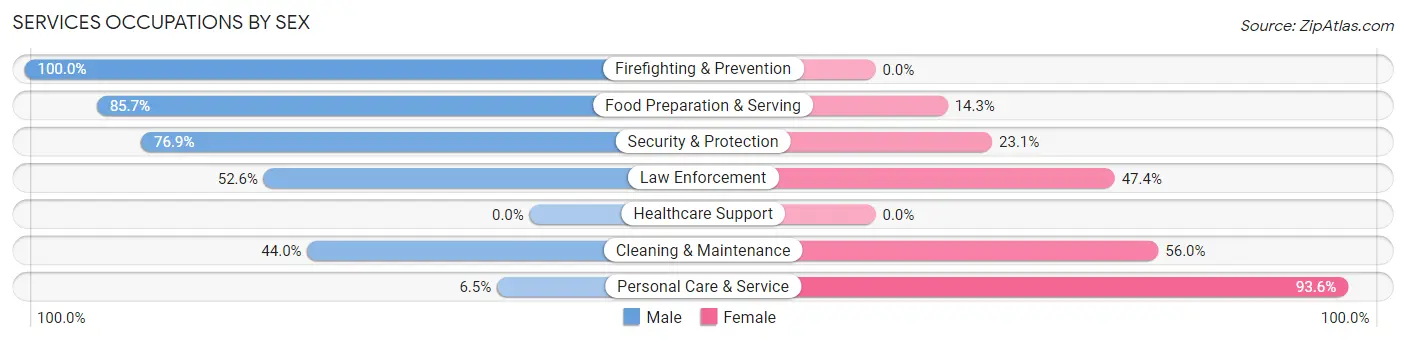
| Occupation | Male | Female |
| Healthcare Support | 0 (0.0%) | 0 (0.0%) |
| Security & Protection | 30 (76.9%) | 9 (23.1%) |
| Firefighting & Prevention | 20 (100.0%) | 0 (0.0%) |
| Law Enforcement | 10 (52.6%) | 9 (47.4%) |
| Food Preparation & Serving | 72 (85.7%) | 12 (14.3%) |
| Cleaning & Maintenance | 11 (44.0%) | 14 (56.0%) |
| Personal Care & Service | 2 (6.5%) | 29 (93.5%) |
| Total (Category) | 115 (64.2%) | 64 (35.7%) |
| Total (Overall) | 623 (57.4%) | 463 (42.6%) |
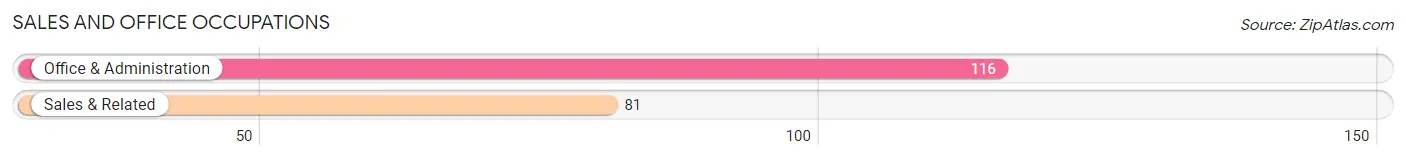
Sales and Office Occupations
The most common Sales and Office occupations in Lofall are Office & Administration (116 | 10.7%), and Sales & Related (81 | 7.5%).
Sales and Office Occupations by Sex
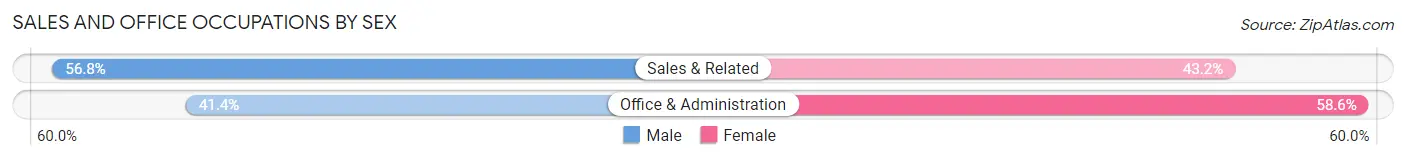
| Occupation | Male | Female |
| Sales & Related | 46 (56.8%) | 35 (43.2%) |
| Office & Administration | 48 (41.4%) | 68 (58.6%) |
| Total (Category) | 94 (47.7%) | 103 (52.3%) |
| Total (Overall) | 623 (57.4%) | 463 (42.6%) |
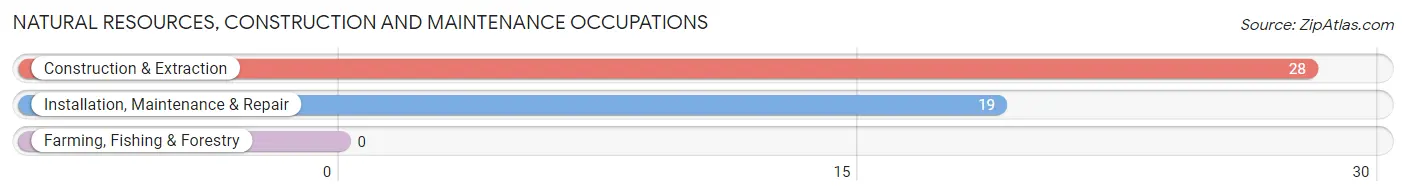
Natural Resources, Construction and Maintenance Occupations
The most common Natural Resources, Construction and Maintenance occupations in Lofall are Construction & Extraction (28 | 2.6%), and Installation, Maintenance & Repair (19 | 1.8%).
Natural Resources, Construction and Maintenance Occupations by Sex
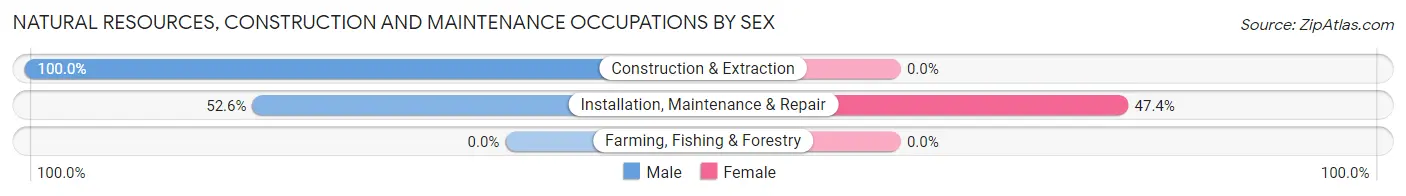
| Occupation | Male | Female |
| Farming, Fishing & Forestry | 0 (0.0%) | 0 (0.0%) |
| Construction & Extraction | 28 (100.0%) | 0 (0.0%) |
| Installation, Maintenance & Repair | 10 (52.6%) | 9 (47.4%) |
| Total (Category) | 38 (80.8%) | 9 (19.2%) |
| Total (Overall) | 623 (57.4%) | 463 (42.6%) |
Production, Transportation and Moving Occupations
The most common Production, Transportation and Moving occupations in Lofall are Transportation (69 | 6.4%), and Production (20 | 1.8%).
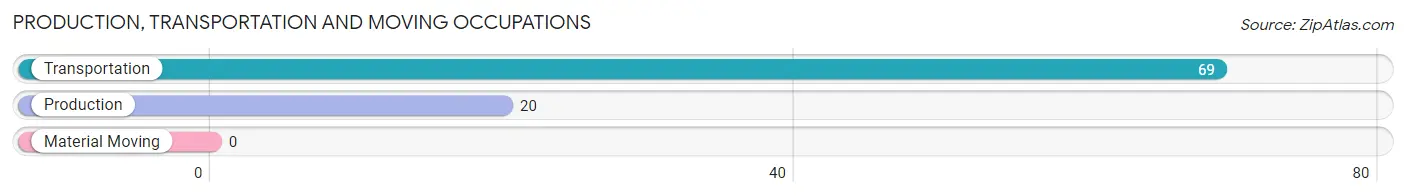
Production, Transportation and Moving Occupations by Sex
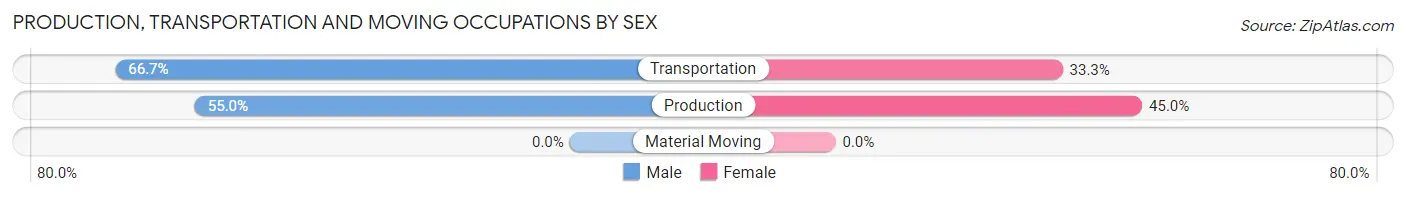
| Occupation | Male | Female |
| Production | 11 (55.0%) | 9 (45.0%) |
| Transportation | 46 (66.7%) | 23 (33.3%) |
| Material Moving | 0 (0.0%) | 0 (0.0%) |
| Total (Category) | 57 (64.0%) | 32 (36.0%) |
| Total (Overall) | 623 (57.4%) | 463 (42.6%) |
Employment Industries by Sex in Lofall
Employment Industries in Lofall
The major employment industries in Lofall include Educational Services (195 | 18.0%), Public Administration (173 | 15.9%), Manufacturing (142 | 13.1%), Professional & Scientific (94 | 8.7%), and Retail Trade (79 | 7.3%).
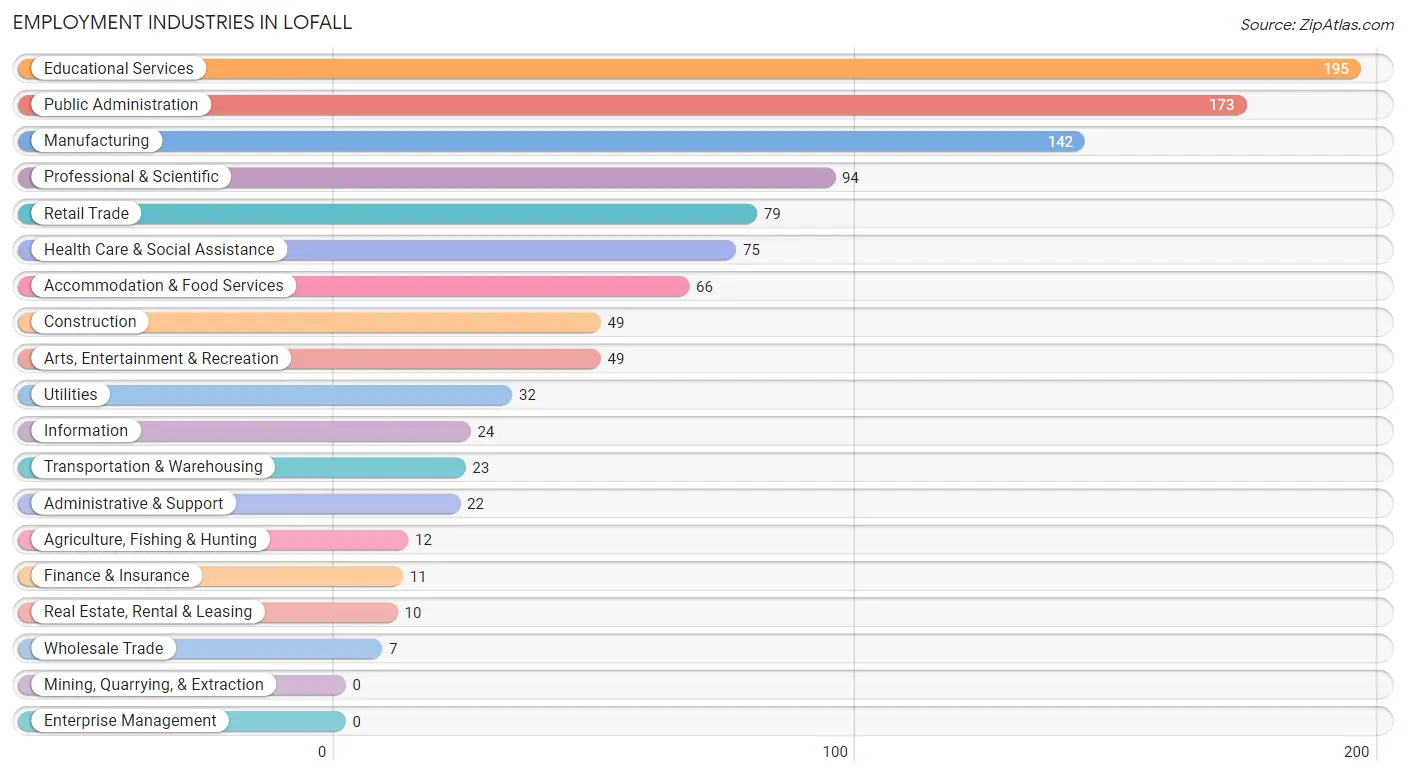
Employment Industries by Sex in Lofall
The Lofall industries that see more men than women are Agriculture, Fishing & Hunting (100.0%), Wholesale Trade (100.0%), and Utilities (100.0%), whereas the industries that tend to have a higher number of women are Transportation & Warehousing (100.0%), Finance & Insurance (100.0%), and Real Estate, Rental & Leasing (100.0%).
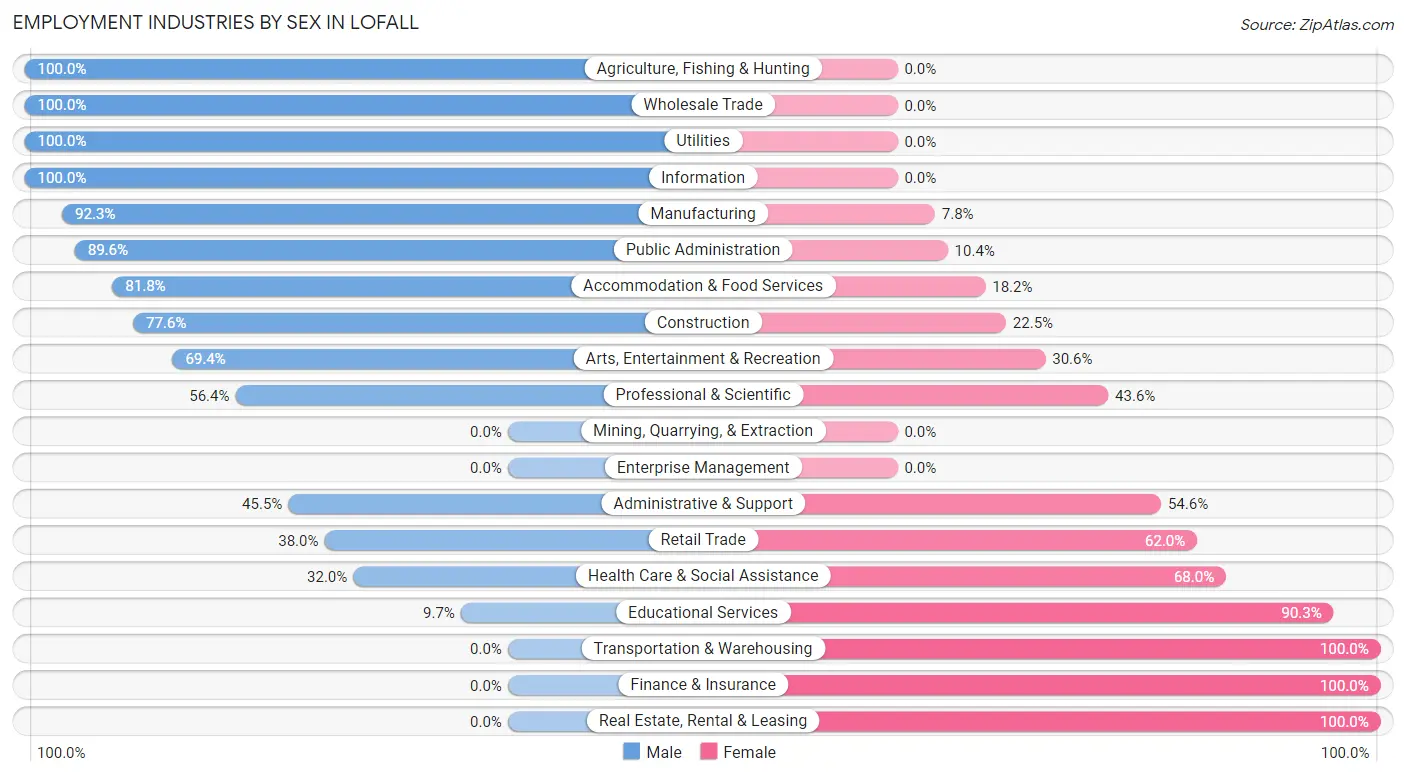
| Industry | Male | Female |
| Agriculture, Fishing & Hunting | 12 (100.0%) | 0 (0.0%) |
| Mining, Quarrying, & Extraction | 0 (0.0%) | 0 (0.0%) |
| Construction | 38 (77.5%) | 11 (22.5%) |
| Manufacturing | 131 (92.2%) | 11 (7.7%) |
| Wholesale Trade | 7 (100.0%) | 0 (0.0%) |
| Retail Trade | 30 (38.0%) | 49 (62.0%) |
| Transportation & Warehousing | 0 (0.0%) | 23 (100.0%) |
| Utilities | 32 (100.0%) | 0 (0.0%) |
| Information | 24 (100.0%) | 0 (0.0%) |
| Finance & Insurance | 0 (0.0%) | 11 (100.0%) |
| Real Estate, Rental & Leasing | 0 (0.0%) | 10 (100.0%) |
| Professional & Scientific | 53 (56.4%) | 41 (43.6%) |
| Enterprise Management | 0 (0.0%) | 0 (0.0%) |
| Administrative & Support | 10 (45.5%) | 12 (54.5%) |
| Educational Services | 19 (9.7%) | 176 (90.3%) |
| Health Care & Social Assistance | 24 (32.0%) | 51 (68.0%) |
| Arts, Entertainment & Recreation | 34 (69.4%) | 15 (30.6%) |
| Accommodation & Food Services | 54 (81.8%) | 12 (18.2%) |
| Public Administration | 155 (89.6%) | 18 (10.4%) |
| Total | 623 (57.4%) | 463 (42.6%) |
Education in Lofall
School Enrollment in Lofall
The most common levels of schooling among the 560 students in Lofall are college / undergraduate (141 | 25.2%), middle school (138 | 24.6%), and high school (113 | 20.2%).

| School Level | # Students | % Students |
| Nursery / Preschool | 73 | 13.0% |
| Kindergarten | 12 | 2.1% |
| Elementary School | 53 | 9.5% |
| Middle School | 138 | 24.6% |
| High School | 113 | 20.2% |
| College / Undergraduate | 141 | 25.2% |
| Graduate / Professional | 30 | 5.4% |
| Total | 560 | 100.0% |
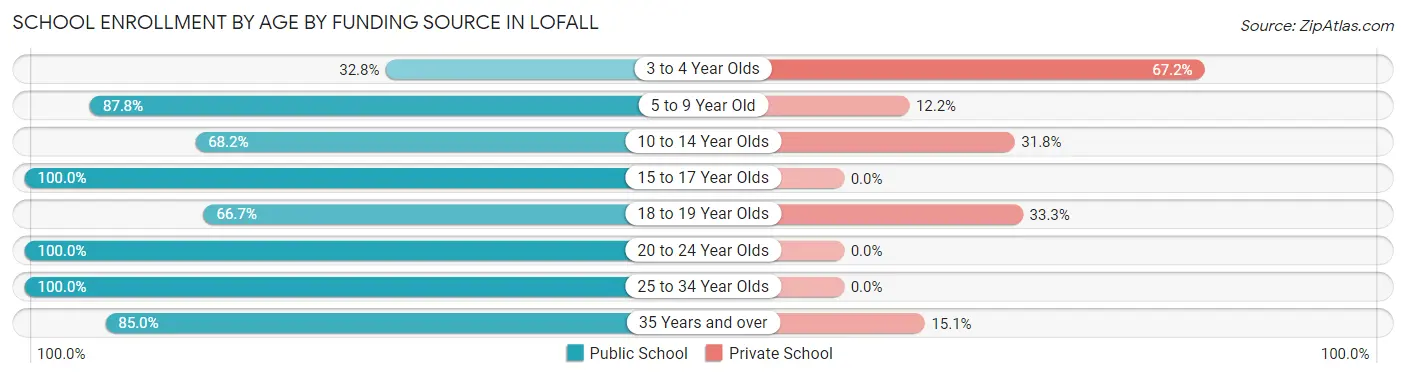
School Enrollment by Age by Funding Source in Lofall
Out of a total of 560 students who are enrolled in schools in Lofall, 130 (23.2%) attend a private institution, while the remaining 430 (76.8%) are enrolled in public schools. The age group of 3 to 4 year olds has the highest likelihood of being enrolled in private schools, with 43 (67.2% in the age bracket) enrolled. Conversely, the age group of 15 to 17 year olds has the lowest likelihood of being enrolled in a private school, with 84 (100.0% in the age bracket) attending a public institution.
| Age Bracket | Public School | Private School |
| 3 to 4 Year Olds | 21 (32.8%) | 43 (67.2%) |
| 5 to 9 Year Old | 65 (87.8%) | 9 (12.2%) |
| 10 to 14 Year Olds | 103 (68.2%) | 48 (31.8%) |
| 15 to 17 Year Olds | 84 (100.0%) | 0 (0.0%) |
| 18 to 19 Year Olds | 32 (66.7%) | 16 (33.3%) |
| 20 to 24 Year Olds | 12 (100.0%) | 0 (0.0%) |
| 25 to 34 Year Olds | 34 (100.0%) | 0 (0.0%) |
| 35 Years and over | 79 (85.0%) | 14 (15.0%) |
| Total | 430 (76.8%) | 130 (23.2%) |
Educational Attainment by Field of Study in Lofall
Engineering (179 | 21.7%), business (132 | 16.0%), physical & health sciences (118 | 14.3%), psychology (73 | 8.9%), and social sciences (61 | 7.4%) are the most common fields of study among 823 individuals in Lofall who have obtained a bachelor's degree or higher.
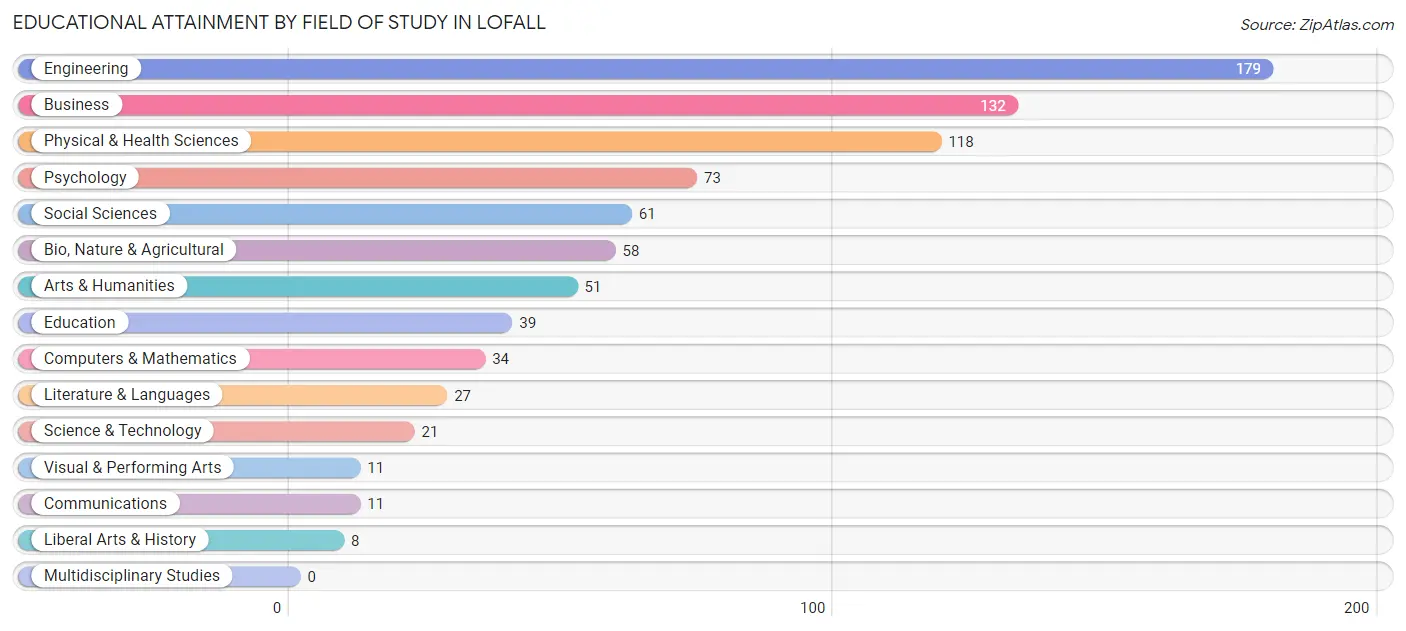
| Field of Study | # Graduates | % Graduates |
| Computers & Mathematics | 34 | 4.1% |
| Bio, Nature & Agricultural | 58 | 7.0% |
| Physical & Health Sciences | 118 | 14.3% |
| Psychology | 73 | 8.9% |
| Social Sciences | 61 | 7.4% |
| Engineering | 179 | 21.7% |
| Multidisciplinary Studies | 0 | 0.0% |
| Science & Technology | 21 | 2.5% |
| Business | 132 | 16.0% |
| Education | 39 | 4.7% |
| Literature & Languages | 27 | 3.3% |
| Liberal Arts & History | 8 | 1.0% |
| Visual & Performing Arts | 11 | 1.3% |
| Communications | 11 | 1.3% |
| Arts & Humanities | 51 | 6.2% |
| Total | 823 | 100.0% |
Transportation & Commute in Lofall
Vehicle Availability by Sex in Lofall
The most prevalent vehicle ownership categories in Lofall are males with 3 vehicles (230, accounting for 36.9%) and females with 3 vehicles (129, making up 51.0%).
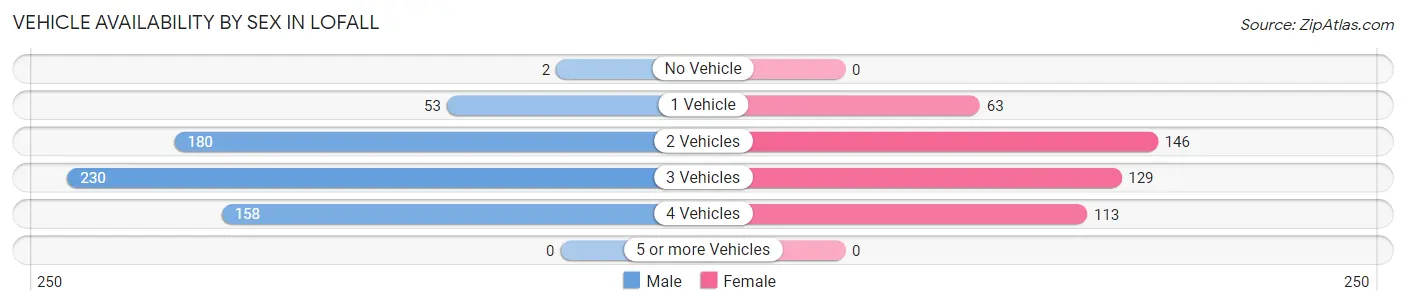
| Vehicles Available | Male | Female |
| No Vehicle | 2 (0.3%) | 0 (0.0%) |
| 1 Vehicle | 53 (8.5%) | 63 (14.0%) |
| 2 Vehicles | 180 (28.9%) | 146 (32.4%) |
| 3 Vehicles | 230 (36.9%) | 129 (28.6%) |
| 4 Vehicles | 158 (25.4%) | 113 (25.1%) |
| 5 or more Vehicles | 0 (0.0%) | 0 (0.0%) |
| Total | 623 (100.0%) | 451 (100.0%) |
Commute Time in Lofall
The most frequently occuring commute durations in Lofall are 20 to 24 minutes (237 commuters, 25.1%), 15 to 19 minutes (195 commuters, 20.6%), and 30 to 34 minutes (118 commuters, 12.5%).
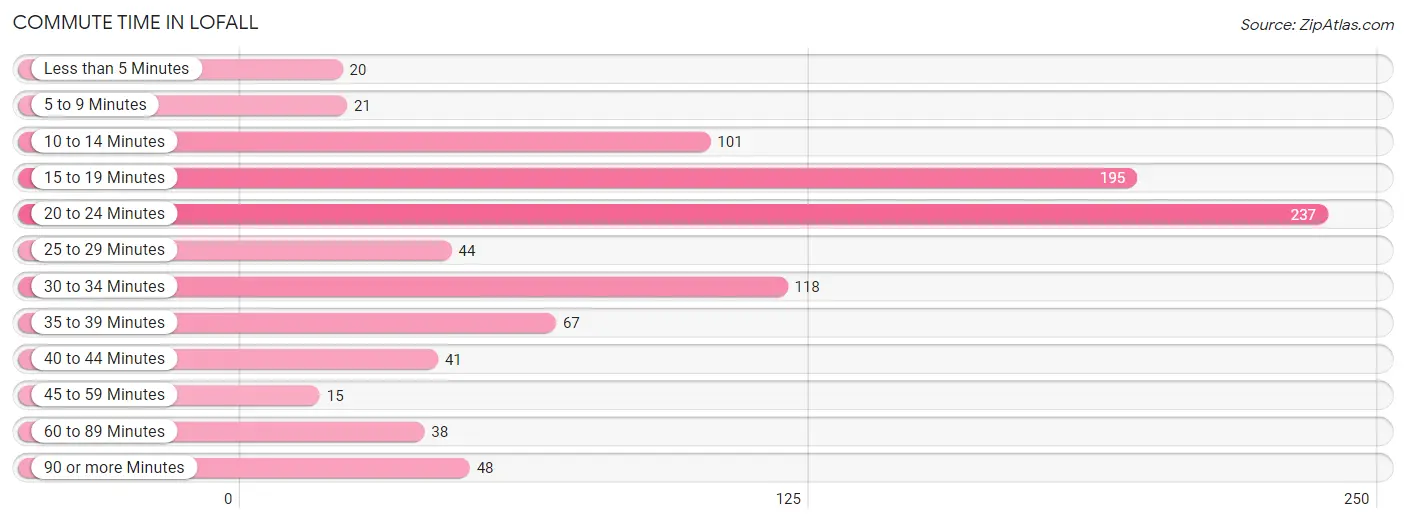
| Commute Time | # Commuters | % Commuters |
| Less than 5 Minutes | 20 | 2.1% |
| 5 to 9 Minutes | 21 | 2.2% |
| 10 to 14 Minutes | 101 | 10.7% |
| 15 to 19 Minutes | 195 | 20.6% |
| 20 to 24 Minutes | 237 | 25.1% |
| 25 to 29 Minutes | 44 | 4.7% |
| 30 to 34 Minutes | 118 | 12.5% |
| 35 to 39 Minutes | 67 | 7.1% |
| 40 to 44 Minutes | 41 | 4.3% |
| 45 to 59 Minutes | 15 | 1.6% |
| 60 to 89 Minutes | 38 | 4.0% |
| 90 or more Minutes | 48 | 5.1% |
Commute Time by Sex in Lofall
The most common commute times in Lofall are 15 to 19 minutes (162 commuters, 29.1%) for males and 20 to 24 minutes (120 commuters, 30.8%) for females.
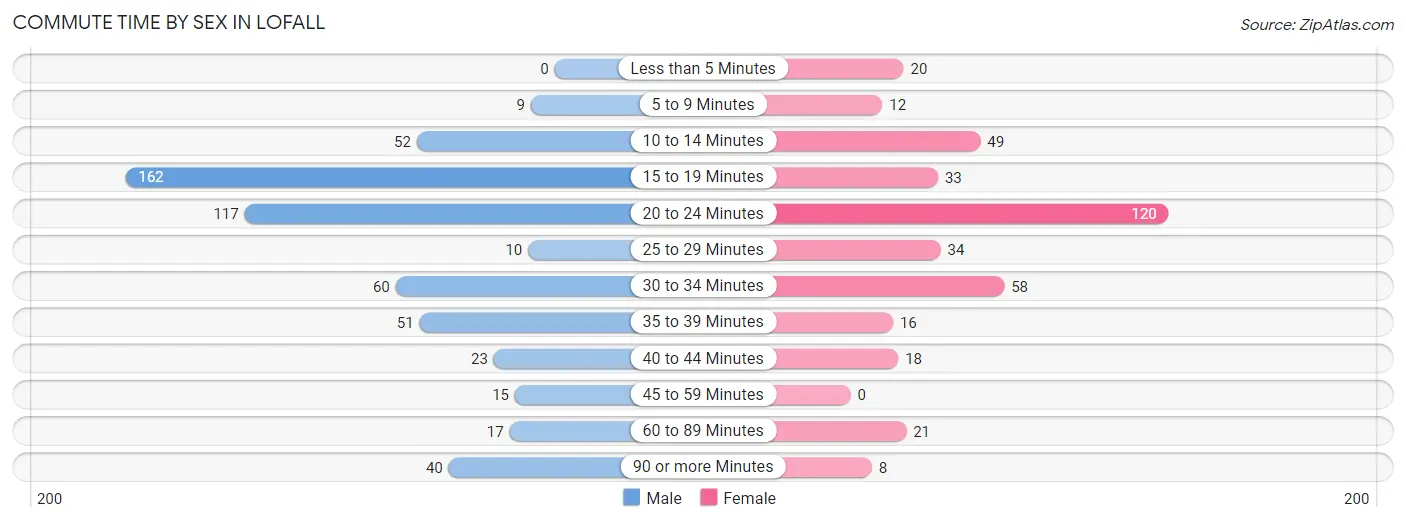
| Commute Time | Male | Female |
| Less than 5 Minutes | 0 (0.0%) | 20 (5.1%) |
| 5 to 9 Minutes | 9 (1.6%) | 12 (3.1%) |
| 10 to 14 Minutes | 52 (9.3%) | 49 (12.6%) |
| 15 to 19 Minutes | 162 (29.1%) | 33 (8.5%) |
| 20 to 24 Minutes | 117 (21.0%) | 120 (30.8%) |
| 25 to 29 Minutes | 10 (1.8%) | 34 (8.7%) |
| 30 to 34 Minutes | 60 (10.8%) | 58 (14.9%) |
| 35 to 39 Minutes | 51 (9.2%) | 16 (4.1%) |
| 40 to 44 Minutes | 23 (4.1%) | 18 (4.6%) |
| 45 to 59 Minutes | 15 (2.7%) | 0 (0.0%) |
| 60 to 89 Minutes | 17 (3.1%) | 21 (5.4%) |
| 90 or more Minutes | 40 (7.2%) | 8 (2.1%) |
Time of Departure to Work by Sex in Lofall
The most frequent times of departure to work in Lofall are 12:00 PM to 3:59 PM (69, 12.4%) for males and 6:30 AM to 6:59 AM (76, 19.5%) for females.
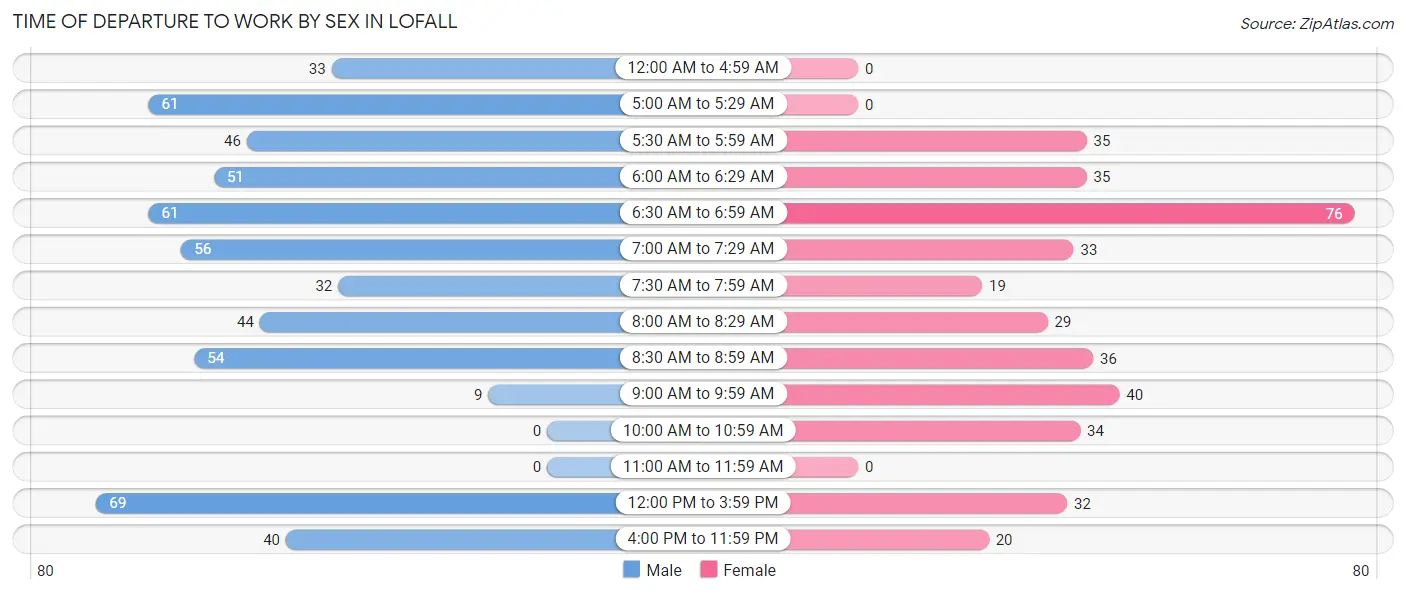
| Time of Departure | Male | Female |
| 12:00 AM to 4:59 AM | 33 (5.9%) | 0 (0.0%) |
| 5:00 AM to 5:29 AM | 61 (11.0%) | 0 (0.0%) |
| 5:30 AM to 5:59 AM | 46 (8.3%) | 35 (9.0%) |
| 6:00 AM to 6:29 AM | 51 (9.2%) | 35 (9.0%) |
| 6:30 AM to 6:59 AM | 61 (11.0%) | 76 (19.5%) |
| 7:00 AM to 7:29 AM | 56 (10.1%) | 33 (8.5%) |
| 7:30 AM to 7:59 AM | 32 (5.8%) | 19 (4.9%) |
| 8:00 AM to 8:29 AM | 44 (7.9%) | 29 (7.5%) |
| 8:30 AM to 8:59 AM | 54 (9.7%) | 36 (9.2%) |
| 9:00 AM to 9:59 AM | 9 (1.6%) | 40 (10.3%) |
| 10:00 AM to 10:59 AM | 0 (0.0%) | 34 (8.7%) |
| 11:00 AM to 11:59 AM | 0 (0.0%) | 0 (0.0%) |
| 12:00 PM to 3:59 PM | 69 (12.4%) | 32 (8.2%) |
| 4:00 PM to 11:59 PM | 40 (7.2%) | 20 (5.1%) |
| Total | 556 (100.0%) | 389 (100.0%) |
Housing Occupancy in Lofall
Occupancy by Ownership in Lofall
Of the total 830 dwellings in Lofall, owner-occupied units account for 771 (92.9%), while renter-occupied units make up 59 (7.1%).
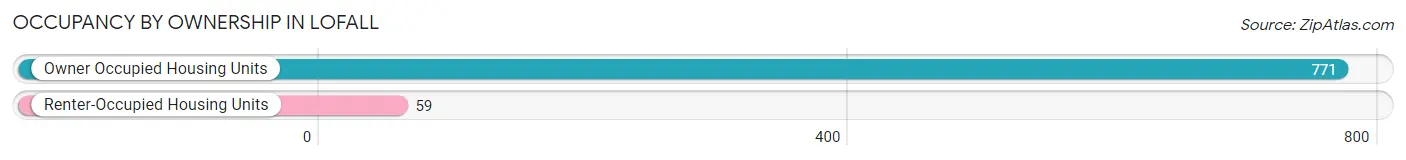
| Occupancy | # Housing Units | % Housing Units |
| Owner Occupied Housing Units | 771 | 92.9% |
| Renter-Occupied Housing Units | 59 | 7.1% |
| Total Occupied Housing Units | 830 | 100.0% |
Occupancy by Household Size in Lofall
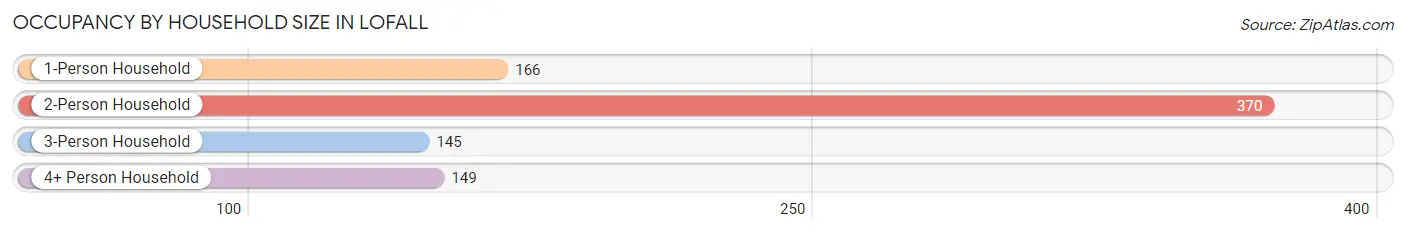
| Household Size | # Housing Units | % Housing Units |
| 1-Person Household | 166 | 20.0% |
| 2-Person Household | 370 | 44.6% |
| 3-Person Household | 145 | 17.5% |
| 4+ Person Household | 149 | 17.9% |
| Total Housing Units | 830 | 100.0% |
Occupancy by Ownership by Household Size in Lofall
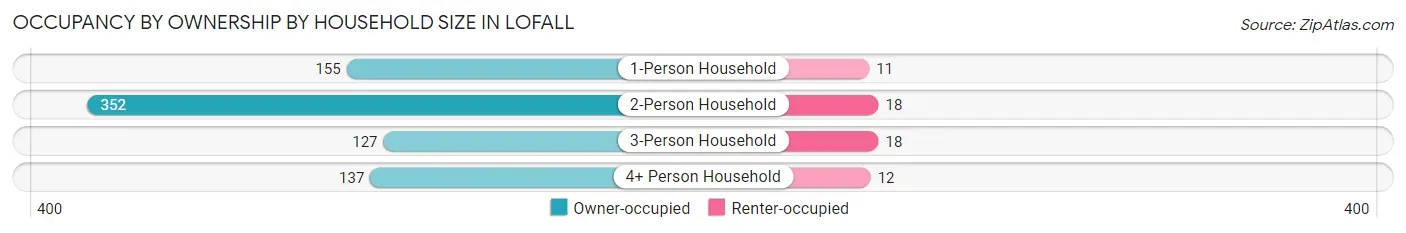
| Household Size | Owner-occupied | Renter-occupied |
| 1-Person Household | 155 (93.4%) | 11 (6.6%) |
| 2-Person Household | 352 (95.1%) | 18 (4.9%) |
| 3-Person Household | 127 (87.6%) | 18 (12.4%) |
| 4+ Person Household | 137 (91.9%) | 12 (8.1%) |
| Total Housing Units | 771 (92.9%) | 59 (7.1%) |
Occupancy by Educational Attainment in Lofall
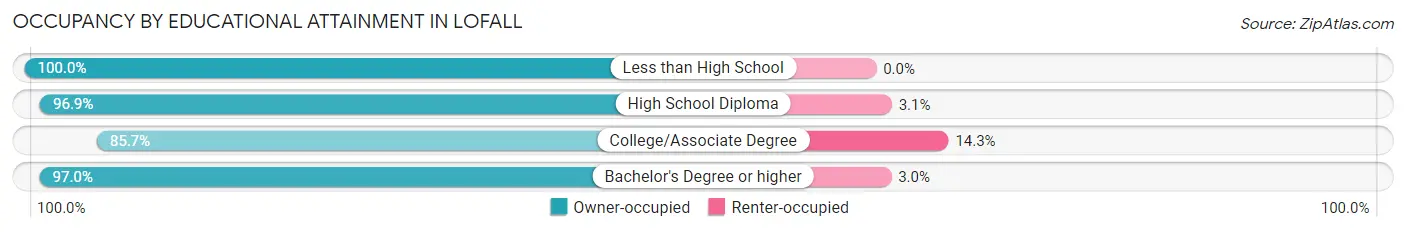
| Household Size | Owner-occupied | Renter-occupied |
| Less than High School | 48 (100.0%) | 0 (0.0%) |
| High School Diploma | 63 (96.9%) | 2 (3.1%) |
| College/Associate Degree | 269 (85.7%) | 45 (14.3%) |
| Bachelor's Degree or higher | 391 (97.0%) | 12 (3.0%) |
Occupancy by Age of Householder in Lofall
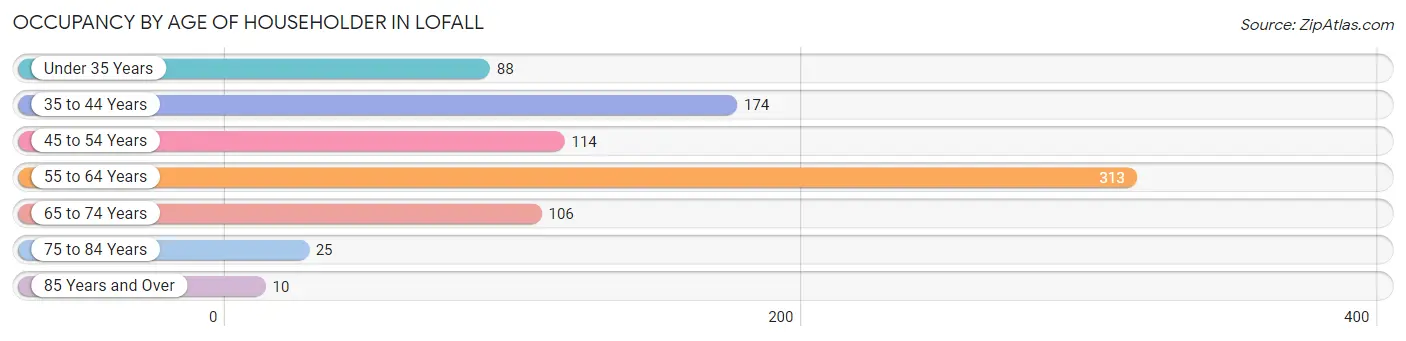
| Age Bracket | # Households | % Households |
| Under 35 Years | 88 | 10.6% |
| 35 to 44 Years | 174 | 21.0% |
| 45 to 54 Years | 114 | 13.7% |
| 55 to 64 Years | 313 | 37.7% |
| 65 to 74 Years | 106 | 12.8% |
| 75 to 84 Years | 25 | 3.0% |
| 85 Years and Over | 10 | 1.2% |
| Total | 830 | 100.0% |
Housing Finances in Lofall
Median Income by Occupancy in Lofall
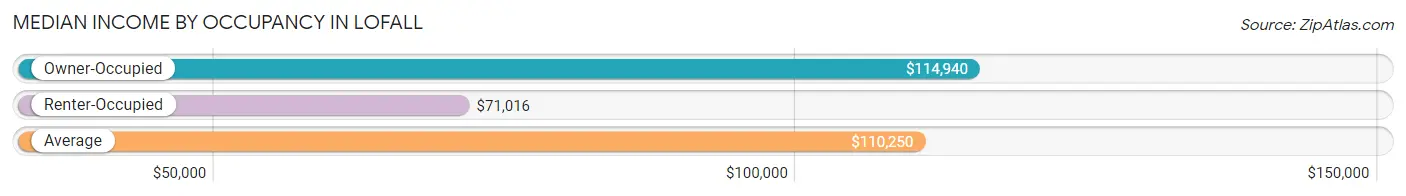
| Occupancy Type | # Households | Median Income |
| Owner-Occupied | 771 (92.9%) | $114,940 |
| Renter-Occupied | 59 (7.1%) | $71,016 |
| Average | 830 (100.0%) | $110,250 |
Occupancy by Householder Income Bracket in Lofall
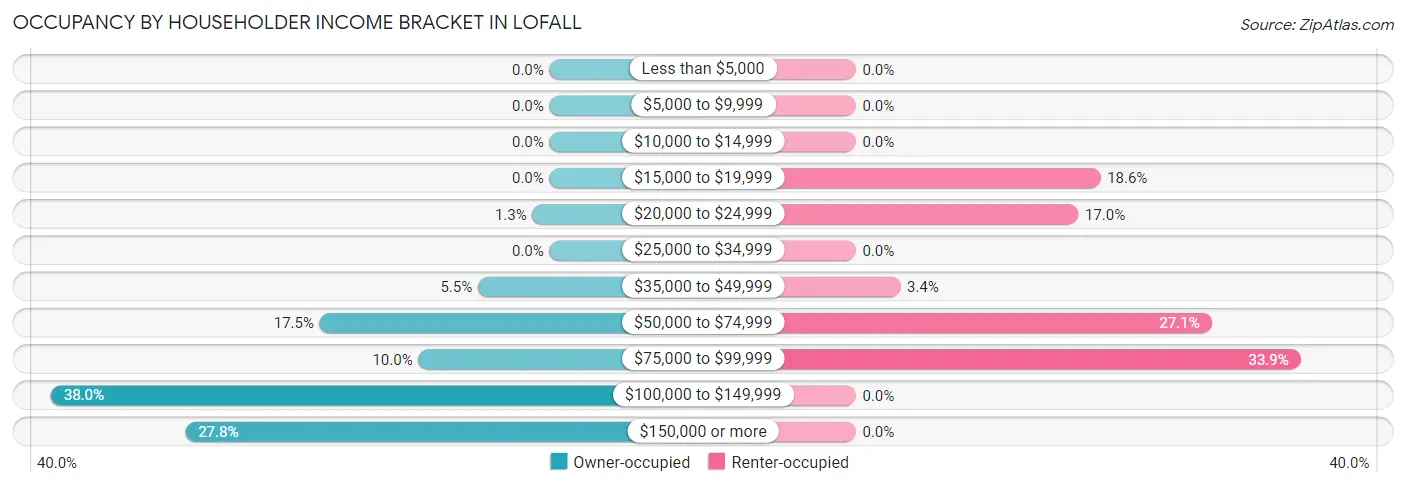
| Income Bracket | Owner-occupied | Renter-occupied |
| Less than $5,000 | 0 (0.0%) | 0 (0.0%) |
| $5,000 to $9,999 | 0 (0.0%) | 0 (0.0%) |
| $10,000 to $14,999 | 0 (0.0%) | 0 (0.0%) |
| $15,000 to $19,999 | 0 (0.0%) | 11 (18.6%) |
| $20,000 to $24,999 | 10 (1.3%) | 10 (17.0%) |
| $25,000 to $34,999 | 0 (0.0%) | 0 (0.0%) |
| $35,000 to $49,999 | 42 (5.4%) | 2 (3.4%) |
| $50,000 to $74,999 | 135 (17.5%) | 16 (27.1%) |
| $75,000 to $99,999 | 77 (10.0%) | 20 (33.9%) |
| $100,000 to $149,999 | 293 (38.0%) | 0 (0.0%) |
| $150,000 or more | 214 (27.8%) | 0 (0.0%) |
| Total | 771 (100.0%) | 59 (100.0%) |
Monthly Housing Cost Tiers in Lofall
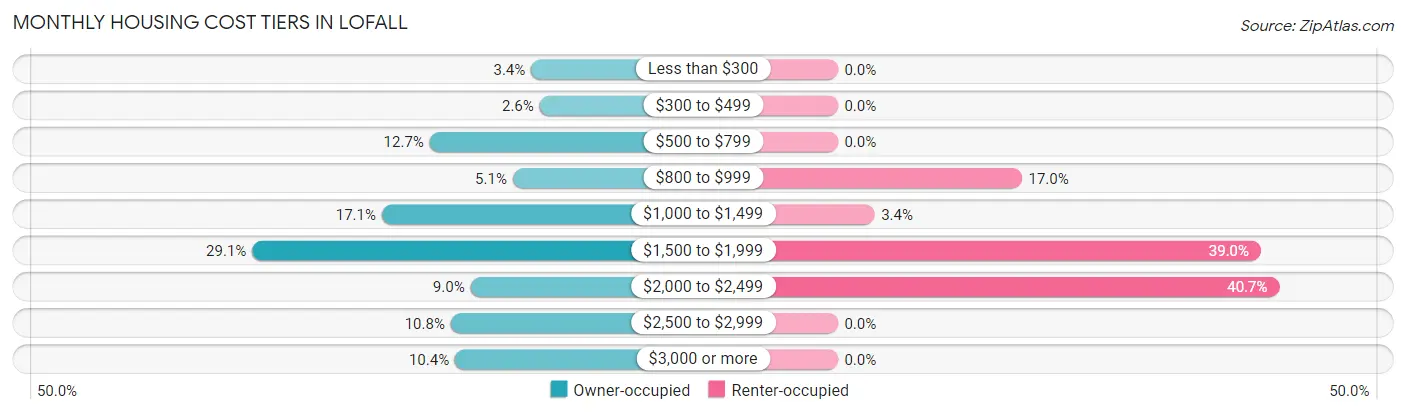
| Monthly Cost | Owner-occupied | Renter-occupied |
| Less than $300 | 26 (3.4%) | 0 (0.0%) |
| $300 to $499 | 20 (2.6%) | 0 (0.0%) |
| $500 to $799 | 98 (12.7%) | 0 (0.0%) |
| $800 to $999 | 39 (5.1%) | 10 (17.0%) |
| $1,000 to $1,499 | 132 (17.1%) | 2 (3.4%) |
| $1,500 to $1,999 | 224 (29.0%) | 23 (39.0%) |
| $2,000 to $2,499 | 69 (8.9%) | 24 (40.7%) |
| $2,500 to $2,999 | 83 (10.8%) | 0 (0.0%) |
| $3,000 or more | 80 (10.4%) | 0 (0.0%) |
| Total | 771 (100.0%) | 59 (100.0%) |
Physical Housing Characteristics in Lofall
Housing Structures in Lofall
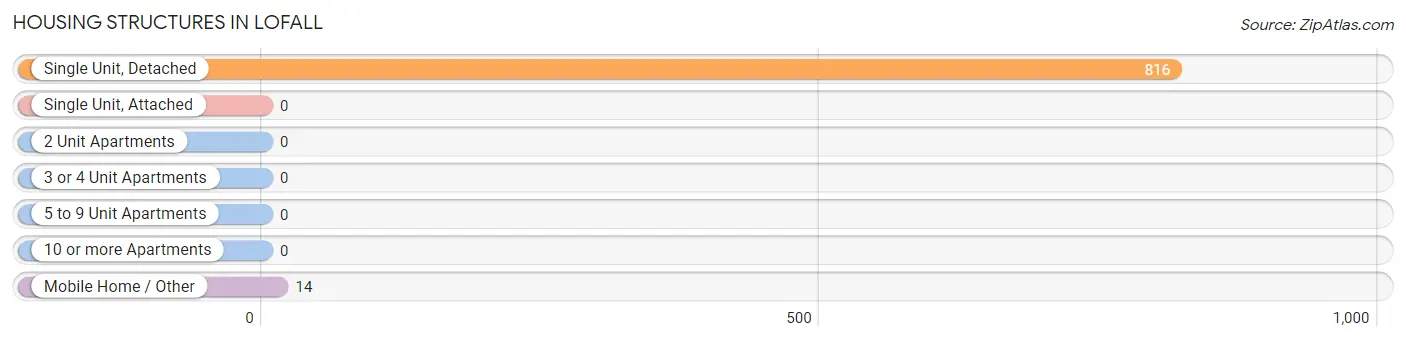
| Structure Type | # Housing Units | % Housing Units |
| Single Unit, Detached | 816 | 98.3% |
| Single Unit, Attached | 0 | 0.0% |
| 2 Unit Apartments | 0 | 0.0% |
| 3 or 4 Unit Apartments | 0 | 0.0% |
| 5 to 9 Unit Apartments | 0 | 0.0% |
| 10 or more Apartments | 0 | 0.0% |
| Mobile Home / Other | 14 | 1.7% |
| Total | 830 | 100.0% |
Housing Structures by Occupancy in Lofall
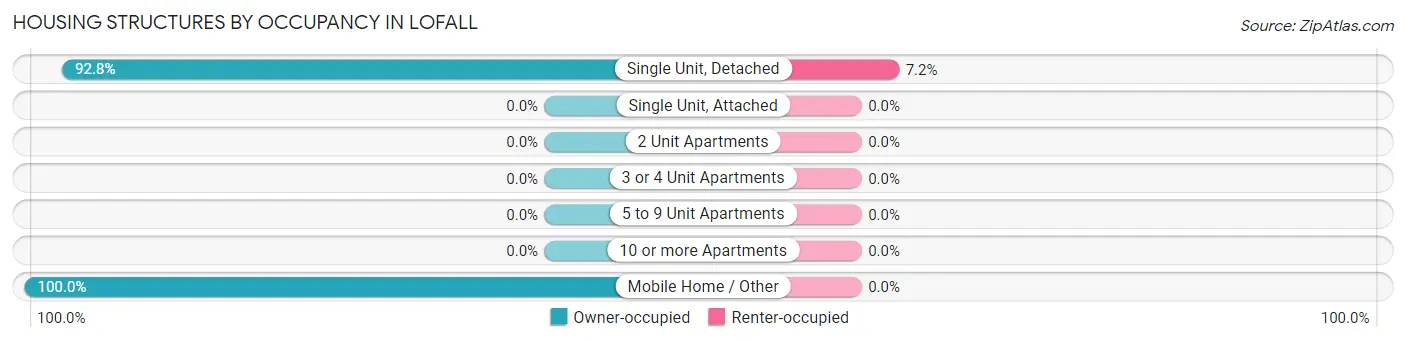
| Structure Type | Owner-occupied | Renter-occupied |
| Single Unit, Detached | 757 (92.8%) | 59 (7.2%) |
| Single Unit, Attached | 0 (0.0%) | 0 (0.0%) |
| 2 Unit Apartments | 0 (0.0%) | 0 (0.0%) |
| 3 or 4 Unit Apartments | 0 (0.0%) | 0 (0.0%) |
| 5 to 9 Unit Apartments | 0 (0.0%) | 0 (0.0%) |
| 10 or more Apartments | 0 (0.0%) | 0 (0.0%) |
| Mobile Home / Other | 14 (100.0%) | 0 (0.0%) |
| Total | 771 (92.9%) | 59 (7.1%) |
Housing Structures by Number of Rooms in Lofall
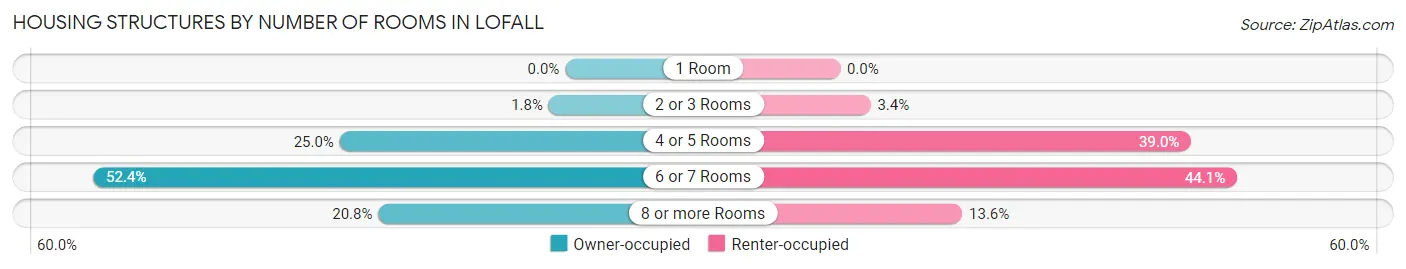
| Number of Rooms | Owner-occupied | Renter-occupied |
| 1 Room | 0 (0.0%) | 0 (0.0%) |
| 2 or 3 Rooms | 14 (1.8%) | 2 (3.4%) |
| 4 or 5 Rooms | 193 (25.0%) | 23 (39.0%) |
| 6 or 7 Rooms | 404 (52.4%) | 26 (44.1%) |
| 8 or more Rooms | 160 (20.7%) | 8 (13.6%) |
| Total | 771 (100.0%) | 59 (100.0%) |
Housing Structure by Heating Type in Lofall
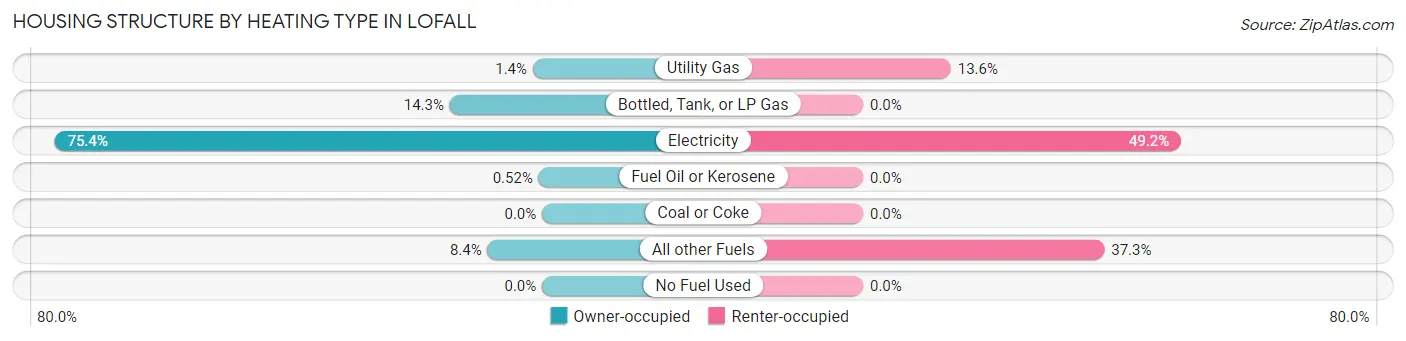
| Heating Type | Owner-occupied | Renter-occupied |
| Utility Gas | 11 (1.4%) | 8 (13.6%) |
| Bottled, Tank, or LP Gas | 110 (14.3%) | 0 (0.0%) |
| Electricity | 581 (75.4%) | 29 (49.1%) |
| Fuel Oil or Kerosene | 4 (0.5%) | 0 (0.0%) |
| Coal or Coke | 0 (0.0%) | 0 (0.0%) |
| All other Fuels | 65 (8.4%) | 22 (37.3%) |
| No Fuel Used | 0 (0.0%) | 0 (0.0%) |
| Total | 771 (100.0%) | 59 (100.0%) |
Household Vehicle Usage in Lofall
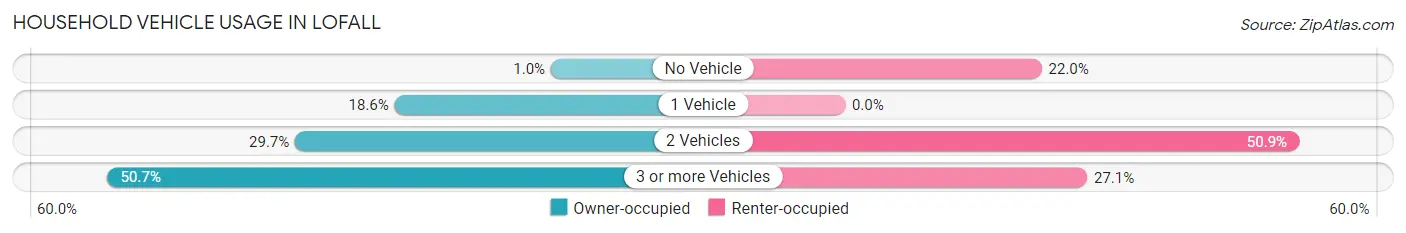
| Vehicles per Household | Owner-occupied | Renter-occupied |
| No Vehicle | 8 (1.0%) | 13 (22.0%) |
| 1 Vehicle | 143 (18.5%) | 0 (0.0%) |
| 2 Vehicles | 229 (29.7%) | 30 (50.8%) |
| 3 or more Vehicles | 391 (50.7%) | 16 (27.1%) |
| Total | 771 (100.0%) | 59 (100.0%) |
Real Estate & Mortgages in Lofall
Real Estate and Mortgage Overview in Lofall
| Characteristic | Without Mortgage | With Mortgage |
| Housing Units | 228 | 543 |
| Median Property Value | $573,300 | $418,800 |
| Median Household Income | $106,528 | $140 |
| Monthly Housing Costs | $660 | $80 |
| Real Estate Taxes | $4,576 | $0 |
Property Value by Mortgage Status in Lofall
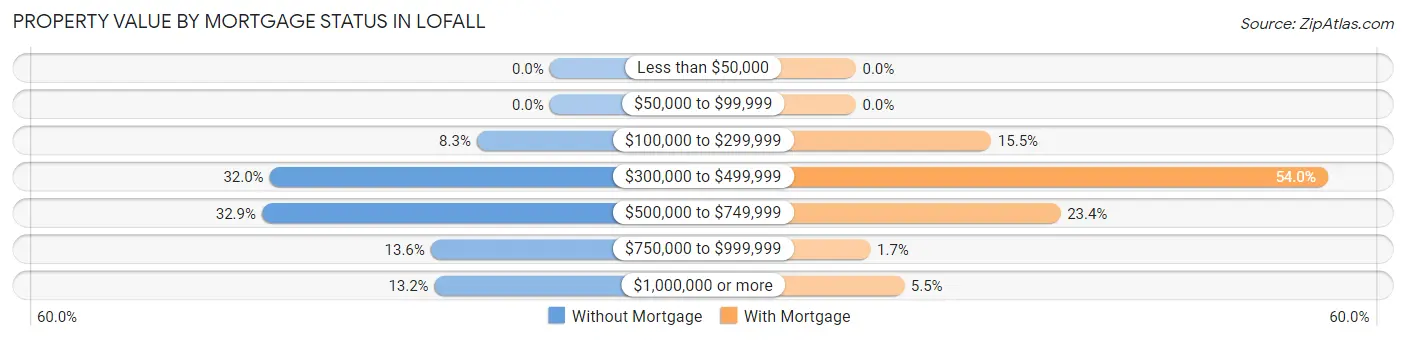
| Property Value | Without Mortgage | With Mortgage |
| Less than $50,000 | 0 (0.0%) | 0 (0.0%) |
| $50,000 to $99,999 | 0 (0.0%) | 0 (0.0%) |
| $100,000 to $299,999 | 19 (8.3%) | 84 (15.5%) |
| $300,000 to $499,999 | 73 (32.0%) | 293 (54.0%) |
| $500,000 to $749,999 | 75 (32.9%) | 127 (23.4%) |
| $750,000 to $999,999 | 31 (13.6%) | 9 (1.7%) |
| $1,000,000 or more | 30 (13.2%) | 30 (5.5%) |
| Total | 228 (100.0%) | 543 (100.0%) |
Household Income by Mortgage Status in Lofall
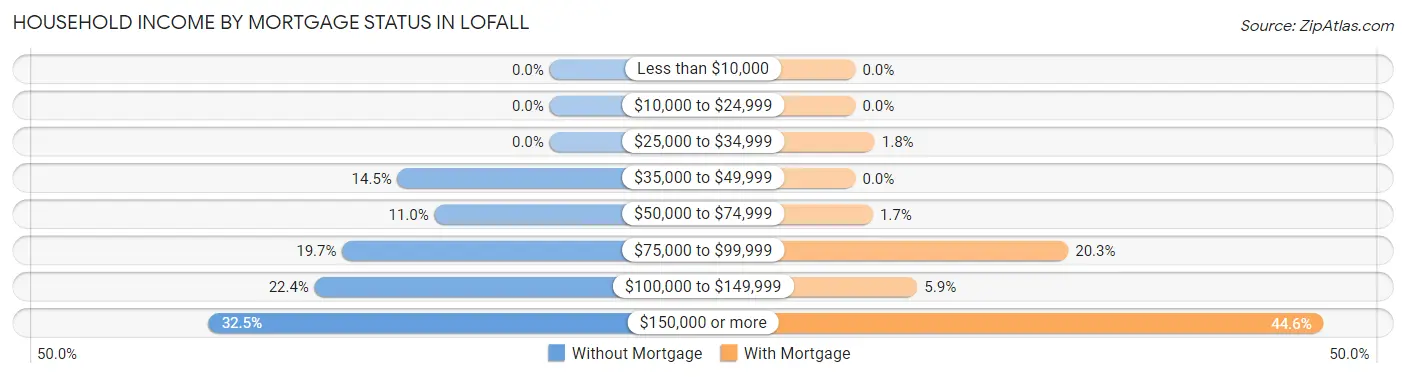
| Household Income | Without Mortgage | With Mortgage |
| Less than $10,000 | 0 (0.0%) | 0 (0.0%) |
| $10,000 to $24,999 | 0 (0.0%) | 0 (0.0%) |
| $25,000 to $34,999 | 0 (0.0%) | 10 (1.8%) |
| $35,000 to $49,999 | 33 (14.5%) | 0 (0.0%) |
| $50,000 to $74,999 | 25 (11.0%) | 9 (1.7%) |
| $75,000 to $99,999 | 45 (19.7%) | 110 (20.3%) |
| $100,000 to $149,999 | 51 (22.4%) | 32 (5.9%) |
| $150,000 or more | 74 (32.5%) | 242 (44.6%) |
| Total | 228 (100.0%) | 543 (100.0%) |
Property Value to Household Income Ratio in Lofall
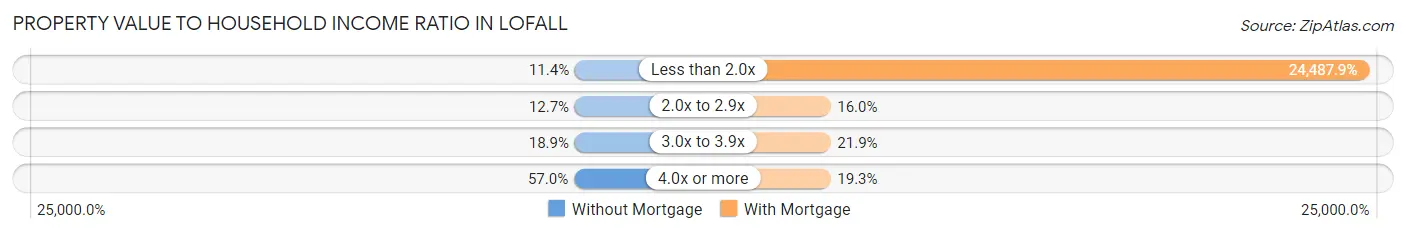
| Value-to-Income Ratio | Without Mortgage | With Mortgage |
| Less than 2.0x | 26 (11.4%) | 132,969 (24,487.9%) |
| 2.0x to 2.9x | 29 (12.7%) | 87 (16.0%) |
| 3.0x to 3.9x | 43 (18.9%) | 119 (21.9%) |
| 4.0x or more | 130 (57.0%) | 105 (19.3%) |
| Total | 228 (100.0%) | 543 (100.0%) |
Real Estate Taxes by Mortgage Status in Lofall
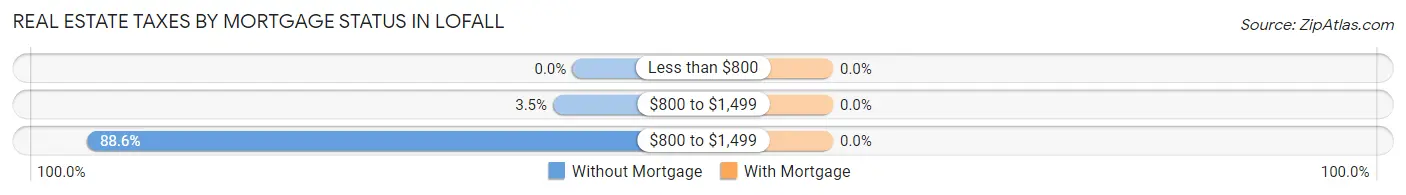
| Property Taxes | Without Mortgage | With Mortgage |
| Less than $800 | 0 (0.0%) | 0 (0.0%) |
| $800 to $1,499 | 8 (3.5%) | 0 (0.0%) |
| $800 to $1,499 | 202 (88.6%) | 0 (0.0%) |
| Total | 228 (100.0%) | 543 (100.0%) |
Health & Disability in Lofall
Health Insurance Coverage by Age in Lofall
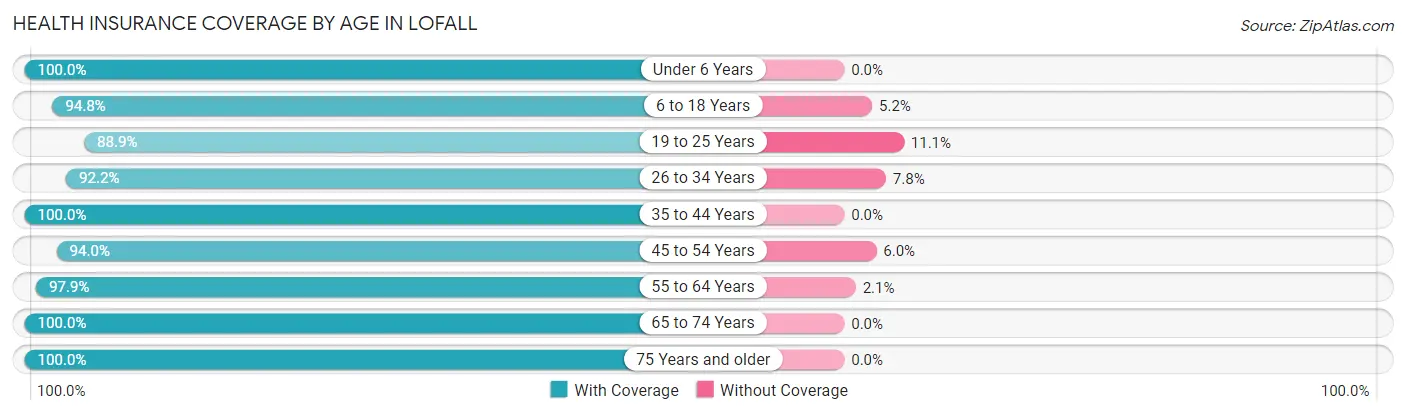
| Age Bracket | With Coverage | Without Coverage |
| Under 6 Years | 126 (100.0%) | 0 (0.0%) |
| 6 to 18 Years | 292 (94.8%) | 16 (5.2%) |
| 19 to 25 Years | 96 (88.9%) | 12 (11.1%) |
| 26 to 34 Years | 202 (92.2%) | 17 (7.8%) |
| 35 to 44 Years | 264 (100.0%) | 0 (0.0%) |
| 45 to 54 Years | 236 (94.0%) | 15 (6.0%) |
| 55 to 64 Years | 459 (97.9%) | 10 (2.1%) |
| 65 to 74 Years | 242 (100.0%) | 0 (0.0%) |
| 75 Years and older | 51 (100.0%) | 0 (0.0%) |
| Total | 1,968 (96.6%) | 70 (3.4%) |
Health Insurance Coverage by Citizenship Status in Lofall
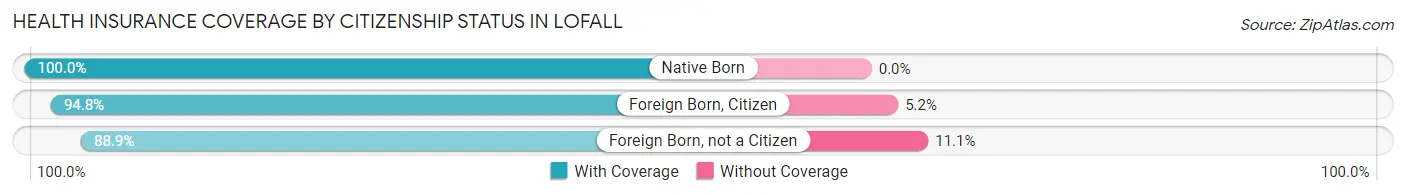
| Citizenship Status | With Coverage | Without Coverage |
| Native Born | 126 (100.0%) | 0 (0.0%) |
| Foreign Born, Citizen | 292 (94.8%) | 16 (5.2%) |
| Foreign Born, not a Citizen | 96 (88.9%) | 12 (11.1%) |
Health Insurance Coverage by Household Income in Lofall
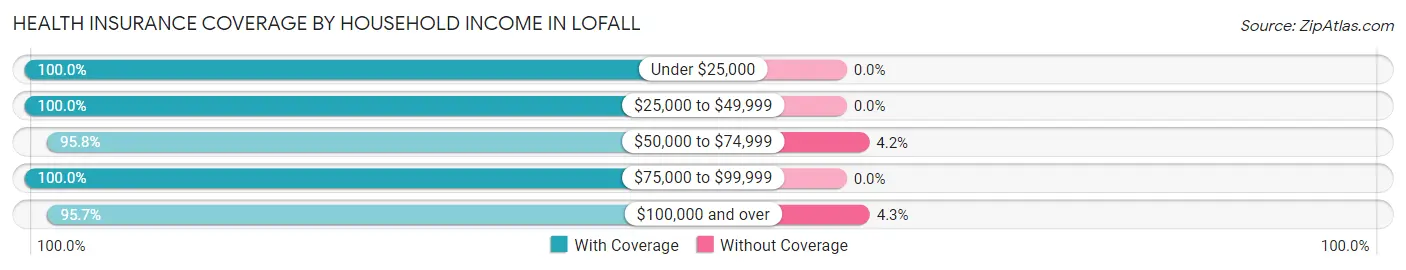
| Household Income | With Coverage | Without Coverage |
| Under $25,000 | 40 (100.0%) | 0 (0.0%) |
| $25,000 to $49,999 | 98 (100.0%) | 0 (0.0%) |
| $50,000 to $74,999 | 227 (95.8%) | 10 (4.2%) |
| $75,000 to $99,999 | 272 (100.0%) | 0 (0.0%) |
| $100,000 and over | 1,331 (95.7%) | 60 (4.3%) |
Public vs Private Health Insurance Coverage by Age in Lofall
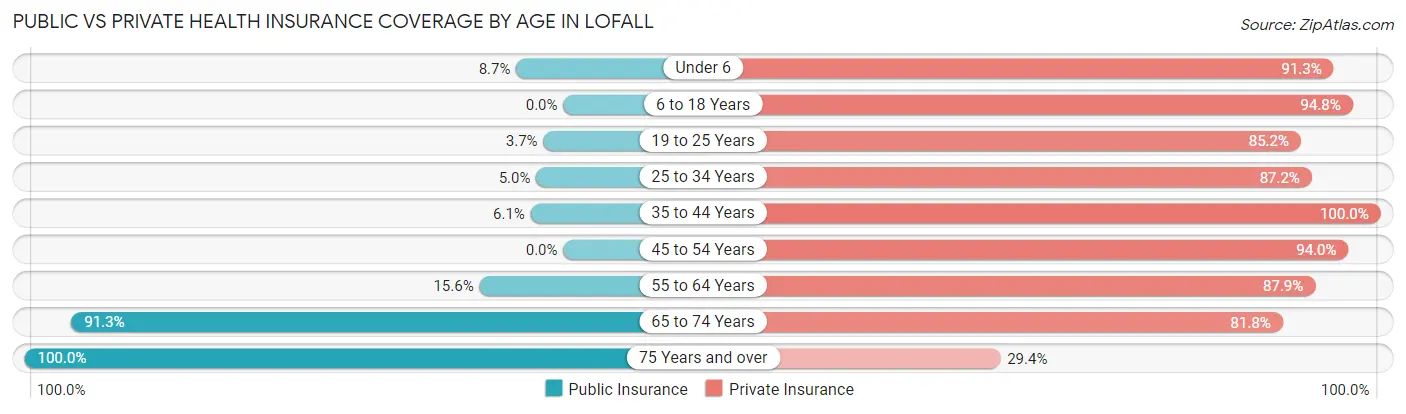
| Age Bracket | Public Insurance | Private Insurance |
| Under 6 | 11 (8.7%) | 115 (91.3%) |
| 6 to 18 Years | 0 (0.0%) | 292 (94.8%) |
| 19 to 25 Years | 4 (3.7%) | 92 (85.2%) |
| 25 to 34 Years | 11 (5.0%) | 191 (87.2%) |
| 35 to 44 Years | 16 (6.1%) | 264 (100.0%) |
| 45 to 54 Years | 0 (0.0%) | 236 (94.0%) |
| 55 to 64 Years | 73 (15.6%) | 412 (87.8%) |
| 65 to 74 Years | 221 (91.3%) | 198 (81.8%) |
| 75 Years and over | 51 (100.0%) | 15 (29.4%) |
| Total | 387 (19.0%) | 1,815 (89.1%) |
Disability Status by Sex by Age in Lofall
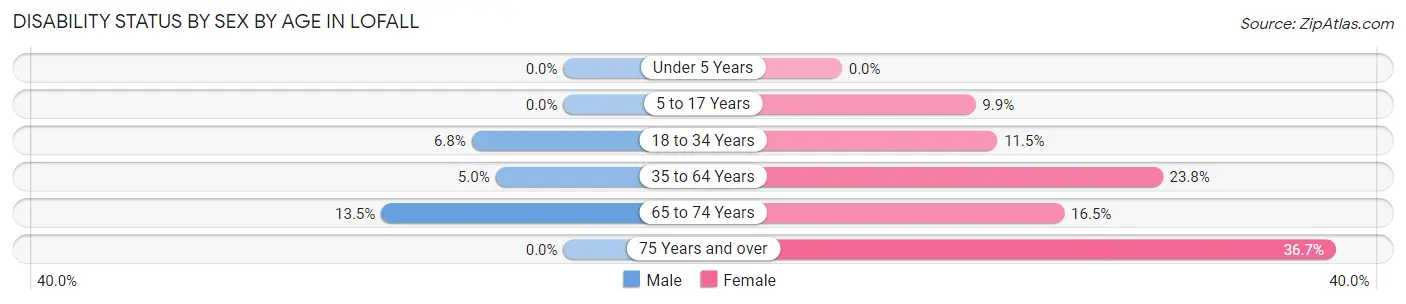
| Age Bracket | Male | Female |
| Under 5 Years | 0 (0.0%) | 0 (0.0%) |
| 5 to 17 Years | 0 (0.0%) | 12 (9.9%) |
| 18 to 34 Years | 13 (6.8%) | 18 (11.5%) |
| 35 to 64 Years | 24 (5.0%) | 121 (23.8%) |
| 65 to 74 Years | 18 (13.5%) | 18 (16.5%) |
| 75 Years and over | 0 (0.0%) | 11 (36.7%) |
Disability Class by Sex by Age in Lofall
Disability Class: Hearing Difficulty
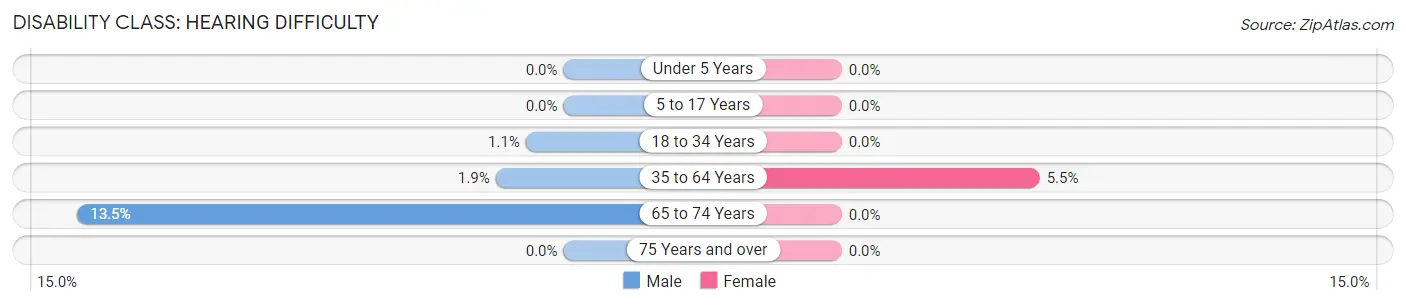
| Age Bracket | Male | Female |
| Under 5 Years | 0 (0.0%) | 0 (0.0%) |
| 5 to 17 Years | 0 (0.0%) | 0 (0.0%) |
| 18 to 34 Years | 2 (1.1%) | 0 (0.0%) |
| 35 to 64 Years | 9 (1.9%) | 28 (5.5%) |
| 65 to 74 Years | 18 (13.5%) | 0 (0.0%) |
| 75 Years and over | 0 (0.0%) | 0 (0.0%) |
Disability Class: Vision Difficulty
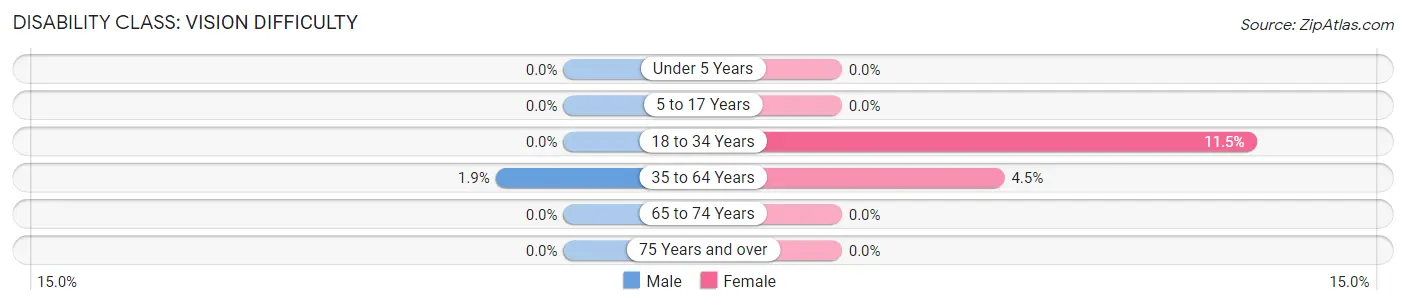
| Age Bracket | Male | Female |
| Under 5 Years | 0 (0.0%) | 0 (0.0%) |
| 5 to 17 Years | 0 (0.0%) | 0 (0.0%) |
| 18 to 34 Years | 0 (0.0%) | 18 (11.5%) |
| 35 to 64 Years | 9 (1.9%) | 23 (4.5%) |
| 65 to 74 Years | 0 (0.0%) | 0 (0.0%) |
| 75 Years and over | 0 (0.0%) | 0 (0.0%) |
Disability Class: Cognitive Difficulty
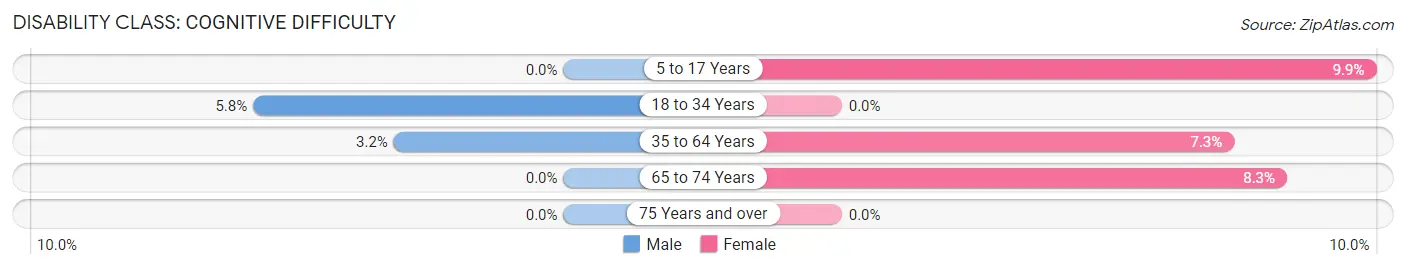
| Age Bracket | Male | Female |
| 5 to 17 Years | 0 (0.0%) | 12 (9.9%) |
| 18 to 34 Years | 11 (5.8%) | 0 (0.0%) |
| 35 to 64 Years | 15 (3.2%) | 37 (7.3%) |
| 65 to 74 Years | 0 (0.0%) | 9 (8.3%) |
| 75 Years and over | 0 (0.0%) | 0 (0.0%) |
Disability Class: Ambulatory Difficulty
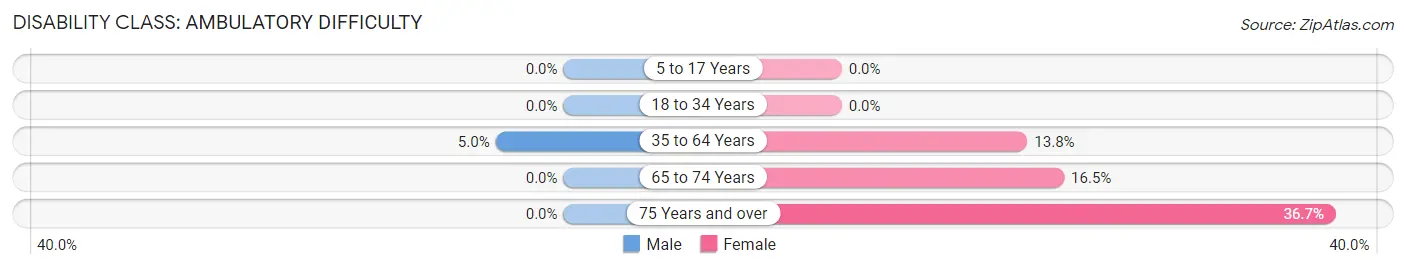
| Age Bracket | Male | Female |
| 5 to 17 Years | 0 (0.0%) | 0 (0.0%) |
| 18 to 34 Years | 0 (0.0%) | 0 (0.0%) |
| 35 to 64 Years | 24 (5.0%) | 70 (13.8%) |
| 65 to 74 Years | 0 (0.0%) | 18 (16.5%) |
| 75 Years and over | 0 (0.0%) | 11 (36.7%) |
Disability Class: Self-Care Difficulty
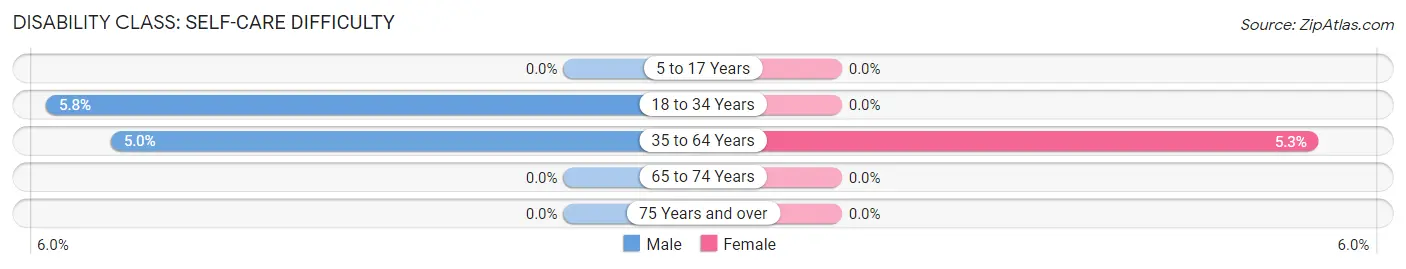
| Age Bracket | Male | Female |
| 5 to 17 Years | 0 (0.0%) | 0 (0.0%) |
| 18 to 34 Years | 11 (5.8%) | 0 (0.0%) |
| 35 to 64 Years | 24 (5.0%) | 27 (5.3%) |
| 65 to 74 Years | 0 (0.0%) | 0 (0.0%) |
| 75 Years and over | 0 (0.0%) | 0 (0.0%) |
Technology Access in Lofall
Computing Device Access in Lofall
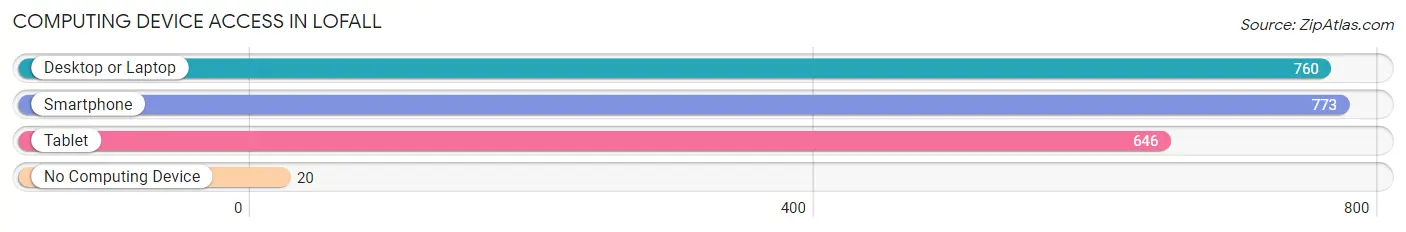
| Device Type | # Households | % Households |
| Desktop or Laptop | 760 | 91.6% |
| Smartphone | 773 | 93.1% |
| Tablet | 646 | 77.8% |
| No Computing Device | 20 | 2.4% |
| Total | 830 | 100.0% |
Internet Access in Lofall
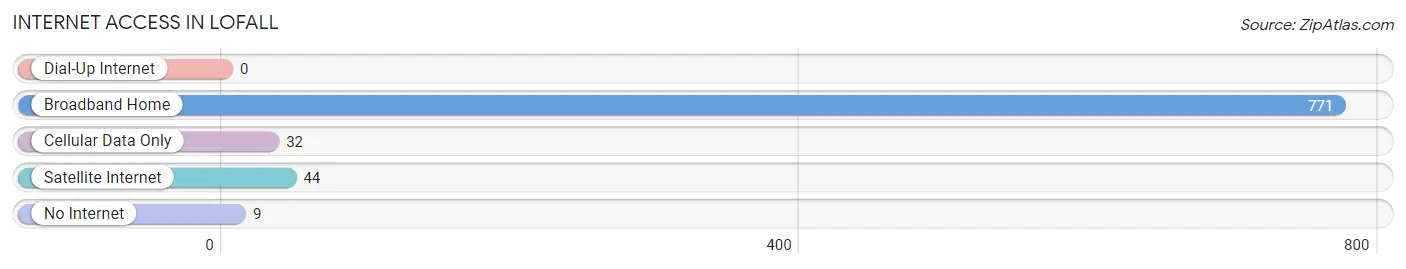
| Internet Type | # Households | % Households |
| Dial-Up Internet | 0 | 0.0% |
| Broadband Home | 771 | 92.9% |
| Cellular Data Only | 32 | 3.9% |
| Satellite Internet | 44 | 5.3% |
| No Internet | 9 | 1.1% |
| Total | 830 | 100.0% |
Lofall Summary
Lofall is a small unincorporated community located in Kitsap County, Washington, United States. It is situated on the Kitsap Peninsula, approximately 25 miles northwest of Seattle. The population of Lofall was estimated to be around 1,000 in 2020.
History
Lofall was first settled in the late 1800s by Scandinavian immigrants. The community was named after the nearby Lofall Creek, which was named after a Norwegian settler named Lars Lofall. The first post office in Lofall was established in 1891.
In the early 1900s, the area was primarily used for logging and farming. The logging industry was particularly important to the local economy, and the area was home to several sawmills. The logging industry declined in the mid-1900s, and the area shifted to a more residential focus.
Geography
Lofall is located on the Kitsap Peninsula, approximately 25 miles northwest of Seattle. The community is situated on the western shore of Hood Canal, a saltwater fjord that separates the Kitsap Peninsula from the Olympic Peninsula. The area is characterized by rolling hills, forests, and wetlands.
The climate in Lofall is mild and temperate, with warm summers and cool winters. The average annual temperature is around 50°F (10°C). The average annual precipitation is around 40 inches (101 cm).
Economy
The economy of Lofall is primarily based on tourism and recreation. The area is home to several popular outdoor activities, including fishing, boating, hiking, and camping. The nearby Hood Canal is a popular destination for boaters and anglers.
The area is also home to several small businesses, including restaurants, retail stores, and service providers. The local economy is also supported by the nearby Naval Base Kitsap, which is located approximately 25 miles away in Bremerton.
Demographics
The population of Lofall was estimated to be around 1,000 in 2020. The racial makeup of the community is predominantly white (90.2%), with smaller percentages of Hispanic (3.2%), Asian (2.2%), and African American (1.2%) residents. The median household income in Lofall is around $60,000, and the median home value is around $400,000.
Conclusion
Lofall is a small unincorporated community located in Kitsap County, Washington. It is situated on the Kitsap Peninsula, approximately 25 miles northwest of Seattle. The area is characterized by rolling hills, forests, and wetlands, and the climate is mild and temperate. The economy of Lofall is primarily based on tourism and recreation, and the population of the community was estimated to be around 1,000 in 2020.
Common Questions
What is Per Capita Income in Lofall?
Per Capita income in Lofall is $56,532.
What is the Median Family Income in Lofall?
Median Family Income in Lofall is $118,125.
What is the Median Household income in Lofall?
Median Household Income in Lofall is $110,250.
What is Income or Wage Gap in Lofall?
Income or Wage Gap in Lofall is 48.6%.
Women in Lofall earn 51.4 cents for every dollar earned by a man.
What is Inequality or Gini Index in Lofall?
Inequality or Gini Index in Lofall is 0.35.
What is the Total Population of Lofall?
Total Population of Lofall is 2,038.
What is the Total Male Population of Lofall?
Total Male Population of Lofall is 1,094.
What is the Total Female Population of Lofall?
Total Female Population of Lofall is 944.
What is the Ratio of Males per 100 Females in Lofall?
There are 115.89 Males per 100 Females in Lofall.
What is the Ratio of Females per 100 Males in Lofall?
There are 86.29 Females per 100 Males in Lofall.
What is the Median Population Age in Lofall?
Median Population Age in Lofall is 44.6 Years.
What is the Average Family Size in Lofall
Average Family Size in Lofall is 2.8 People.
What is the Average Household Size in Lofall
Average Household Size in Lofall is 2.5 People.
How Large is the Labor Force in Lofall?
There are 1,124 People in the Labor Forcein in Lofall.
What is the Percentage of People in the Labor Force in Lofall?
67.9% of People are in the Labor Force in Lofall.
What is the Unemployment Rate in Lofall?
Unemployment Rate in Lofall is 3.4%.