Keyport, WA Map & Demographics
Keyport Map
Keyport Overview
$63,531
PER CAPITA INCOME
$143,646
AVG FAMILY INCOME
$128,221
AVG HOUSEHOLD INCOME
19.4%
WAGE / INCOME GAP [ % ]
80.6¢/ $1
WAGE / INCOME GAP [ $ ]
0.30
INEQUALITY / GINI INDEX
284
TOTAL POPULATION
159
MALE POPULATION
125
FEMALE POPULATION
127.20
MALES / 100 FEMALES
78.62
FEMALES / 100 MALES
57.0
MEDIAN AGE
2.0
AVG FAMILY SIZE
1.7
AVG HOUSEHOLD SIZE
187
LABOR FORCE [ PEOPLE ]
65.8%
PERCENT IN LABOR FORCE
Keyport Zip Codes
Income in Keyport
Income Overview in Keyport
Per Capita Income in Keyport is $63,531, while median incomes of families and households are $143,646 and $128,221 respectively.
| Characteristic | Number | Measure |
| Per Capita Income | 284 | $63,531 |
| Median Family Income | 81 | $143,646 |
| Mean Family Income | 81 | $141,665 |
| Median Household Income | 155 | $128,221 |
| Mean Household Income | 155 | $111,439 |
| Income Deficit | 81 | $0 |
| Wage / Income Gap (%) | 284 | 19.39% |
| Wage / Income Gap ($) | 284 | 80.61¢ per $1 |
| Gini / Inequality Index | 284 | 0.30 |
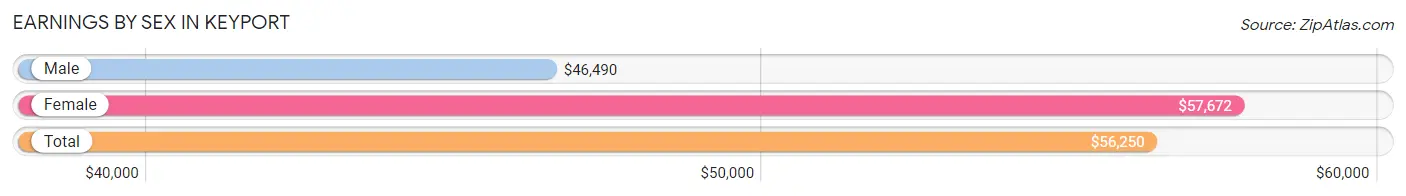
Earnings by Sex in Keyport
Average Earnings in Keyport are $56,250, $46,490 for men and $57,672 for women, a difference of 19.4%.
| Sex | Number | Average Earnings |
| Male | 113 (60.4%) | $46,490 |
| Female | 74 (39.6%) | $57,672 |
| Total | 187 (100.0%) | $56,250 |
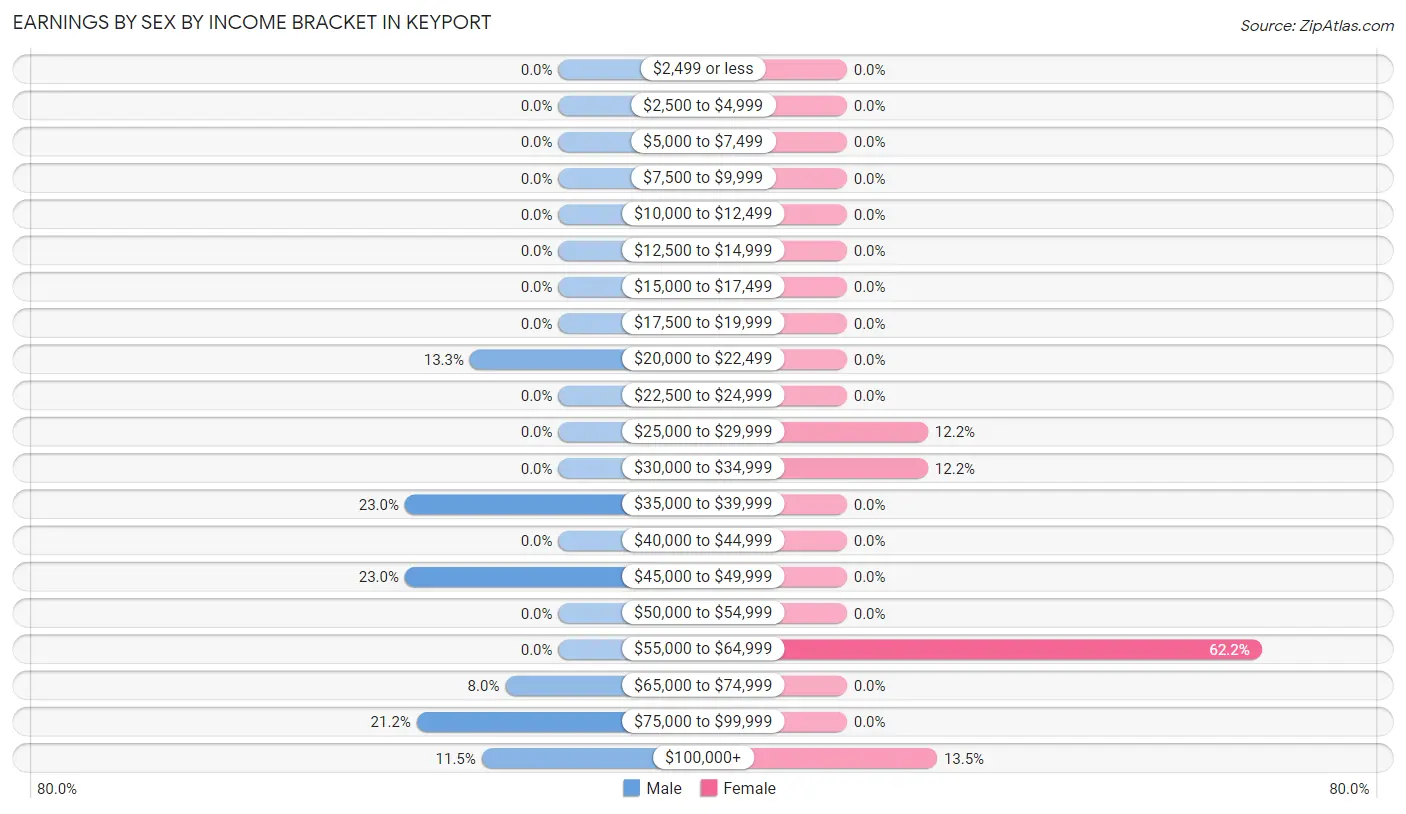
Earnings by Sex by Income Bracket in Keyport
The most common earnings brackets in Keyport are $35,000 to $39,999 for men (26 | 23.0%) and $55,000 to $64,999 for women (46 | 62.2%).
| Income | Male | Female |
| $2,499 or less | 0 (0.0%) | 0 (0.0%) |
| $2,500 to $4,999 | 0 (0.0%) | 0 (0.0%) |
| $5,000 to $7,499 | 0 (0.0%) | 0 (0.0%) |
| $7,500 to $9,999 | 0 (0.0%) | 0 (0.0%) |
| $10,000 to $12,499 | 0 (0.0%) | 0 (0.0%) |
| $12,500 to $14,999 | 0 (0.0%) | 0 (0.0%) |
| $15,000 to $17,499 | 0 (0.0%) | 0 (0.0%) |
| $17,500 to $19,999 | 0 (0.0%) | 0 (0.0%) |
| $20,000 to $22,499 | 15 (13.3%) | 0 (0.0%) |
| $22,500 to $24,999 | 0 (0.0%) | 0 (0.0%) |
| $25,000 to $29,999 | 0 (0.0%) | 9 (12.2%) |
| $30,000 to $34,999 | 0 (0.0%) | 9 (12.2%) |
| $35,000 to $39,999 | 26 (23.0%) | 0 (0.0%) |
| $40,000 to $44,999 | 0 (0.0%) | 0 (0.0%) |
| $45,000 to $49,999 | 26 (23.0%) | 0 (0.0%) |
| $50,000 to $54,999 | 0 (0.0%) | 0 (0.0%) |
| $55,000 to $64,999 | 0 (0.0%) | 46 (62.2%) |
| $65,000 to $74,999 | 9 (8.0%) | 0 (0.0%) |
| $75,000 to $99,999 | 24 (21.2%) | 0 (0.0%) |
| $100,000+ | 13 (11.5%) | 10 (13.5%) |
| Total | 113 (100.0%) | 74 (100.0%) |
Earnings by Sex by Educational Attainment in Keyport
| Educational Attainment | Male Income | Female Income |
| Less than High School | - | - |
| High School Diploma | - | - |
| College or Associate's Degree | - | - |
| Bachelor's Degree | - | - |
| Graduate Degree | - | - |
| Total | $80,313 | $0 |
Family Income in Keyport
Family Income Brackets in Keyport
According to the Keyport family income data, there are 47 families falling into the $100,000 to $149,999 income range, which is the most common income bracket and makes up 58.0% of all families.
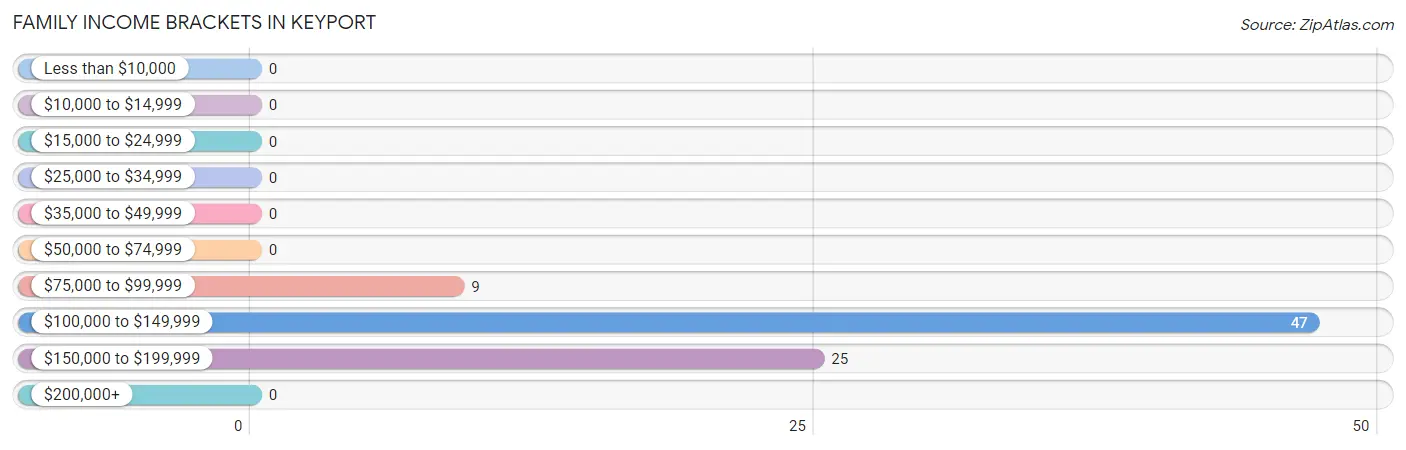
| Income Bracket | # Families | % Families |
| Less than $10,000 | 0 | 0.0% |
| $10,000 to $14,999 | 0 | 0.0% |
| $15,000 to $24,999 | 0 | 0.0% |
| $25,000 to $34,999 | 0 | 0.0% |
| $35,000 to $49,999 | 0 | 0.0% |
| $50,000 to $74,999 | 0 | 0.0% |
| $75,000 to $99,999 | 9 | 11.1% |
| $100,000 to $149,999 | 47 | 58.0% |
| $150,000 to $199,999 | 25 | 30.9% |
| $200,000+ | 0 | 0.0% |
Family Income by Famaliy Size in Keyport
2-person families (81 | 100.0%) account for the highest median family income in Keyport with $143,646 per family, while 2-person families (81 | 100.0%) have the highest median income of $71,823 per family member.
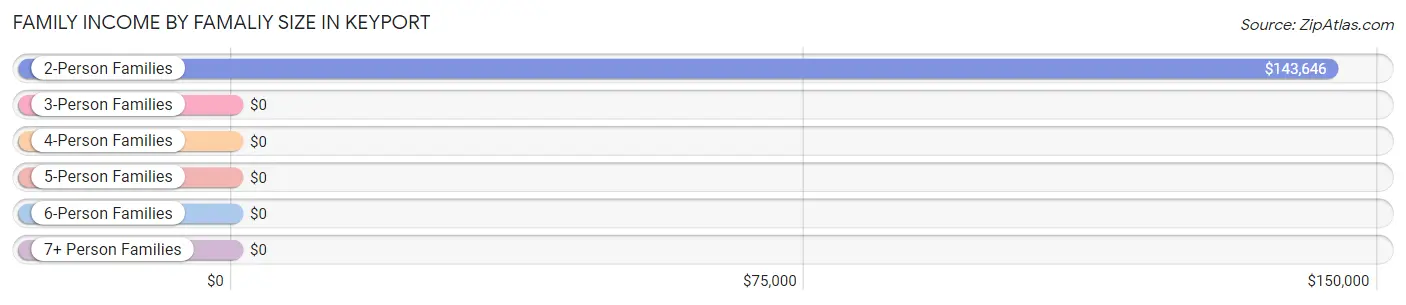
| Income Bracket | # Families | Median Income |
| 2-Person Families | 81 (100.0%) | $143,646 |
| 3-Person Families | 0 (0.0%) | $0 |
| 4-Person Families | 0 (0.0%) | $0 |
| 5-Person Families | 0 (0.0%) | $0 |
| 6-Person Families | 0 (0.0%) | $0 |
| 7+ Person Families | 0 (0.0%) | $0 |
| Total | 81 (100.0%) | $143,646 |
Family Income by Number of Earners in Keyport
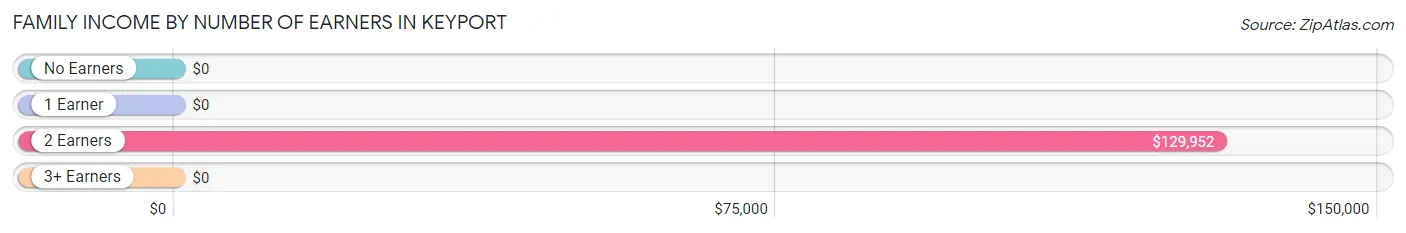
| Number of Earners | # Families | Median Income |
| No Earners | 12 (14.8%) | $0 |
| 1 Earner | 18 (22.2%) | $0 |
| 2 Earners | 51 (63.0%) | $129,952 |
| 3+ Earners | 0 (0.0%) | $0 |
| Total | 81 (100.0%) | $143,646 |
Household Income in Keyport
Household Income Brackets in Keyport
With 47 households falling in the category, the $100,000 to $149,999 income range is the most frequent in Keyport, accounting for 30.3% of all households.
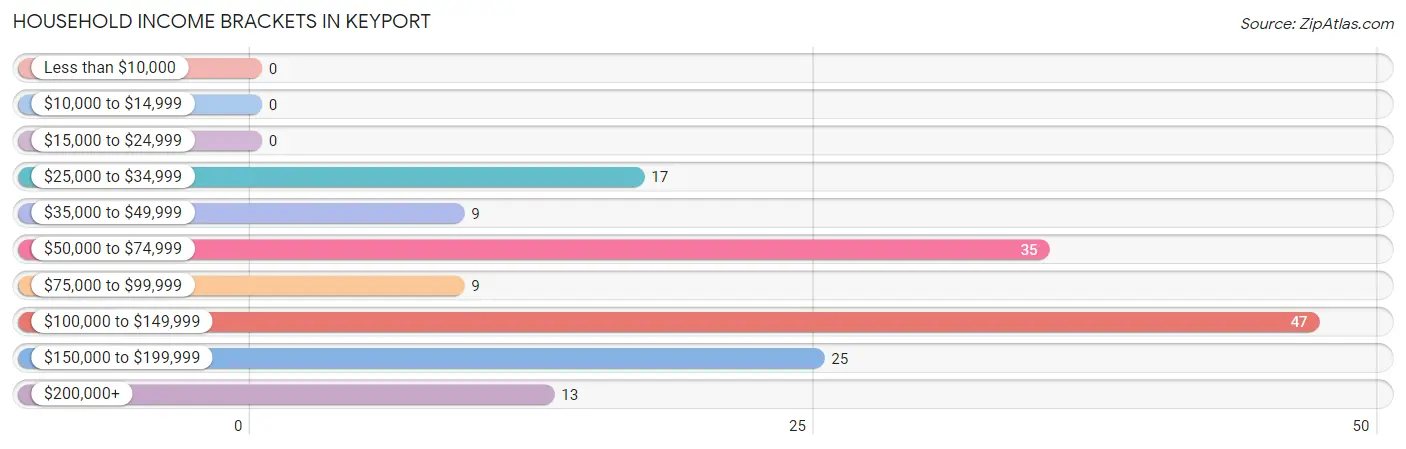
| Income Bracket | # Households | % Households |
| Less than $10,000 | 0 | 0.0% |
| $10,000 to $14,999 | 0 | 0.0% |
| $15,000 to $24,999 | 0 | 0.0% |
| $25,000 to $34,999 | 17 | 11.0% |
| $35,000 to $49,999 | 9 | 5.8% |
| $50,000 to $74,999 | 35 | 22.6% |
| $75,000 to $99,999 | 9 | 5.8% |
| $100,000 to $149,999 | 47 | 30.3% |
| $150,000 to $199,999 | 25 | 16.1% |
| $200,000+ | 13 | 8.4% |
Household Income by Householder Age in Keyport
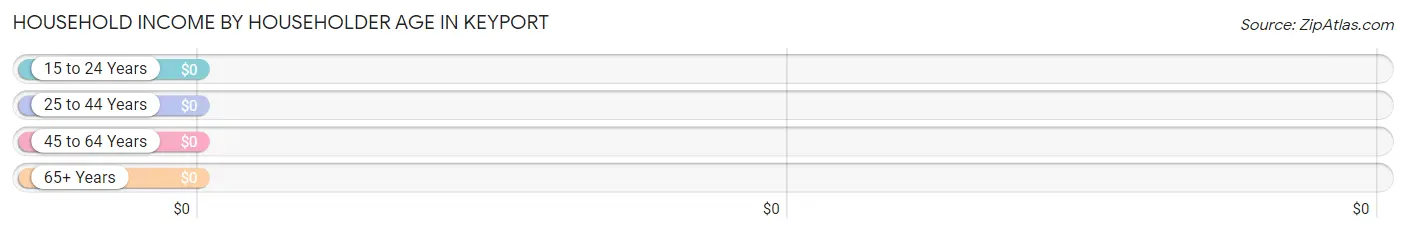
| Income Bracket | # Households | Median Income |
| 15 to 24 Years | 26 (16.8%) | $0 |
| 25 to 44 Years | 0 (0.0%) | $0 |
| 45 to 64 Years | 82 (52.9%) | $0 |
| 65+ Years | 47 (30.3%) | $0 |
| Total | 155 (100.0%) | $128,221 |
Poverty in Keyport
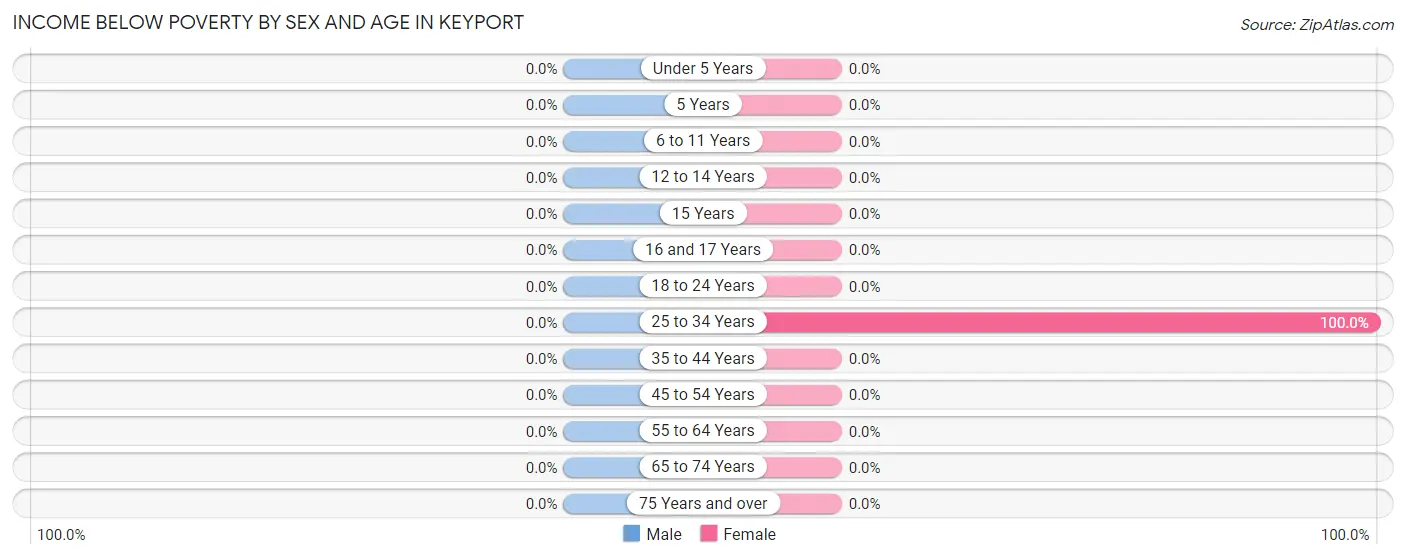
Income Below Poverty by Sex and Age in Keyport
| Age Bracket | Male | Female |
| Under 5 Years | 0 (0.0%) | 0 (0.0%) |
| 5 Years | 0 (0.0%) | 0 (0.0%) |
| 6 to 11 Years | 0 (0.0%) | 0 (0.0%) |
| 12 to 14 Years | 0 (0.0%) | 0 (0.0%) |
| 15 Years | 0 (0.0%) | 0 (0.0%) |
| 16 and 17 Years | 0 (0.0%) | 0 (0.0%) |
| 18 to 24 Years | 0 (0.0%) | 0 (0.0%) |
| 25 to 34 Years | 0 (0.0%) | 20 (100.0%) |
| 35 to 44 Years | 0 (0.0%) | 0 (0.0%) |
| 45 to 54 Years | 0 (0.0%) | 0 (0.0%) |
| 55 to 64 Years | 0 (0.0%) | 0 (0.0%) |
| 65 to 74 Years | 0 (0.0%) | 0 (0.0%) |
| 75 Years and over | 0 (0.0%) | 0 (0.0%) |
| Total | 0 (0.0%) | 20 (17.2%) |
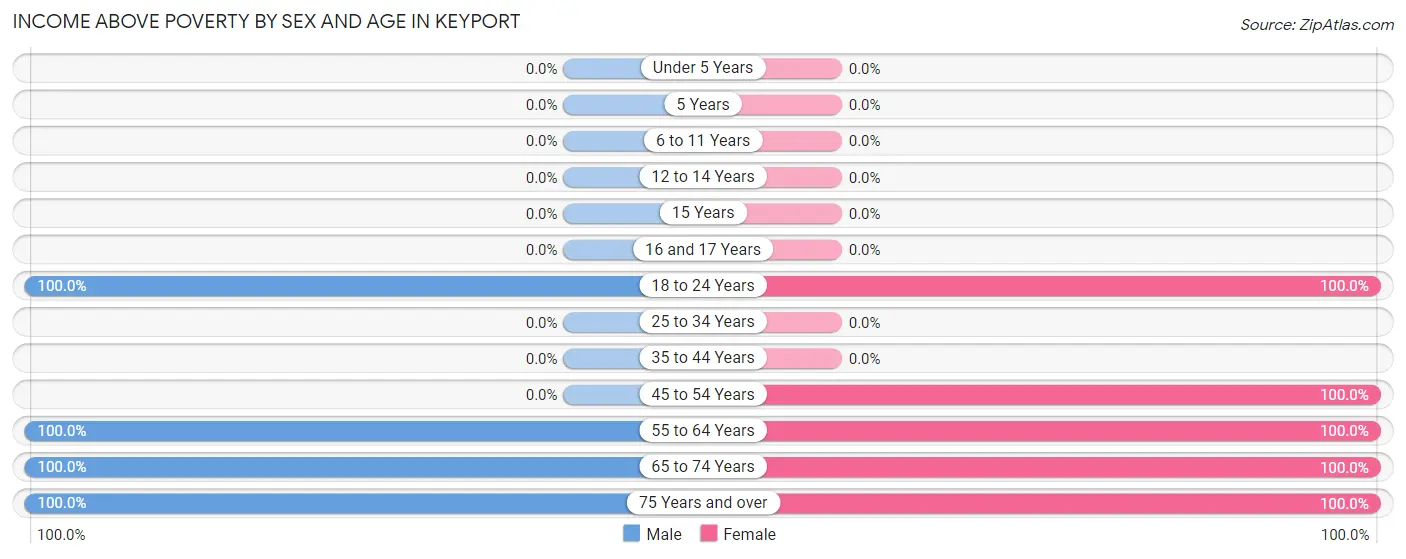
Income Above Poverty by Sex and Age in Keyport
According to the poverty statistics in Keyport, males aged 18 to 24 years and females aged 18 to 24 years are the age groups that are most secure financially, with 100.0% of males and 100.0% of females in these age groups living above the poverty line.
| Age Bracket | Male | Female |
| Under 5 Years | 0 (0.0%) | 0 (0.0%) |
| 5 Years | 0 (0.0%) | 0 (0.0%) |
| 6 to 11 Years | 0 (0.0%) | 0 (0.0%) |
| 12 to 14 Years | 0 (0.0%) | 0 (0.0%) |
| 15 Years | 0 (0.0%) | 0 (0.0%) |
| 16 and 17 Years | 0 (0.0%) | 0 (0.0%) |
| 18 to 24 Years | 26 (100.0%) | 29 (100.0%) |
| 25 to 34 Years | 0 (0.0%) | 0 (0.0%) |
| 35 to 44 Years | 0 (0.0%) | 0 (0.0%) |
| 45 to 54 Years | 0 (0.0%) | 17 (100.0%) |
| 55 to 64 Years | 81 (100.0%) | 29 (100.0%) |
| 65 to 74 Years | 20 (100.0%) | 12 (100.0%) |
| 75 Years and over | 17 (100.0%) | 9 (100.0%) |
| Total | 144 (100.0%) | 96 (82.8%) |
Income Below Poverty Among Married-Couple Families in Keyport
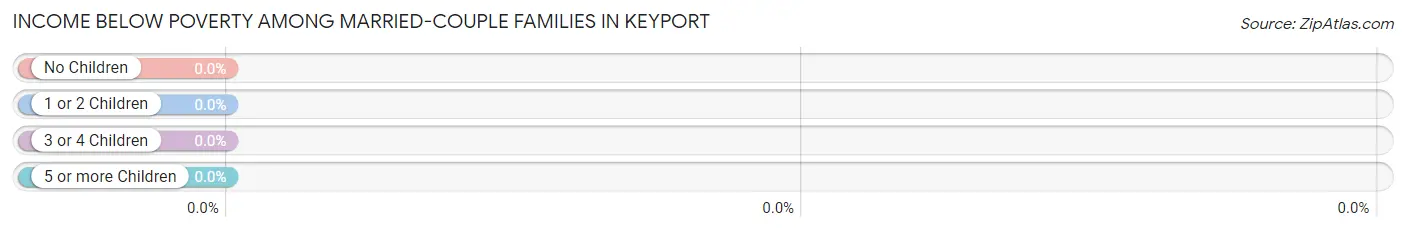
| Children | Above Poverty | Below Poverty |
| No Children | 81 (100.0%) | 0 (0.0%) |
| 1 or 2 Children | 0 (0.0%) | 0 (0.0%) |
| 3 or 4 Children | 0 (0.0%) | 0 (0.0%) |
| 5 or more Children | 0 (0.0%) | 0 (0.0%) |
| Total | 81 (100.0%) | 0 (0.0%) |
Income Below Poverty Among Single-Parent Households in Keyport
| Children | Single Father | Single Mother |
| No Children | 0 (0.0%) | 0 (0.0%) |
| 1 or 2 Children | 0 (0.0%) | 0 (0.0%) |
| 3 or 4 Children | 0 (0.0%) | 0 (0.0%) |
| 5 or more Children | 0 (0.0%) | 0 (0.0%) |
| Total | 0 (0.0%) | 0 (0.0%) |
Income Below Poverty Among Married-Couple vs Single-Parent Households in Keyport
| Children | Married-Couple Families | Single-Parent Households |
| No Children | 0 (0.0%) | 0 (0.0%) |
| 1 or 2 Children | 0 (0.0%) | 0 (0.0%) |
| 3 or 4 Children | 0 (0.0%) | 0 (0.0%) |
| 5 or more Children | 0 (0.0%) | 0 (0.0%) |
| Total | 0 (0.0%) | 0 (0.0%) |
Race in Keyport
The most populous races in Keyport are White / Caucasian (271 | 95.4%), Hispanic or Latino (15 | 5.3%), and Hawaiian / Pacific (13 | 4.6%).
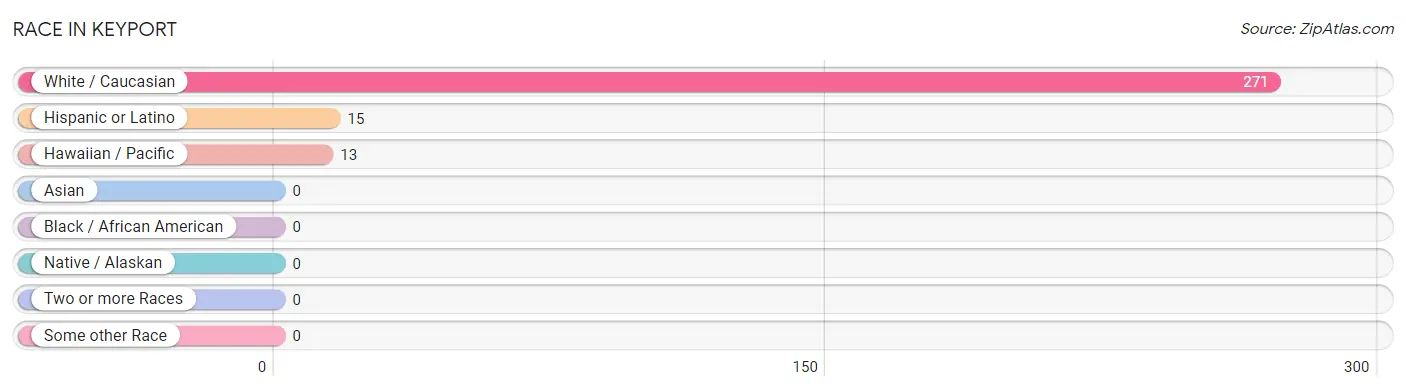
| Race | # Population | % Population |
| Asian | 0 | 0.0% |
| Black / African American | 0 | 0.0% |
| Hawaiian / Pacific | 13 | 4.6% |
| Hispanic or Latino | 15 | 5.3% |
| Native / Alaskan | 0 | 0.0% |
| White / Caucasian | 271 | 95.4% |
| Two or more Races | 0 | 0.0% |
| Some other Race | 0 | 0.0% |
| Total | 284 | 100.0% |
Ancestry in Keyport
The most populous ancestries reported in Keyport are English (72 | 25.4%), French (55 | 19.4%), German (43 | 15.1%), Irish (26 | 9.1%), and Norwegian (25 | 8.8%), together accounting for 77.8% of all Keyport residents.
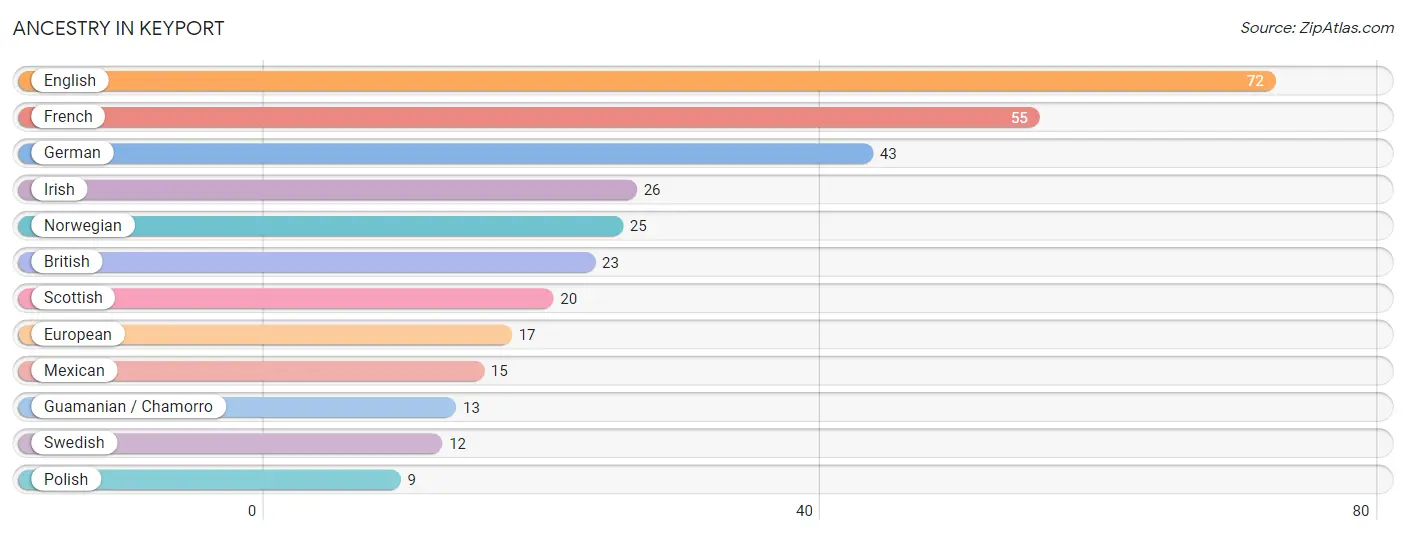
| Ancestry | # Population | % Population |
| British | 23 | 8.1% |
| English | 72 | 25.4% |
| European | 17 | 6.0% |
| French | 55 | 19.4% |
| German | 43 | 15.1% |
| Guamanian / Chamorro | 13 | 4.6% |
| Irish | 26 | 9.1% |
| Mexican | 15 | 5.3% |
| Norwegian | 25 | 8.8% |
| Polish | 9 | 3.2% |
| Scottish | 20 | 7.0% |
| Swedish | 12 | 4.2% | View All 12 Rows |
Immigrants in Keyport

| Immigration Origin | # Population | % Population | View All 0 Rows |
Sex and Age in Keyport
Sex and Age in Keyport
The most populous age groups in Keyport are 55 to 59 Years (51 | 32.1%) for men and 20 to 24 Years (38 | 30.4%) for women.
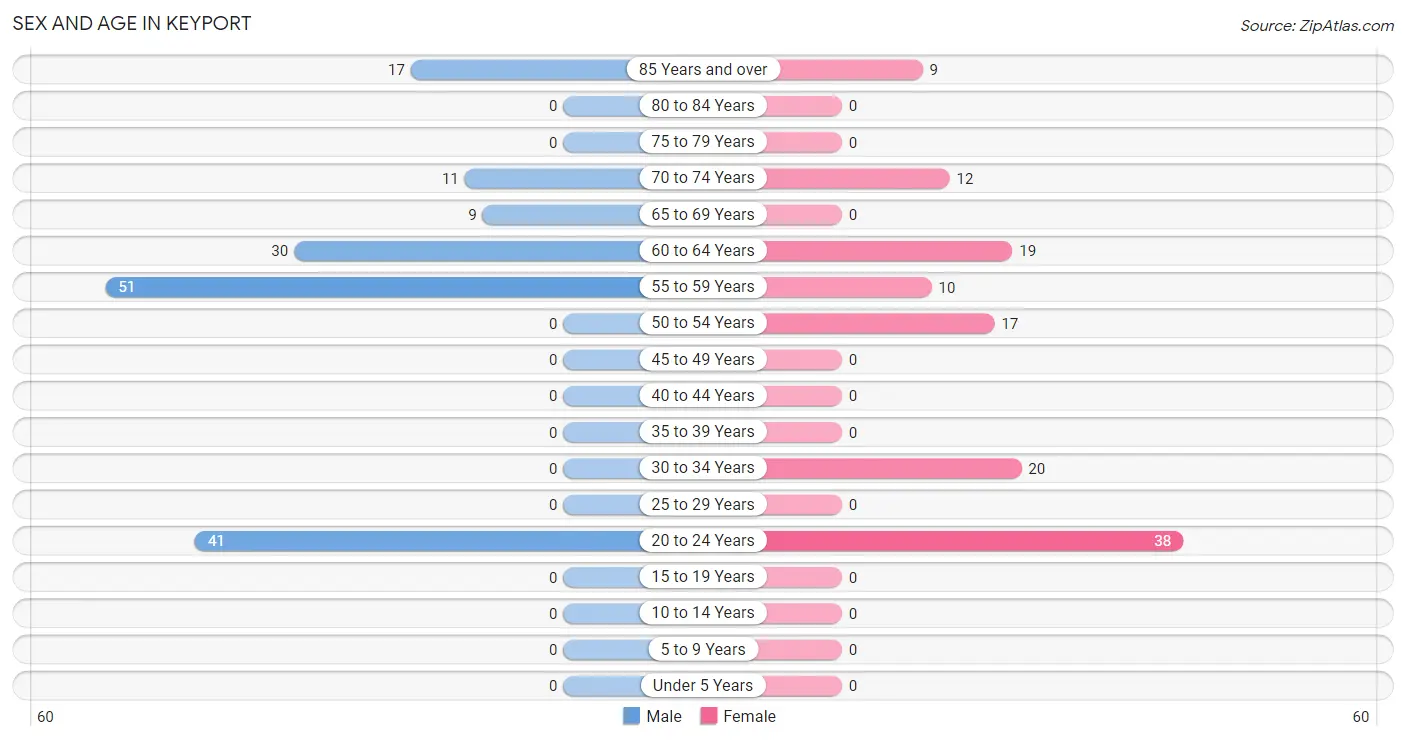
| Age Bracket | Male | Female |
| Under 5 Years | 0 (0.0%) | 0 (0.0%) |
| 5 to 9 Years | 0 (0.0%) | 0 (0.0%) |
| 10 to 14 Years | 0 (0.0%) | 0 (0.0%) |
| 15 to 19 Years | 0 (0.0%) | 0 (0.0%) |
| 20 to 24 Years | 41 (25.8%) | 38 (30.4%) |
| 25 to 29 Years | 0 (0.0%) | 0 (0.0%) |
| 30 to 34 Years | 0 (0.0%) | 20 (16.0%) |
| 35 to 39 Years | 0 (0.0%) | 0 (0.0%) |
| 40 to 44 Years | 0 (0.0%) | 0 (0.0%) |
| 45 to 49 Years | 0 (0.0%) | 0 (0.0%) |
| 50 to 54 Years | 0 (0.0%) | 17 (13.6%) |
| 55 to 59 Years | 51 (32.1%) | 10 (8.0%) |
| 60 to 64 Years | 30 (18.9%) | 19 (15.2%) |
| 65 to 69 Years | 9 (5.7%) | 0 (0.0%) |
| 70 to 74 Years | 11 (6.9%) | 12 (9.6%) |
| 75 to 79 Years | 0 (0.0%) | 0 (0.0%) |
| 80 to 84 Years | 0 (0.0%) | 0 (0.0%) |
| 85 Years and over | 17 (10.7%) | 9 (7.2%) |
| Total | 159 (100.0%) | 125 (100.0%) |
Families and Households in Keyport
Median Family Size in Keyport
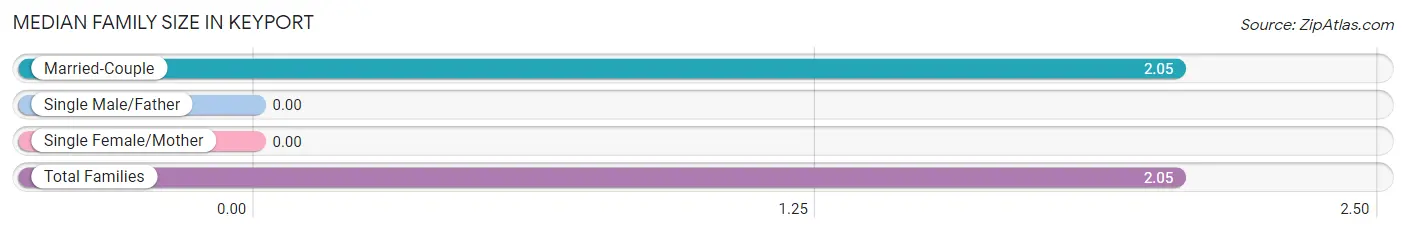
| Family Type | # Families | Family Size |
| Married-Couple | 81 (100.0%) | 2.05 |
| Single Male/Father | 0 (0.0%) | - |
| Single Female/Mother | 0 (0.0%) | - |
| Total Families | 81 (100.0%) | 2.05 |
Median Household Size in Keyport
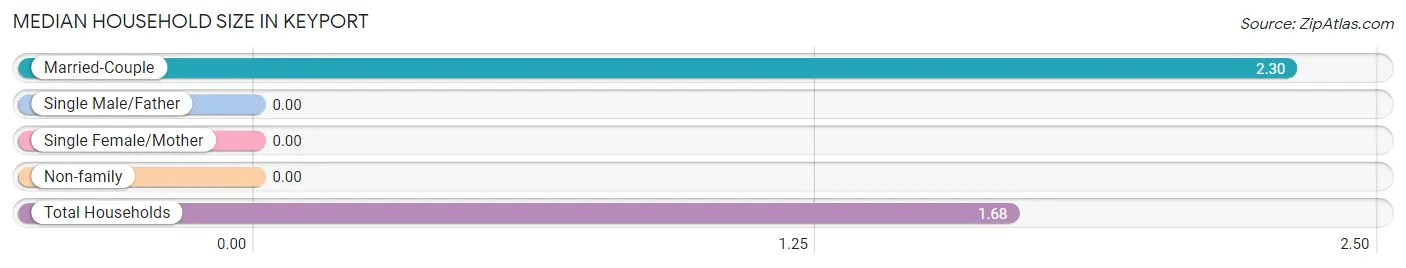
| Household Type | # Households | Household Size |
| Married-Couple | 81 (52.3%) | 2.30 |
| Single Male/Father | 0 (0.0%) | - |
| Single Female/Mother | 0 (0.0%) | - |
| Non-family | 74 (47.7%) | - |
| Total Households | 155 (100.0%) | 1.68 |
Household Size by Marriage Status in Keyport
Out of a total of 155 households in Keyport, 81 (52.3%) are family households, while 74 (47.7%) are nonfamily households. The most numerous type of family households are 2-person households, comprising 65, and the most common type of nonfamily households are 1-person households, comprising 74.
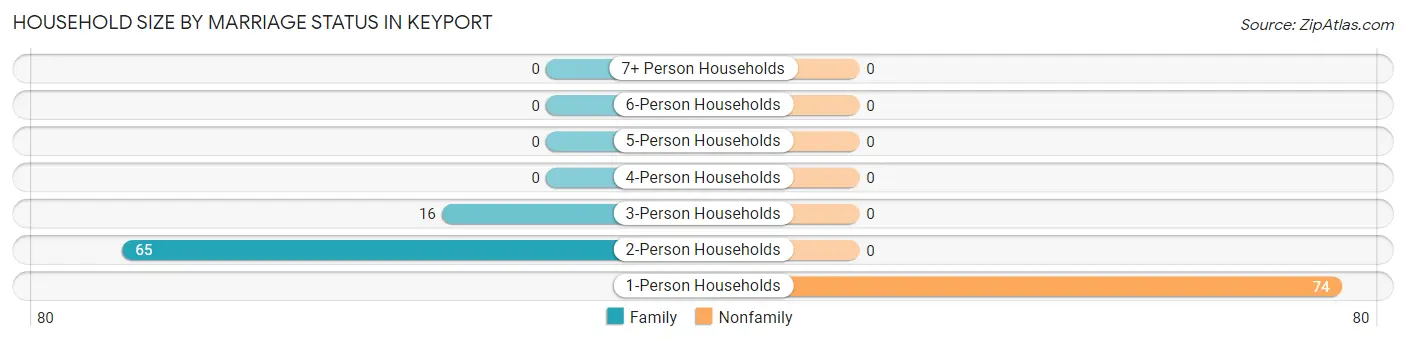
| Household Size | Family Households | Nonfamily Households |
| 1-Person Households | - | 74 (47.7%) |
| 2-Person Households | 65 (41.9%) | 0 (0.0%) |
| 3-Person Households | 16 (10.3%) | 0 (0.0%) |
| 4-Person Households | 0 (0.0%) | 0 (0.0%) |
| 5-Person Households | 0 (0.0%) | 0 (0.0%) |
| 6-Person Households | 0 (0.0%) | 0 (0.0%) |
| 7+ Person Households | 0 (0.0%) | 0 (0.0%) |
| Total | 81 (52.3%) | 74 (47.7%) |
Female Fertility in Keyport
Fertility by Age in Keyport
| Age Bracket | Women with Births | Births / 1,000 Women |
| 15 to 19 years | 0 (0.0%) | 0.0 |
| 20 to 34 years | 0 (0.0%) | 0.0 |
| 35 to 50 years | 0 (0.0%) | 0.0 |
| Total | 0 (0.0%) | 0.0 |
Fertility by Age by Marriage Status in Keyport
| Age Bracket | Married | Unmarried |
| 15 to 19 years | 0 (0.0%) | 0 (0.0%) |
| 20 to 34 years | 0 (0.0%) | 0 (0.0%) |
| 35 to 50 years | 0 (0.0%) | 0 (0.0%) |
| Total | 0 (0.0%) | 0 (0.0%) |
Fertility by Education in Keyport
| Educational Attainment | Women with Births | Births / 1,000 Women |
| Less than High School | 0 (0.0%) | 0.0 |
| High School Diploma | 0 (0.0%) | 0.0 |
| College or Associate's Degree | 0 (0.0%) | 0.0 |
| Bachelor's Degree | 0 (0.0%) | 0.0 |
| Graduate Degree | 0 (0.0%) | 0.0 |
| Total | 0 (0.0%) | 0.0 |
Fertility by Education by Marriage Status in Keyport
| Educational Attainment | Married | Unmarried |
| Less than High School | 0 (0.0%) | 0 (0.0%) |
| High School Diploma | 0 (0.0%) | 0 (0.0%) |
| College or Associate's Degree | 0 (0.0%) | 0 (0.0%) |
| Bachelor's Degree | 0 (0.0%) | 0 (0.0%) |
| Graduate Degree | 0 (0.0%) | 0 (0.0%) |
| Total | 0 (0.0%) | 0 (0.0%) |
Employment Characteristics in Keyport
Employment by Class of Employer in Keyport
Among the 171 employed individuals in Keyport, private company employees (89 | 52.0%), federal government employees (63 | 36.8%), and local government employees (10 | 5.9%) make up the most common classes of employment.
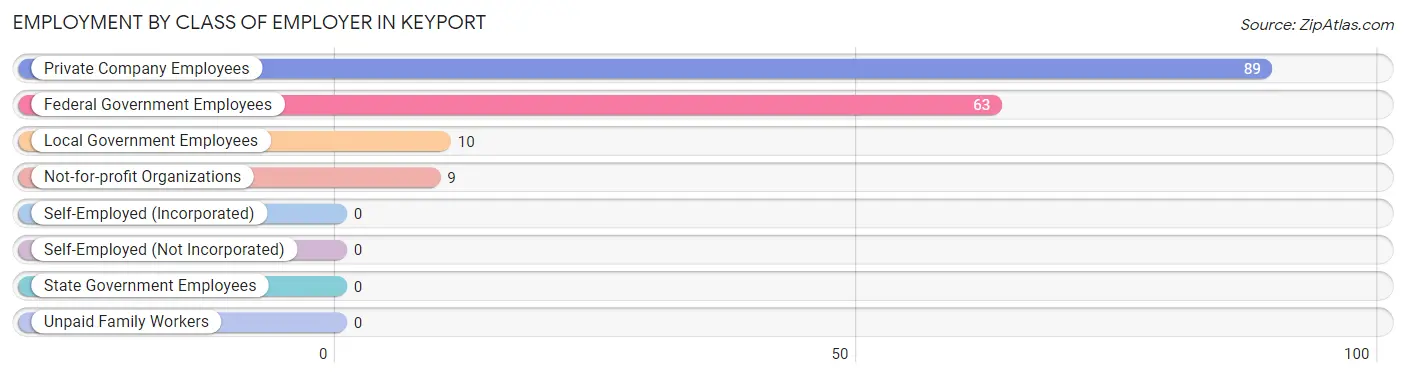
| Employer Class | # Employees | % Employees |
| Private Company Employees | 89 | 52.0% |
| Self-Employed (Incorporated) | 0 | 0.0% |
| Self-Employed (Not Incorporated) | 0 | 0.0% |
| Not-for-profit Organizations | 9 | 5.3% |
| Local Government Employees | 10 | 5.9% |
| State Government Employees | 0 | 0.0% |
| Federal Government Employees | 63 | 36.8% |
| Unpaid Family Workers | 0 | 0.0% |
| Total | 171 | 100.0% |
Employment Status by Age in Keyport
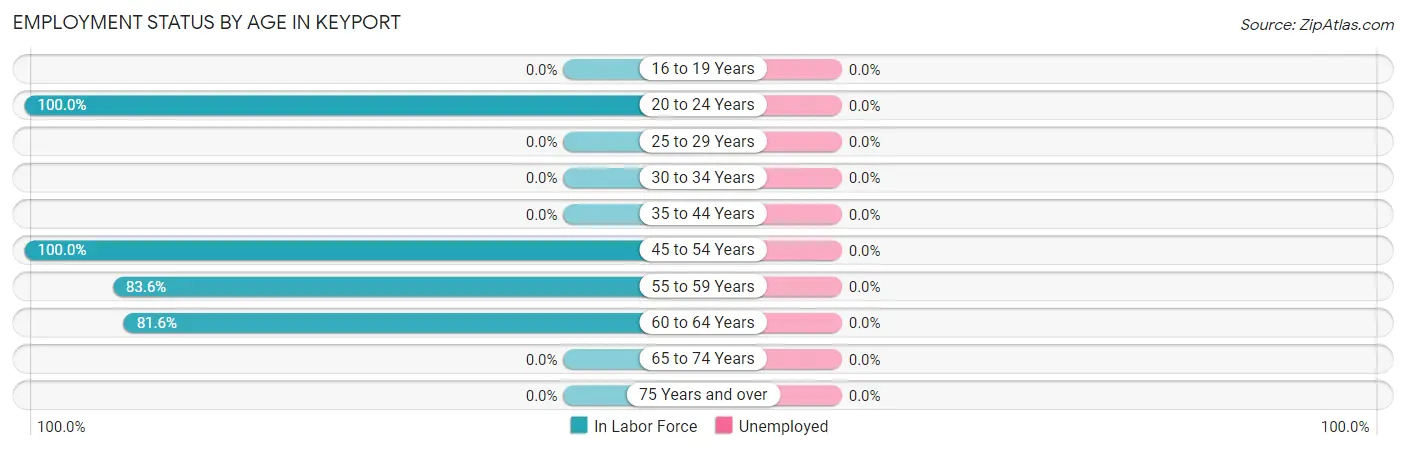
| Age Bracket | In Labor Force | Unemployed |
| 16 to 19 Years | 0 (0.0%) | 0 (0.0%) |
| 20 to 24 Years | 79 (100.0%) | 0 (0.0%) |
| 25 to 29 Years | 0 (0.0%) | 0 (0.0%) |
| 30 to 34 Years | 0 (0.0%) | 0 (0.0%) |
| 35 to 44 Years | 0 (0.0%) | 0 (0.0%) |
| 45 to 54 Years | 17 (100.0%) | 0 (0.0%) |
| 55 to 59 Years | 51 (83.6%) | 0 (0.0%) |
| 60 to 64 Years | 40 (81.6%) | 0 (0.0%) |
| 65 to 74 Years | 0 (0.0%) | 0 (0.0%) |
| 75 Years and over | 0 (0.0%) | 0 (0.0%) |
| Total | 187 (65.8%) | 0 (0.0%) |
Employment Status by Educational Attainment in Keyport
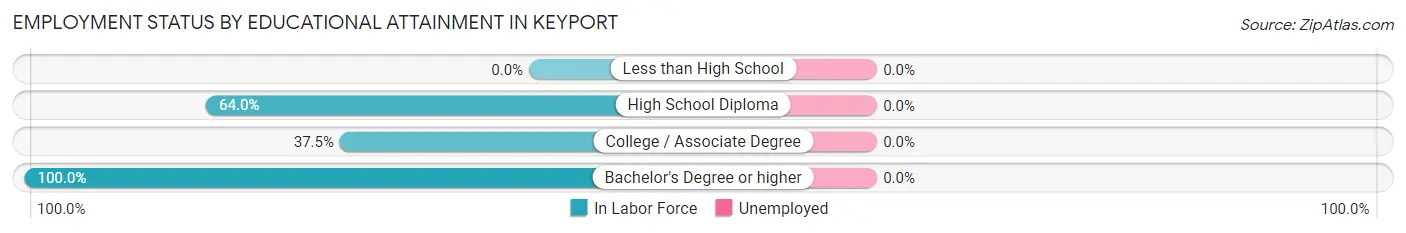
| Educational Attainment | In Labor Force | Unemployed |
| Less than High School | 0 (0.0%) | 0 (0.0%) |
| High School Diploma | 16 (64.0%) | 0 (0.0%) |
| College / Associate Degree | 18 (37.5%) | 0 (0.0%) |
| Bachelor's Degree or higher | 74 (100.0%) | 0 (0.0%) |
| Total | 108 (73.5%) | 0 (0.0%) |
Employment Occupations by Sex in Keyport
Management, Business, Science and Arts Occupations
The most common Management, Business, Science and Arts occupations in Keyport are Computers, Engineering & Science (63 | 46.0%), Architecture & Engineering (47 | 34.3%), Health Diagnosing & Treating (29 | 21.2%), Health Technologists (29 | 21.2%), and Community & Social Service (19 | 13.9%).
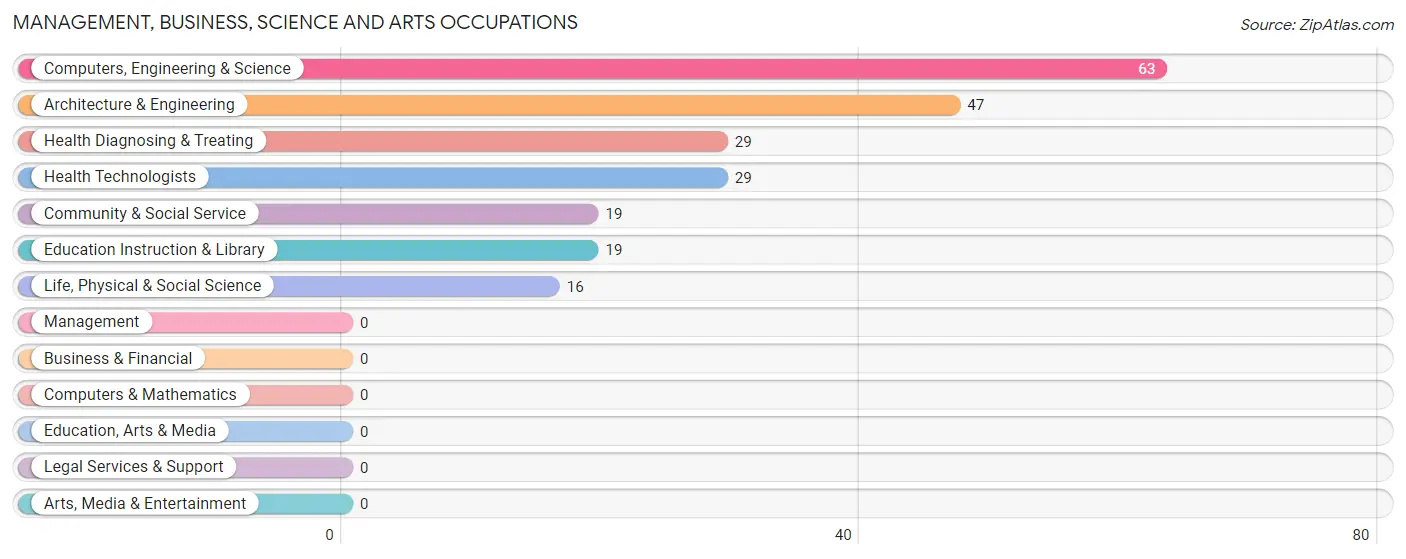
Management, Business, Science and Arts Occupations by Sex
Within the Management, Business, Science and Arts occupations in Keyport, the most male-oriented occupations are Life, Physical & Social Science (100.0%), Computers, Engineering & Science (73.0%), and Architecture & Engineering (63.8%), while the most female-oriented occupations are Community & Social Service (100.0%), Education Instruction & Library (100.0%), and Health Diagnosing & Treating (100.0%).
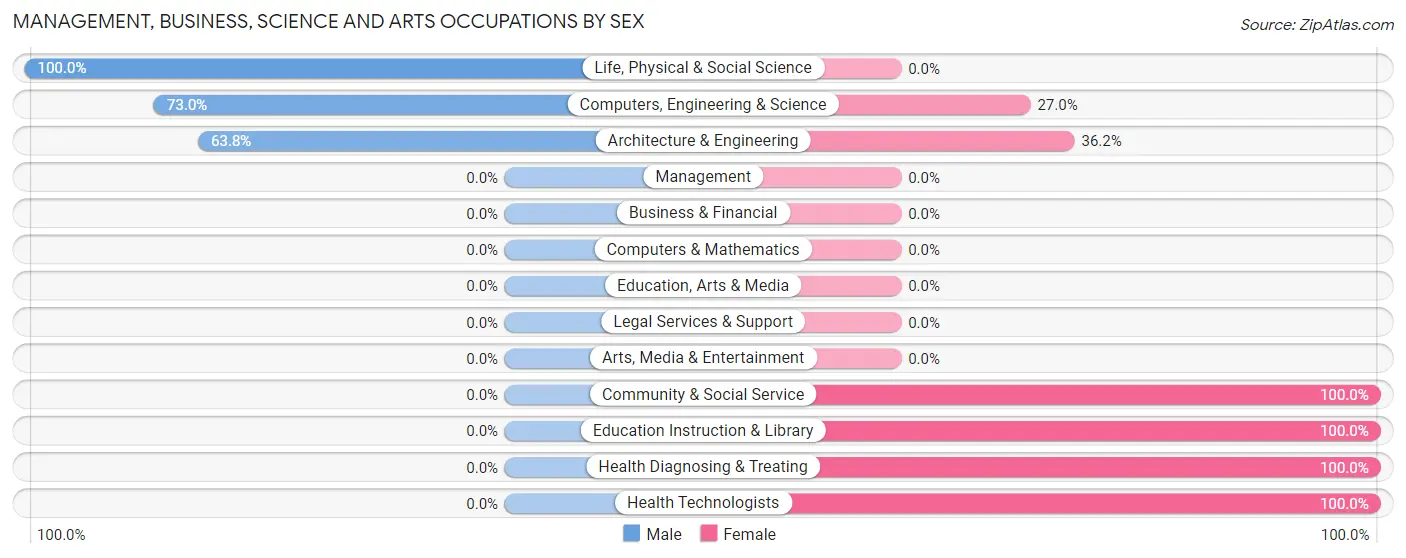
| Occupation | Male | Female |
| Management | 0 (0.0%) | 0 (0.0%) |
| Business & Financial | 0 (0.0%) | 0 (0.0%) |
| Computers, Engineering & Science | 46 (73.0%) | 17 (27.0%) |
| Computers & Mathematics | 0 (0.0%) | 0 (0.0%) |
| Architecture & Engineering | 30 (63.8%) | 17 (36.2%) |
| Life, Physical & Social Science | 16 (100.0%) | 0 (0.0%) |
| Community & Social Service | 0 (0.0%) | 19 (100.0%) |
| Education, Arts & Media | 0 (0.0%) | 0 (0.0%) |
| Legal Services & Support | 0 (0.0%) | 0 (0.0%) |
| Education Instruction & Library | 0 (0.0%) | 19 (100.0%) |
| Arts, Media & Entertainment | 0 (0.0%) | 0 (0.0%) |
| Health Diagnosing & Treating | 0 (0.0%) | 29 (100.0%) |
| Health Technologists | 0 (0.0%) | 29 (100.0%) |
| Total (Category) | 46 (41.4%) | 65 (58.6%) |
| Total (Overall) | 72 (52.5%) | 65 (47.4%) |
Services Occupations
Services Occupations by Sex
| Occupation | Male | Female |
| Healthcare Support | 0 (0.0%) | 0 (0.0%) |
| Security & Protection | 0 (0.0%) | 0 (0.0%) |
| Firefighting & Prevention | 0 (0.0%) | 0 (0.0%) |
| Law Enforcement | 0 (0.0%) | 0 (0.0%) |
| Food Preparation & Serving | 0 (0.0%) | 0 (0.0%) |
| Cleaning & Maintenance | 0 (0.0%) | 0 (0.0%) |
| Personal Care & Service | 0 (0.0%) | 0 (0.0%) |
| Total (Category) | 0 (0.0%) | 0 (0.0%) |
| Total (Overall) | 72 (52.5%) | 65 (47.4%) |
Sales and Office Occupations
The most common Sales and Office occupations in Keyport are , and Sales & Related (26 | 19.0%).
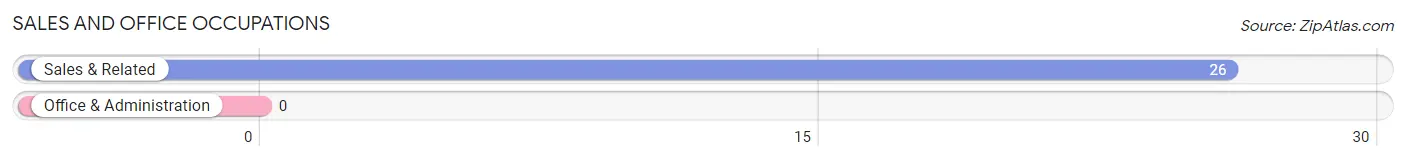
Sales and Office Occupations by Sex

| Occupation | Male | Female |
| Sales & Related | 26 (100.0%) | 0 (0.0%) |
| Office & Administration | 0 (0.0%) | 0 (0.0%) |
| Total (Category) | 26 (100.0%) | 0 (0.0%) |
| Total (Overall) | 72 (52.5%) | 65 (47.4%) |
Natural Resources, Construction and Maintenance Occupations
Natural Resources, Construction and Maintenance Occupations by Sex
| Occupation | Male | Female |
| Farming, Fishing & Forestry | 0 (0.0%) | 0 (0.0%) |
| Construction & Extraction | 0 (0.0%) | 0 (0.0%) |
| Installation, Maintenance & Repair | 0 (0.0%) | 0 (0.0%) |
| Total (Category) | 0 (0.0%) | 0 (0.0%) |
| Total (Overall) | 72 (52.5%) | 65 (47.4%) |
Production, Transportation and Moving Occupations
Production, Transportation and Moving Occupations by Sex
| Occupation | Male | Female |
| Production | 0 (0.0%) | 0 (0.0%) |
| Transportation | 0 (0.0%) | 0 (0.0%) |
| Material Moving | 0 (0.0%) | 0 (0.0%) |
| Total (Category) | 0 (0.0%) | 0 (0.0%) |
| Total (Overall) | 72 (52.5%) | 65 (47.4%) |
Employment Industries by Sex in Keyport
Employment Industries in Keyport
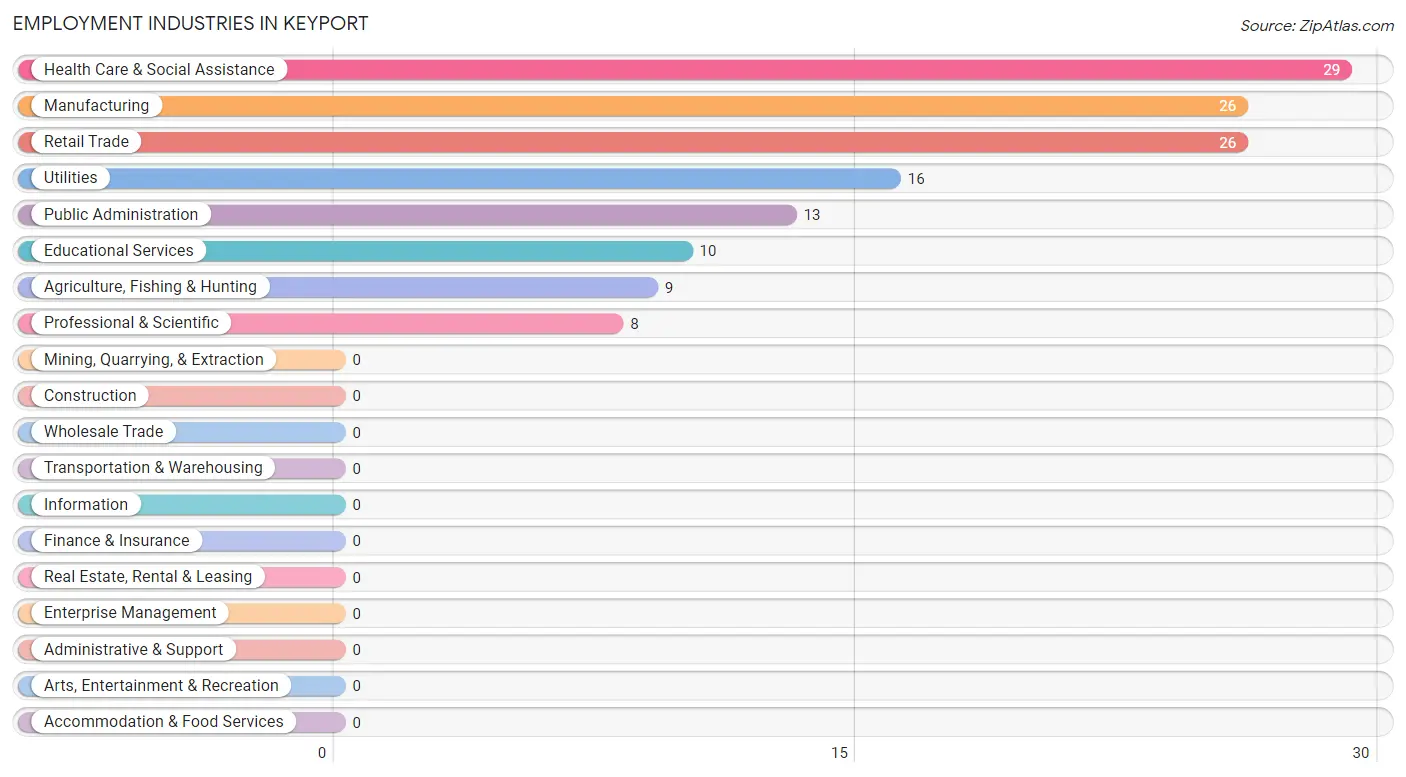
The major employment industries in Keyport include Health Care & Social Assistance (29 | 21.2%), Manufacturing (26 | 19.0%), Retail Trade (26 | 19.0%), Utilities (16 | 11.7%), and Public Administration (13 | 9.5%).
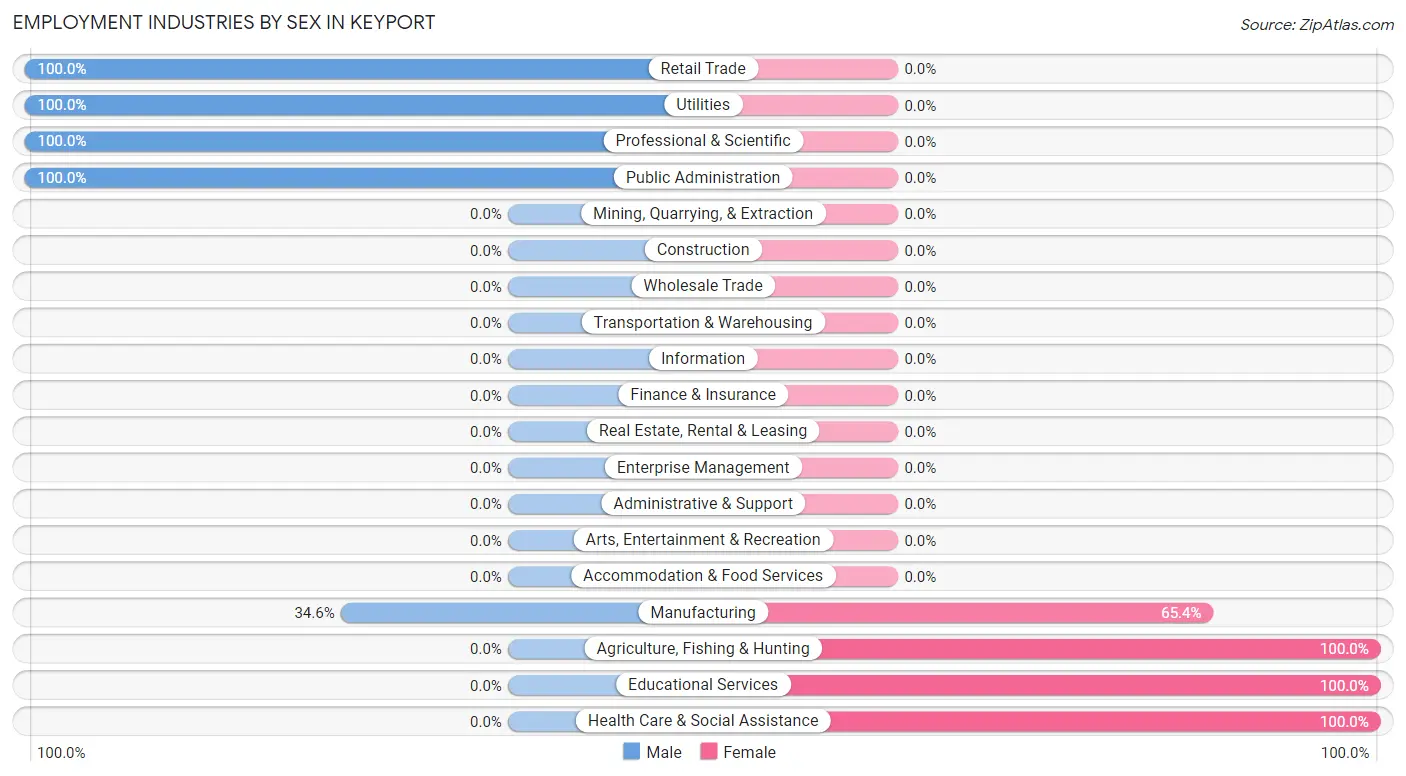
Employment Industries by Sex in Keyport
The Keyport industries that see more men than women are Retail Trade (100.0%), Utilities (100.0%), and Professional & Scientific (100.0%), whereas the industries that tend to have a higher number of women are Agriculture, Fishing & Hunting (100.0%), Educational Services (100.0%), and Health Care & Social Assistance (100.0%).
| Industry | Male | Female |
| Agriculture, Fishing & Hunting | 0 (0.0%) | 9 (100.0%) |
| Mining, Quarrying, & Extraction | 0 (0.0%) | 0 (0.0%) |
| Construction | 0 (0.0%) | 0 (0.0%) |
| Manufacturing | 9 (34.6%) | 17 (65.4%) |
| Wholesale Trade | 0 (0.0%) | 0 (0.0%) |
| Retail Trade | 26 (100.0%) | 0 (0.0%) |
| Transportation & Warehousing | 0 (0.0%) | 0 (0.0%) |
| Utilities | 16 (100.0%) | 0 (0.0%) |
| Information | 0 (0.0%) | 0 (0.0%) |
| Finance & Insurance | 0 (0.0%) | 0 (0.0%) |
| Real Estate, Rental & Leasing | 0 (0.0%) | 0 (0.0%) |
| Professional & Scientific | 8 (100.0%) | 0 (0.0%) |
| Enterprise Management | 0 (0.0%) | 0 (0.0%) |
| Administrative & Support | 0 (0.0%) | 0 (0.0%) |
| Educational Services | 0 (0.0%) | 10 (100.0%) |
| Health Care & Social Assistance | 0 (0.0%) | 29 (100.0%) |
| Arts, Entertainment & Recreation | 0 (0.0%) | 0 (0.0%) |
| Accommodation & Food Services | 0 (0.0%) | 0 (0.0%) |
| Public Administration | 13 (100.0%) | 0 (0.0%) |
| Total | 72 (52.5%) | 65 (47.4%) |
Education in Keyport
School Enrollment in Keyport
| School Level | # Students | % Students |
| Nursery / Preschool | 0 | 0.0% |
| Kindergarten | 0 | 0.0% |
| Elementary School | 0 | 0.0% |
| Middle School | 0 | 0.0% |
| High School | 0 | 0.0% |
| College / Undergraduate | 0 | 0.0% |
| Graduate / Professional | 0 | 0.0% |
| Total | 0 | 0.0% |
School Enrollment by Age by Funding Source in Keyport
| Age Bracket | Public School | Private School |
| 3 to 4 Year Olds | 0 (0.0%) | 0 (0.0%) |
| 5 to 9 Year Old | 0 (0.0%) | 0 (0.0%) |
| 10 to 14 Year Olds | 0 (0.0%) | 0 (0.0%) |
| 15 to 17 Year Olds | 0 (0.0%) | 0 (0.0%) |
| 18 to 19 Year Olds | 0 (0.0%) | 0 (0.0%) |
| 20 to 24 Year Olds | 0 (0.0%) | 0 (0.0%) |
| 25 to 34 Year Olds | 0 (0.0%) | 0 (0.0%) |
| 35 Years and over | 0 (0.0%) | 0 (0.0%) |
| Total | 0 (0.0%) | 0 (0.0%) |
Educational Attainment by Field of Study in Keyport
Science & technology (39 | 30.5%), engineering (30 | 23.4%), communications (26 | 20.3%), education (12 | 9.4%), and physical & health sciences (11 | 8.6%) are the most common fields of study among 128 individuals in Keyport who have obtained a bachelor's degree or higher.
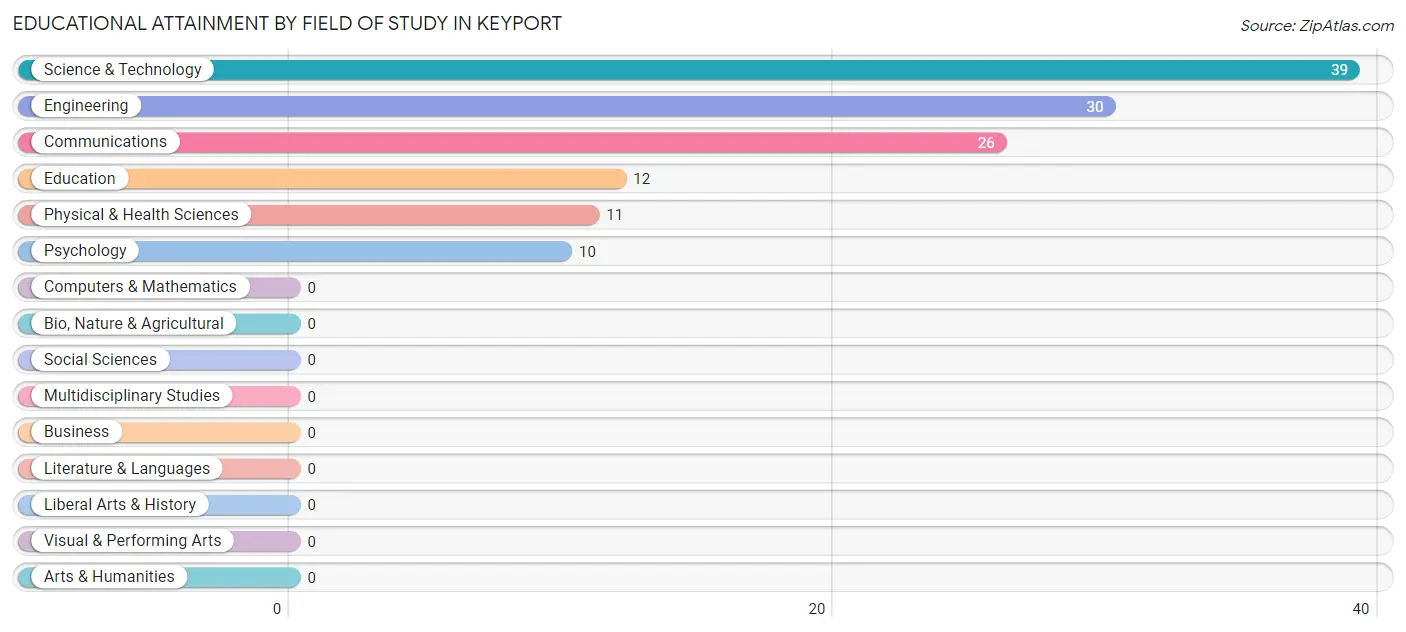
| Field of Study | # Graduates | % Graduates |
| Computers & Mathematics | 0 | 0.0% |
| Bio, Nature & Agricultural | 0 | 0.0% |
| Physical & Health Sciences | 11 | 8.6% |
| Psychology | 10 | 7.8% |
| Social Sciences | 0 | 0.0% |
| Engineering | 30 | 23.4% |
| Multidisciplinary Studies | 0 | 0.0% |
| Science & Technology | 39 | 30.5% |
| Business | 0 | 0.0% |
| Education | 12 | 9.4% |
| Literature & Languages | 0 | 0.0% |
| Liberal Arts & History | 0 | 0.0% |
| Visual & Performing Arts | 0 | 0.0% |
| Communications | 26 | 20.3% |
| Arts & Humanities | 0 | 0.0% |
| Total | 128 | 100.0% |
Transportation & Commute in Keyport
Vehicle Availability by Sex in Keyport
The most prevalent vehicle ownership categories in Keyport are males with 2 vehicles (48, accounting for 58.5%) and females with 2 vehicles (10, making up 73.9%).
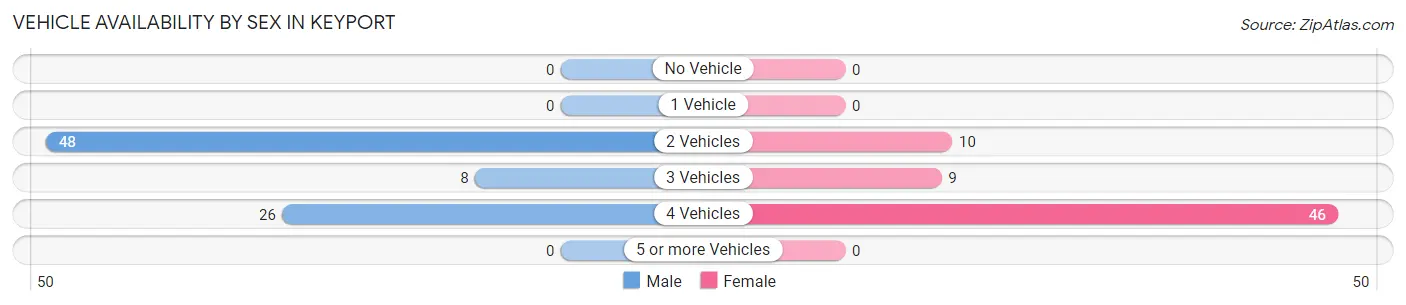
| Vehicles Available | Male | Female |
| No Vehicle | 0 (0.0%) | 0 (0.0%) |
| 1 Vehicle | 0 (0.0%) | 0 (0.0%) |
| 2 Vehicles | 48 (58.5%) | 10 (15.4%) |
| 3 Vehicles | 8 (9.8%) | 9 (13.9%) |
| 4 Vehicles | 26 (31.7%) | 46 (70.8%) |
| 5 or more Vehicles | 0 (0.0%) | 0 (0.0%) |
| Total | 82 (100.0%) | 65 (100.0%) |
Commute Time in Keyport
The most frequently occuring commute durations in Keyport are 30 to 34 minutes (55 commuters, 32.2%), 15 to 19 minutes (35 commuters, 20.5%), and 5 to 9 minutes (28 commuters, 16.4%).
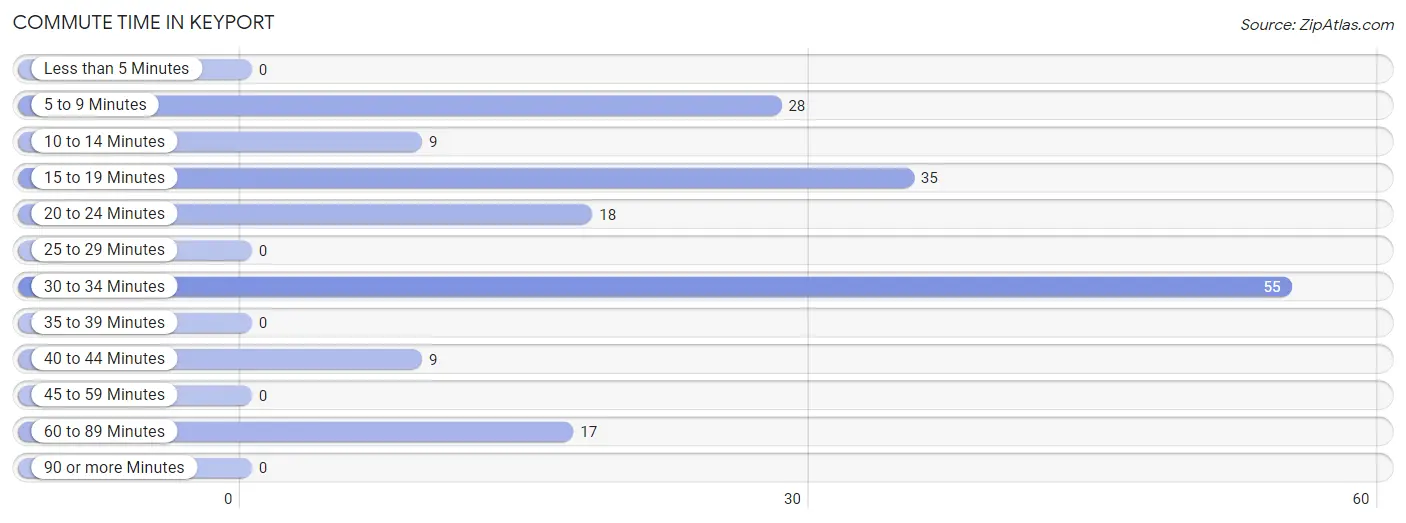
| Commute Time | # Commuters | % Commuters |
| Less than 5 Minutes | 0 | 0.0% |
| 5 to 9 Minutes | 28 | 16.4% |
| 10 to 14 Minutes | 9 | 5.3% |
| 15 to 19 Minutes | 35 | 20.5% |
| 20 to 24 Minutes | 18 | 10.5% |
| 25 to 29 Minutes | 0 | 0.0% |
| 30 to 34 Minutes | 55 | 32.2% |
| 35 to 39 Minutes | 0 | 0.0% |
| 40 to 44 Minutes | 9 | 5.3% |
| 45 to 59 Minutes | 0 | 0.0% |
| 60 to 89 Minutes | 17 | 9.9% |
| 90 or more Minutes | 0 | 0.0% |
Commute Time by Sex in Keyport
The most common commute times in Keyport are 5 to 9 minutes (28 commuters, 28.9%) for males and 30 to 34 minutes (29 commuters, 39.2%) for females.
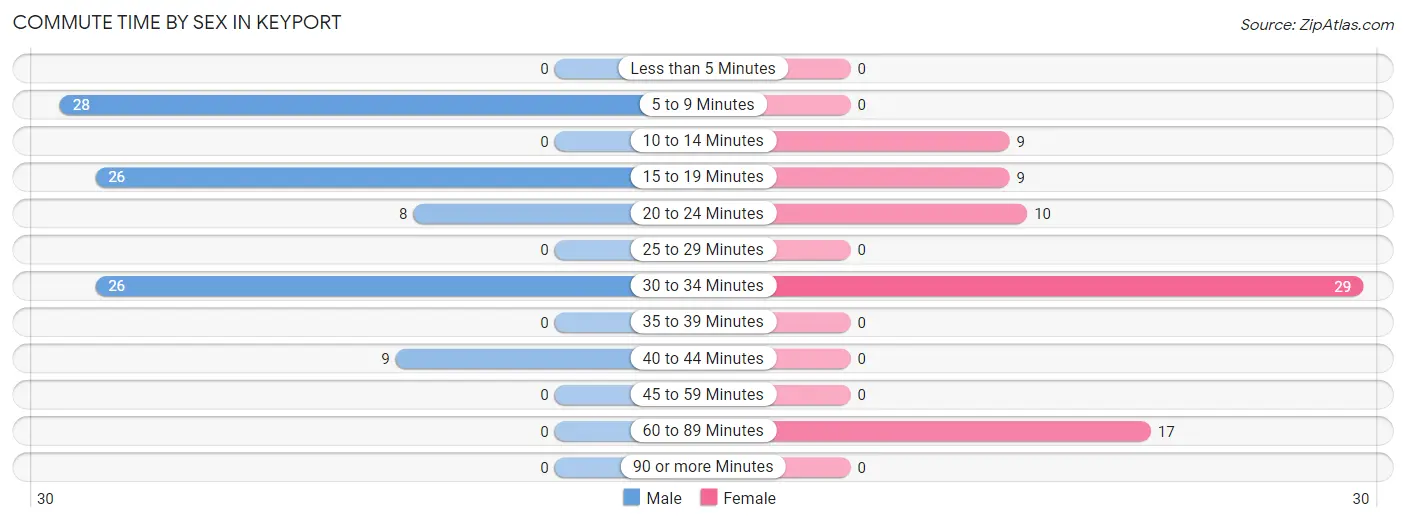
| Commute Time | Male | Female |
| Less than 5 Minutes | 0 (0.0%) | 0 (0.0%) |
| 5 to 9 Minutes | 28 (28.9%) | 0 (0.0%) |
| 10 to 14 Minutes | 0 (0.0%) | 9 (12.2%) |
| 15 to 19 Minutes | 26 (26.8%) | 9 (12.2%) |
| 20 to 24 Minutes | 8 (8.3%) | 10 (13.5%) |
| 25 to 29 Minutes | 0 (0.0%) | 0 (0.0%) |
| 30 to 34 Minutes | 26 (26.8%) | 29 (39.2%) |
| 35 to 39 Minutes | 0 (0.0%) | 0 (0.0%) |
| 40 to 44 Minutes | 9 (9.3%) | 0 (0.0%) |
| 45 to 59 Minutes | 0 (0.0%) | 0 (0.0%) |
| 60 to 89 Minutes | 0 (0.0%) | 17 (23.0%) |
| 90 or more Minutes | 0 (0.0%) | 0 (0.0%) |
Time of Departure to Work by Sex in Keyport
The most frequent times of departure to work in Keyport are 6:30 AM to 6:59 AM (67, 69.1%) for males and 4:00 PM to 11:59 PM (29, 39.2%) for females.
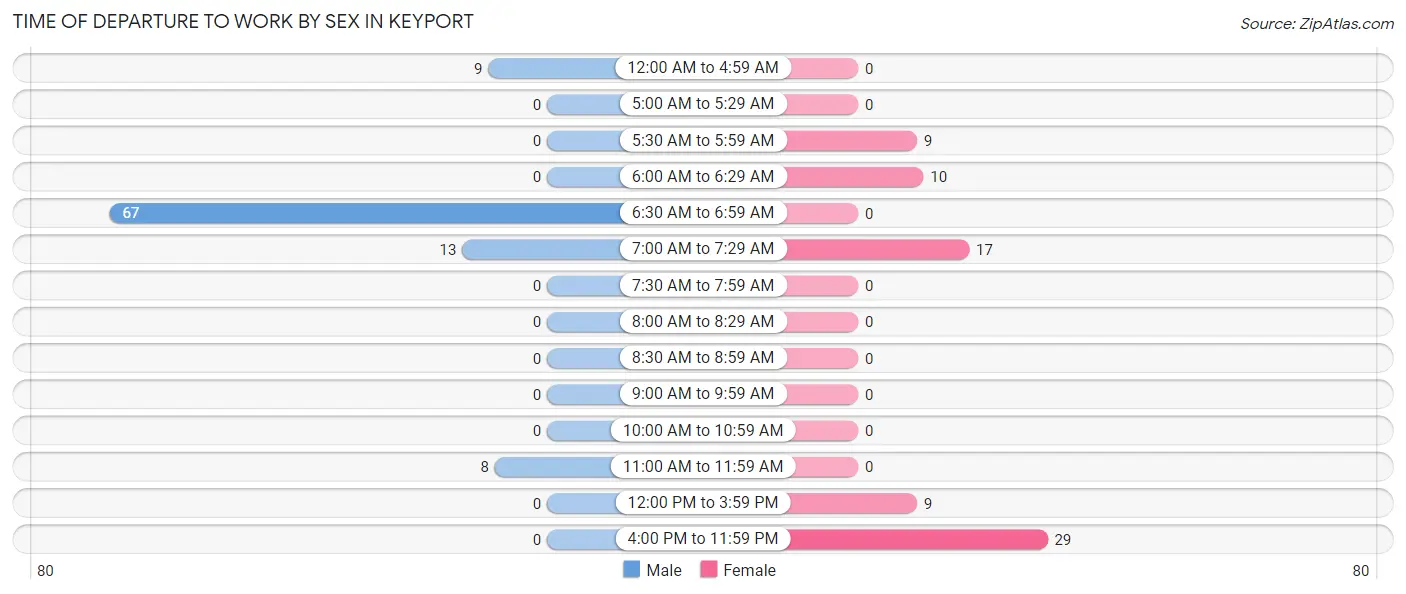
| Time of Departure | Male | Female |
| 12:00 AM to 4:59 AM | 9 (9.3%) | 0 (0.0%) |
| 5:00 AM to 5:29 AM | 0 (0.0%) | 0 (0.0%) |
| 5:30 AM to 5:59 AM | 0 (0.0%) | 9 (12.2%) |
| 6:00 AM to 6:29 AM | 0 (0.0%) | 10 (13.5%) |
| 6:30 AM to 6:59 AM | 67 (69.1%) | 0 (0.0%) |
| 7:00 AM to 7:29 AM | 13 (13.4%) | 17 (23.0%) |
| 7:30 AM to 7:59 AM | 0 (0.0%) | 0 (0.0%) |
| 8:00 AM to 8:29 AM | 0 (0.0%) | 0 (0.0%) |
| 8:30 AM to 8:59 AM | 0 (0.0%) | 0 (0.0%) |
| 9:00 AM to 9:59 AM | 0 (0.0%) | 0 (0.0%) |
| 10:00 AM to 10:59 AM | 0 (0.0%) | 0 (0.0%) |
| 11:00 AM to 11:59 AM | 8 (8.3%) | 0 (0.0%) |
| 12:00 PM to 3:59 PM | 0 (0.0%) | 9 (12.2%) |
| 4:00 PM to 11:59 PM | 0 (0.0%) | 29 (39.2%) |
| Total | 97 (100.0%) | 74 (100.0%) |
Housing Occupancy in Keyport
Occupancy by Ownership in Keyport
Of the total 155 dwellings in Keyport, owner-occupied units account for 73 (47.1%), while renter-occupied units make up 82 (52.9%).
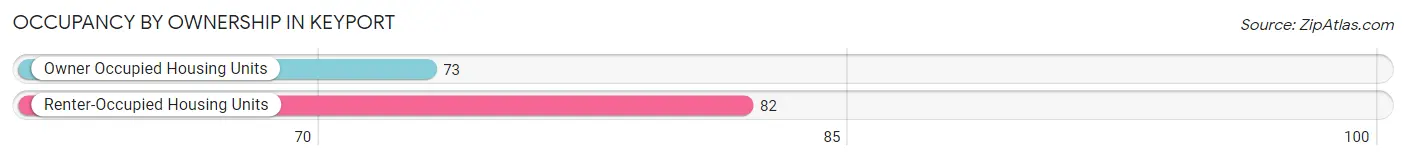
| Occupancy | # Housing Units | % Housing Units |
| Owner Occupied Housing Units | 73 | 47.1% |
| Renter-Occupied Housing Units | 82 | 52.9% |
| Total Occupied Housing Units | 155 | 100.0% |
Occupancy by Household Size in Keyport
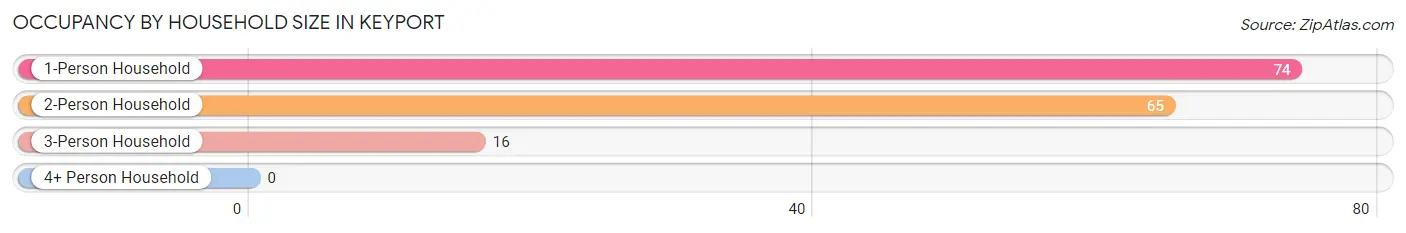
| Household Size | # Housing Units | % Housing Units |
| 1-Person Household | 74 | 47.7% |
| 2-Person Household | 65 | 41.9% |
| 3-Person Household | 16 | 10.3% |
| 4+ Person Household | 0 | 0.0% |
| Total Housing Units | 155 | 100.0% |
Occupancy by Ownership by Household Size in Keyport
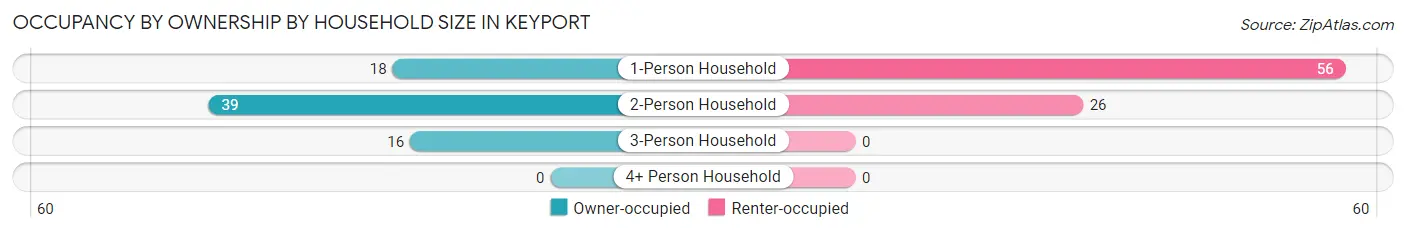
| Household Size | Owner-occupied | Renter-occupied |
| 1-Person Household | 18 (24.3%) | 56 (75.7%) |
| 2-Person Household | 39 (60.0%) | 26 (40.0%) |
| 3-Person Household | 16 (100.0%) | 0 (0.0%) |
| 4+ Person Household | 0 (0.0%) | 0 (0.0%) |
| Total Housing Units | 73 (47.1%) | 82 (52.9%) |
Occupancy by Educational Attainment in Keyport
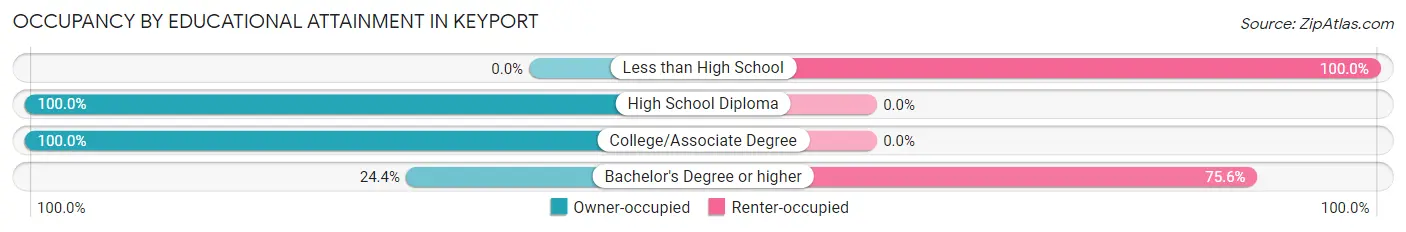
| Household Size | Owner-occupied | Renter-occupied |
| Less than High School | 0 (0.0%) | 17 (100.0%) |
| High School Diploma | 25 (100.0%) | 0 (0.0%) |
| College/Associate Degree | 27 (100.0%) | 0 (0.0%) |
| Bachelor's Degree or higher | 21 (24.4%) | 65 (75.6%) |
Occupancy by Age of Householder in Keyport
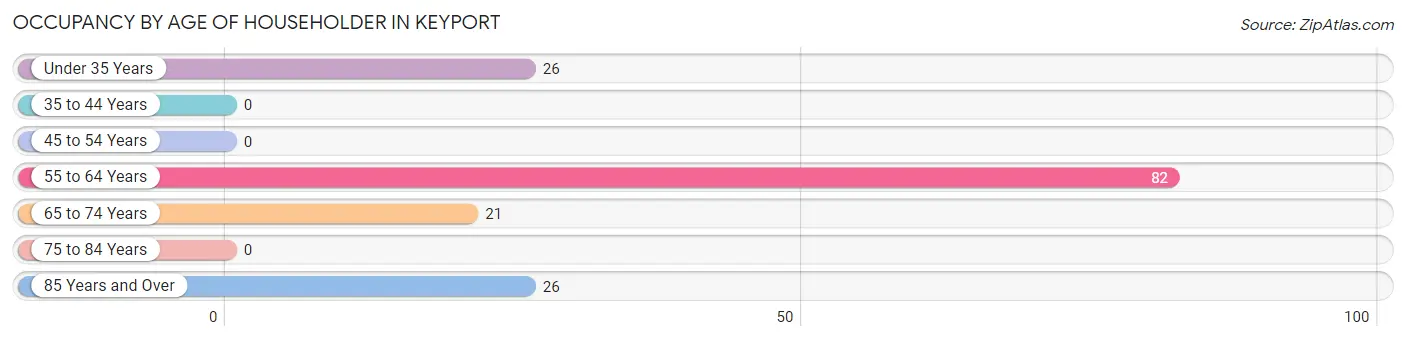
| Age Bracket | # Households | % Households |
| Under 35 Years | 26 | 16.8% |
| 35 to 44 Years | 0 | 0.0% |
| 45 to 54 Years | 0 | 0.0% |
| 55 to 64 Years | 82 | 52.9% |
| 65 to 74 Years | 21 | 13.6% |
| 75 to 84 Years | 0 | 0.0% |
| 85 Years and Over | 26 | 16.8% |
| Total | 155 | 100.0% |
Housing Finances in Keyport
Median Income by Occupancy in Keyport
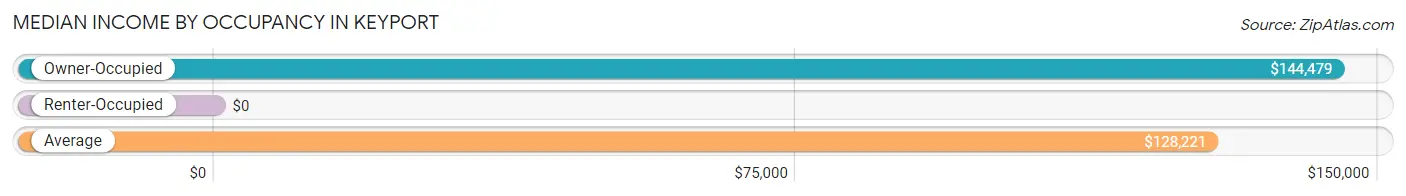
| Occupancy Type | # Households | Median Income |
| Owner-Occupied | 73 (47.1%) | $144,479 |
| Renter-Occupied | 82 (52.9%) | $0 |
| Average | 155 (100.0%) | $128,221 |
Occupancy by Householder Income Bracket in Keyport
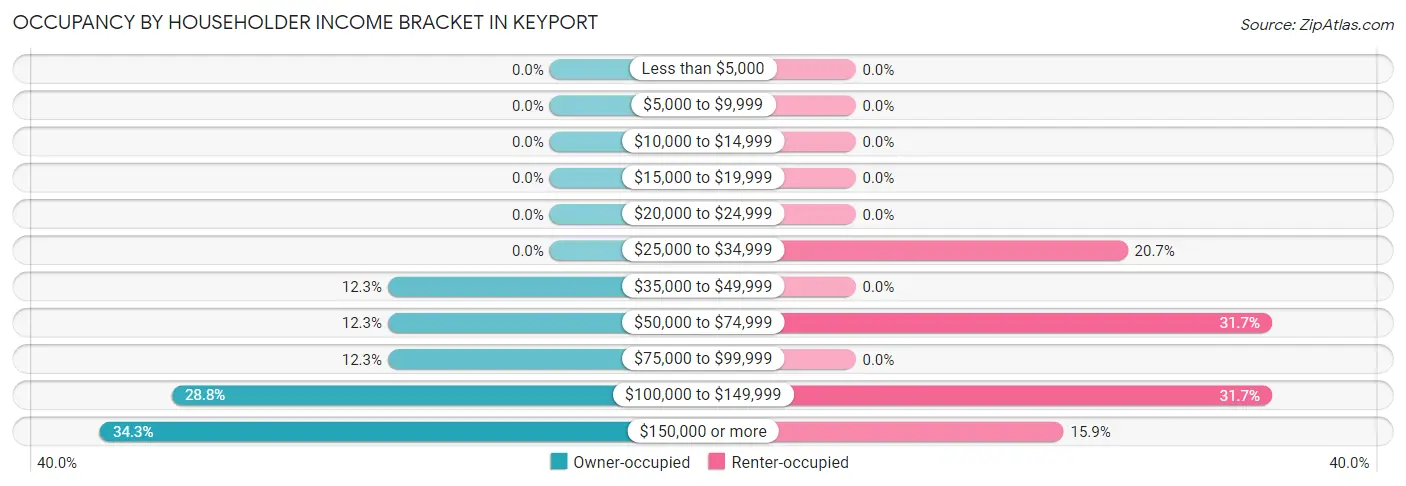
| Income Bracket | Owner-occupied | Renter-occupied |
| Less than $5,000 | 0 (0.0%) | 0 (0.0%) |
| $5,000 to $9,999 | 0 (0.0%) | 0 (0.0%) |
| $10,000 to $14,999 | 0 (0.0%) | 0 (0.0%) |
| $15,000 to $19,999 | 0 (0.0%) | 0 (0.0%) |
| $20,000 to $24,999 | 0 (0.0%) | 0 (0.0%) |
| $25,000 to $34,999 | 0 (0.0%) | 17 (20.7%) |
| $35,000 to $49,999 | 9 (12.3%) | 0 (0.0%) |
| $50,000 to $74,999 | 9 (12.3%) | 26 (31.7%) |
| $75,000 to $99,999 | 9 (12.3%) | 0 (0.0%) |
| $100,000 to $149,999 | 21 (28.8%) | 26 (31.7%) |
| $150,000 or more | 25 (34.3%) | 13 (15.9%) |
| Total | 73 (100.0%) | 82 (100.0%) |
Monthly Housing Cost Tiers in Keyport
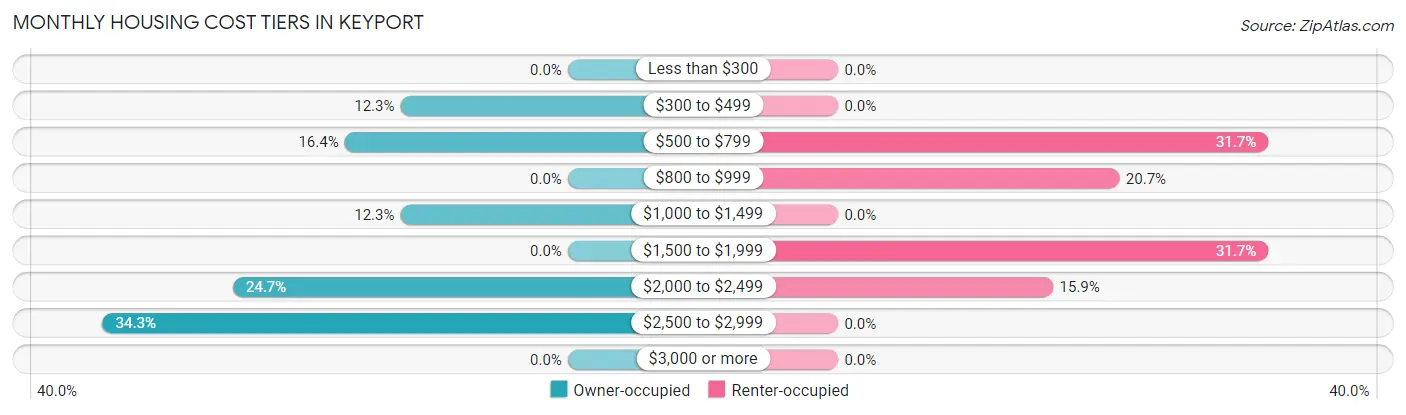
| Monthly Cost | Owner-occupied | Renter-occupied |
| Less than $300 | 0 (0.0%) | 0 (0.0%) |
| $300 to $499 | 9 (12.3%) | 0 (0.0%) |
| $500 to $799 | 12 (16.4%) | 26 (31.7%) |
| $800 to $999 | 0 (0.0%) | 17 (20.7%) |
| $1,000 to $1,499 | 9 (12.3%) | 0 (0.0%) |
| $1,500 to $1,999 | 0 (0.0%) | 26 (31.7%) |
| $2,000 to $2,499 | 18 (24.7%) | 13 (15.9%) |
| $2,500 to $2,999 | 25 (34.3%) | 0 (0.0%) |
| $3,000 or more | 0 (0.0%) | 0 (0.0%) |
| Total | 73 (100.0%) | 82 (100.0%) |
Physical Housing Characteristics in Keyport
Housing Structures in Keyport
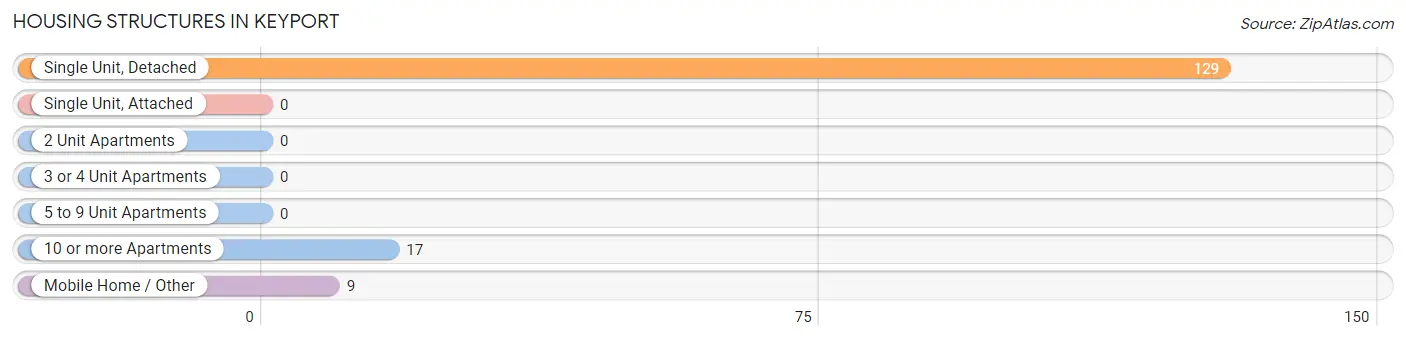
| Structure Type | # Housing Units | % Housing Units |
| Single Unit, Detached | 129 | 83.2% |
| Single Unit, Attached | 0 | 0.0% |
| 2 Unit Apartments | 0 | 0.0% |
| 3 or 4 Unit Apartments | 0 | 0.0% |
| 5 to 9 Unit Apartments | 0 | 0.0% |
| 10 or more Apartments | 17 | 11.0% |
| Mobile Home / Other | 9 | 5.8% |
| Total | 155 | 100.0% |
Housing Structures by Occupancy in Keyport
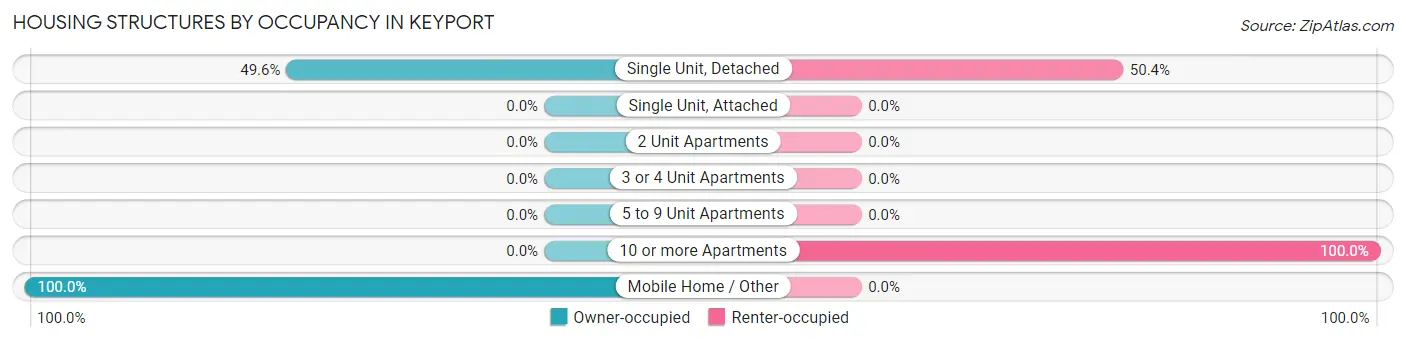
| Structure Type | Owner-occupied | Renter-occupied |
| Single Unit, Detached | 64 (49.6%) | 65 (50.4%) |
| Single Unit, Attached | 0 (0.0%) | 0 (0.0%) |
| 2 Unit Apartments | 0 (0.0%) | 0 (0.0%) |
| 3 or 4 Unit Apartments | 0 (0.0%) | 0 (0.0%) |
| 5 to 9 Unit Apartments | 0 (0.0%) | 0 (0.0%) |
| 10 or more Apartments | 0 (0.0%) | 17 (100.0%) |
| Mobile Home / Other | 9 (100.0%) | 0 (0.0%) |
| Total | 73 (47.1%) | 82 (52.9%) |
Housing Structures by Number of Rooms in Keyport
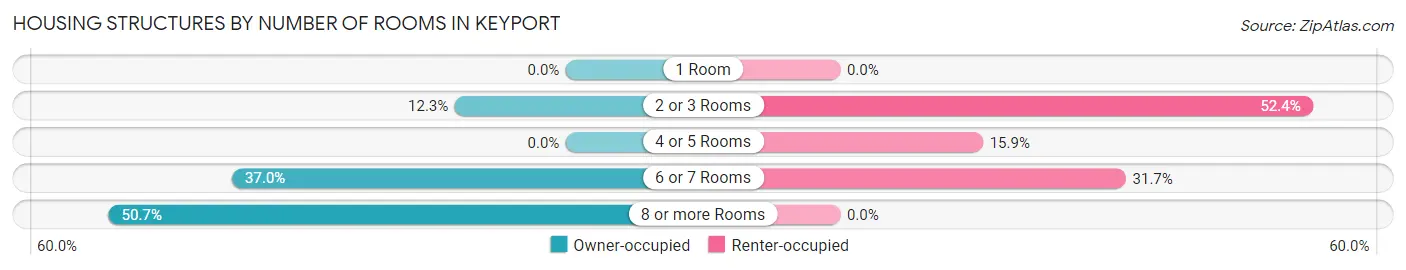
| Number of Rooms | Owner-occupied | Renter-occupied |
| 1 Room | 0 (0.0%) | 0 (0.0%) |
| 2 or 3 Rooms | 9 (12.3%) | 43 (52.4%) |
| 4 or 5 Rooms | 0 (0.0%) | 13 (15.9%) |
| 6 or 7 Rooms | 27 (37.0%) | 26 (31.7%) |
| 8 or more Rooms | 37 (50.7%) | 0 (0.0%) |
| Total | 73 (100.0%) | 82 (100.0%) |
Housing Structure by Heating Type in Keyport
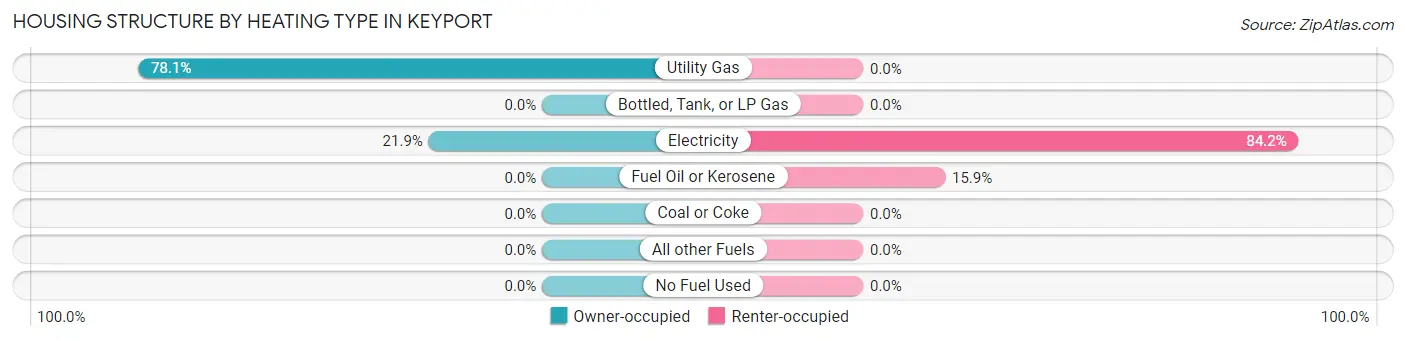
| Heating Type | Owner-occupied | Renter-occupied |
| Utility Gas | 57 (78.1%) | 0 (0.0%) |
| Bottled, Tank, or LP Gas | 0 (0.0%) | 0 (0.0%) |
| Electricity | 16 (21.9%) | 69 (84.2%) |
| Fuel Oil or Kerosene | 0 (0.0%) | 13 (15.9%) |
| Coal or Coke | 0 (0.0%) | 0 (0.0%) |
| All other Fuels | 0 (0.0%) | 0 (0.0%) |
| No Fuel Used | 0 (0.0%) | 0 (0.0%) |
| Total | 73 (100.0%) | 82 (100.0%) |
Household Vehicle Usage in Keyport
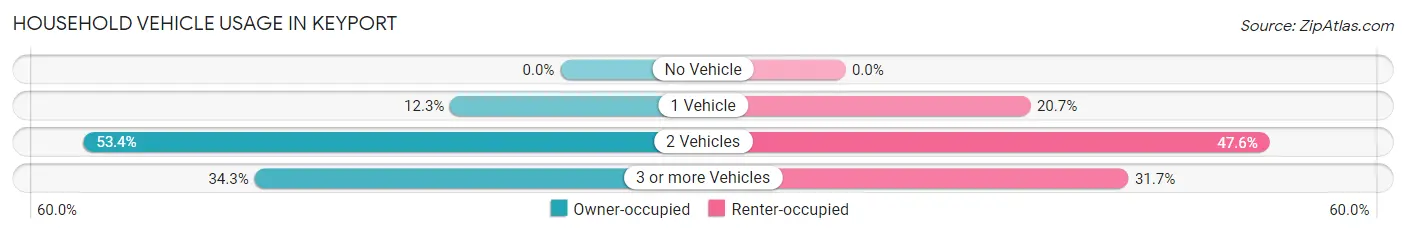
| Vehicles per Household | Owner-occupied | Renter-occupied |
| No Vehicle | 0 (0.0%) | 0 (0.0%) |
| 1 Vehicle | 9 (12.3%) | 17 (20.7%) |
| 2 Vehicles | 39 (53.4%) | 39 (47.6%) |
| 3 or more Vehicles | 25 (34.3%) | 26 (31.7%) |
| Total | 73 (100.0%) | 82 (100.0%) |
Real Estate & Mortgages in Keyport
Real Estate and Mortgage Overview in Keyport
| Characteristic | Without Mortgage | With Mortgage |
| Housing Units | 30 | 43 |
| Median Property Value | $625,000 | $591,900 |
| Median Household Income | - | - |
| Monthly Housing Costs | $750 | $0 |
| Real Estate Taxes | $4,500 | $0 |
Property Value by Mortgage Status in Keyport
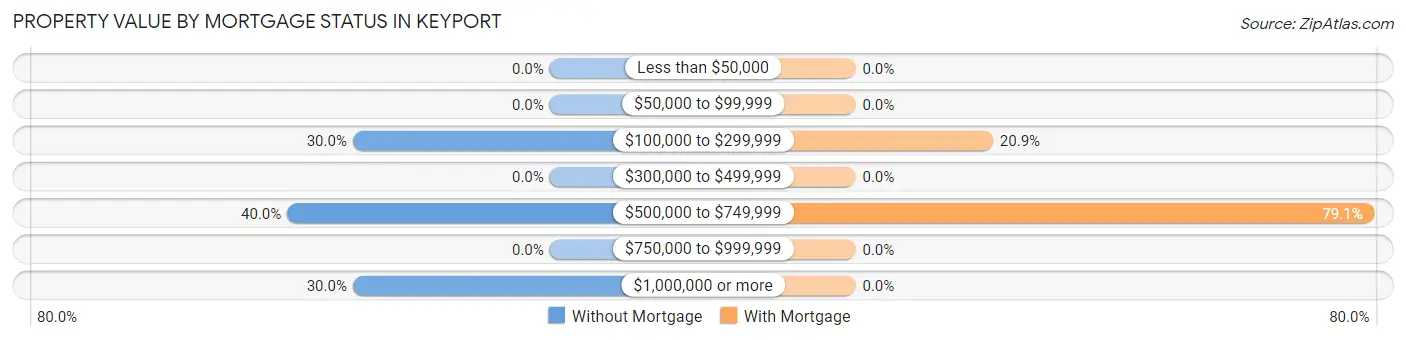
| Property Value | Without Mortgage | With Mortgage |
| Less than $50,000 | 0 (0.0%) | 0 (0.0%) |
| $50,000 to $99,999 | 0 (0.0%) | 0 (0.0%) |
| $100,000 to $299,999 | 9 (30.0%) | 9 (20.9%) |
| $300,000 to $499,999 | 0 (0.0%) | 0 (0.0%) |
| $500,000 to $749,999 | 12 (40.0%) | 34 (79.1%) |
| $750,000 to $999,999 | 0 (0.0%) | 0 (0.0%) |
| $1,000,000 or more | 9 (30.0%) | 0 (0.0%) |
| Total | 30 (100.0%) | 43 (100.0%) |
Household Income by Mortgage Status in Keyport
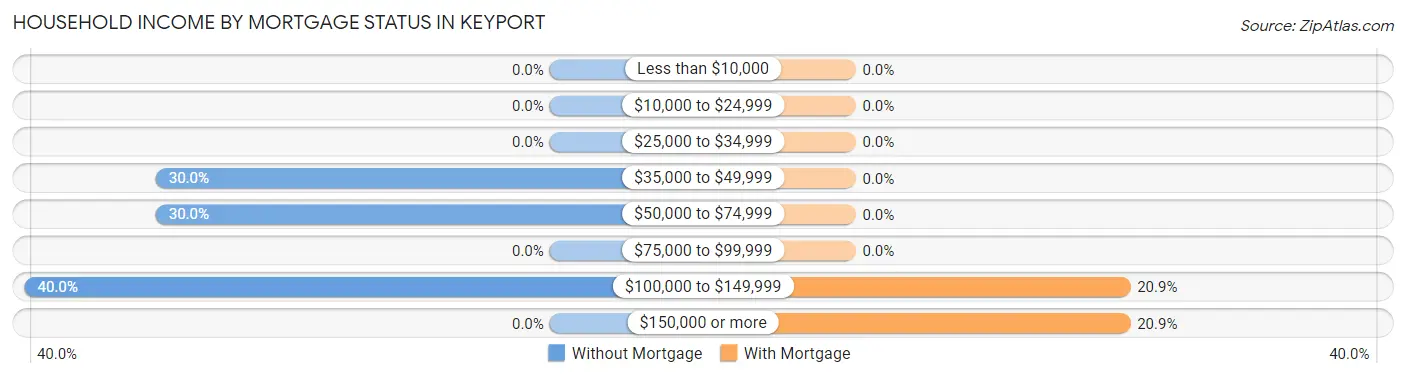
| Household Income | Without Mortgage | With Mortgage |
| Less than $10,000 | 0 (0.0%) | 0 (0.0%) |
| $10,000 to $24,999 | 0 (0.0%) | 0 (0.0%) |
| $25,000 to $34,999 | 0 (0.0%) | 0 (0.0%) |
| $35,000 to $49,999 | 9 (30.0%) | 0 (0.0%) |
| $50,000 to $74,999 | 9 (30.0%) | 0 (0.0%) |
| $75,000 to $99,999 | 0 (0.0%) | 0 (0.0%) |
| $100,000 to $149,999 | 12 (40.0%) | 9 (20.9%) |
| $150,000 or more | 0 (0.0%) | 9 (20.9%) |
| Total | 30 (100.0%) | 43 (100.0%) |
Property Value to Household Income Ratio in Keyport
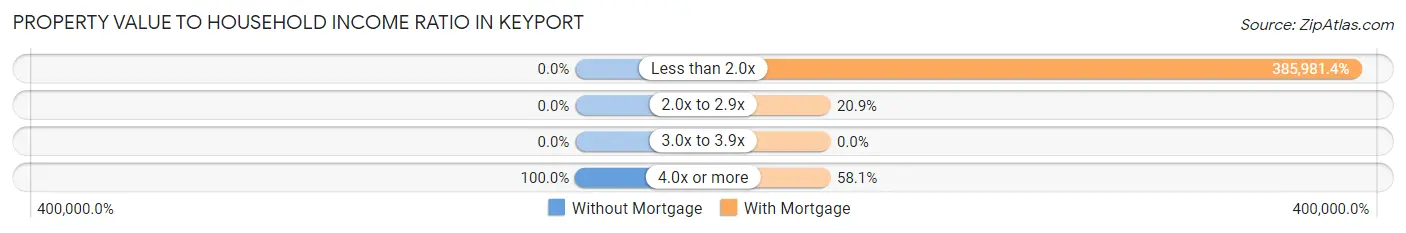
| Value-to-Income Ratio | Without Mortgage | With Mortgage |
| Less than 2.0x | 0 (0.0%) | 165,972 (385,981.4%) |
| 2.0x to 2.9x | 0 (0.0%) | 9 (20.9%) |
| 3.0x to 3.9x | 0 (0.0%) | 0 (0.0%) |
| 4.0x or more | 30 (100.0%) | 25 (58.1%) |
| Total | 30 (100.0%) | 43 (100.0%) |
Real Estate Taxes by Mortgage Status in Keyport
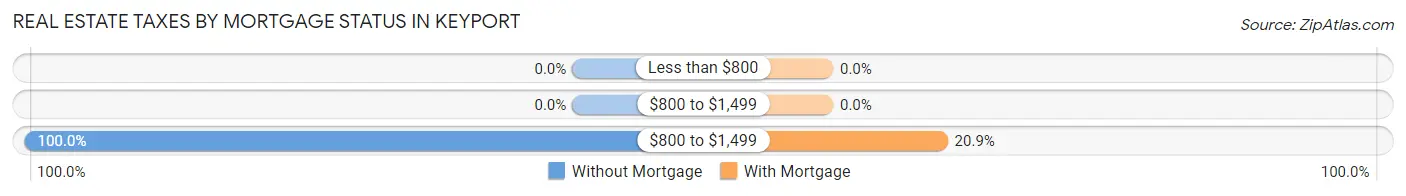
| Property Taxes | Without Mortgage | With Mortgage |
| Less than $800 | 0 (0.0%) | 0 (0.0%) |
| $800 to $1,499 | 0 (0.0%) | 0 (0.0%) |
| $800 to $1,499 | 30 (100.0%) | 9 (20.9%) |
| Total | 30 (100.0%) | 43 (100.0%) |
Health & Disability in Keyport
Health Insurance Coverage by Age in Keyport
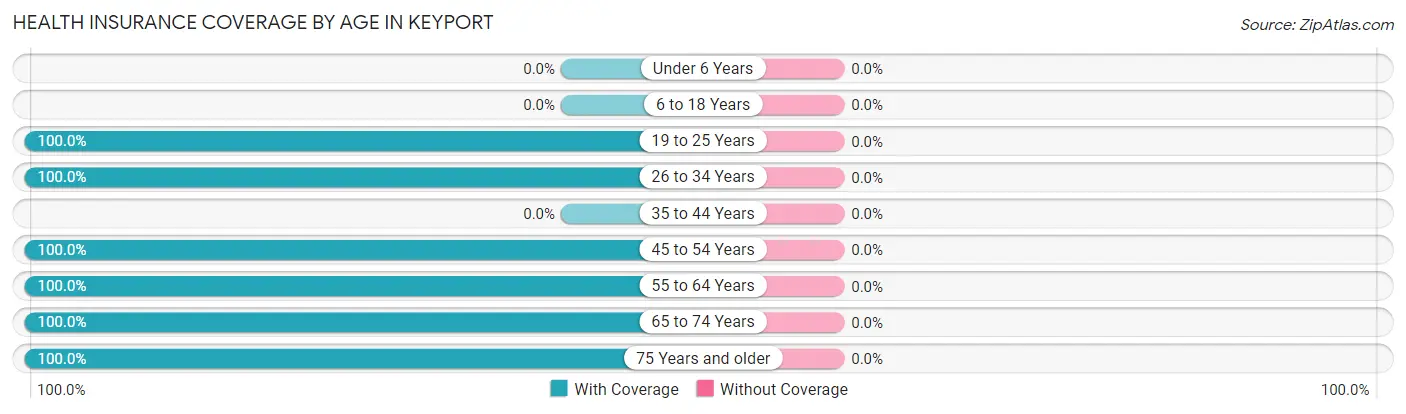
| Age Bracket | With Coverage | Without Coverage |
| Under 6 Years | 0 (0.0%) | 0 (0.0%) |
| 6 to 18 Years | 0 (0.0%) | 0 (0.0%) |
| 19 to 25 Years | 29 (100.0%) | 0 (0.0%) |
| 26 to 34 Years | 20 (100.0%) | 0 (0.0%) |
| 35 to 44 Years | 0 (0.0%) | 0 (0.0%) |
| 45 to 54 Years | 17 (100.0%) | 0 (0.0%) |
| 55 to 64 Years | 110 (100.0%) | 0 (0.0%) |
| 65 to 74 Years | 32 (100.0%) | 0 (0.0%) |
| 75 Years and older | 26 (100.0%) | 0 (0.0%) |
| Total | 234 (100.0%) | 0 (0.0%) |
Health Insurance Coverage by Citizenship Status in Keyport
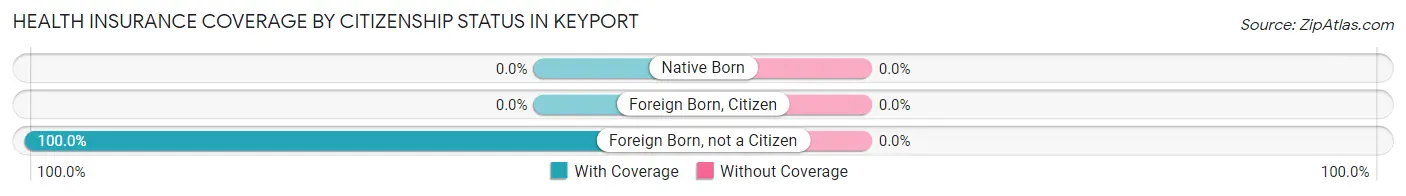
| Citizenship Status | With Coverage | Without Coverage |
| Native Born | 0 (0.0%) | 0 (0.0%) |
| Foreign Born, Citizen | 0 (0.0%) | 0 (0.0%) |
| Foreign Born, not a Citizen | 29 (100.0%) | 0 (0.0%) |
Health Insurance Coverage by Household Income in Keyport
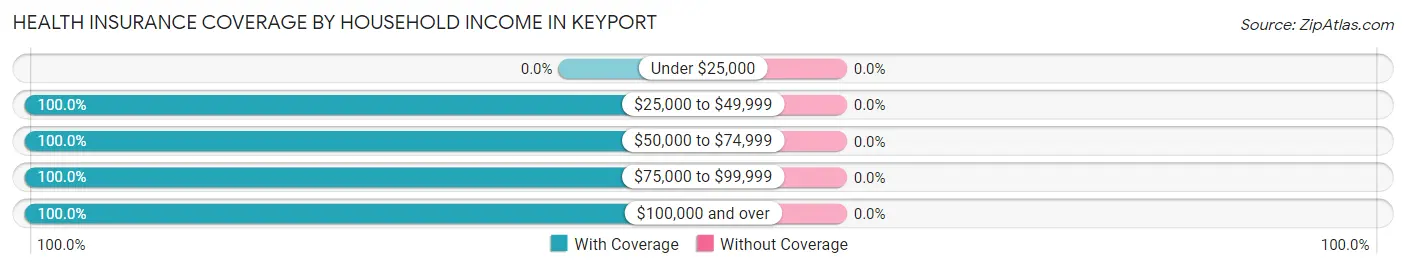
| Household Income | With Coverage | Without Coverage |
| Under $25,000 | 0 (0.0%) | 0 (0.0%) |
| $25,000 to $49,999 | 26 (100.0%) | 0 (0.0%) |
| $50,000 to $74,999 | 35 (100.0%) | 0 (0.0%) |
| $75,000 to $99,999 | 19 (100.0%) | 0 (0.0%) |
| $100,000 and over | 154 (100.0%) | 0 (0.0%) |
Public vs Private Health Insurance Coverage by Age in Keyport
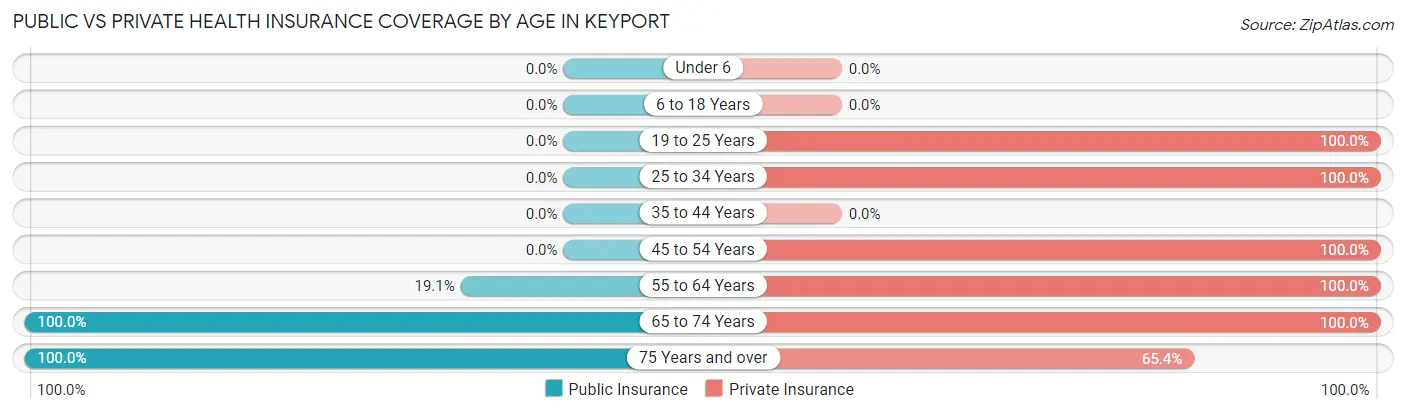
| Age Bracket | Public Insurance | Private Insurance |
| Under 6 | 0 (0.0%) | 0 (0.0%) |
| 6 to 18 Years | 0 (0.0%) | 0 (0.0%) |
| 19 to 25 Years | 0 (0.0%) | 29 (100.0%) |
| 25 to 34 Years | 0 (0.0%) | 20 (100.0%) |
| 35 to 44 Years | 0 (0.0%) | 0 (0.0%) |
| 45 to 54 Years | 0 (0.0%) | 17 (100.0%) |
| 55 to 64 Years | 21 (19.1%) | 110 (100.0%) |
| 65 to 74 Years | 32 (100.0%) | 32 (100.0%) |
| 75 Years and over | 26 (100.0%) | 17 (65.4%) |
| Total | 79 (33.8%) | 225 (96.2%) |
Disability Status by Sex by Age in Keyport
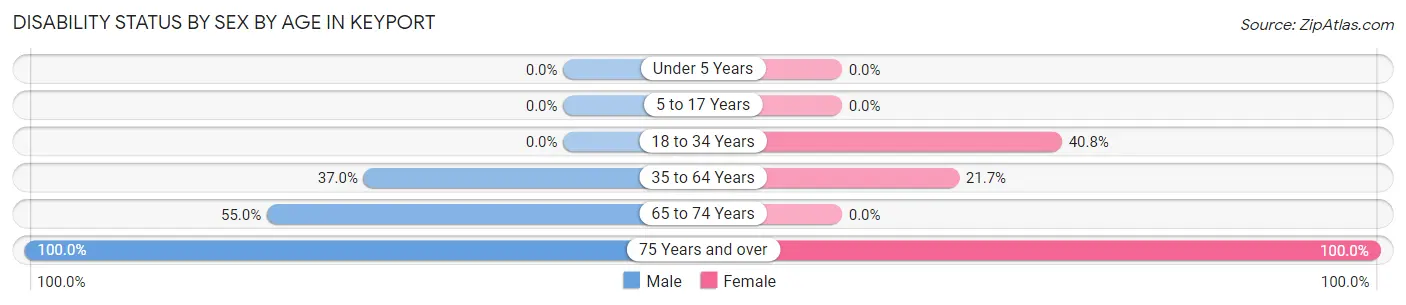
| Age Bracket | Male | Female |
| Under 5 Years | 0 (0.0%) | 0 (0.0%) |
| 5 to 17 Years | 0 (0.0%) | 0 (0.0%) |
| 18 to 34 Years | 0 (0.0%) | 20 (40.8%) |
| 35 to 64 Years | 30 (37.0%) | 10 (21.7%) |
| 65 to 74 Years | 11 (55.0%) | 0 (0.0%) |
| 75 Years and over | 17 (100.0%) | 9 (100.0%) |
Disability Class by Sex by Age in Keyport
Disability Class: Hearing Difficulty
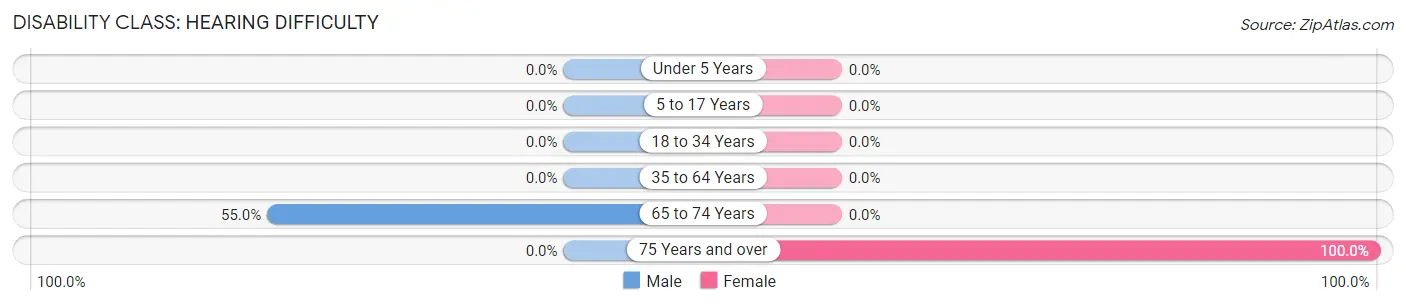
| Age Bracket | Male | Female |
| Under 5 Years | 0 (0.0%) | 0 (0.0%) |
| 5 to 17 Years | 0 (0.0%) | 0 (0.0%) |
| 18 to 34 Years | 0 (0.0%) | 0 (0.0%) |
| 35 to 64 Years | 0 (0.0%) | 0 (0.0%) |
| 65 to 74 Years | 11 (55.0%) | 0 (0.0%) |
| 75 Years and over | 0 (0.0%) | 9 (100.0%) |
Disability Class: Vision Difficulty
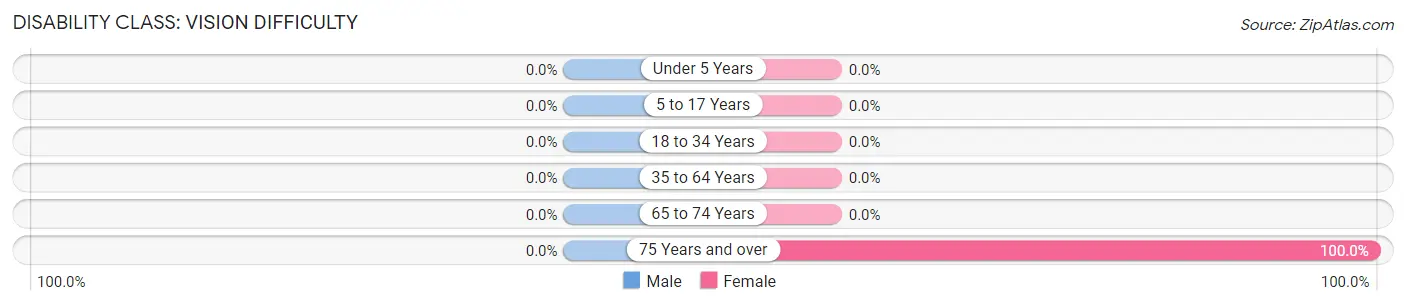
| Age Bracket | Male | Female |
| Under 5 Years | 0 (0.0%) | 0 (0.0%) |
| 5 to 17 Years | 0 (0.0%) | 0 (0.0%) |
| 18 to 34 Years | 0 (0.0%) | 0 (0.0%) |
| 35 to 64 Years | 0 (0.0%) | 0 (0.0%) |
| 65 to 74 Years | 0 (0.0%) | 0 (0.0%) |
| 75 Years and over | 0 (0.0%) | 9 (100.0%) |
Disability Class: Cognitive Difficulty
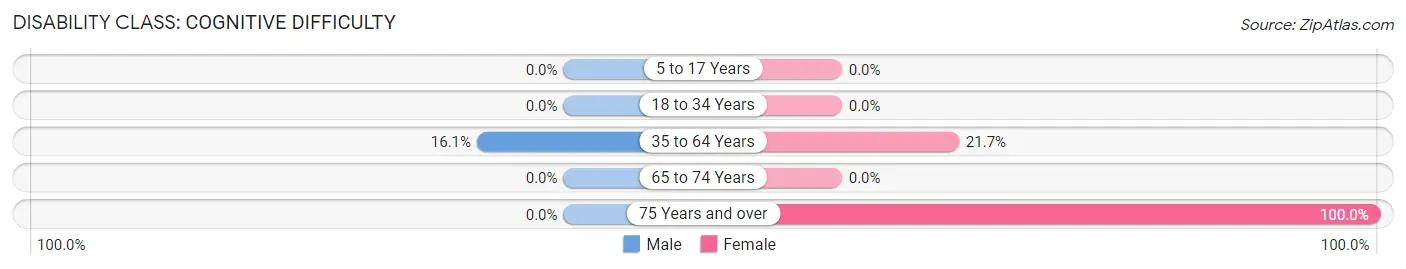
| Age Bracket | Male | Female |
| 5 to 17 Years | 0 (0.0%) | 0 (0.0%) |
| 18 to 34 Years | 0 (0.0%) | 0 (0.0%) |
| 35 to 64 Years | 13 (16.1%) | 10 (21.7%) |
| 65 to 74 Years | 0 (0.0%) | 0 (0.0%) |
| 75 Years and over | 0 (0.0%) | 9 (100.0%) |
Disability Class: Ambulatory Difficulty
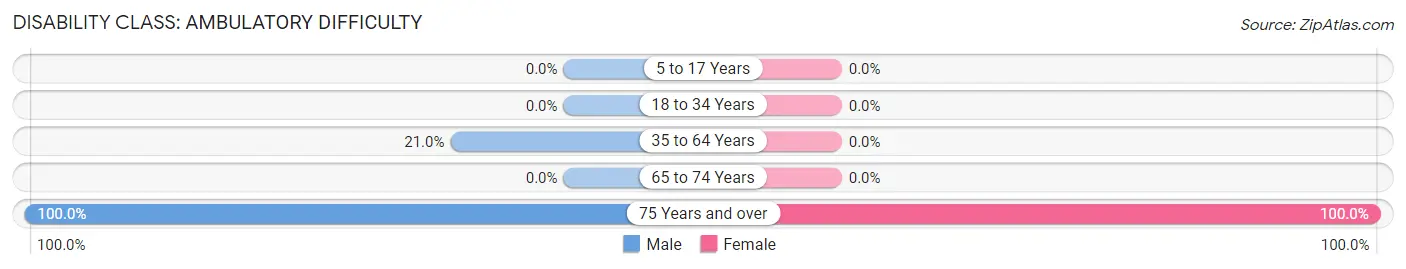
| Age Bracket | Male | Female |
| 5 to 17 Years | 0 (0.0%) | 0 (0.0%) |
| 18 to 34 Years | 0 (0.0%) | 0 (0.0%) |
| 35 to 64 Years | 17 (21.0%) | 0 (0.0%) |
| 65 to 74 Years | 0 (0.0%) | 0 (0.0%) |
| 75 Years and over | 17 (100.0%) | 9 (100.0%) |
Disability Class: Self-Care Difficulty
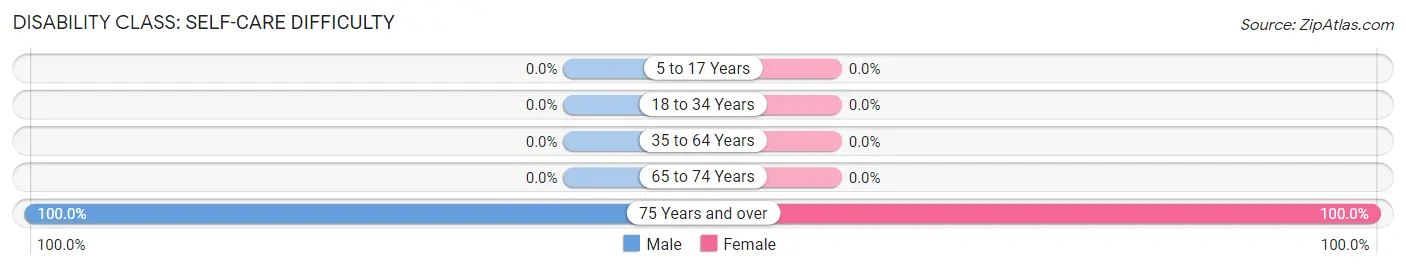
| Age Bracket | Male | Female |
| 5 to 17 Years | 0 (0.0%) | 0 (0.0%) |
| 18 to 34 Years | 0 (0.0%) | 0 (0.0%) |
| 35 to 64 Years | 0 (0.0%) | 0 (0.0%) |
| 65 to 74 Years | 0 (0.0%) | 0 (0.0%) |
| 75 Years and over | 17 (100.0%) | 9 (100.0%) |
Technology Access in Keyport
Computing Device Access in Keyport
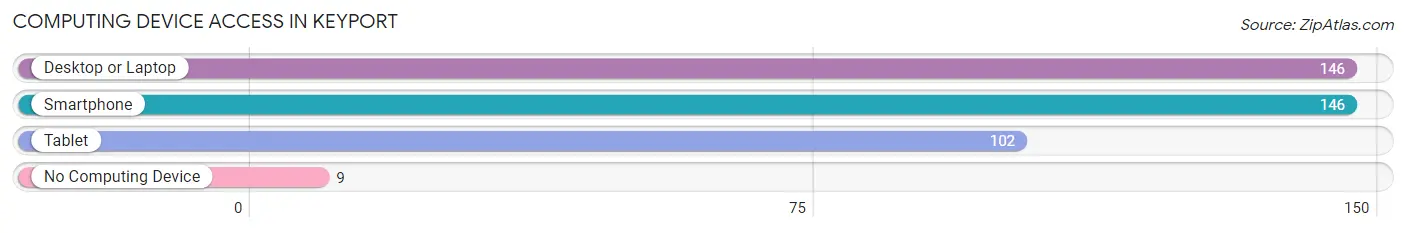
| Device Type | # Households | % Households |
| Desktop or Laptop | 146 | 94.2% |
| Smartphone | 146 | 94.2% |
| Tablet | 102 | 65.8% |
| No Computing Device | 9 | 5.8% |
| Total | 155 | 100.0% |
Internet Access in Keyport
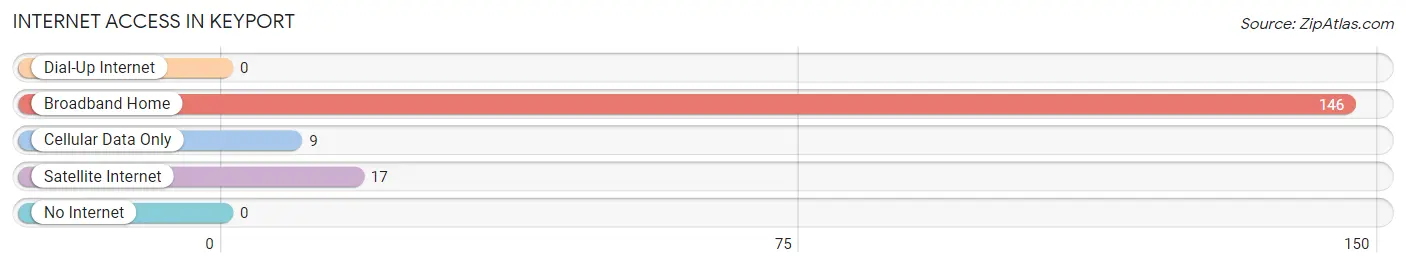
| Internet Type | # Households | % Households |
| Dial-Up Internet | 0 | 0.0% |
| Broadband Home | 146 | 94.2% |
| Cellular Data Only | 9 | 5.8% |
| Satellite Internet | 17 | 11.0% |
| No Internet | 0 | 0.0% |
| Total | 155 | 100.0% |
Keyport Summary
Keyport is a small unincorporated community located in Kitsap County, Washington, United States. It is situated on the Kitsap Peninsula, approximately 25 miles northwest of Seattle. The population of Keyport was 1,717 at the 2010 census.
History
Keyport was first settled in the late 1800s by a group of Scandinavian immigrants. The town was originally called “Key’s Port” after the first settler, John Key. The name was later shortened to Keyport.
In the early 1900s, Keyport was a thriving fishing and logging community. The town was home to several canneries, a sawmill, and a shipyard. The shipyard was responsible for building several vessels, including the USS Keyport, which was launched in 1918.
In the 1950s, Keyport began to experience a decline in its economy. The canneries and sawmill closed, and the shipyard was sold. The town’s population began to decline as well, and by the 1970s, Keyport was a virtual ghost town.
In the 1980s, Keyport began to experience a resurgence. The town was designated as a “Maritime Heritage Area” by the state of Washington, and the Keyport Maritime Museum was established. The museum is dedicated to preserving the town’s maritime history and is open to the public.
Geography
Keyport is located on the Kitsap Peninsula, approximately 25 miles northwest of Seattle. The town is situated on the shores of Liberty Bay, which is part of the Puget Sound. The town is surrounded by the Olympic Mountains to the west and the Cascade Mountains to the east.
The climate in Keyport is mild and temperate. The average high temperature in the summer is around 70 degrees Fahrenheit, and the average low temperature in the winter is around 40 degrees Fahrenheit.
Economy
Keyport’s economy is largely based on tourism and fishing. The town is home to several marinas, which attract visitors from all over the world. The town is also home to several seafood restaurants, which serve fresh seafood caught in the nearby waters.
The town is also home to several small businesses, including a grocery store, a hardware store, and a few gift shops.
Demographics
As of the 2010 census, the population of Keyport was 1,717. The racial makeup of the town was 94.3% White, 0.7% African American, 0.7% Native American, 0.7% Asian, 0.2% Pacific Islander, and 2.6% from other races.
The median household income in Keyport was $50,938, and the median family income was $60,938. The per capita income was $25,938.
Conclusion
Keyport is a small unincorporated community located in Kitsap County, Washington. It is situated on the shores of Liberty Bay, and is surrounded by the Olympic Mountains to the west and the Cascade Mountains to the east. The town’s economy is largely based on tourism and fishing, and the population of Keyport was 1,717 at the 2010 census. Keyport is a unique and vibrant community that is dedicated to preserving its maritime history and culture.
Common Questions
What is Per Capita Income in Keyport?
Per Capita income in Keyport is $63,531.
What is the Median Family Income in Keyport?
Median Family Income in Keyport is $143,646.
What is the Median Household income in Keyport?
Median Household Income in Keyport is $128,221.
What is Income or Wage Gap in Keyport?
Income or Wage Gap in Keyport is 19.4%.
Women in Keyport earn 80.6 cents for every dollar earned by a man.
What is Inequality or Gini Index in Keyport?
Inequality or Gini Index in Keyport is 0.30.
What is the Total Population of Keyport?
Total Population of Keyport is 284.
What is the Total Male Population of Keyport?
Total Male Population of Keyport is 159.
What is the Total Female Population of Keyport?
Total Female Population of Keyport is 125.
What is the Ratio of Males per 100 Females in Keyport?
There are 127.20 Males per 100 Females in Keyport.
What is the Ratio of Females per 100 Males in Keyport?
There are 78.62 Females per 100 Males in Keyport.
What is the Median Population Age in Keyport?
Median Population Age in Keyport is 57.0 Years.
What is the Average Family Size in Keyport
Average Family Size in Keyport is 2.0 People.
What is the Average Household Size in Keyport
Average Household Size in Keyport is 1.7 People.
How Large is the Labor Force in Keyport?
There are 187 People in the Labor Forcein in Keyport.
What is the Percentage of People in the Labor Force in Keyport?
65.8% of People are in the Labor Force in Keyport.