Inchelium, WA Map & Demographics
Inchelium Map
Inchelium Overview
$31,517
PER CAPITA INCOME
$82,083
AVG FAMILY INCOME
$59,375
AVG HOUSEHOLD INCOME
0.42
INEQUALITY / GINI INDEX
338
TOTAL POPULATION
188
MALE POPULATION
150
FEMALE POPULATION
125.33
MALES / 100 FEMALES
79.79
FEMALES / 100 MALES
40.6
MEDIAN AGE
3.4
AVG FAMILY SIZE
2.8
AVG HOUSEHOLD SIZE
179
LABOR FORCE [ PEOPLE ]
65.1%
PERCENT IN LABOR FORCE
12.8%
UNEMPLOYMENT RATE
Inchelium Zip Codes
Inchelium Area Codes
Income in Inchelium
Income Overview in Inchelium
Per Capita Income in Inchelium is $31,517, while median incomes of families and households are $82,083 and $59,375 respectively.
| Characteristic | Number | Measure |
| Per Capita Income | 338 | $31,517 |
| Median Family Income | 83 | $82,083 |
| Mean Family Income | 83 | $86,531 |
| Median Household Income | 120 | $59,375 |
| Mean Household Income | 120 | $71,159 |
| Income Deficit | 83 | $0 |
| Wage / Income Gap (%) | 338 | 0.00% |
| Wage / Income Gap ($) | 338 | 100.00¢ per $1 |
| Gini / Inequality Index | 338 | 0.42 |
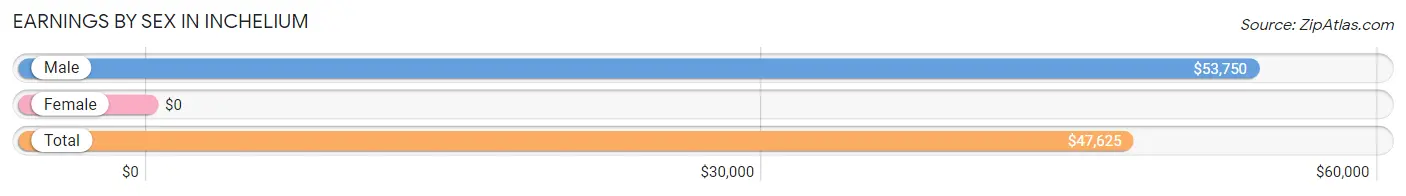
Earnings by Sex in Inchelium
| Sex | Number | Average Earnings |
| Male | 130 (62.8%) | $53,750 |
| Female | 77 (37.2%) | $0 |
| Total | 207 (100.0%) | $47,625 |
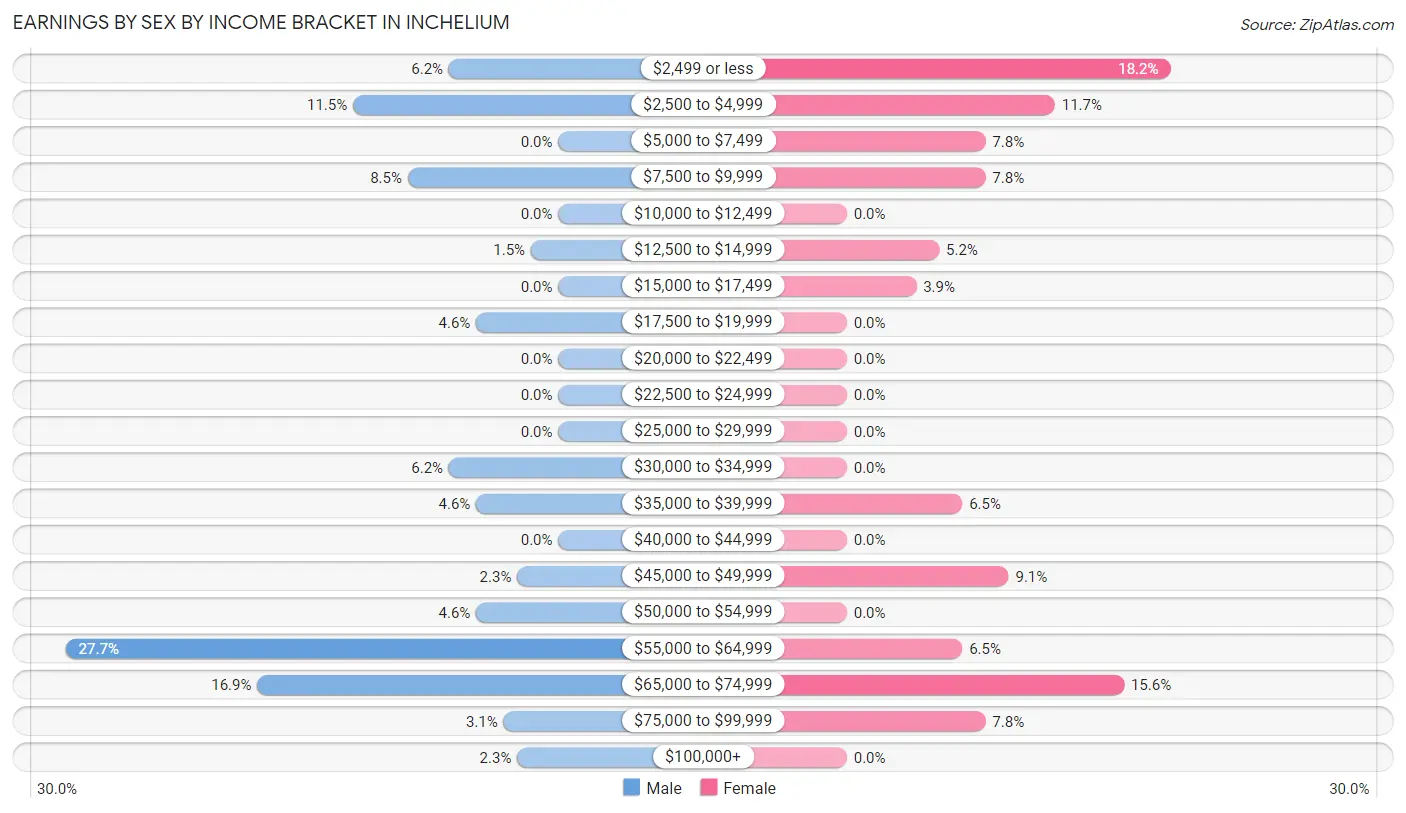
Earnings by Sex by Income Bracket in Inchelium
The most common earnings brackets in Inchelium are $55,000 to $64,999 for men (36 | 27.7%) and $2,499 or less for women (14 | 18.2%).
| Income | Male | Female |
| $2,499 or less | 8 (6.1%) | 14 (18.2%) |
| $2,500 to $4,999 | 15 (11.5%) | 9 (11.7%) |
| $5,000 to $7,499 | 0 (0.0%) | 6 (7.8%) |
| $7,500 to $9,999 | 11 (8.5%) | 6 (7.8%) |
| $10,000 to $12,499 | 0 (0.0%) | 0 (0.0%) |
| $12,500 to $14,999 | 2 (1.5%) | 4 (5.2%) |
| $15,000 to $17,499 | 0 (0.0%) | 3 (3.9%) |
| $17,500 to $19,999 | 6 (4.6%) | 0 (0.0%) |
| $20,000 to $22,499 | 0 (0.0%) | 0 (0.0%) |
| $22,500 to $24,999 | 0 (0.0%) | 0 (0.0%) |
| $25,000 to $29,999 | 0 (0.0%) | 0 (0.0%) |
| $30,000 to $34,999 | 8 (6.1%) | 0 (0.0%) |
| $35,000 to $39,999 | 6 (4.6%) | 5 (6.5%) |
| $40,000 to $44,999 | 0 (0.0%) | 0 (0.0%) |
| $45,000 to $49,999 | 3 (2.3%) | 7 (9.1%) |
| $50,000 to $54,999 | 6 (4.6%) | 0 (0.0%) |
| $55,000 to $64,999 | 36 (27.7%) | 5 (6.5%) |
| $65,000 to $74,999 | 22 (16.9%) | 12 (15.6%) |
| $75,000 to $99,999 | 4 (3.1%) | 6 (7.8%) |
| $100,000+ | 3 (2.3%) | 0 (0.0%) |
| Total | 130 (100.0%) | 77 (100.0%) |
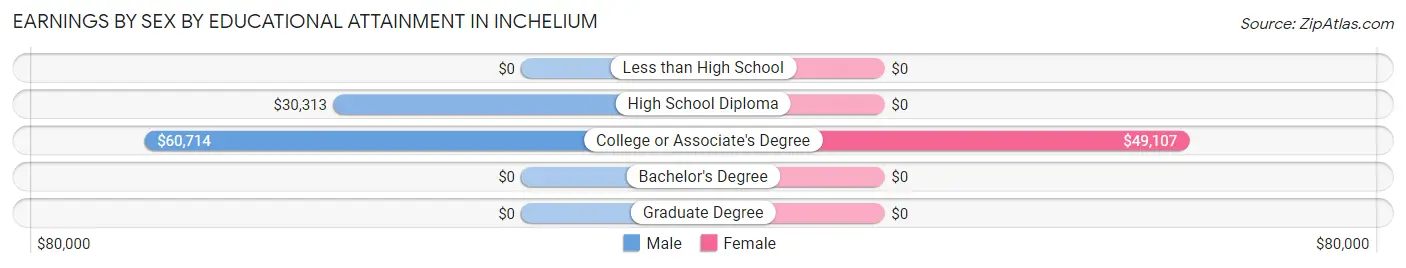
Earnings by Sex by Educational Attainment in Inchelium
Average earnings in Inchelium are $60,357 for men and $48,750 for women, a difference of 19.2%. Men with an educational attainment of college or associate's degree enjoy the highest average annual earnings of $60,714, while those with high school diploma education earn the least with $30,313. Women with an educational attainment of college or associate's degree earn the most with the average annual earnings of $49,107, while those with college or associate's degree education have the smallest earnings of $49,107.
| Educational Attainment | Male Income | Female Income |
| Less than High School | - | - |
| High School Diploma | $30,313 | $0 |
| College or Associate's Degree | $60,714 | $49,107 |
| Bachelor's Degree | - | - |
| Graduate Degree | - | - |
| Total | $60,357 | $48,750 |
Family Income in Inchelium
Family Income Brackets in Inchelium
According to the Inchelium family income data, there are 32 families falling into the $100,000 to $149,999 income range, which is the most common income bracket and makes up 38.6% of all families.
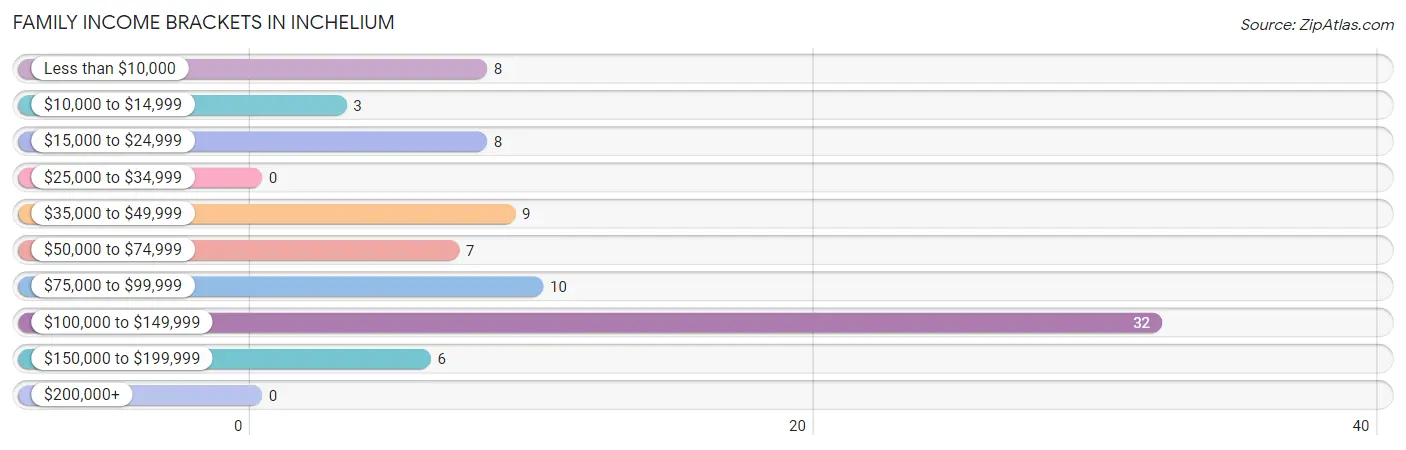
| Income Bracket | # Families | % Families |
| Less than $10,000 | 8 | 9.6% |
| $10,000 to $14,999 | 3 | 3.6% |
| $15,000 to $24,999 | 8 | 9.6% |
| $25,000 to $34,999 | 0 | 0.0% |
| $35,000 to $49,999 | 9 | 10.8% |
| $50,000 to $74,999 | 7 | 8.4% |
| $75,000 to $99,999 | 10 | 12.0% |
| $100,000 to $149,999 | 32 | 38.6% |
| $150,000 to $199,999 | 6 | 7.2% |
| $200,000+ | 0 | 0.0% |
Family Income by Famaliy Size in Inchelium
4-person families (34 | 41.0%) account for the highest median family income in Inchelium with $143,158 per family, while 4-person families (34 | 41.0%) have the highest median income of $35,790 per family member.
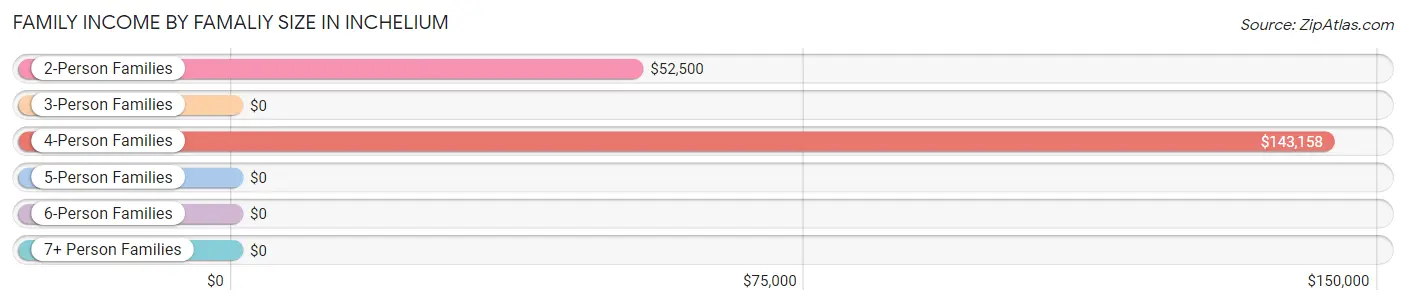
| Income Bracket | # Families | Median Income |
| 2-Person Families | 22 (26.5%) | $52,500 |
| 3-Person Families | 21 (25.3%) | $0 |
| 4-Person Families | 34 (41.0%) | $143,158 |
| 5-Person Families | 3 (3.6%) | $0 |
| 6-Person Families | 0 (0.0%) | $0 |
| 7+ Person Families | 3 (3.6%) | $0 |
| Total | 83 (100.0%) | $82,083 |
Family Income by Number of Earners in Inchelium
The median family income in Inchelium is $82,083, with families comprising 3+ earners (30) having the highest median family income of $143,026, while families with 1 earner (16) have the lowest median family income of $18,333, accounting for 36.1% and 19.3% of families, respectively.
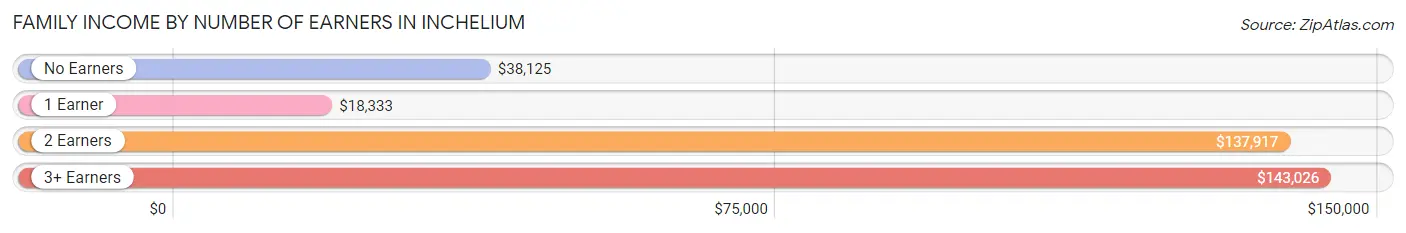
| Number of Earners | # Families | Median Income |
| No Earners | 20 (24.1%) | $38,125 |
| 1 Earner | 16 (19.3%) | $18,333 |
| 2 Earners | 17 (20.5%) | $137,917 |
| 3+ Earners | 30 (36.1%) | $143,026 |
| Total | 83 (100.0%) | $82,083 |
Household Income in Inchelium
Household Income Brackets in Inchelium
With 32 households falling in the category, the $100,000 to $149,999 income range is the most frequent in Inchelium, accounting for 26.7% of all households.
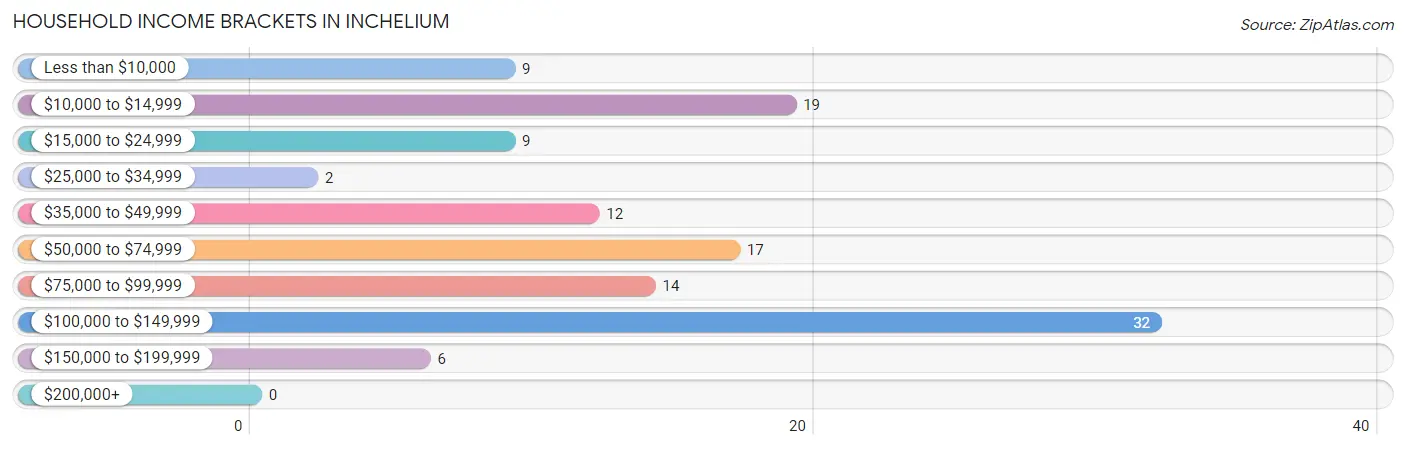
| Income Bracket | # Households | % Households |
| Less than $10,000 | 9 | 7.5% |
| $10,000 to $14,999 | 19 | 15.8% |
| $15,000 to $24,999 | 9 | 7.5% |
| $25,000 to $34,999 | 2 | 1.7% |
| $35,000 to $49,999 | 12 | 10.0% |
| $50,000 to $74,999 | 17 | 14.2% |
| $75,000 to $99,999 | 14 | 11.7% |
| $100,000 to $149,999 | 32 | 26.7% |
| $150,000 to $199,999 | 6 | 5.0% |
| $200,000+ | 0 | 0.0% |
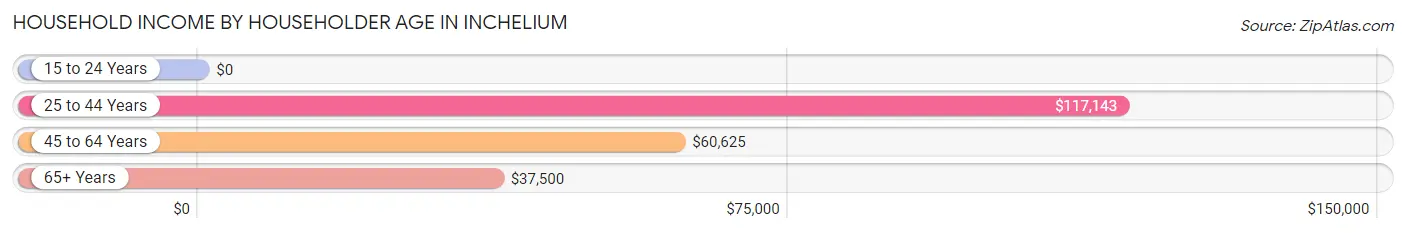
Household Income by Householder Age in Inchelium
The median household income in Inchelium is $59,375, with the highest median household income of $117,143 found in the 25 to 44 years age bracket for the primary householder. A total of 46 households (38.3%) fall into this category. Meanwhile, the 15 to 24 years age bracket for the primary householder has the lowest median household income of $0, with 1 households (0.8%) in this group.
| Income Bracket | # Households | Median Income |
| 15 to 24 Years | 1 (0.8%) | $0 |
| 25 to 44 Years | 46 (38.3%) | $117,143 |
| 45 to 64 Years | 45 (37.5%) | $60,625 |
| 65+ Years | 28 (23.3%) | $37,500 |
| Total | 120 (100.0%) | $59,375 |
Poverty in Inchelium
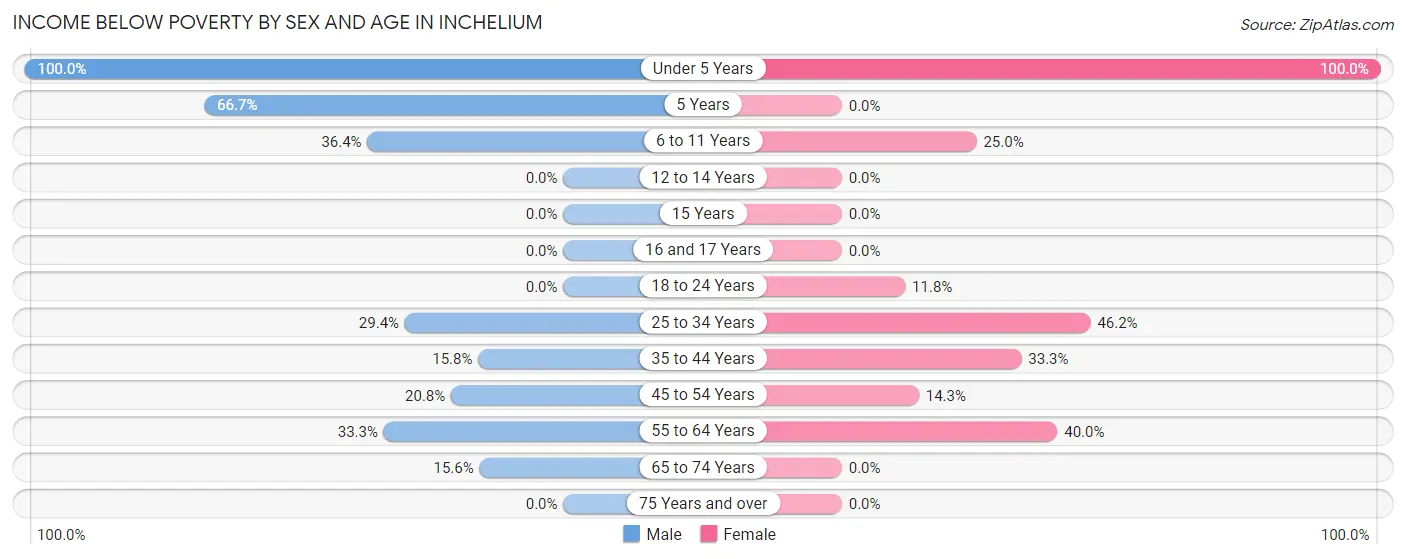
Income Below Poverty by Sex and Age in Inchelium
With 22.3% poverty level for males and 20.7% for females among the residents of Inchelium, under 5 year old males and under 5 year old females are the most vulnerable to poverty, with 10 males (100.0%) and 4 females (100.0%) in their respective age groups living below the poverty level.
| Age Bracket | Male | Female |
| Under 5 Years | 10 (100.0%) | 4 (100.0%) |
| 5 Years | 2 (66.7%) | 0 (0.0%) |
| 6 to 11 Years | 4 (36.4%) | 4 (25.0%) |
| 12 to 14 Years | 0 (0.0%) | 0 (0.0%) |
| 15 Years | 0 (0.0%) | 0 (0.0%) |
| 16 and 17 Years | 0 (0.0%) | 0 (0.0%) |
| 18 to 24 Years | 0 (0.0%) | 2 (11.8%) |
| 25 to 34 Years | 5 (29.4%) | 6 (46.2%) |
| 35 to 44 Years | 6 (15.8%) | 5 (33.3%) |
| 45 to 54 Years | 5 (20.8%) | 2 (14.3%) |
| 55 to 64 Years | 3 (33.3%) | 8 (40.0%) |
| 65 to 74 Years | 7 (15.6%) | 0 (0.0%) |
| 75 Years and over | 0 (0.0%) | 0 (0.0%) |
| Total | 42 (22.3%) | 31 (20.7%) |
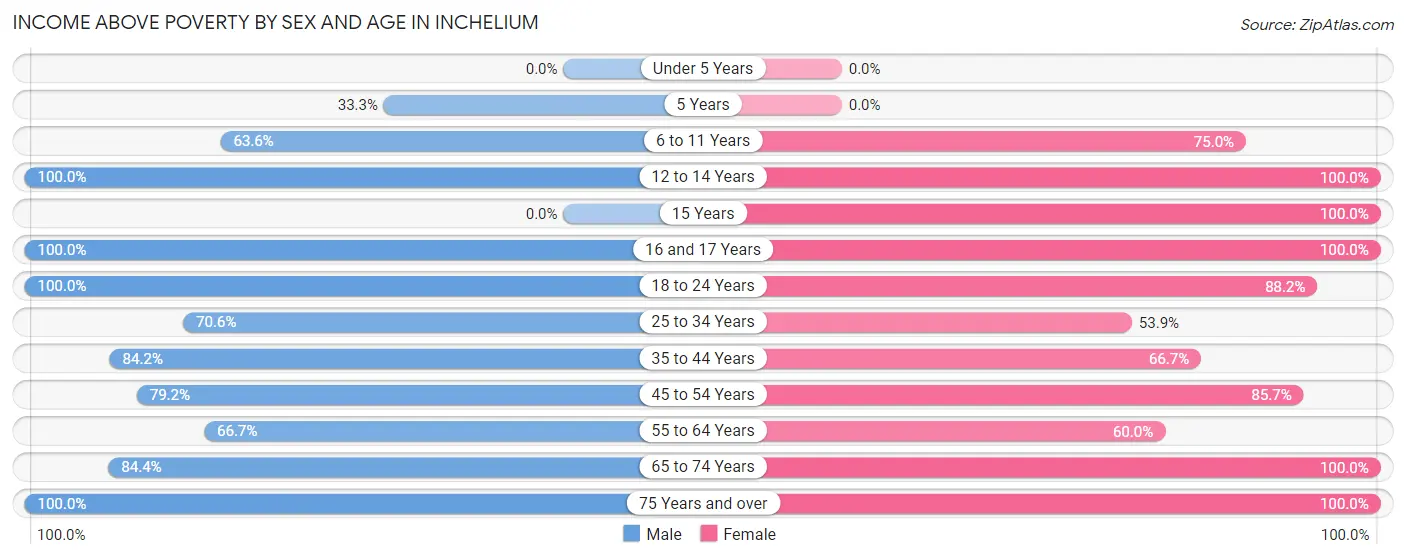
Income Above Poverty by Sex and Age in Inchelium
According to the poverty statistics in Inchelium, males aged 12 to 14 years and females aged 12 to 14 years are the age groups that are most secure financially, with 100.0% of males and 100.0% of females in these age groups living above the poverty line.
| Age Bracket | Male | Female |
| Under 5 Years | 0 (0.0%) | 0 (0.0%) |
| 5 Years | 1 (33.3%) | 0 (0.0%) |
| 6 to 11 Years | 7 (63.6%) | 12 (75.0%) |
| 12 to 14 Years | 1 (100.0%) | 4 (100.0%) |
| 15 Years | 0 (0.0%) | 14 (100.0%) |
| 16 and 17 Years | 11 (100.0%) | 14 (100.0%) |
| 18 to 24 Years | 11 (100.0%) | 15 (88.2%) |
| 25 to 34 Years | 12 (70.6%) | 7 (53.8%) |
| 35 to 44 Years | 32 (84.2%) | 10 (66.7%) |
| 45 to 54 Years | 19 (79.2%) | 12 (85.7%) |
| 55 to 64 Years | 6 (66.7%) | 12 (60.0%) |
| 65 to 74 Years | 38 (84.4%) | 13 (100.0%) |
| 75 Years and over | 8 (100.0%) | 6 (100.0%) |
| Total | 146 (77.7%) | 119 (79.3%) |
Income Below Poverty Among Married-Couple Families in Inchelium
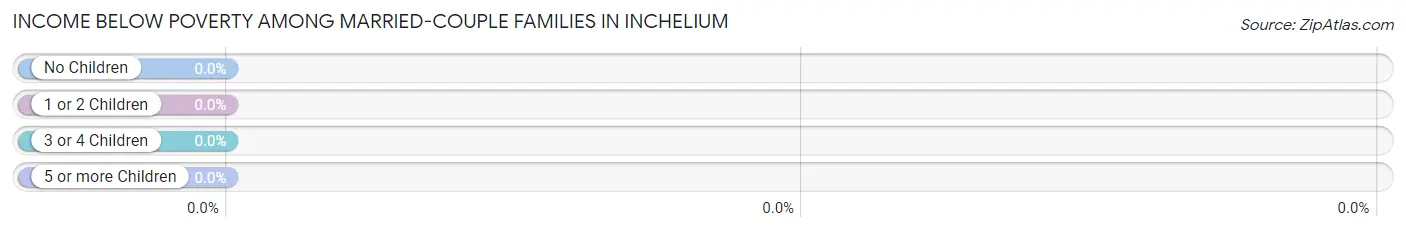
| Children | Above Poverty | Below Poverty |
| No Children | 22 (100.0%) | 0 (0.0%) |
| 1 or 2 Children | 32 (100.0%) | 0 (0.0%) |
| 3 or 4 Children | 3 (100.0%) | 0 (0.0%) |
| 5 or more Children | 3 (100.0%) | 0 (0.0%) |
| Total | 60 (100.0%) | 0 (0.0%) |
Income Below Poverty Among Single-Parent Households in Inchelium
According to the poverty data in Inchelium, 75.0% or 6 single-father households and 73.3% or 11 single-mother households are living below the poverty line. Among single-father households, those with 1 or 2 children have the highest poverty rate, with 6 households (75.0%) experiencing poverty. Likewise, among single-mother households, those with 3 or 4 children have the highest poverty rate, with 3 households (100.0%) falling below the poverty line.
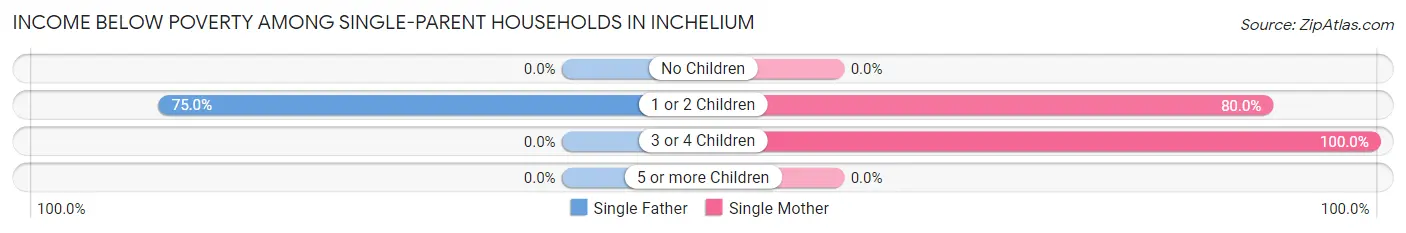
| Children | Single Father | Single Mother |
| No Children | 0 (0.0%) | 0 (0.0%) |
| 1 or 2 Children | 6 (75.0%) | 8 (80.0%) |
| 3 or 4 Children | 0 (0.0%) | 3 (100.0%) |
| 5 or more Children | 0 (0.0%) | 0 (0.0%) |
| Total | 6 (75.0%) | 11 (73.3%) |
Income Below Poverty Among Married-Couple vs Single-Parent Households in Inchelium
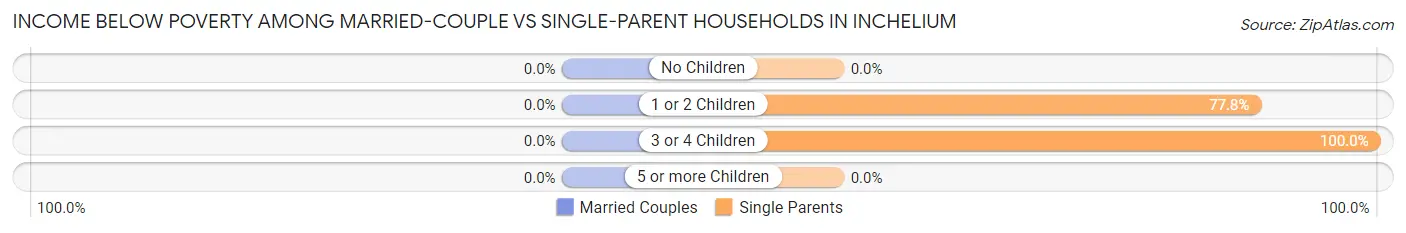
| Children | Married-Couple Families | Single-Parent Households |
| No Children | 0 (0.0%) | 0 (0.0%) |
| 1 or 2 Children | 0 (0.0%) | 14 (77.8%) |
| 3 or 4 Children | 0 (0.0%) | 3 (100.0%) |
| 5 or more Children | 0 (0.0%) | 0 (0.0%) |
| Total | 0 (0.0%) | 17 (73.9%) |
Race in Inchelium
The most populous races in Inchelium are Native / Alaskan (246 | 72.8%), Two or more Races (61 | 18.0%), and White / Caucasian (31 | 9.2%).
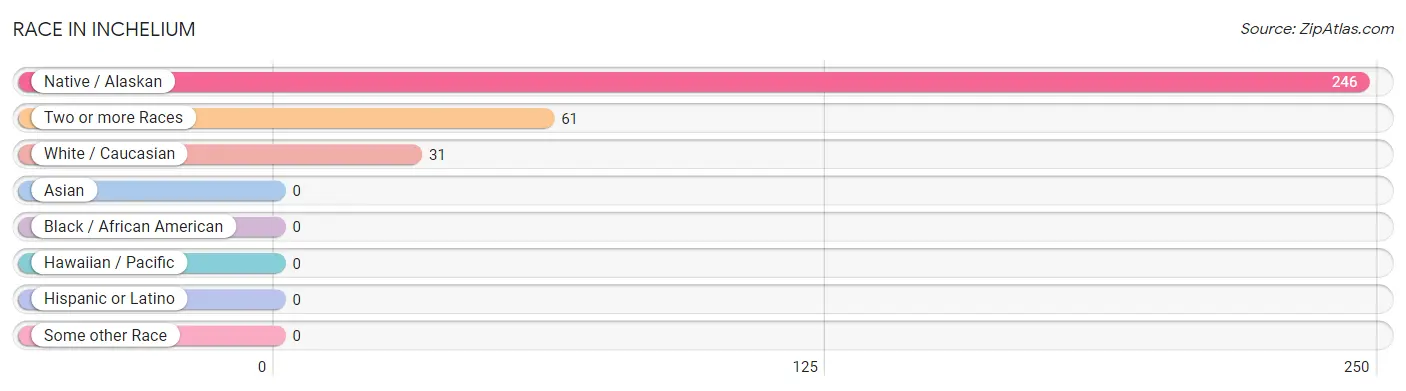
| Race | # Population | % Population |
| Asian | 0 | 0.0% |
| Black / African American | 0 | 0.0% |
| Hawaiian / Pacific | 0 | 0.0% |
| Hispanic or Latino | 0 | 0.0% |
| Native / Alaskan | 246 | 72.8% |
| White / Caucasian | 31 | 9.2% |
| Two or more Races | 61 | 18.0% |
| Some other Race | 0 | 0.0% |
| Total | 338 | 100.0% |
Ancestry in Inchelium
The most populous ancestries reported in Inchelium are Colville (280 | 82.8%), German (53 | 15.7%), Irish (29 | 8.6%), European (8 | 2.4%), and Cherokee (7 | 2.1%), together accounting for 111.5% of all Inchelium residents.
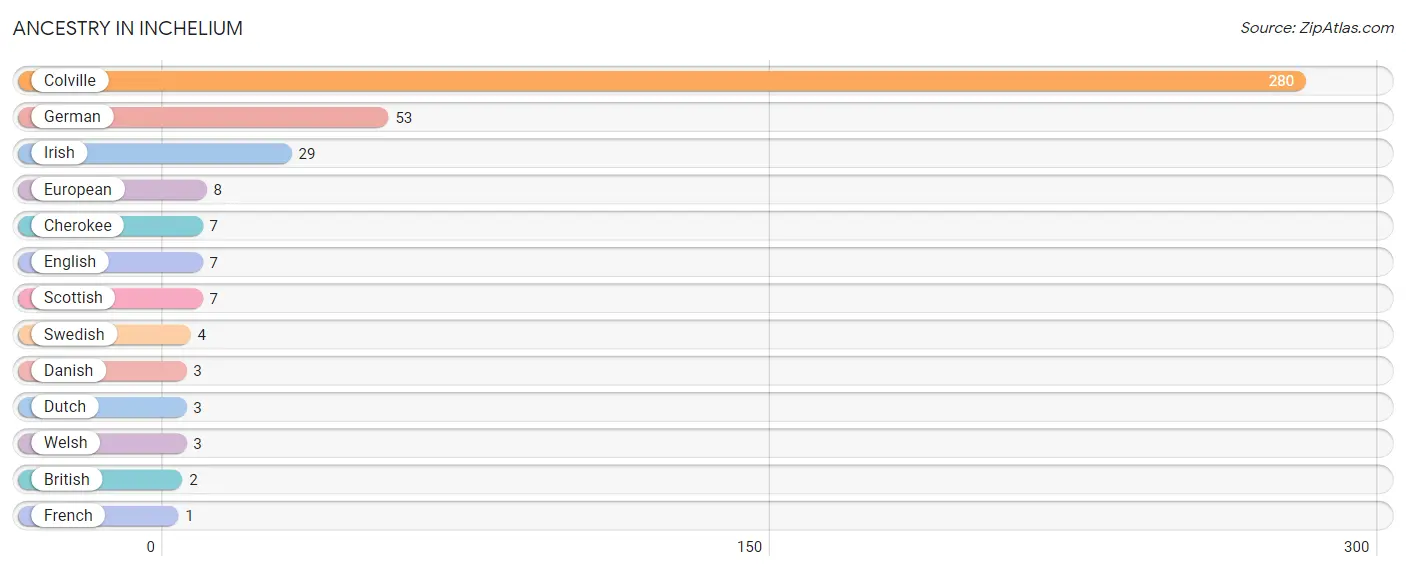
| Ancestry | # Population | % Population |
| British | 2 | 0.6% |
| Cherokee | 7 | 2.1% |
| Colville | 280 | 82.8% |
| Danish | 3 | 0.9% |
| Dutch | 3 | 0.9% |
| English | 7 | 2.1% |
| European | 8 | 2.4% |
| French | 1 | 0.3% |
| German | 53 | 15.7% |
| Irish | 29 | 8.6% |
| Scottish | 7 | 2.1% |
| Swedish | 4 | 1.2% |
| Welsh | 3 | 0.9% | View All 13 Rows |
Immigrants in Inchelium

| Immigration Origin | # Population | % Population | View All 0 Rows |
Sex and Age in Inchelium
Sex and Age in Inchelium
The most populous age groups in Inchelium are 65 to 69 Years (33 | 17.5%) for men and 15 to 19 Years (43 | 28.7%) for women.
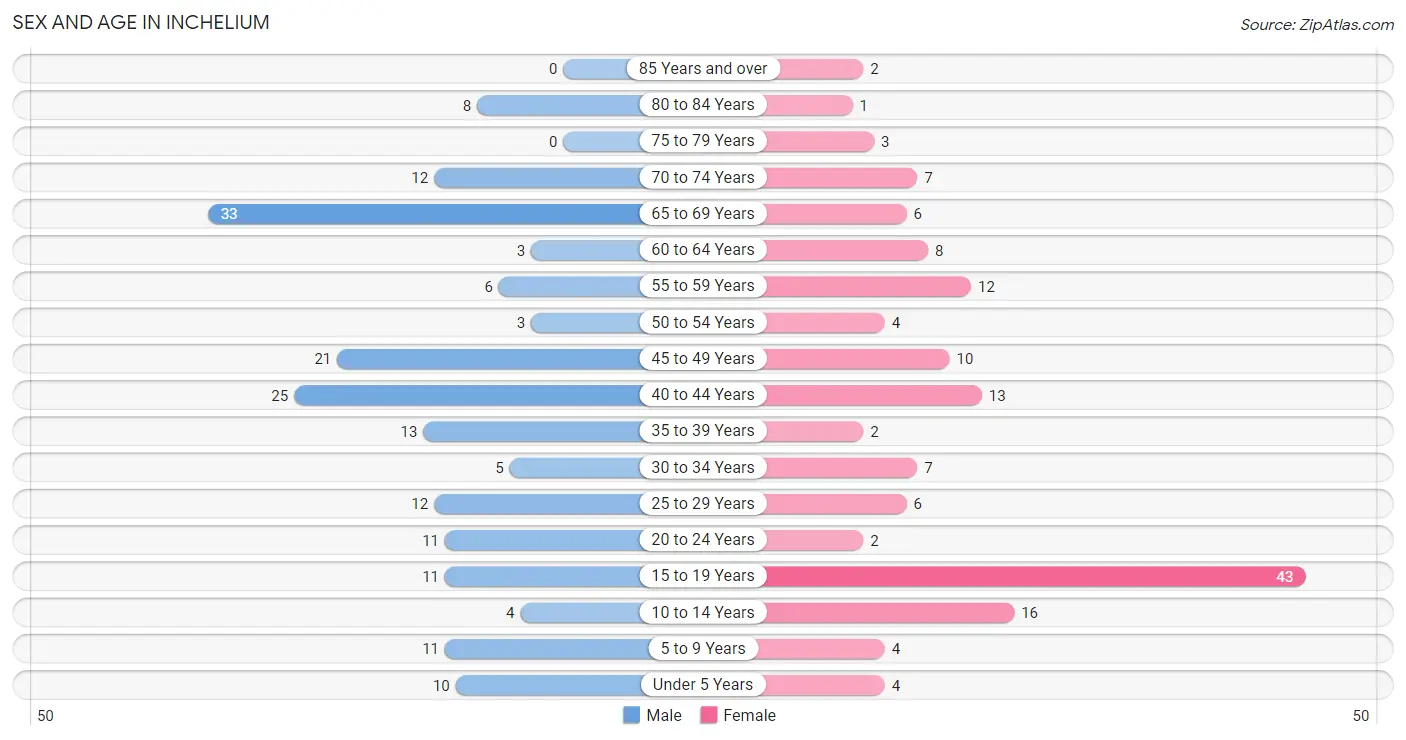
| Age Bracket | Male | Female |
| Under 5 Years | 10 (5.3%) | 4 (2.7%) |
| 5 to 9 Years | 11 (5.9%) | 4 (2.7%) |
| 10 to 14 Years | 4 (2.1%) | 16 (10.7%) |
| 15 to 19 Years | 11 (5.9%) | 43 (28.7%) |
| 20 to 24 Years | 11 (5.9%) | 2 (1.3%) |
| 25 to 29 Years | 12 (6.4%) | 6 (4.0%) |
| 30 to 34 Years | 5 (2.7%) | 7 (4.7%) |
| 35 to 39 Years | 13 (6.9%) | 2 (1.3%) |
| 40 to 44 Years | 25 (13.3%) | 13 (8.7%) |
| 45 to 49 Years | 21 (11.2%) | 10 (6.7%) |
| 50 to 54 Years | 3 (1.6%) | 4 (2.7%) |
| 55 to 59 Years | 6 (3.2%) | 12 (8.0%) |
| 60 to 64 Years | 3 (1.6%) | 8 (5.3%) |
| 65 to 69 Years | 33 (17.5%) | 6 (4.0%) |
| 70 to 74 Years | 12 (6.4%) | 7 (4.7%) |
| 75 to 79 Years | 0 (0.0%) | 3 (2.0%) |
| 80 to 84 Years | 8 (4.3%) | 1 (0.7%) |
| 85 Years and over | 0 (0.0%) | 2 (1.3%) |
| Total | 188 (100.0%) | 150 (100.0%) |
Families and Households in Inchelium
Median Family Size in Inchelium
The median family size in Inchelium is 3.40 persons per family, with single male/father families (8 | 9.6%) accounting for the largest median family size of 3.75 persons per family. On the other hand, married-couple families (60 | 72.3%) represent the smallest median family size with 3.28 persons per family.
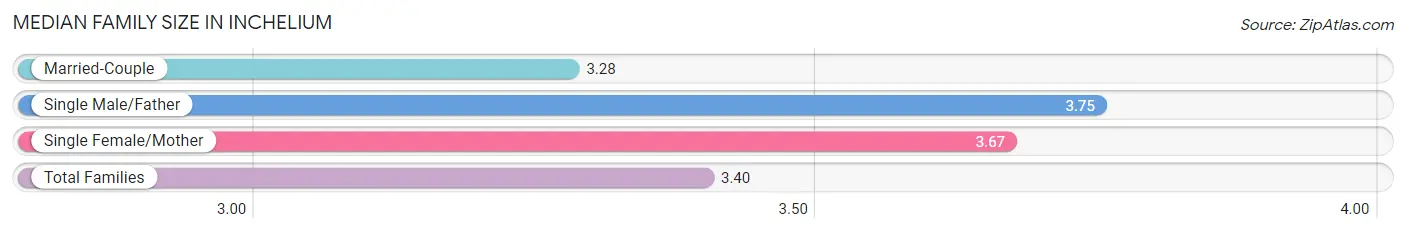
| Family Type | # Families | Family Size |
| Married-Couple | 60 (72.3%) | 3.28 |
| Single Male/Father | 8 (9.6%) | 3.75 |
| Single Female/Mother | 15 (18.1%) | 3.67 |
| Total Families | 83 (100.0%) | 3.40 |
Median Household Size in Inchelium
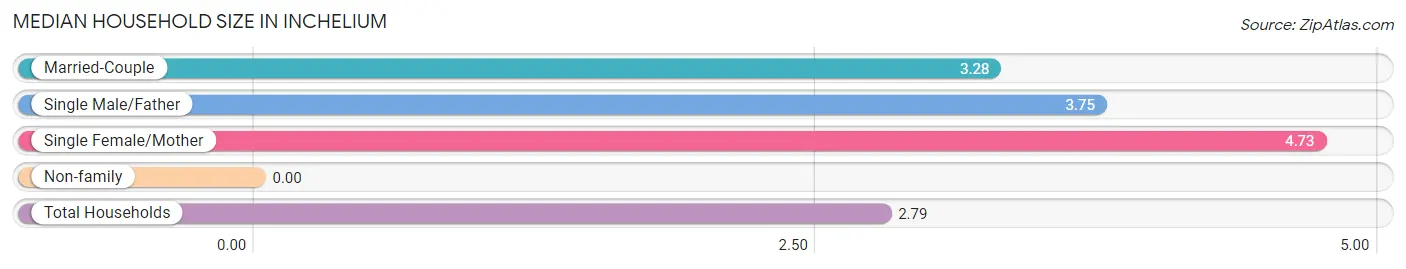
| Household Type | # Households | Household Size |
| Married-Couple | 60 (50.0%) | 3.28 |
| Single Male/Father | 8 (6.7%) | 3.75 |
| Single Female/Mother | 15 (12.5%) | 4.73 |
| Non-family | 37 (30.8%) | - |
| Total Households | 120 (100.0%) | 2.79 |
Household Size by Marriage Status in Inchelium
Out of a total of 120 households in Inchelium, 83 (69.2%) are family households, while 37 (30.8%) are nonfamily households. The most numerous type of family households are 4-person households, comprising 44, and the most common type of nonfamily households are 1-person households, comprising 37.
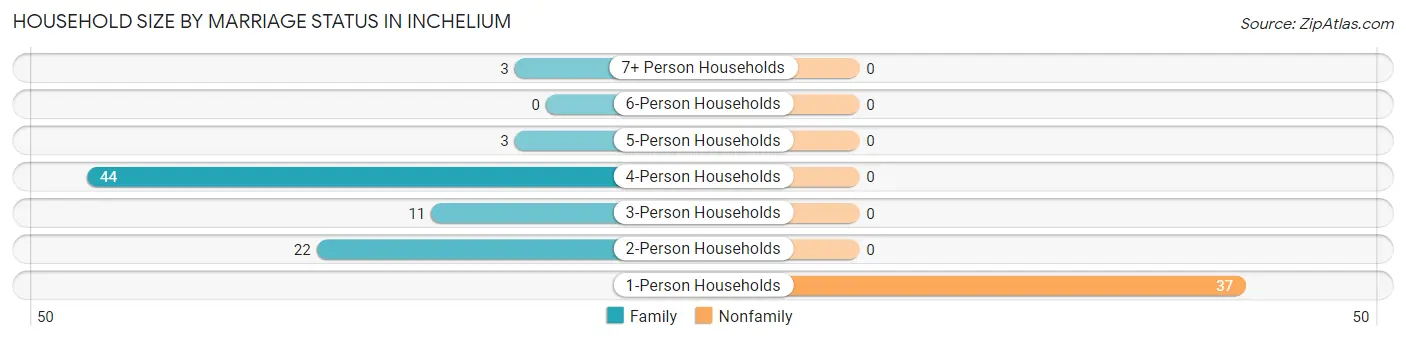
| Household Size | Family Households | Nonfamily Households |
| 1-Person Households | - | 37 (30.8%) |
| 2-Person Households | 22 (18.3%) | 0 (0.0%) |
| 3-Person Households | 11 (9.2%) | 0 (0.0%) |
| 4-Person Households | 44 (36.7%) | 0 (0.0%) |
| 5-Person Households | 3 (2.5%) | 0 (0.0%) |
| 6-Person Households | 0 (0.0%) | 0 (0.0%) |
| 7+ Person Households | 3 (2.5%) | 0 (0.0%) |
| Total | 83 (69.2%) | 37 (30.8%) |
Female Fertility in Inchelium
Fertility by Age in Inchelium
| Age Bracket | Women with Births | Births / 1,000 Women |
| 15 to 19 years | 0 (0.0%) | 0.0 |
| 20 to 34 years | 0 (0.0%) | 0.0 |
| 35 to 50 years | 0 (0.0%) | 0.0 |
| Total | 0 (0.0%) | 0.0 |
Fertility by Age by Marriage Status in Inchelium
| Age Bracket | Married | Unmarried |
| 15 to 19 years | 0 (0.0%) | 0 (0.0%) |
| 20 to 34 years | 0 (0.0%) | 0 (0.0%) |
| 35 to 50 years | 0 (0.0%) | 0 (0.0%) |
| Total | 0 (0.0%) | 0 (0.0%) |
Fertility by Education in Inchelium
| Educational Attainment | Women with Births | Births / 1,000 Women |
| Less than High School | 0 (0.0%) | 0.0 |
| High School Diploma | 0 (0.0%) | 0.0 |
| College or Associate's Degree | 0 (0.0%) | 0.0 |
| Bachelor's Degree | 0 (0.0%) | 0.0 |
| Graduate Degree | 0 (0.0%) | 0.0 |
| Total | 0 (0.0%) | 0.0 |
Fertility by Education by Marriage Status in Inchelium
| Educational Attainment | Married | Unmarried |
| Less than High School | 0 (0.0%) | 0 (0.0%) |
| High School Diploma | 0 (0.0%) | 0 (0.0%) |
| College or Associate's Degree | 0 (0.0%) | 0 (0.0%) |
| Bachelor's Degree | 0 (0.0%) | 0 (0.0%) |
| Graduate Degree | 0 (0.0%) | 0 (0.0%) |
| Total | 0 (0.0%) | 0 (0.0%) |
Employment Characteristics in Inchelium
Employment by Class of Employer in Inchelium
Among the 156 employed individuals in Inchelium, local government employees (48 | 30.8%), federal government employees (39 | 25.0%), and state government employees (35 | 22.4%) make up the most common classes of employment.
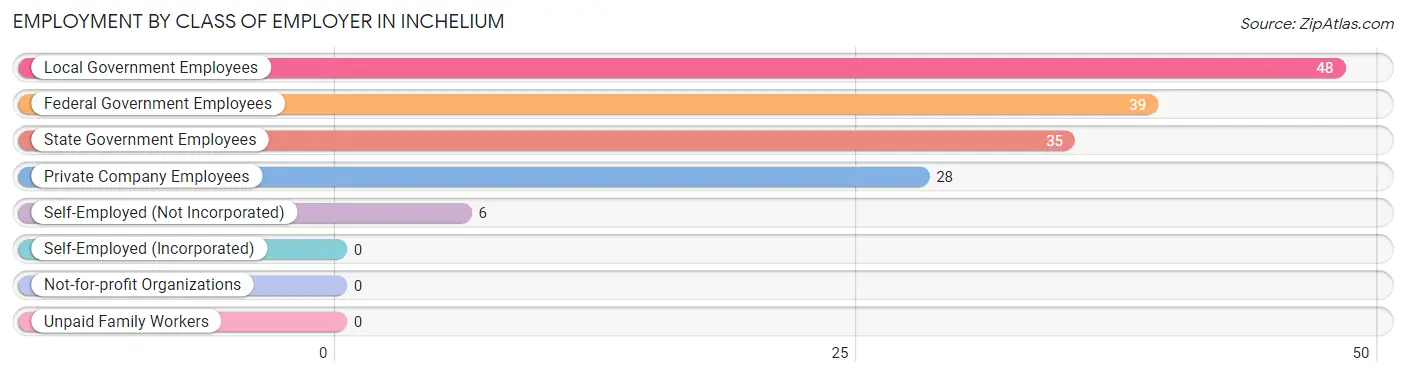
| Employer Class | # Employees | % Employees |
| Private Company Employees | 28 | 17.9% |
| Self-Employed (Incorporated) | 0 | 0.0% |
| Self-Employed (Not Incorporated) | 6 | 3.8% |
| Not-for-profit Organizations | 0 | 0.0% |
| Local Government Employees | 48 | 30.8% |
| State Government Employees | 35 | 22.4% |
| Federal Government Employees | 39 | 25.0% |
| Unpaid Family Workers | 0 | 0.0% |
| Total | 156 | 100.0% |
Employment Status by Age in Inchelium
According to the labor force statistics for Inchelium, out of the total population over 16 years of age (275), 65.1% or 179 individuals are in the labor force, with 12.8% or 23 of them unemployed. The age group with the highest labor force participation rate is 25 to 29 years, with 100.0% or 18 individuals in the labor force. Within the labor force, the 16 to 19 years age range has the highest percentage of unemployed individuals, with 100.0% or 9 of them being unemployed.
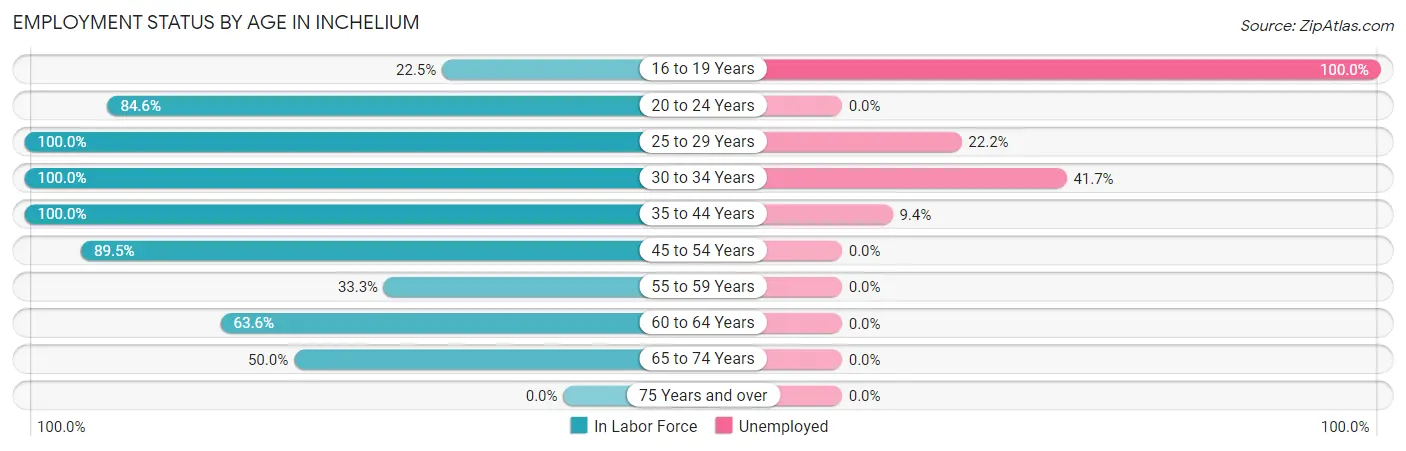
| Age Bracket | In Labor Force | Unemployed |
| 16 to 19 Years | 9 (22.5%) | 9 (100.0%) |
| 20 to 24 Years | 11 (84.6%) | 0 (0.0%) |
| 25 to 29 Years | 18 (100.0%) | 4 (22.2%) |
| 30 to 34 Years | 12 (100.0%) | 5 (41.7%) |
| 35 to 44 Years | 53 (100.0%) | 5 (9.4%) |
| 45 to 54 Years | 34 (89.5%) | 0 (0.0%) |
| 55 to 59 Years | 6 (33.3%) | 0 (0.0%) |
| 60 to 64 Years | 7 (63.6%) | 0 (0.0%) |
| 65 to 74 Years | 29 (50.0%) | 0 (0.0%) |
| 75 Years and over | 0 (0.0%) | 0 (0.0%) |
| Total | 179 (65.1%) | 23 (12.8%) |
Employment Status by Educational Attainment in Inchelium
According to labor force statistics for Inchelium, 86.7% of individuals (130) out of the total population between 25 and 64 years of age (150) are in the labor force, with 10.8% or 14 of them being unemployed. The group with the highest labor force participation rate are those with the educational attainment of college / associate degree, with 100.0% or 60 individuals in the labor force. Within the labor force, individuals with high school diploma education have the highest percentage of unemployment, with 31.4% or 11 of them being unemployed.
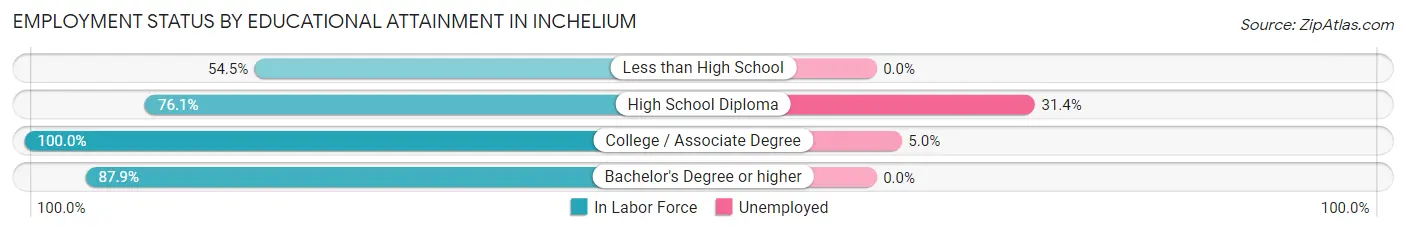
| Educational Attainment | In Labor Force | Unemployed |
| Less than High School | 6 (54.5%) | 0 (0.0%) |
| High School Diploma | 35 (76.1%) | 14 (31.4%) |
| College / Associate Degree | 60 (100.0%) | 3 (5.0%) |
| Bachelor's Degree or higher | 29 (87.9%) | 0 (0.0%) |
| Total | 130 (86.7%) | 16 (10.8%) |
Employment Occupations by Sex in Inchelium
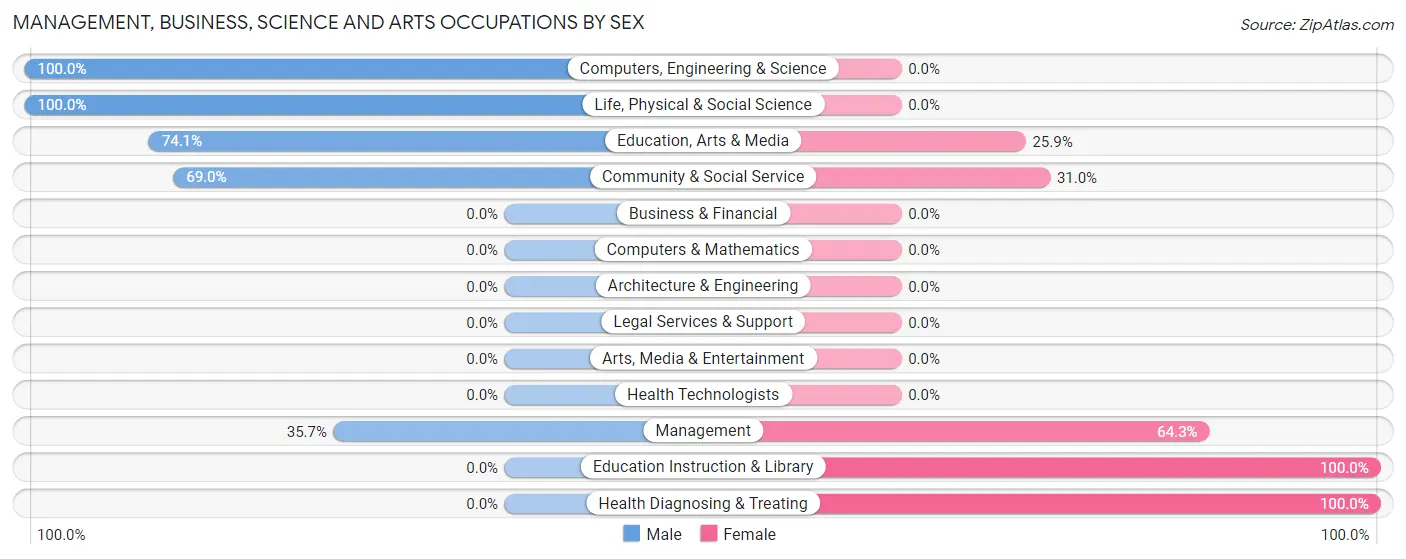
Management, Business, Science and Arts Occupations
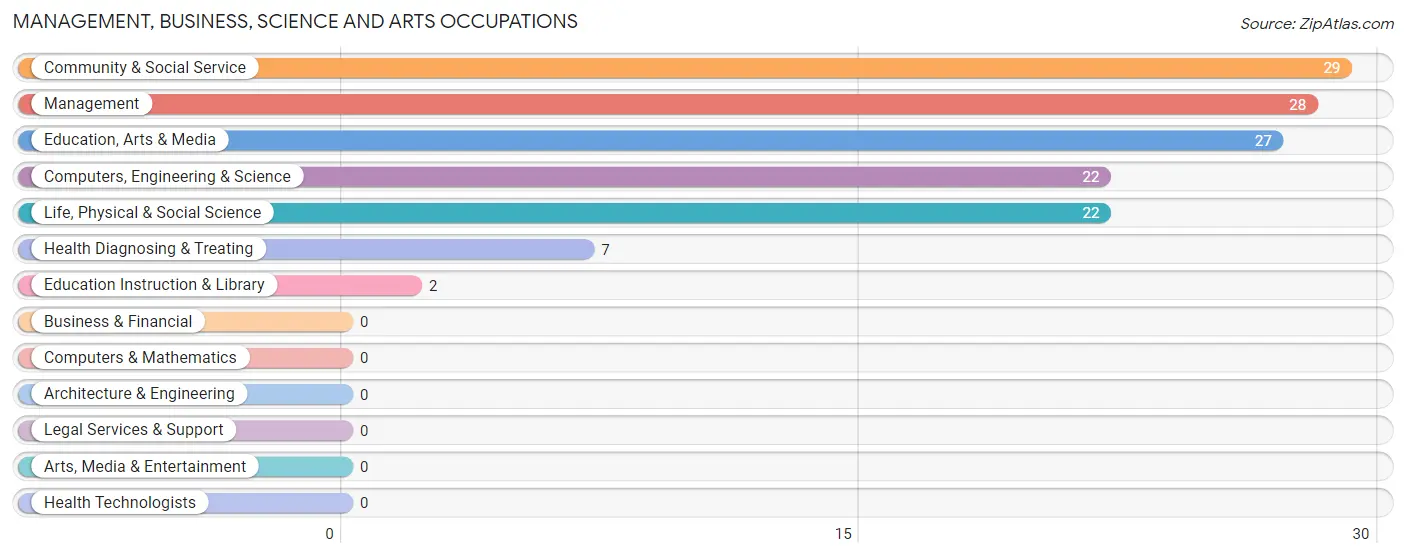
The most common Management, Business, Science and Arts occupations in Inchelium are Community & Social Service (29 | 18.6%), Management (28 | 17.9%), Education, Arts & Media (27 | 17.3%), Computers, Engineering & Science (22 | 14.1%), and Life, Physical & Social Science (22 | 14.1%).
Management, Business, Science and Arts Occupations by Sex
Within the Management, Business, Science and Arts occupations in Inchelium, the most male-oriented occupations are Computers, Engineering & Science (100.0%), Life, Physical & Social Science (100.0%), and Education, Arts & Media (74.1%), while the most female-oriented occupations are Education Instruction & Library (100.0%), Health Diagnosing & Treating (100.0%), and Management (64.3%).
| Occupation | Male | Female |
| Management | 10 (35.7%) | 18 (64.3%) |
| Business & Financial | 0 (0.0%) | 0 (0.0%) |
| Computers, Engineering & Science | 22 (100.0%) | 0 (0.0%) |
| Computers & Mathematics | 0 (0.0%) | 0 (0.0%) |
| Architecture & Engineering | 0 (0.0%) | 0 (0.0%) |
| Life, Physical & Social Science | 22 (100.0%) | 0 (0.0%) |
| Community & Social Service | 20 (69.0%) | 9 (31.0%) |
| Education, Arts & Media | 20 (74.1%) | 7 (25.9%) |
| Legal Services & Support | 0 (0.0%) | 0 (0.0%) |
| Education Instruction & Library | 0 (0.0%) | 2 (100.0%) |
| Arts, Media & Entertainment | 0 (0.0%) | 0 (0.0%) |
| Health Diagnosing & Treating | 0 (0.0%) | 7 (100.0%) |
| Health Technologists | 0 (0.0%) | 0 (0.0%) |
| Total (Category) | 52 (60.5%) | 34 (39.5%) |
| Total (Overall) | 108 (69.2%) | 48 (30.8%) |
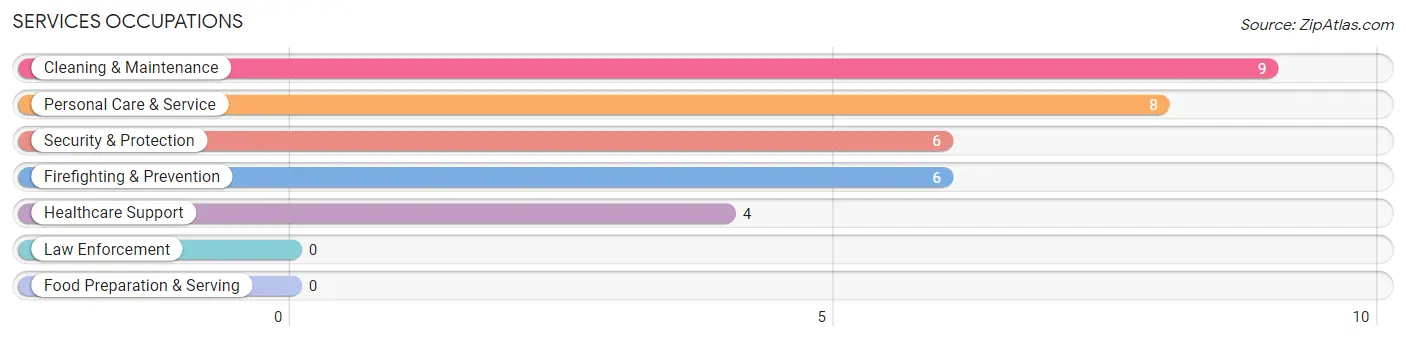
Services Occupations
The most common Services occupations in Inchelium are Cleaning & Maintenance (9 | 5.8%), Personal Care & Service (8 | 5.1%), Security & Protection (6 | 3.8%), Firefighting & Prevention (6 | 3.8%), and Healthcare Support (4 | 2.6%).
Services Occupations by Sex
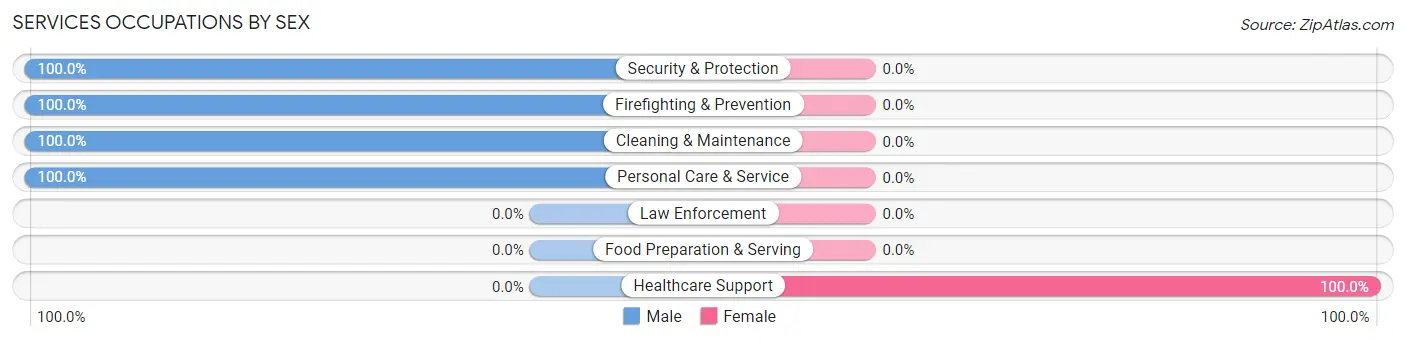
| Occupation | Male | Female |
| Healthcare Support | 0 (0.0%) | 4 (100.0%) |
| Security & Protection | 6 (100.0%) | 0 (0.0%) |
| Firefighting & Prevention | 6 (100.0%) | 0 (0.0%) |
| Law Enforcement | 0 (0.0%) | 0 (0.0%) |
| Food Preparation & Serving | 0 (0.0%) | 0 (0.0%) |
| Cleaning & Maintenance | 9 (100.0%) | 0 (0.0%) |
| Personal Care & Service | 8 (100.0%) | 0 (0.0%) |
| Total (Category) | 23 (85.2%) | 4 (14.8%) |
| Total (Overall) | 108 (69.2%) | 48 (30.8%) |
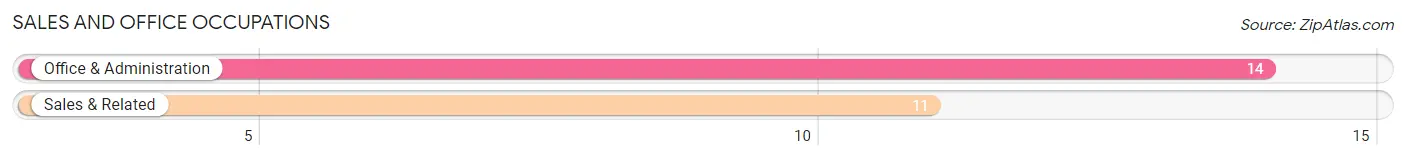
Sales and Office Occupations
The most common Sales and Office occupations in Inchelium are Office & Administration (14 | 9.0%), and Sales & Related (11 | 7.0%).
Sales and Office Occupations by Sex
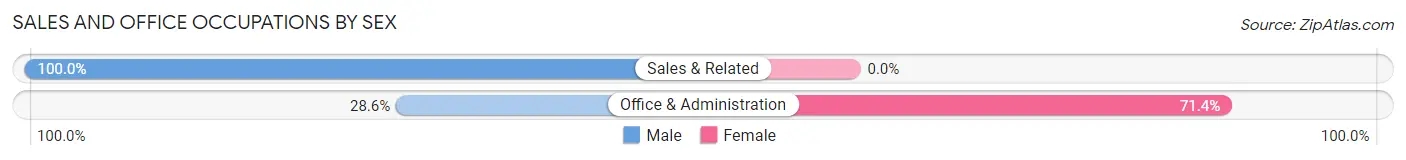
| Occupation | Male | Female |
| Sales & Related | 11 (100.0%) | 0 (0.0%) |
| Office & Administration | 4 (28.6%) | 10 (71.4%) |
| Total (Category) | 15 (60.0%) | 10 (40.0%) |
| Total (Overall) | 108 (69.2%) | 48 (30.8%) |
Natural Resources, Construction and Maintenance Occupations
The most common Natural Resources, Construction and Maintenance occupations in Inchelium are , and Construction & Extraction (7 | 4.5%).
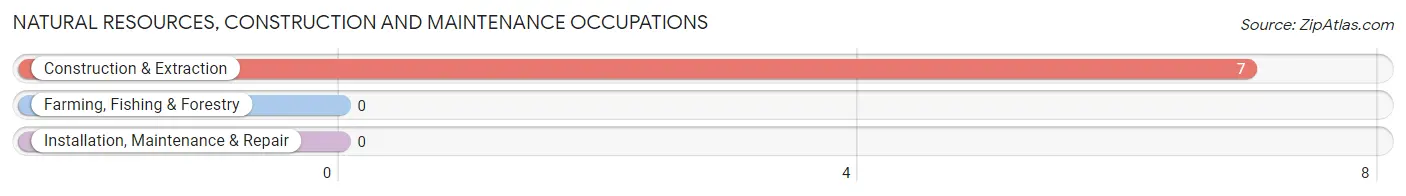
Natural Resources, Construction and Maintenance Occupations by Sex
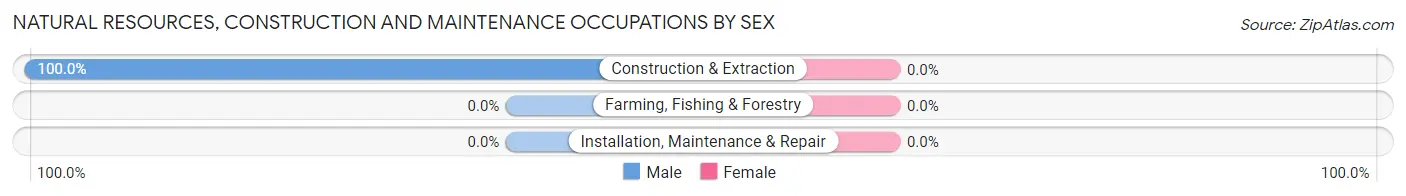
| Occupation | Male | Female |
| Farming, Fishing & Forestry | 0 (0.0%) | 0 (0.0%) |
| Construction & Extraction | 7 (100.0%) | 0 (0.0%) |
| Installation, Maintenance & Repair | 0 (0.0%) | 0 (0.0%) |
| Total (Category) | 7 (100.0%) | 0 (0.0%) |
| Total (Overall) | 108 (69.2%) | 48 (30.8%) |
Production, Transportation and Moving Occupations
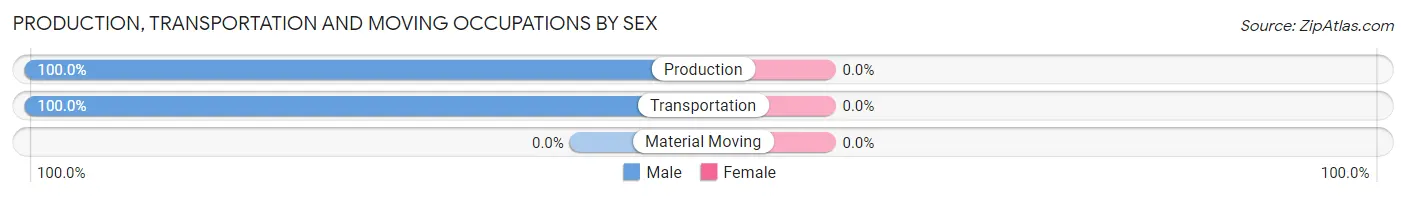
The most common Production, Transportation and Moving occupations in Inchelium are Transportation (6 | 3.8%), and Production (5 | 3.2%).
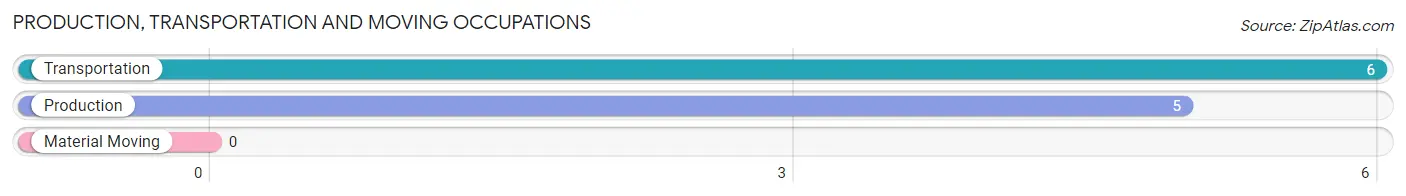
Production, Transportation and Moving Occupations by Sex
| Occupation | Male | Female |
| Production | 5 (100.0%) | 0 (0.0%) |
| Transportation | 6 (100.0%) | 0 (0.0%) |
| Material Moving | 0 (0.0%) | 0 (0.0%) |
| Total (Category) | 11 (100.0%) | 0 (0.0%) |
| Total (Overall) | 108 (69.2%) | 48 (30.8%) |
Employment Industries by Sex in Inchelium
Employment Industries in Inchelium
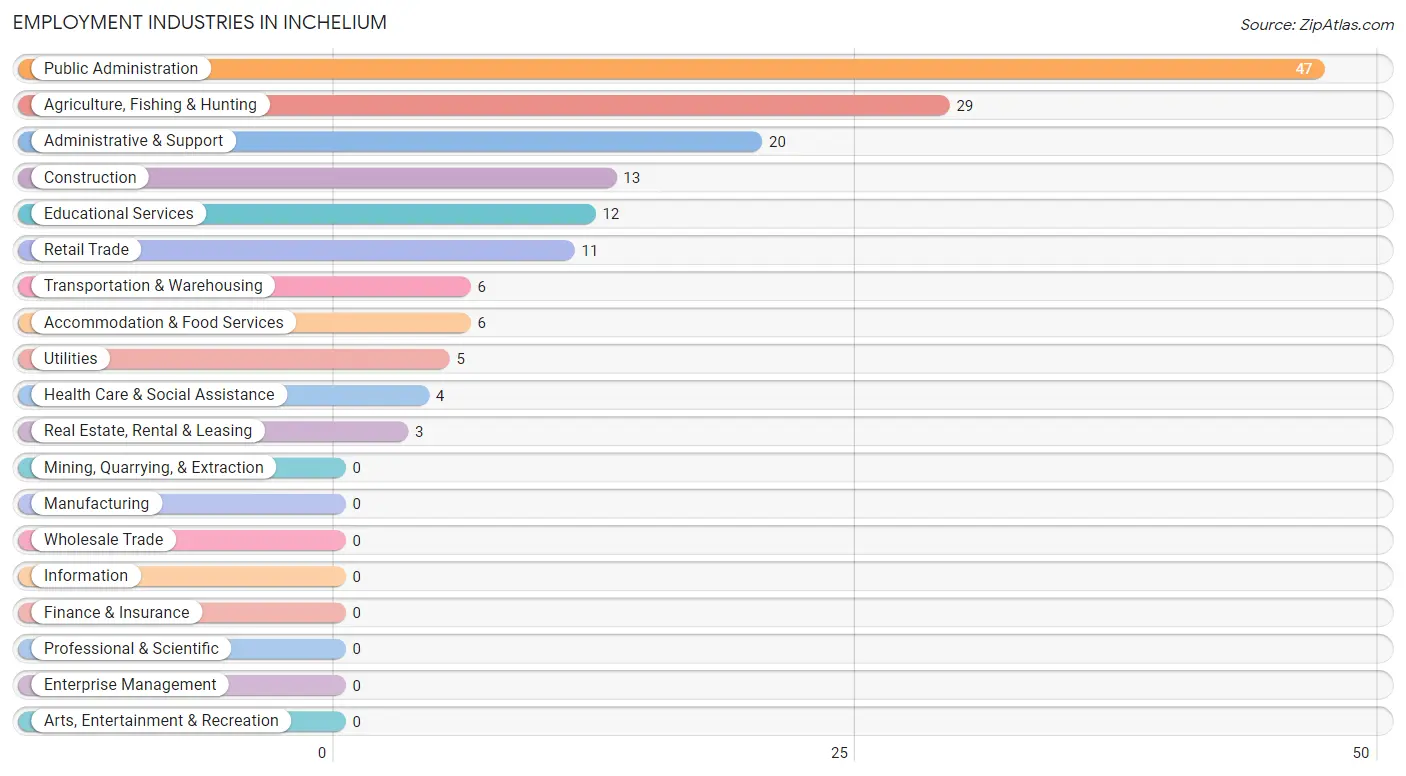
The major employment industries in Inchelium include Public Administration (47 | 30.1%), Agriculture, Fishing & Hunting (29 | 18.6%), Administrative & Support (20 | 12.8%), Construction (13 | 8.3%), and Educational Services (12 | 7.7%).
Employment Industries by Sex in Inchelium
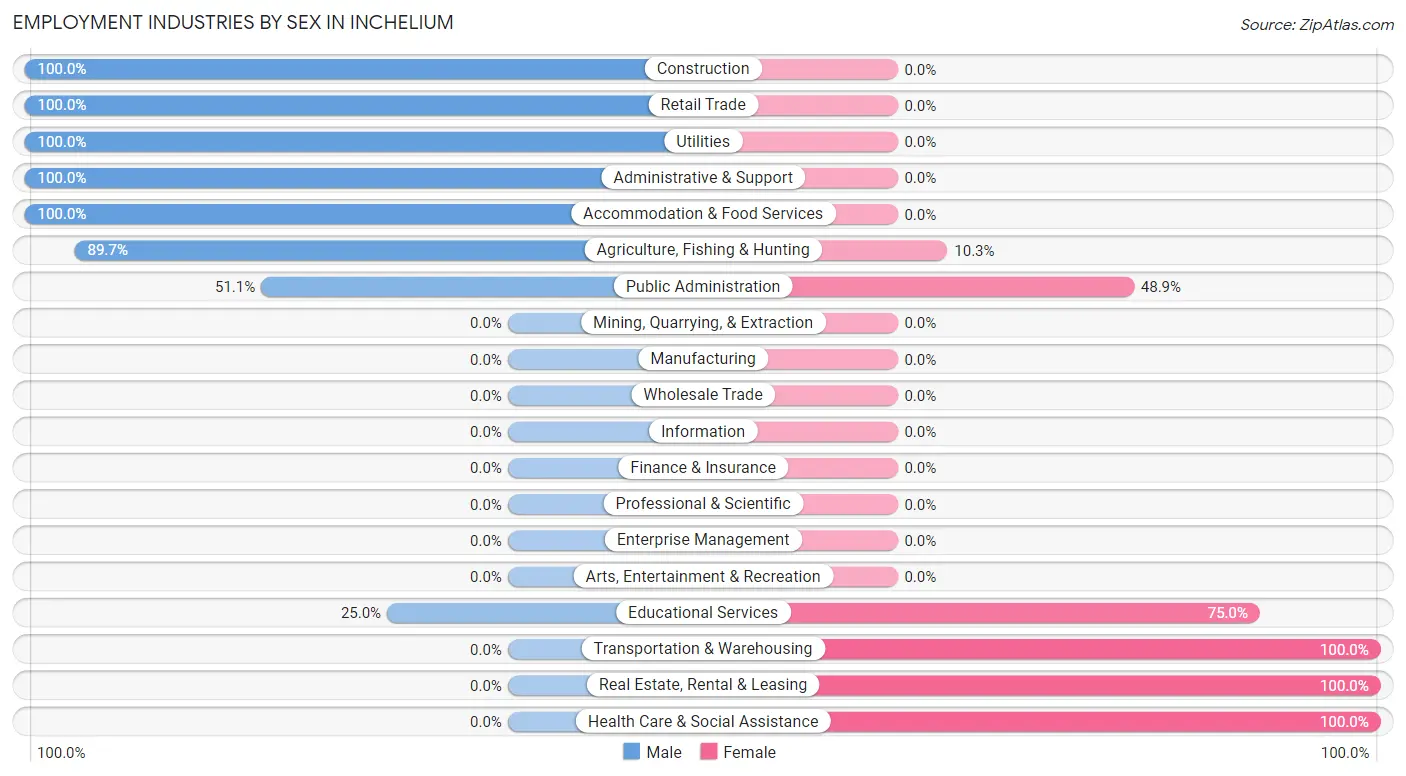
The Inchelium industries that see more men than women are Construction (100.0%), Retail Trade (100.0%), and Utilities (100.0%), whereas the industries that tend to have a higher number of women are Transportation & Warehousing (100.0%), Real Estate, Rental & Leasing (100.0%), and Health Care & Social Assistance (100.0%).
| Industry | Male | Female |
| Agriculture, Fishing & Hunting | 26 (89.7%) | 3 (10.3%) |
| Mining, Quarrying, & Extraction | 0 (0.0%) | 0 (0.0%) |
| Construction | 13 (100.0%) | 0 (0.0%) |
| Manufacturing | 0 (0.0%) | 0 (0.0%) |
| Wholesale Trade | 0 (0.0%) | 0 (0.0%) |
| Retail Trade | 11 (100.0%) | 0 (0.0%) |
| Transportation & Warehousing | 0 (0.0%) | 6 (100.0%) |
| Utilities | 5 (100.0%) | 0 (0.0%) |
| Information | 0 (0.0%) | 0 (0.0%) |
| Finance & Insurance | 0 (0.0%) | 0 (0.0%) |
| Real Estate, Rental & Leasing | 0 (0.0%) | 3 (100.0%) |
| Professional & Scientific | 0 (0.0%) | 0 (0.0%) |
| Enterprise Management | 0 (0.0%) | 0 (0.0%) |
| Administrative & Support | 20 (100.0%) | 0 (0.0%) |
| Educational Services | 3 (25.0%) | 9 (75.0%) |
| Health Care & Social Assistance | 0 (0.0%) | 4 (100.0%) |
| Arts, Entertainment & Recreation | 0 (0.0%) | 0 (0.0%) |
| Accommodation & Food Services | 6 (100.0%) | 0 (0.0%) |
| Public Administration | 24 (51.1%) | 23 (48.9%) |
| Total | 108 (69.2%) | 48 (30.8%) |
Education in Inchelium
School Enrollment in Inchelium
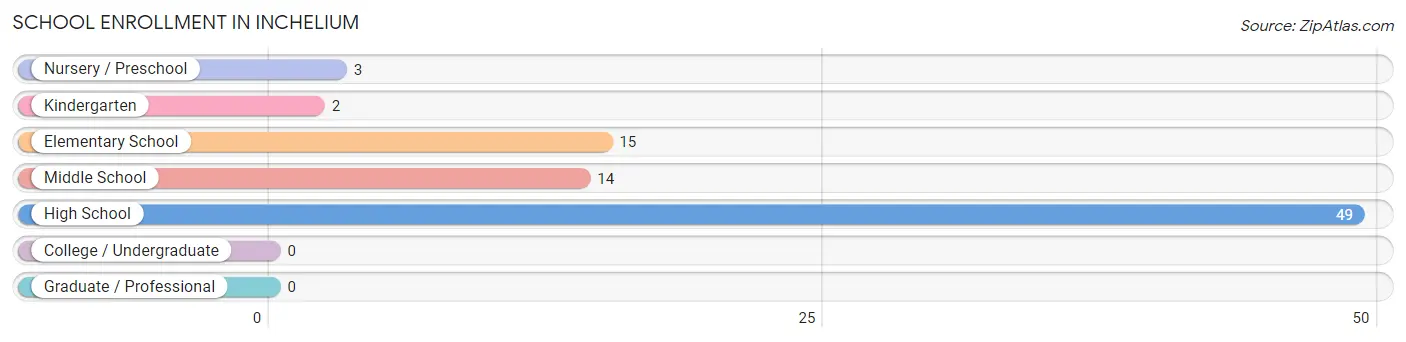
The most common levels of schooling among the 83 students in Inchelium are high school (49 | 59.0%), elementary school (15 | 18.1%), and middle school (14 | 16.9%).
| School Level | # Students | % Students |
| Nursery / Preschool | 3 | 3.6% |
| Kindergarten | 2 | 2.4% |
| Elementary School | 15 | 18.1% |
| Middle School | 14 | 16.9% |
| High School | 49 | 59.0% |
| College / Undergraduate | 0 | 0.0% |
| Graduate / Professional | 0 | 0.0% |
| Total | 83 | 100.0% |
School Enrollment by Age by Funding Source in Inchelium
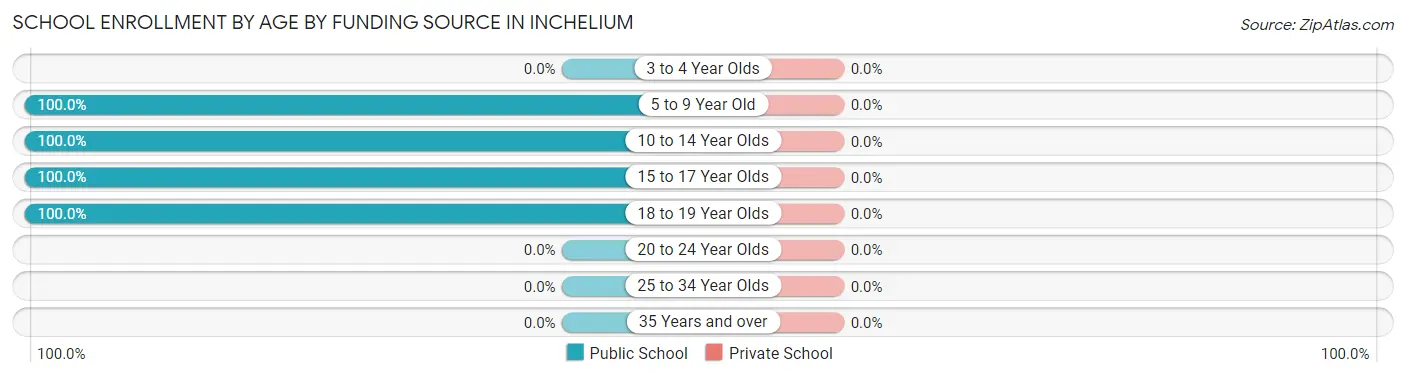
| Age Bracket | Public School | Private School |
| 3 to 4 Year Olds | 0 (0.0%) | 0 (0.0%) |
| 5 to 9 Year Old | 15 (100.0%) | 0 (0.0%) |
| 10 to 14 Year Olds | 20 (100.0%) | 0 (0.0%) |
| 15 to 17 Year Olds | 39 (100.0%) | 0 (0.0%) |
| 18 to 19 Year Olds | 9 (100.0%) | 0 (0.0%) |
| 20 to 24 Year Olds | 0 (0.0%) | 0 (0.0%) |
| 25 to 34 Year Olds | 0 (0.0%) | 0 (0.0%) |
| 35 Years and over | 0 (0.0%) | 0 (0.0%) |
| Total | 83 (100.0%) | 0 (0.0%) |
Educational Attainment by Field of Study in Inchelium
Education (26 | 72.2%), psychology (7 | 19.4%), and bio, nature & agricultural (3 | 8.3%) are the most common fields of study among 36 individuals in Inchelium who have obtained a bachelor's degree or higher.
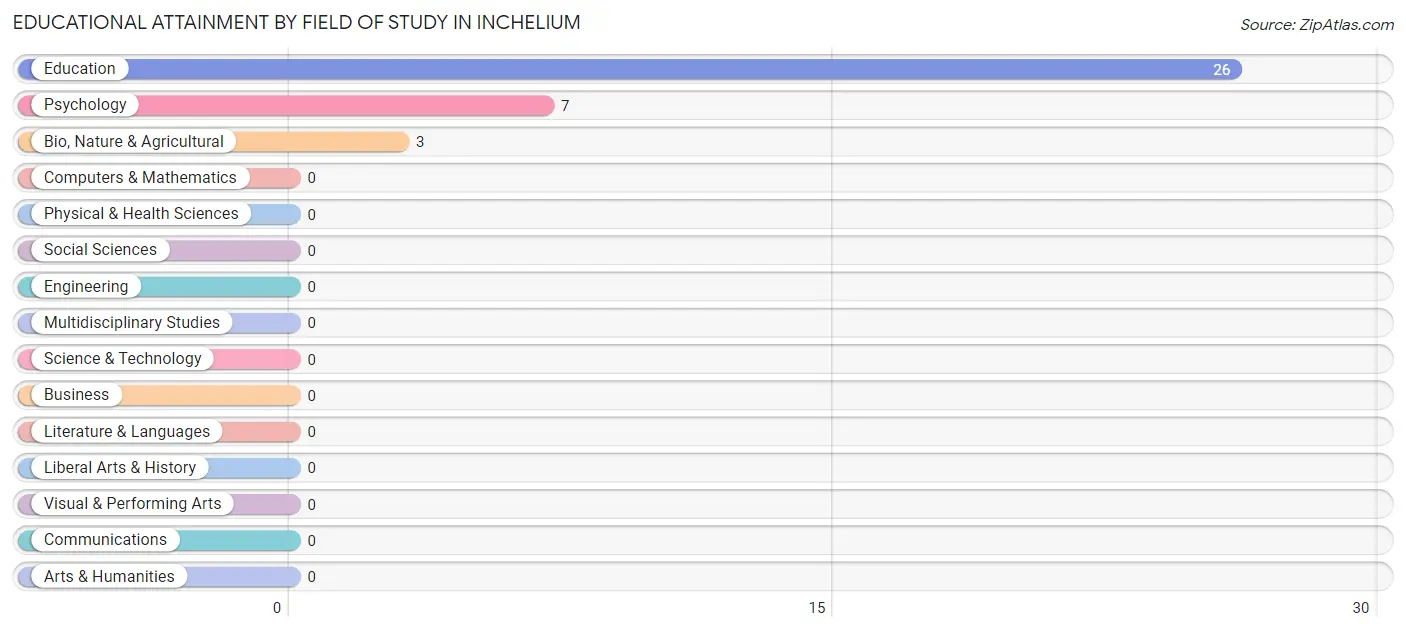
| Field of Study | # Graduates | % Graduates |
| Computers & Mathematics | 0 | 0.0% |
| Bio, Nature & Agricultural | 3 | 8.3% |
| Physical & Health Sciences | 0 | 0.0% |
| Psychology | 7 | 19.4% |
| Social Sciences | 0 | 0.0% |
| Engineering | 0 | 0.0% |
| Multidisciplinary Studies | 0 | 0.0% |
| Science & Technology | 0 | 0.0% |
| Business | 0 | 0.0% |
| Education | 26 | 72.2% |
| Literature & Languages | 0 | 0.0% |
| Liberal Arts & History | 0 | 0.0% |
| Visual & Performing Arts | 0 | 0.0% |
| Communications | 0 | 0.0% |
| Arts & Humanities | 0 | 0.0% |
| Total | 36 | 100.0% |
Transportation & Commute in Inchelium
Vehicle Availability by Sex in Inchelium
The most prevalent vehicle ownership categories in Inchelium are males with 5 or more vehicles (34, accounting for 31.5%) and females with 5 or more vehicles (16, making up 70.8%).
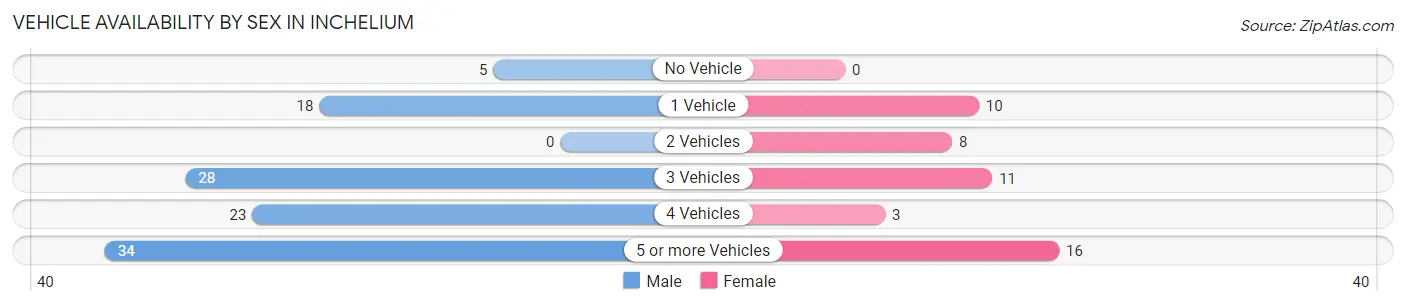
| Vehicles Available | Male | Female |
| No Vehicle | 5 (4.6%) | 0 (0.0%) |
| 1 Vehicle | 18 (16.7%) | 10 (20.8%) |
| 2 Vehicles | 0 (0.0%) | 8 (16.7%) |
| 3 Vehicles | 28 (25.9%) | 11 (22.9%) |
| 4 Vehicles | 23 (21.3%) | 3 (6.2%) |
| 5 or more Vehicles | 34 (31.5%) | 16 (33.3%) |
| Total | 108 (100.0%) | 48 (100.0%) |
Commute Time in Inchelium
The most frequently occuring commute durations in Inchelium are 5 to 9 minutes (37 commuters, 27.2%), 60 to 89 minutes (31 commuters, 22.8%), and 10 to 14 minutes (19 commuters, 14.0%).
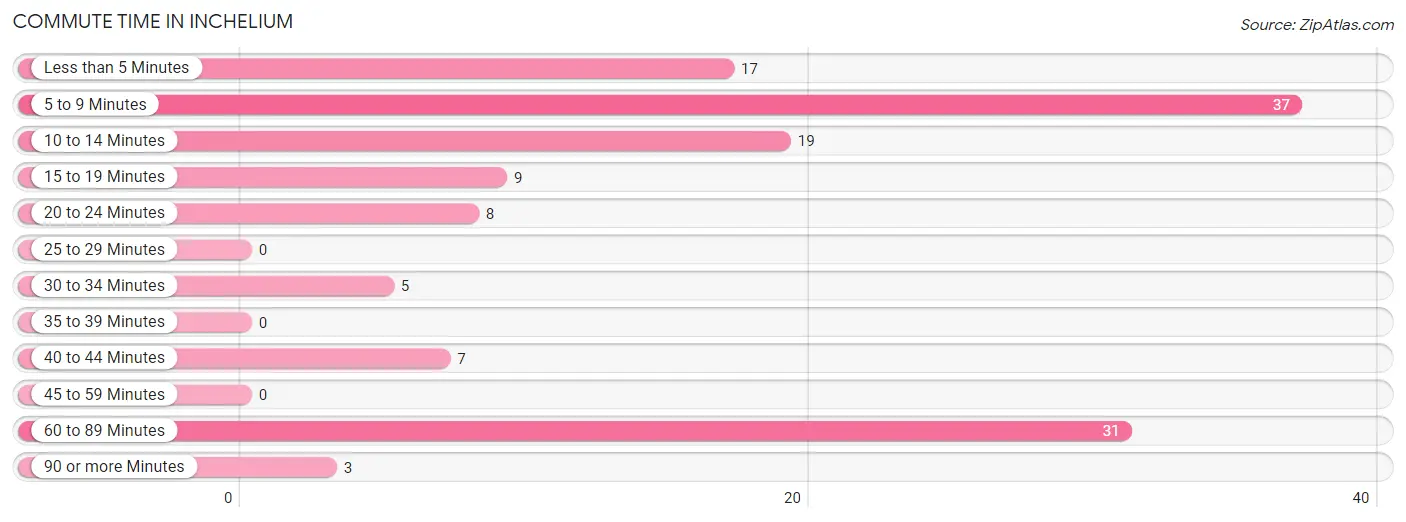
| Commute Time | # Commuters | % Commuters |
| Less than 5 Minutes | 17 | 12.5% |
| 5 to 9 Minutes | 37 | 27.2% |
| 10 to 14 Minutes | 19 | 14.0% |
| 15 to 19 Minutes | 9 | 6.6% |
| 20 to 24 Minutes | 8 | 5.9% |
| 25 to 29 Minutes | 0 | 0.0% |
| 30 to 34 Minutes | 5 | 3.7% |
| 35 to 39 Minutes | 0 | 0.0% |
| 40 to 44 Minutes | 7 | 5.1% |
| 45 to 59 Minutes | 0 | 0.0% |
| 60 to 89 Minutes | 31 | 22.8% |
| 90 or more Minutes | 3 | 2.2% |
Commute Time by Sex in Inchelium
The most common commute times in Inchelium are 5 to 9 minutes (22 commuters, 25.0%) for males and 60 to 89 minutes (21 commuters, 43.8%) for females.
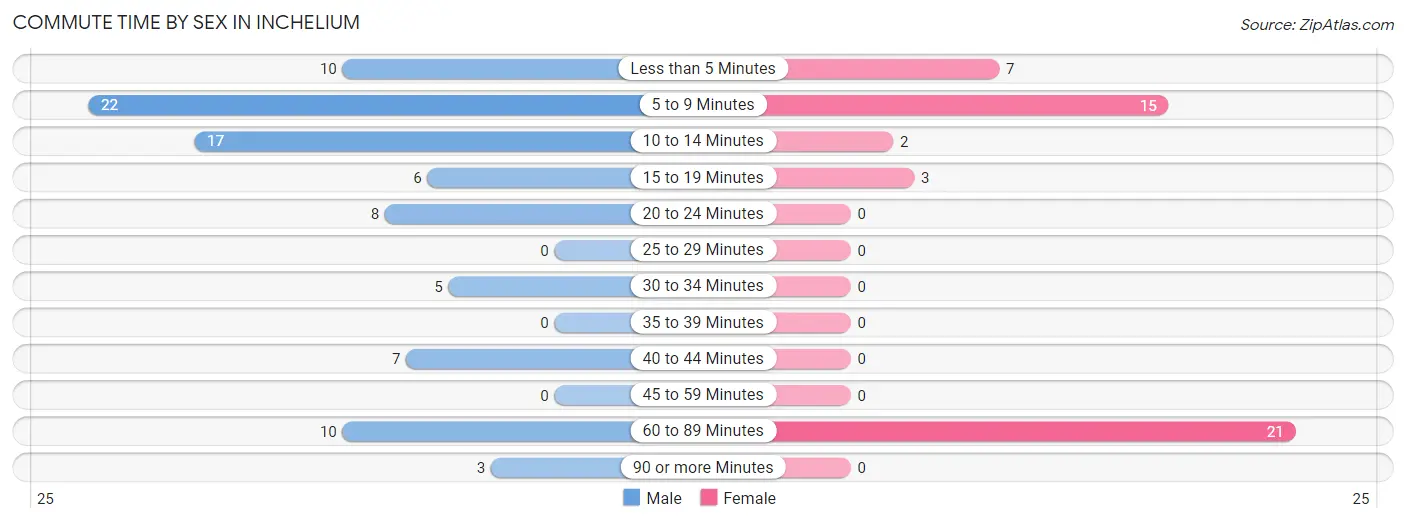
| Commute Time | Male | Female |
| Less than 5 Minutes | 10 (11.4%) | 7 (14.6%) |
| 5 to 9 Minutes | 22 (25.0%) | 15 (31.2%) |
| 10 to 14 Minutes | 17 (19.3%) | 2 (4.2%) |
| 15 to 19 Minutes | 6 (6.8%) | 3 (6.2%) |
| 20 to 24 Minutes | 8 (9.1%) | 0 (0.0%) |
| 25 to 29 Minutes | 0 (0.0%) | 0 (0.0%) |
| 30 to 34 Minutes | 5 (5.7%) | 0 (0.0%) |
| 35 to 39 Minutes | 0 (0.0%) | 0 (0.0%) |
| 40 to 44 Minutes | 7 (8.0%) | 0 (0.0%) |
| 45 to 59 Minutes | 0 (0.0%) | 0 (0.0%) |
| 60 to 89 Minutes | 10 (11.4%) | 21 (43.8%) |
| 90 or more Minutes | 3 (3.4%) | 0 (0.0%) |
Time of Departure to Work by Sex in Inchelium
The most frequent times of departure to work in Inchelium are 7:00 AM to 7:29 AM (28, 31.8%) for males and 6:30 AM to 6:59 AM (12, 25.0%) for females.
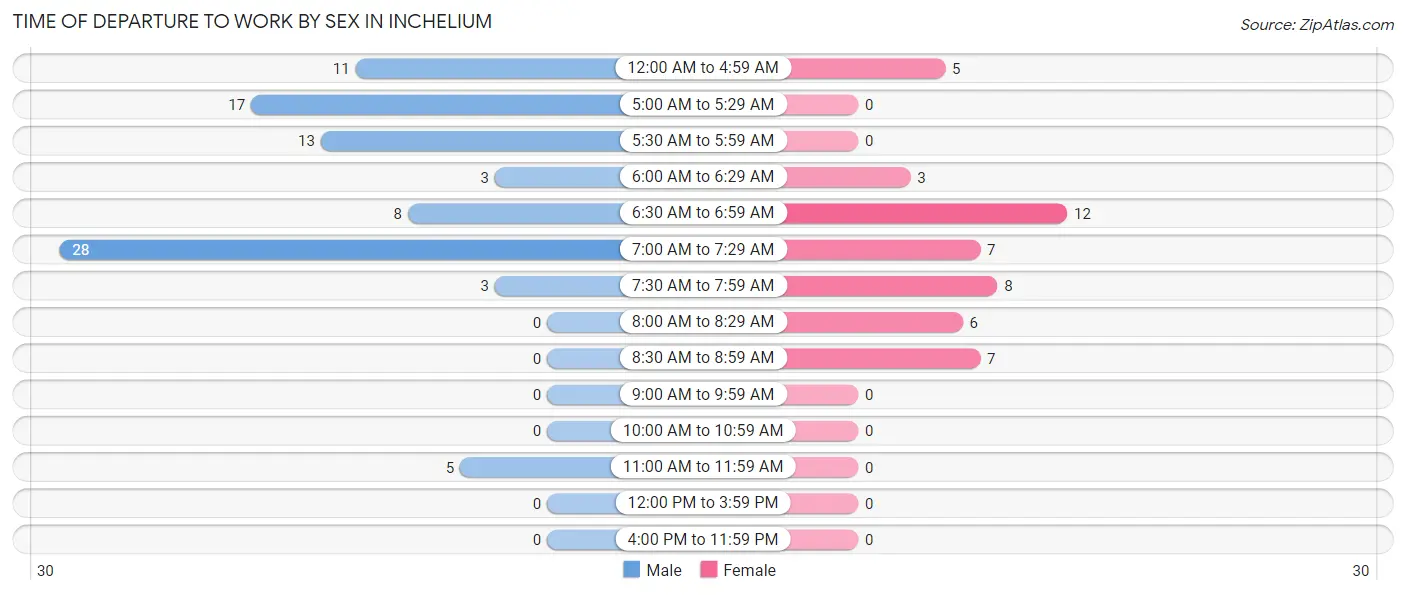
| Time of Departure | Male | Female |
| 12:00 AM to 4:59 AM | 11 (12.5%) | 5 (10.4%) |
| 5:00 AM to 5:29 AM | 17 (19.3%) | 0 (0.0%) |
| 5:30 AM to 5:59 AM | 13 (14.8%) | 0 (0.0%) |
| 6:00 AM to 6:29 AM | 3 (3.4%) | 3 (6.2%) |
| 6:30 AM to 6:59 AM | 8 (9.1%) | 12 (25.0%) |
| 7:00 AM to 7:29 AM | 28 (31.8%) | 7 (14.6%) |
| 7:30 AM to 7:59 AM | 3 (3.4%) | 8 (16.7%) |
| 8:00 AM to 8:29 AM | 0 (0.0%) | 6 (12.5%) |
| 8:30 AM to 8:59 AM | 0 (0.0%) | 7 (14.6%) |
| 9:00 AM to 9:59 AM | 0 (0.0%) | 0 (0.0%) |
| 10:00 AM to 10:59 AM | 0 (0.0%) | 0 (0.0%) |
| 11:00 AM to 11:59 AM | 5 (5.7%) | 0 (0.0%) |
| 12:00 PM to 3:59 PM | 0 (0.0%) | 0 (0.0%) |
| 4:00 PM to 11:59 PM | 0 (0.0%) | 0 (0.0%) |
| Total | 88 (100.0%) | 48 (100.0%) |
Housing Occupancy in Inchelium
Occupancy by Ownership in Inchelium
Of the total 120 dwellings in Inchelium, owner-occupied units account for 66 (55.0%), while renter-occupied units make up 54 (45.0%).
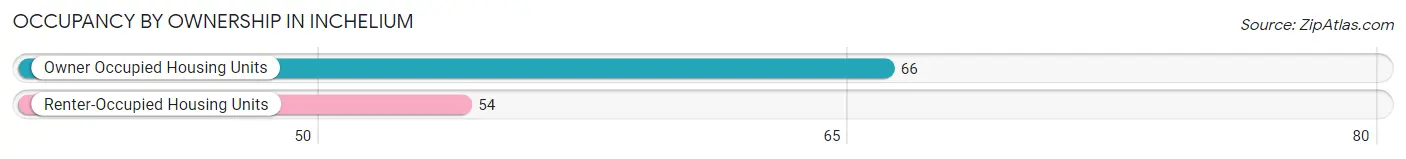
| Occupancy | # Housing Units | % Housing Units |
| Owner Occupied Housing Units | 66 | 55.0% |
| Renter-Occupied Housing Units | 54 | 45.0% |
| Total Occupied Housing Units | 120 | 100.0% |
Occupancy by Household Size in Inchelium
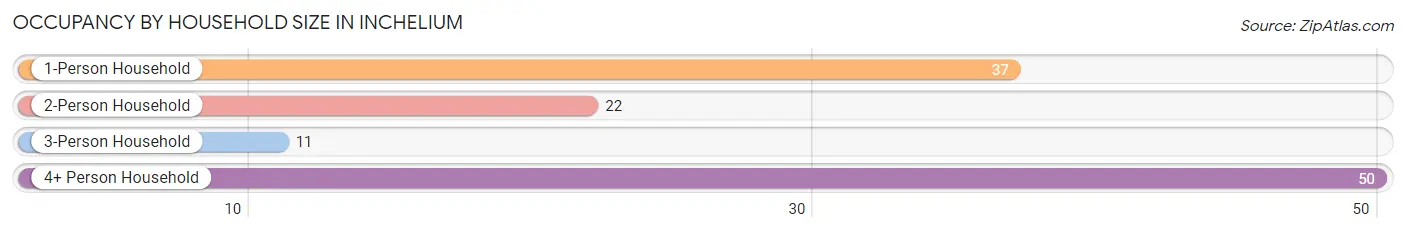
| Household Size | # Housing Units | % Housing Units |
| 1-Person Household | 37 | 30.8% |
| 2-Person Household | 22 | 18.3% |
| 3-Person Household | 11 | 9.2% |
| 4+ Person Household | 50 | 41.7% |
| Total Housing Units | 120 | 100.0% |
Occupancy by Ownership by Household Size in Inchelium
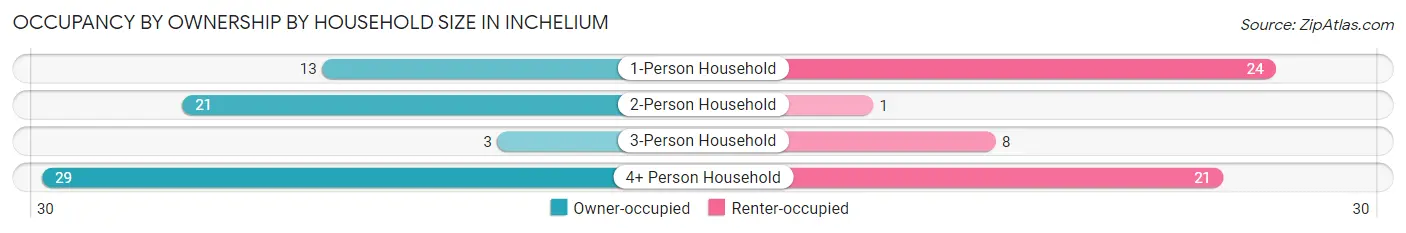
| Household Size | Owner-occupied | Renter-occupied |
| 1-Person Household | 13 (35.1%) | 24 (64.9%) |
| 2-Person Household | 21 (95.5%) | 1 (4.5%) |
| 3-Person Household | 3 (27.3%) | 8 (72.7%) |
| 4+ Person Household | 29 (58.0%) | 21 (42.0%) |
| Total Housing Units | 66 (55.0%) | 54 (45.0%) |
Occupancy by Educational Attainment in Inchelium
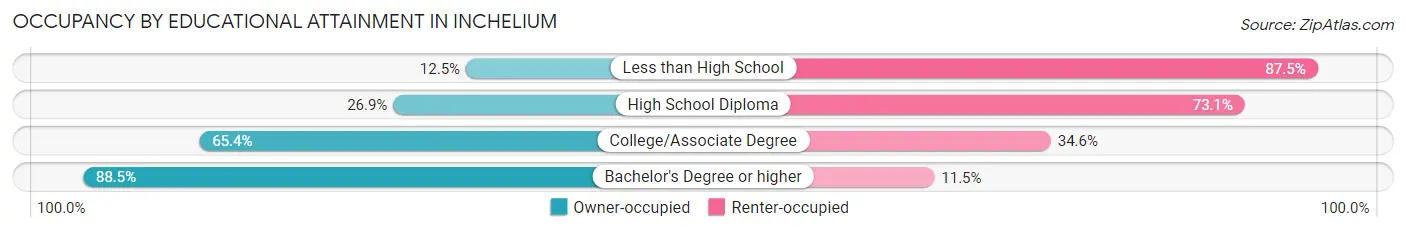
| Household Size | Owner-occupied | Renter-occupied |
| Less than High School | 2 (12.5%) | 14 (87.5%) |
| High School Diploma | 7 (26.9%) | 19 (73.1%) |
| College/Associate Degree | 34 (65.4%) | 18 (34.6%) |
| Bachelor's Degree or higher | 23 (88.5%) | 3 (11.5%) |
Occupancy by Age of Householder in Inchelium
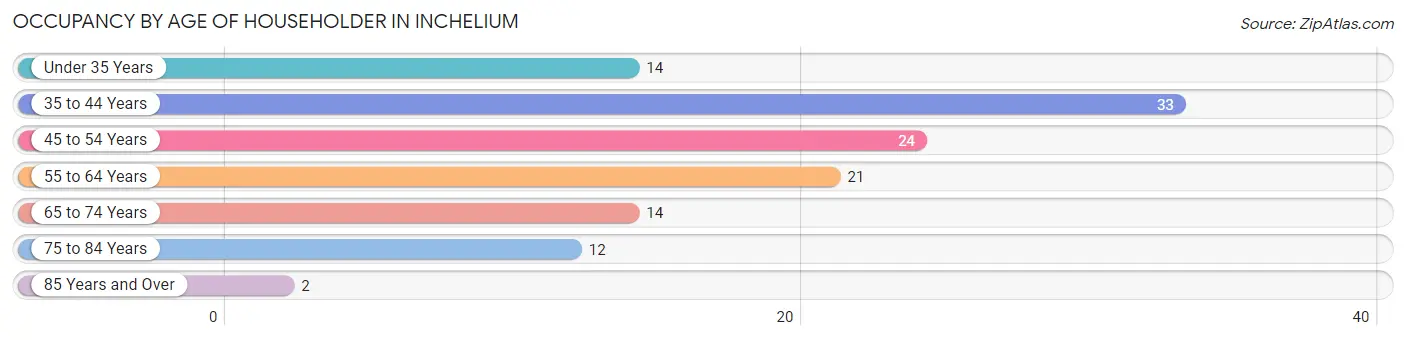
| Age Bracket | # Households | % Households |
| Under 35 Years | 14 | 11.7% |
| 35 to 44 Years | 33 | 27.5% |
| 45 to 54 Years | 24 | 20.0% |
| 55 to 64 Years | 21 | 17.5% |
| 65 to 74 Years | 14 | 11.7% |
| 75 to 84 Years | 12 | 10.0% |
| 85 Years and Over | 2 | 1.7% |
| Total | 120 | 100.0% |
Housing Finances in Inchelium
Median Income by Occupancy in Inchelium
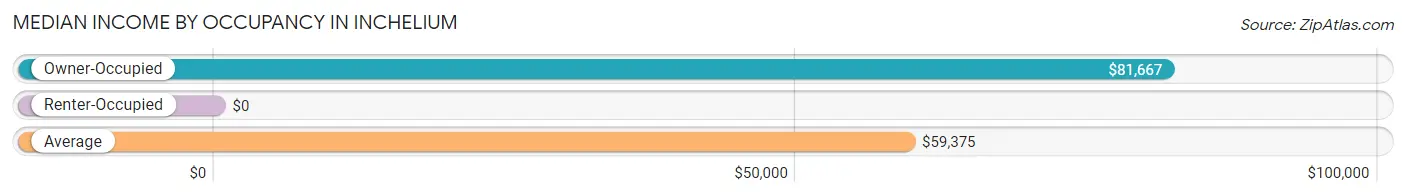
| Occupancy Type | # Households | Median Income |
| Owner-Occupied | 66 (55.0%) | $81,667 |
| Renter-Occupied | 54 (45.0%) | $0 |
| Average | 120 (100.0%) | $59,375 |
Occupancy by Householder Income Bracket in Inchelium
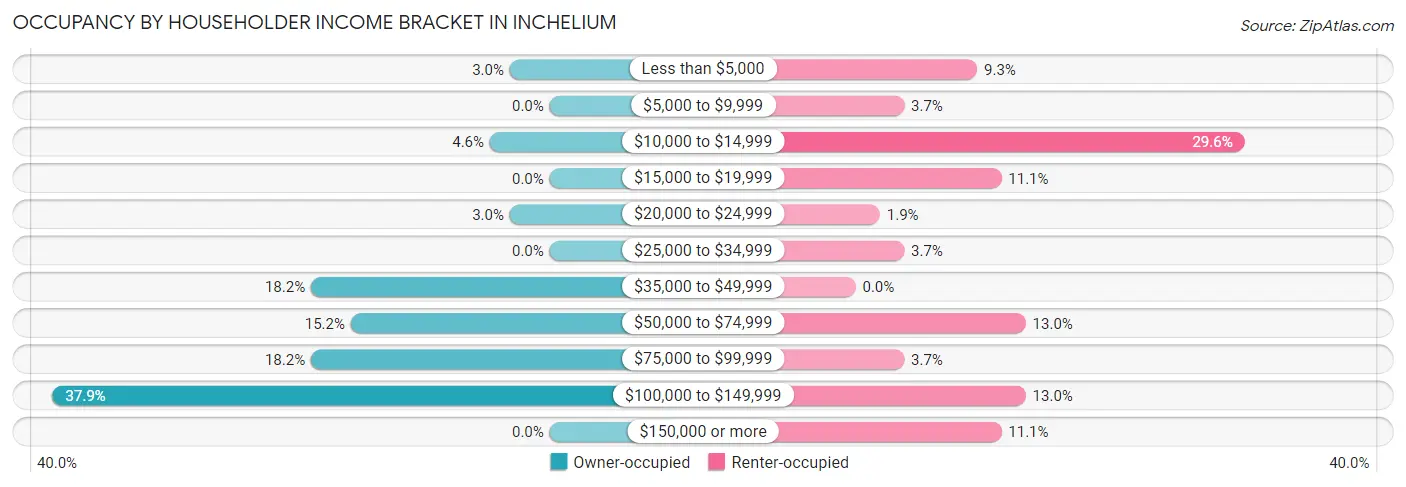
| Income Bracket | Owner-occupied | Renter-occupied |
| Less than $5,000 | 2 (3.0%) | 5 (9.3%) |
| $5,000 to $9,999 | 0 (0.0%) | 2 (3.7%) |
| $10,000 to $14,999 | 3 (4.5%) | 16 (29.6%) |
| $15,000 to $19,999 | 0 (0.0%) | 6 (11.1%) |
| $20,000 to $24,999 | 2 (3.0%) | 1 (1.8%) |
| $25,000 to $34,999 | 0 (0.0%) | 2 (3.7%) |
| $35,000 to $49,999 | 12 (18.2%) | 0 (0.0%) |
| $50,000 to $74,999 | 10 (15.1%) | 7 (13.0%) |
| $75,000 to $99,999 | 12 (18.2%) | 2 (3.7%) |
| $100,000 to $149,999 | 25 (37.9%) | 7 (13.0%) |
| $150,000 or more | 0 (0.0%) | 6 (11.1%) |
| Total | 66 (100.0%) | 54 (100.0%) |
Monthly Housing Cost Tiers in Inchelium
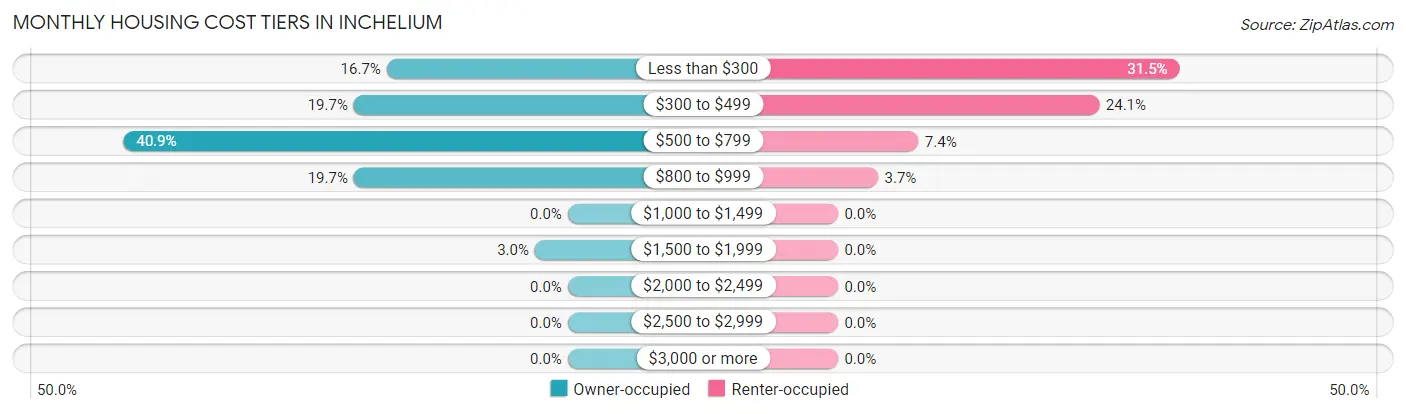
| Monthly Cost | Owner-occupied | Renter-occupied |
| Less than $300 | 11 (16.7%) | 17 (31.5%) |
| $300 to $499 | 13 (19.7%) | 13 (24.1%) |
| $500 to $799 | 27 (40.9%) | 4 (7.4%) |
| $800 to $999 | 13 (19.7%) | 2 (3.7%) |
| $1,000 to $1,499 | 0 (0.0%) | 0 (0.0%) |
| $1,500 to $1,999 | 2 (3.0%) | 0 (0.0%) |
| $2,000 to $2,499 | 0 (0.0%) | 0 (0.0%) |
| $2,500 to $2,999 | 0 (0.0%) | 0 (0.0%) |
| $3,000 or more | 0 (0.0%) | 0 (0.0%) |
| Total | 66 (100.0%) | 54 (100.0%) |
Physical Housing Characteristics in Inchelium
Housing Structures in Inchelium
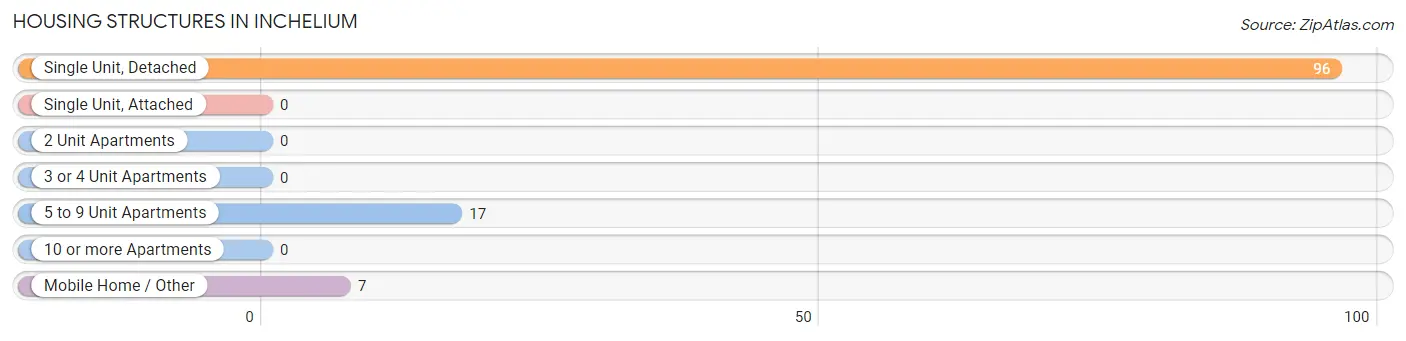
| Structure Type | # Housing Units | % Housing Units |
| Single Unit, Detached | 96 | 80.0% |
| Single Unit, Attached | 0 | 0.0% |
| 2 Unit Apartments | 0 | 0.0% |
| 3 or 4 Unit Apartments | 0 | 0.0% |
| 5 to 9 Unit Apartments | 17 | 14.2% |
| 10 or more Apartments | 0 | 0.0% |
| Mobile Home / Other | 7 | 5.8% |
| Total | 120 | 100.0% |
Housing Structures by Occupancy in Inchelium
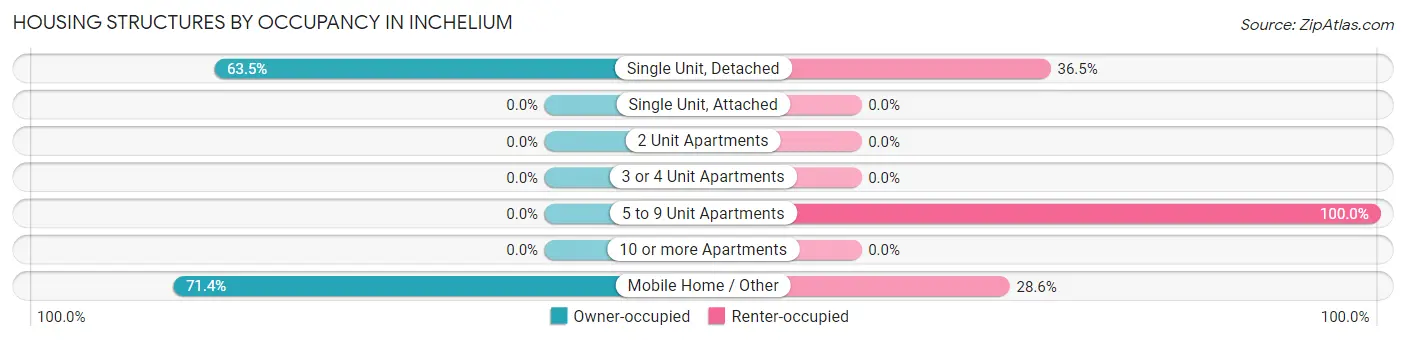
| Structure Type | Owner-occupied | Renter-occupied |
| Single Unit, Detached | 61 (63.5%) | 35 (36.5%) |
| Single Unit, Attached | 0 (0.0%) | 0 (0.0%) |
| 2 Unit Apartments | 0 (0.0%) | 0 (0.0%) |
| 3 or 4 Unit Apartments | 0 (0.0%) | 0 (0.0%) |
| 5 to 9 Unit Apartments | 0 (0.0%) | 17 (100.0%) |
| 10 or more Apartments | 0 (0.0%) | 0 (0.0%) |
| Mobile Home / Other | 5 (71.4%) | 2 (28.6%) |
| Total | 66 (55.0%) | 54 (45.0%) |
Housing Structures by Number of Rooms in Inchelium
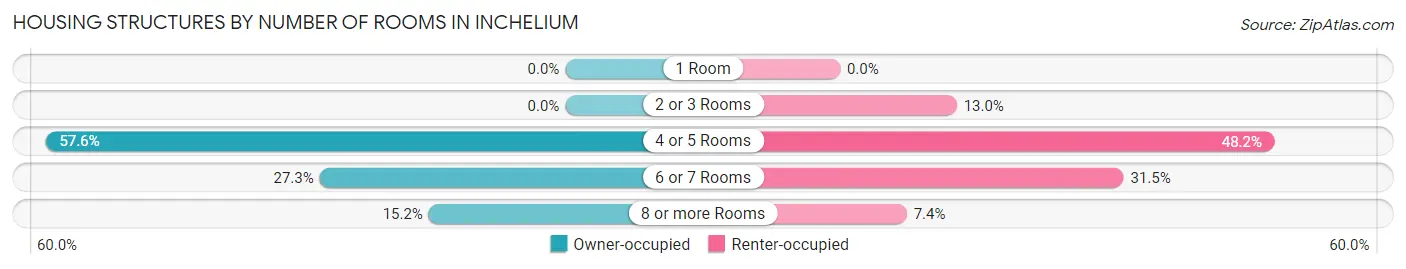
| Number of Rooms | Owner-occupied | Renter-occupied |
| 1 Room | 0 (0.0%) | 0 (0.0%) |
| 2 or 3 Rooms | 0 (0.0%) | 7 (13.0%) |
| 4 or 5 Rooms | 38 (57.6%) | 26 (48.1%) |
| 6 or 7 Rooms | 18 (27.3%) | 17 (31.5%) |
| 8 or more Rooms | 10 (15.1%) | 4 (7.4%) |
| Total | 66 (100.0%) | 54 (100.0%) |
Housing Structure by Heating Type in Inchelium
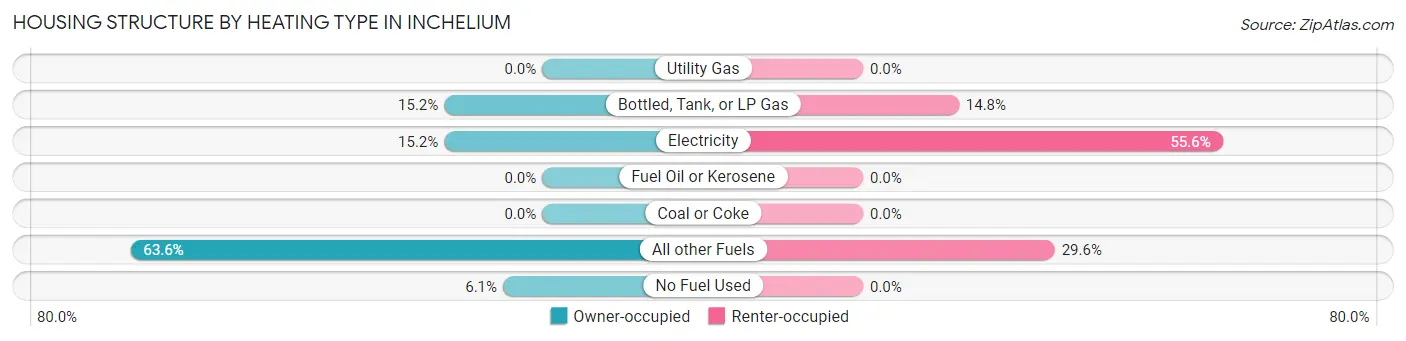
| Heating Type | Owner-occupied | Renter-occupied |
| Utility Gas | 0 (0.0%) | 0 (0.0%) |
| Bottled, Tank, or LP Gas | 10 (15.1%) | 8 (14.8%) |
| Electricity | 10 (15.1%) | 30 (55.6%) |
| Fuel Oil or Kerosene | 0 (0.0%) | 0 (0.0%) |
| Coal or Coke | 0 (0.0%) | 0 (0.0%) |
| All other Fuels | 42 (63.6%) | 16 (29.6%) |
| No Fuel Used | 4 (6.1%) | 0 (0.0%) |
| Total | 66 (100.0%) | 54 (100.0%) |
Household Vehicle Usage in Inchelium
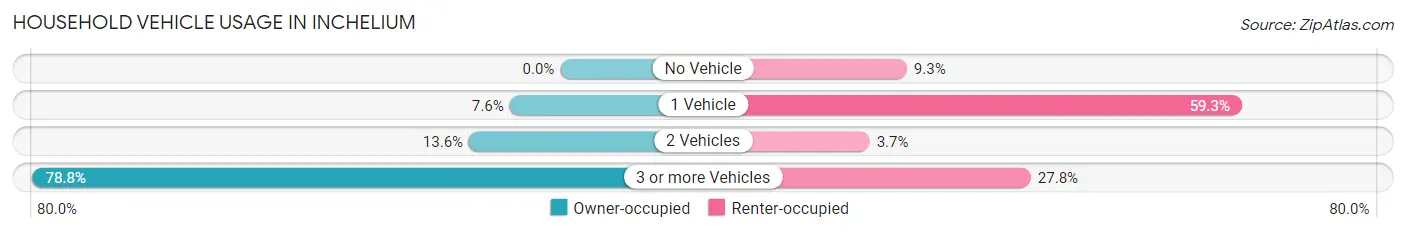
| Vehicles per Household | Owner-occupied | Renter-occupied |
| No Vehicle | 0 (0.0%) | 5 (9.3%) |
| 1 Vehicle | 5 (7.6%) | 32 (59.3%) |
| 2 Vehicles | 9 (13.6%) | 2 (3.7%) |
| 3 or more Vehicles | 52 (78.8%) | 15 (27.8%) |
| Total | 66 (100.0%) | 54 (100.0%) |
Real Estate & Mortgages in Inchelium
Real Estate and Mortgage Overview in Inchelium
| Characteristic | Without Mortgage | With Mortgage |
| Housing Units | 30 | 36 |
| Median Property Value | $271,400 | $144,600 |
| Median Household Income | $65,625 | $0 |
| Monthly Housing Costs | $427 | $0 |
| Real Estate Taxes | $1,688 | $35 |
Property Value by Mortgage Status in Inchelium
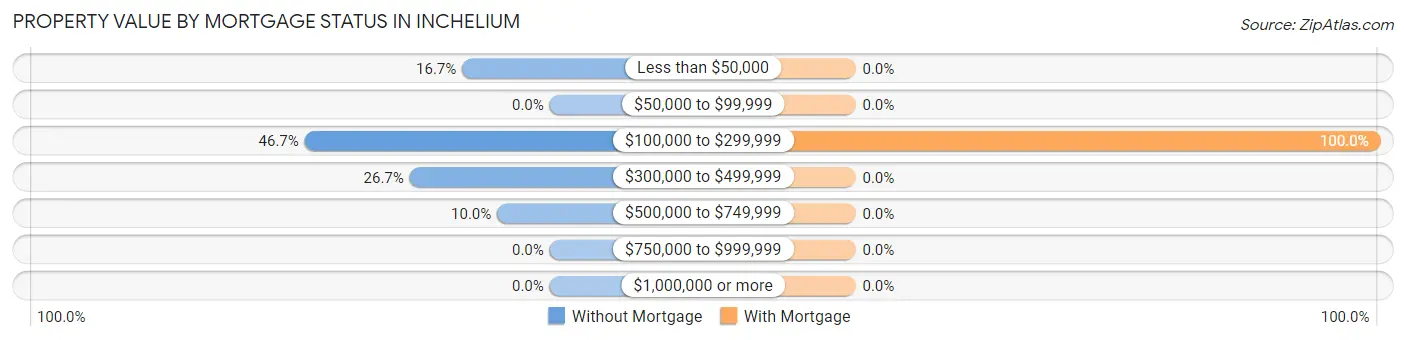
| Property Value | Without Mortgage | With Mortgage |
| Less than $50,000 | 5 (16.7%) | 0 (0.0%) |
| $50,000 to $99,999 | 0 (0.0%) | 0 (0.0%) |
| $100,000 to $299,999 | 14 (46.7%) | 36 (100.0%) |
| $300,000 to $499,999 | 8 (26.7%) | 0 (0.0%) |
| $500,000 to $749,999 | 3 (10.0%) | 0 (0.0%) |
| $750,000 to $999,999 | 0 (0.0%) | 0 (0.0%) |
| $1,000,000 or more | 0 (0.0%) | 0 (0.0%) |
| Total | 30 (100.0%) | 36 (100.0%) |
Household Income by Mortgage Status in Inchelium
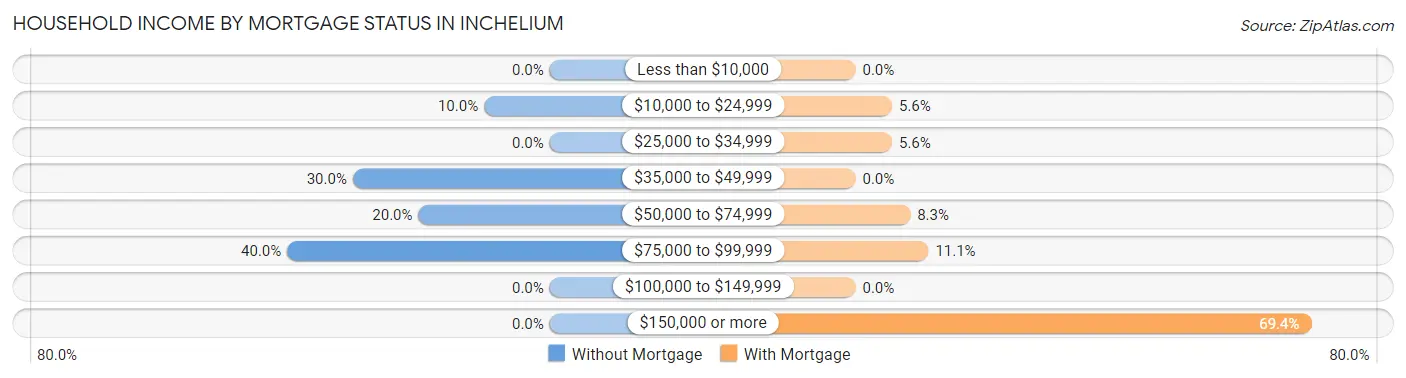
| Household Income | Without Mortgage | With Mortgage |
| Less than $10,000 | 0 (0.0%) | 0 (0.0%) |
| $10,000 to $24,999 | 3 (10.0%) | 2 (5.6%) |
| $25,000 to $34,999 | 0 (0.0%) | 2 (5.6%) |
| $35,000 to $49,999 | 9 (30.0%) | 0 (0.0%) |
| $50,000 to $74,999 | 6 (20.0%) | 3 (8.3%) |
| $75,000 to $99,999 | 12 (40.0%) | 4 (11.1%) |
| $100,000 to $149,999 | 0 (0.0%) | 0 (0.0%) |
| $150,000 or more | 0 (0.0%) | 25 (69.4%) |
| Total | 30 (100.0%) | 36 (100.0%) |
Property Value to Household Income Ratio in Inchelium
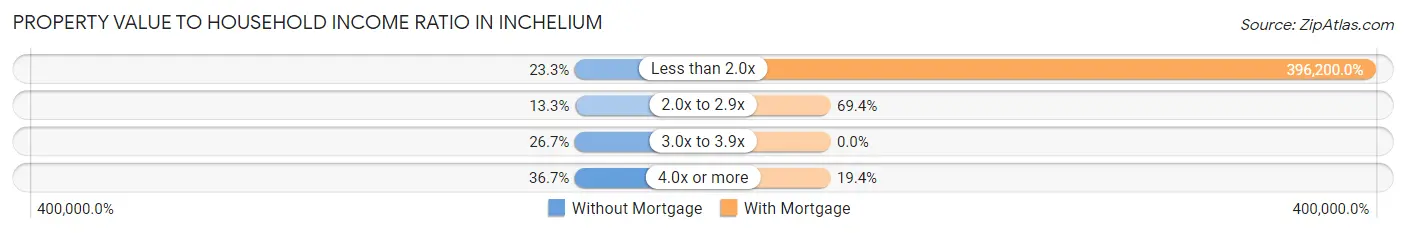
| Value-to-Income Ratio | Without Mortgage | With Mortgage |
| Less than 2.0x | 7 (23.3%) | 142,632 (396,200.0%) |
| 2.0x to 2.9x | 4 (13.3%) | 25 (69.4%) |
| 3.0x to 3.9x | 8 (26.7%) | 0 (0.0%) |
| 4.0x or more | 11 (36.7%) | 7 (19.4%) |
| Total | 30 (100.0%) | 36 (100.0%) |
Real Estate Taxes by Mortgage Status in Inchelium
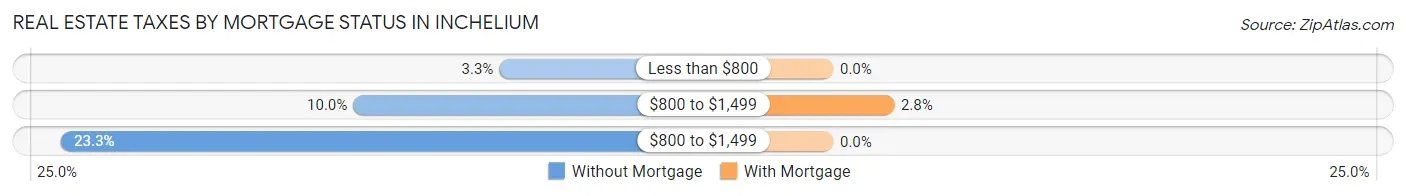
| Property Taxes | Without Mortgage | With Mortgage |
| Less than $800 | 1 (3.3%) | 0 (0.0%) |
| $800 to $1,499 | 3 (10.0%) | 1 (2.8%) |
| $800 to $1,499 | 7 (23.3%) | 0 (0.0%) |
| Total | 30 (100.0%) | 36 (100.0%) |
Health & Disability in Inchelium
Health Insurance Coverage by Age in Inchelium
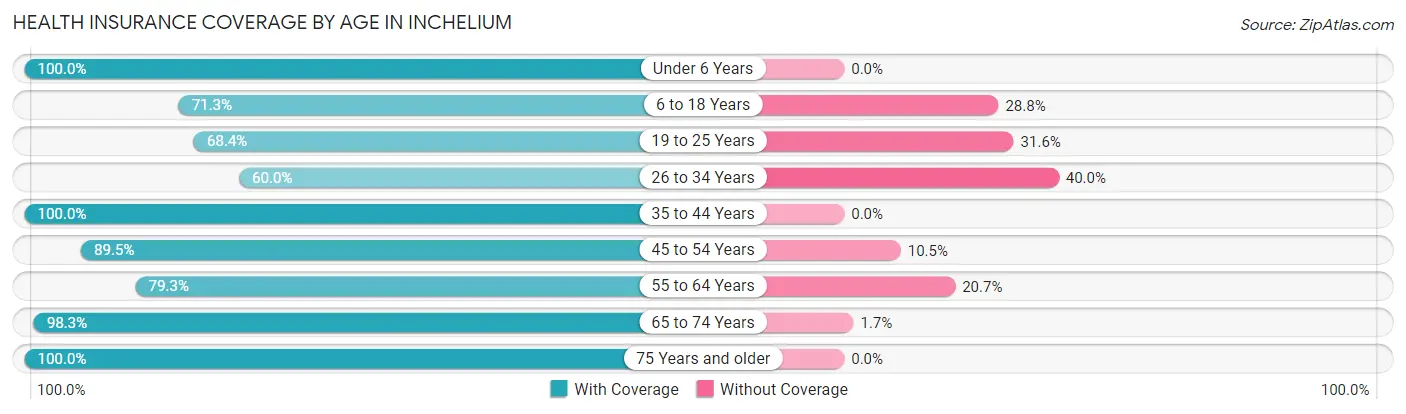
| Age Bracket | With Coverage | Without Coverage |
| Under 6 Years | 17 (100.0%) | 0 (0.0%) |
| 6 to 18 Years | 57 (71.3%) | 23 (28.7%) |
| 19 to 25 Years | 13 (68.4%) | 6 (31.6%) |
| 26 to 34 Years | 18 (60.0%) | 12 (40.0%) |
| 35 to 44 Years | 53 (100.0%) | 0 (0.0%) |
| 45 to 54 Years | 34 (89.5%) | 4 (10.5%) |
| 55 to 64 Years | 23 (79.3%) | 6 (20.7%) |
| 65 to 74 Years | 57 (98.3%) | 1 (1.7%) |
| 75 Years and older | 14 (100.0%) | 0 (0.0%) |
| Total | 286 (84.6%) | 52 (15.4%) |
Health Insurance Coverage by Citizenship Status in Inchelium
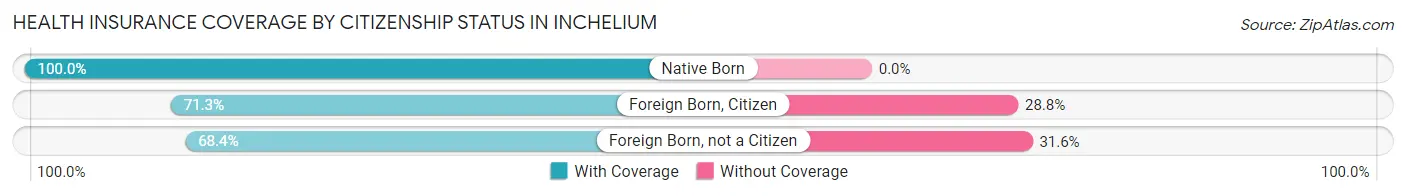
| Citizenship Status | With Coverage | Without Coverage |
| Native Born | 17 (100.0%) | 0 (0.0%) |
| Foreign Born, Citizen | 57 (71.3%) | 23 (28.7%) |
| Foreign Born, not a Citizen | 13 (68.4%) | 6 (31.6%) |
Health Insurance Coverage by Household Income in Inchelium
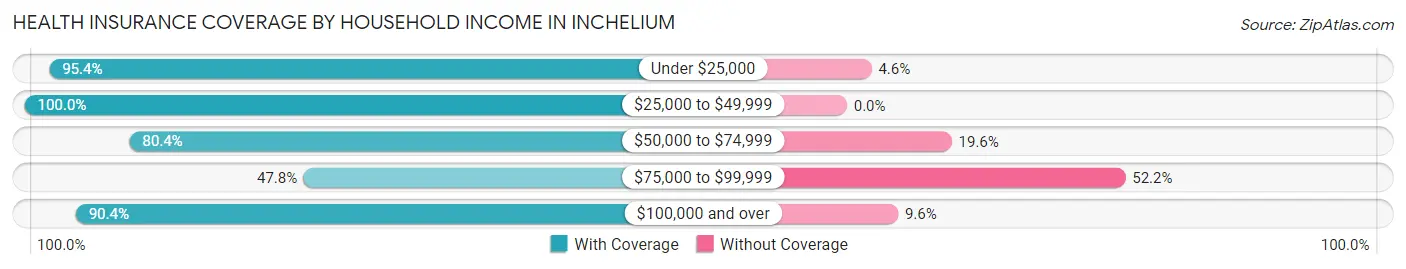
| Household Income | With Coverage | Without Coverage |
| Under $25,000 | 62 (95.4%) | 3 (4.6%) |
| $25,000 to $49,999 | 22 (100.0%) | 0 (0.0%) |
| $50,000 to $74,999 | 45 (80.4%) | 11 (19.6%) |
| $75,000 to $99,999 | 22 (47.8%) | 24 (52.2%) |
| $100,000 and over | 132 (90.4%) | 14 (9.6%) |
Public vs Private Health Insurance Coverage by Age in Inchelium
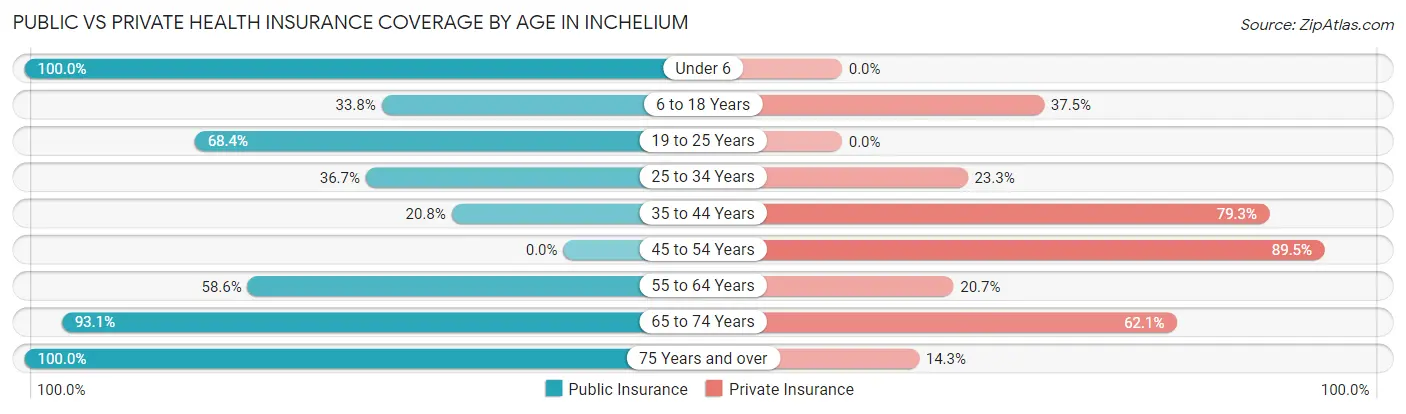
| Age Bracket | Public Insurance | Private Insurance |
| Under 6 | 17 (100.0%) | 0 (0.0%) |
| 6 to 18 Years | 27 (33.8%) | 30 (37.5%) |
| 19 to 25 Years | 13 (68.4%) | 0 (0.0%) |
| 25 to 34 Years | 11 (36.7%) | 7 (23.3%) |
| 35 to 44 Years | 11 (20.7%) | 42 (79.2%) |
| 45 to 54 Years | 0 (0.0%) | 34 (89.5%) |
| 55 to 64 Years | 17 (58.6%) | 6 (20.7%) |
| 65 to 74 Years | 54 (93.1%) | 36 (62.1%) |
| 75 Years and over | 14 (100.0%) | 2 (14.3%) |
| Total | 164 (48.5%) | 157 (46.5%) |
Disability Status by Sex by Age in Inchelium
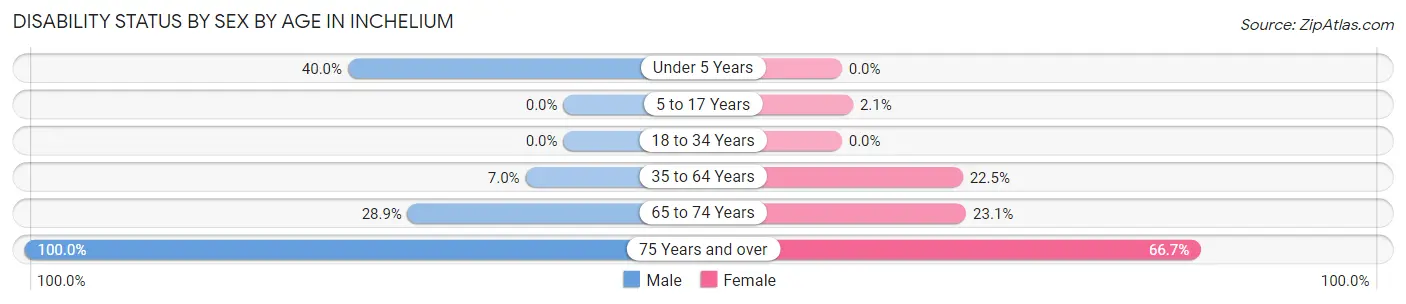
| Age Bracket | Male | Female |
| Under 5 Years | 4 (40.0%) | 0 (0.0%) |
| 5 to 17 Years | 0 (0.0%) | 1 (2.1%) |
| 18 to 34 Years | 0 (0.0%) | 0 (0.0%) |
| 35 to 64 Years | 5 (7.0%) | 11 (22.5%) |
| 65 to 74 Years | 13 (28.9%) | 3 (23.1%) |
| 75 Years and over | 8 (100.0%) | 4 (66.7%) |
Disability Class by Sex by Age in Inchelium
Disability Class: Hearing Difficulty
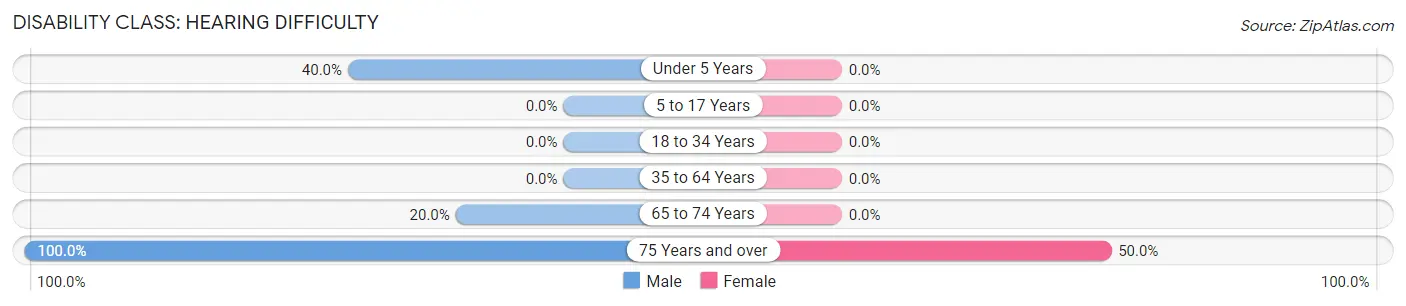
| Age Bracket | Male | Female |
| Under 5 Years | 4 (40.0%) | 0 (0.0%) |
| 5 to 17 Years | 0 (0.0%) | 0 (0.0%) |
| 18 to 34 Years | 0 (0.0%) | 0 (0.0%) |
| 35 to 64 Years | 0 (0.0%) | 0 (0.0%) |
| 65 to 74 Years | 9 (20.0%) | 0 (0.0%) |
| 75 Years and over | 8 (100.0%) | 3 (50.0%) |
Disability Class: Vision Difficulty
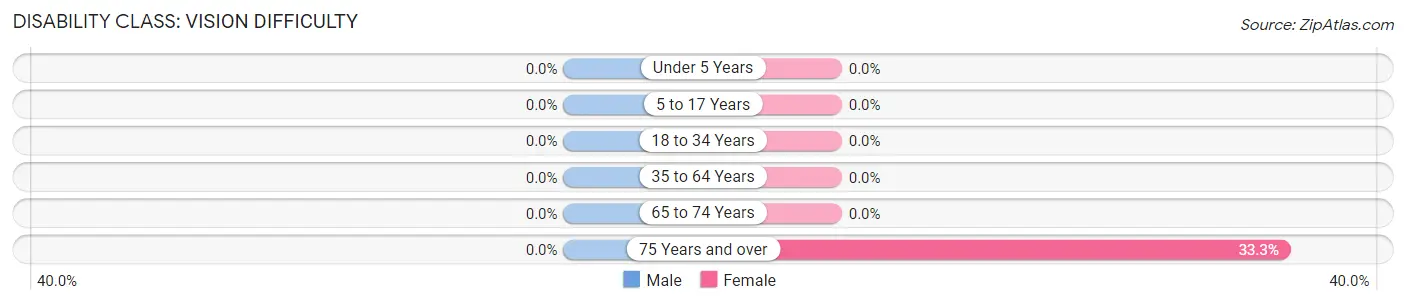
| Age Bracket | Male | Female |
| Under 5 Years | 0 (0.0%) | 0 (0.0%) |
| 5 to 17 Years | 0 (0.0%) | 0 (0.0%) |
| 18 to 34 Years | 0 (0.0%) | 0 (0.0%) |
| 35 to 64 Years | 0 (0.0%) | 0 (0.0%) |
| 65 to 74 Years | 0 (0.0%) | 0 (0.0%) |
| 75 Years and over | 0 (0.0%) | 2 (33.3%) |
Disability Class: Cognitive Difficulty
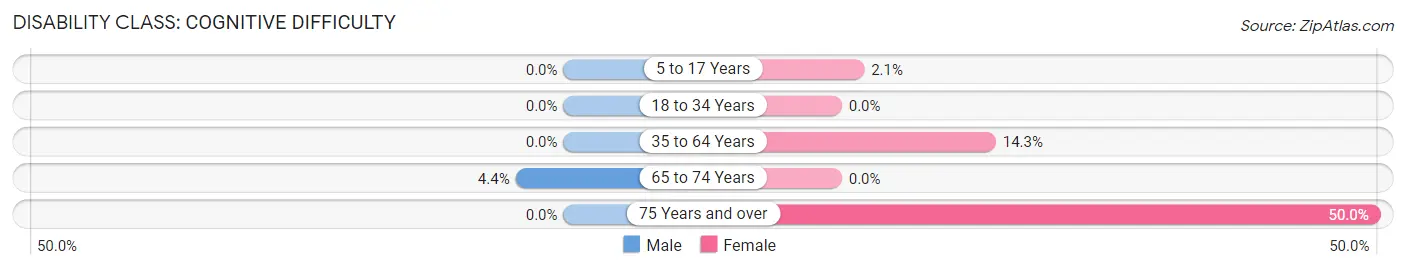
| Age Bracket | Male | Female |
| 5 to 17 Years | 0 (0.0%) | 1 (2.1%) |
| 18 to 34 Years | 0 (0.0%) | 0 (0.0%) |
| 35 to 64 Years | 0 (0.0%) | 7 (14.3%) |
| 65 to 74 Years | 2 (4.4%) | 0 (0.0%) |
| 75 Years and over | 0 (0.0%) | 3 (50.0%) |
Disability Class: Ambulatory Difficulty
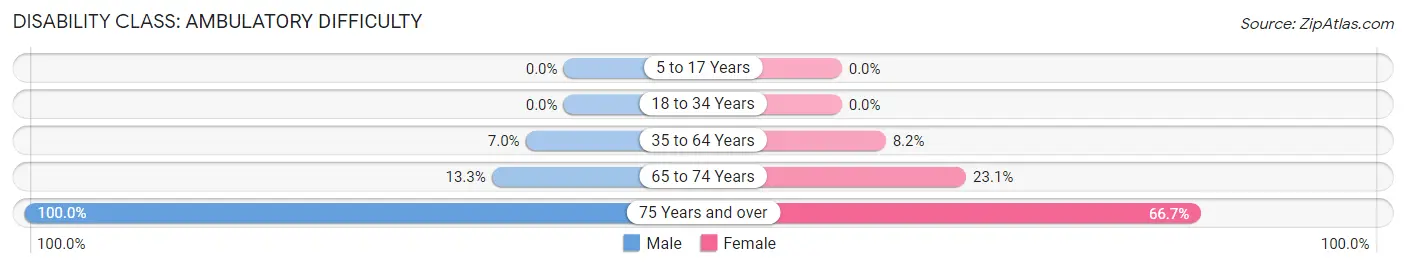
| Age Bracket | Male | Female |
| 5 to 17 Years | 0 (0.0%) | 0 (0.0%) |
| 18 to 34 Years | 0 (0.0%) | 0 (0.0%) |
| 35 to 64 Years | 5 (7.0%) | 4 (8.2%) |
| 65 to 74 Years | 6 (13.3%) | 3 (23.1%) |
| 75 Years and over | 8 (100.0%) | 4 (66.7%) |
Disability Class: Self-Care Difficulty
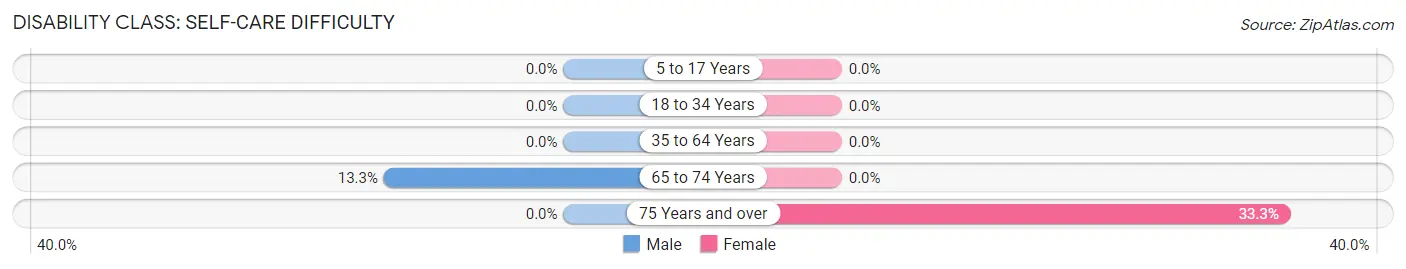
| Age Bracket | Male | Female |
| 5 to 17 Years | 0 (0.0%) | 0 (0.0%) |
| 18 to 34 Years | 0 (0.0%) | 0 (0.0%) |
| 35 to 64 Years | 0 (0.0%) | 0 (0.0%) |
| 65 to 74 Years | 6 (13.3%) | 0 (0.0%) |
| 75 Years and over | 0 (0.0%) | 2 (33.3%) |
Technology Access in Inchelium
Computing Device Access in Inchelium
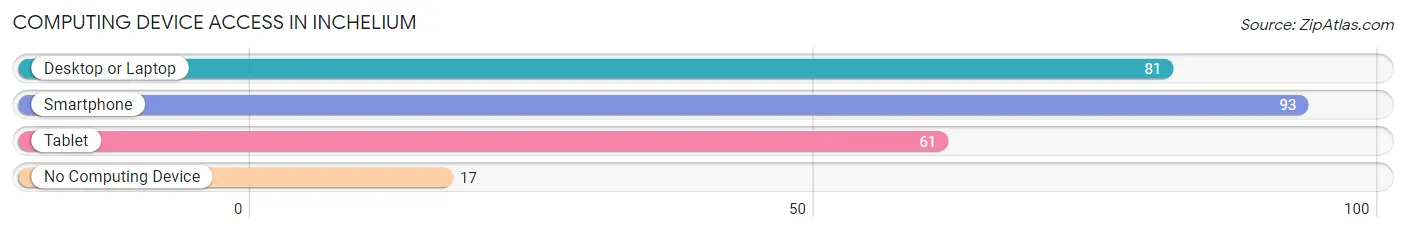
| Device Type | # Households | % Households |
| Desktop or Laptop | 81 | 67.5% |
| Smartphone | 93 | 77.5% |
| Tablet | 61 | 50.8% |
| No Computing Device | 17 | 14.2% |
| Total | 120 | 100.0% |
Internet Access in Inchelium
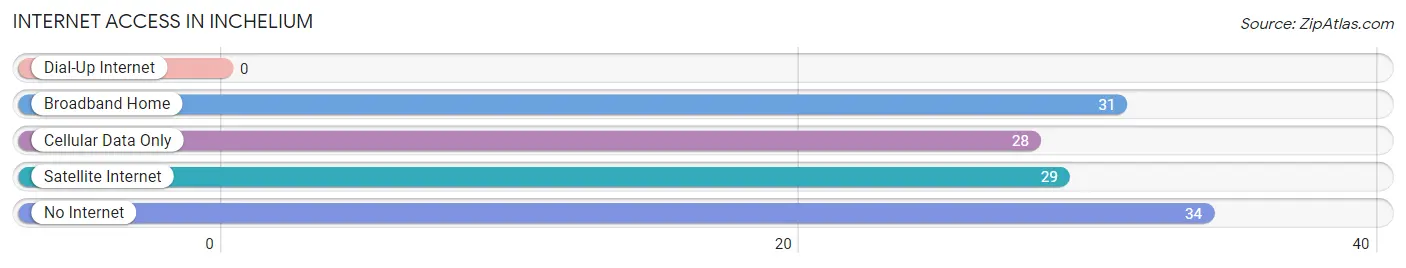
| Internet Type | # Households | % Households |
| Dial-Up Internet | 0 | 0.0% |
| Broadband Home | 31 | 25.8% |
| Cellular Data Only | 28 | 23.3% |
| Satellite Internet | 29 | 24.2% |
| No Internet | 34 | 28.3% |
| Total | 120 | 100.0% |
Inchelium Summary
Inchelium is a small unincorporated community located in Ferry County, Washington, United States. It is situated on the Colville Indian Reservation, along the banks of the Columbia River. The population of Inchelium was estimated to be around 200 in 2020.
History
Inchelium was first settled by the Colville Indians in the late 1800s. The name Inchelium is derived from the Salish word for “place of many fish”, referring to the abundance of salmon in the Columbia River. The Colville Indians were a semi-nomadic tribe that lived in the area for centuries before the arrival of European settlers.
In the early 1900s, the area was opened up to homesteaders and settlers. The first post office was established in Inchelium in 1910. The town was officially incorporated in 1912.
Inchelium was a thriving community in the early 20th century, with a population of over 500 people. The town had a school, a general store, a hotel, and a sawmill. The sawmill was the main source of employment for the town’s residents.
In the 1950s, the sawmill closed and the population of Inchelium began to decline. The town’s population was estimated to be around 200 in 2020.
Geography
Inchelium is located in the northeast corner of Ferry County, Washington, along the banks of the Columbia River. The town is situated on the Colville Indian Reservation, which covers over 1.4 million acres of land.
The town is surrounded by rolling hills and mountains, with the Columbia River to the east and the Kettle River to the west. The area is known for its scenic beauty and is a popular destination for outdoor recreation.
Economy
Inchelium’s economy is largely based on agriculture and tourism. The town is home to several farms, which produce a variety of crops, including wheat, barley, and hay. The town is also home to several wineries, which produce a variety of wines.
Tourism is an important part of the local economy. The town is a popular destination for outdoor recreation, such as fishing, hunting, and camping. The nearby Columbia River is a popular destination for boating and other water activities.
Demographics
Inchelium’s population was estimated to be around 200 in 2020. The town is predominantly white, with a small Native American population. The median household income is around $30,000, and the median home value is around $100,000.
The town is served by the Inchelium School District, which includes an elementary school, a middle school, and a high school. The town is also home to a public library and a community center.
Inchelium is a small, rural community with a rich history and a bright future. The town is a popular destination for outdoor recreation and is home to a variety of businesses and services. The town’s population is estimated to be around 200 in 2020, and the median household income is around $30,000. Inchelium is a great place to live, work, and play.
Common Questions
What is Per Capita Income in Inchelium?
Per Capita income in Inchelium is $31,517.
What is the Median Family Income in Inchelium?
Median Family Income in Inchelium is $82,083.
What is the Median Household income in Inchelium?
Median Household Income in Inchelium is $59,375.
What is Inequality or Gini Index in Inchelium?
Inequality or Gini Index in Inchelium is 0.42.
What is the Total Population of Inchelium?
Total Population of Inchelium is 338.
What is the Total Male Population of Inchelium?
Total Male Population of Inchelium is 188.
What is the Total Female Population of Inchelium?
Total Female Population of Inchelium is 150.
What is the Ratio of Males per 100 Females in Inchelium?
There are 125.33 Males per 100 Females in Inchelium.
What is the Ratio of Females per 100 Males in Inchelium?
There are 79.79 Females per 100 Males in Inchelium.
What is the Median Population Age in Inchelium?
Median Population Age in Inchelium is 40.6 Years.
What is the Average Family Size in Inchelium
Average Family Size in Inchelium is 3.4 People.
What is the Average Household Size in Inchelium
Average Household Size in Inchelium is 2.8 People.
How Large is the Labor Force in Inchelium?
There are 179 People in the Labor Forcein in Inchelium.
What is the Percentage of People in the Labor Force in Inchelium?
65.1% of People are in the Labor Force in Inchelium.
What is the Unemployment Rate in Inchelium?
Unemployment Rate in Inchelium is 12.8%.