Garfield, WA Map & Demographics
Garfield Map
Garfield Overview
$32,212
PER CAPITA INCOME
$83,250
AVG FAMILY INCOME
$64,583
AVG HOUSEHOLD INCOME
31.2%
WAGE / INCOME GAP [ % ]
68.8¢/ $1
WAGE / INCOME GAP [ $ ]
0.43
INEQUALITY / GINI INDEX
586
TOTAL POPULATION
246
MALE POPULATION
340
FEMALE POPULATION
72.35
MALES / 100 FEMALES
138.21
FEMALES / 100 MALES
39.6
MEDIAN AGE
3.0
AVG FAMILY SIZE
2.5
AVG HOUSEHOLD SIZE
255
LABOR FORCE [ PEOPLE ]
57.0%
PERCENT IN LABOR FORCE
3.5%
UNEMPLOYMENT RATE
Garfield Zip Codes
Garfield Area Codes
Income in Garfield
Income Overview in Garfield
Per Capita Income in Garfield is $32,212, while median incomes of families and households are $83,250 and $64,583 respectively.
| Characteristic | Number | Measure |
| Per Capita Income | 586 | $32,212 |
| Median Family Income | 166 | $83,250 |
| Mean Family Income | 166 | $94,685 |
| Median Household Income | 230 | $64,583 |
| Mean Household Income | 230 | $78,867 |
| Income Deficit | 166 | $0 |
| Wage / Income Gap (%) | 586 | 31.22% |
| Wage / Income Gap ($) | 586 | 68.78¢ per $1 |
| Gini / Inequality Index | 586 | 0.43 |
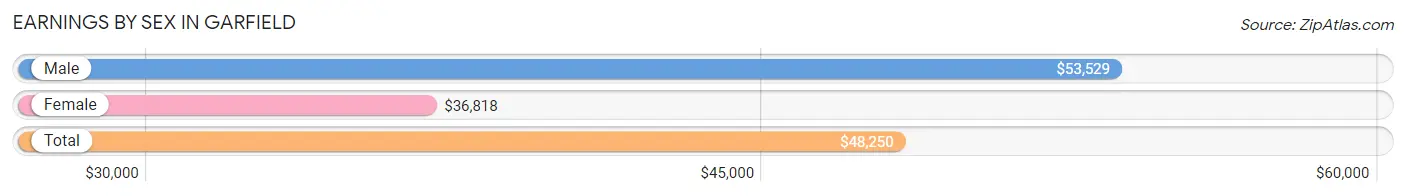
Earnings by Sex in Garfield
Average Earnings in Garfield are $48,250, $53,529 for men and $36,818 for women, a difference of 31.2%.
| Sex | Number | Average Earnings |
| Male | 120 (46.9%) | $53,529 |
| Female | 136 (53.1%) | $36,818 |
| Total | 256 (100.0%) | $48,250 |
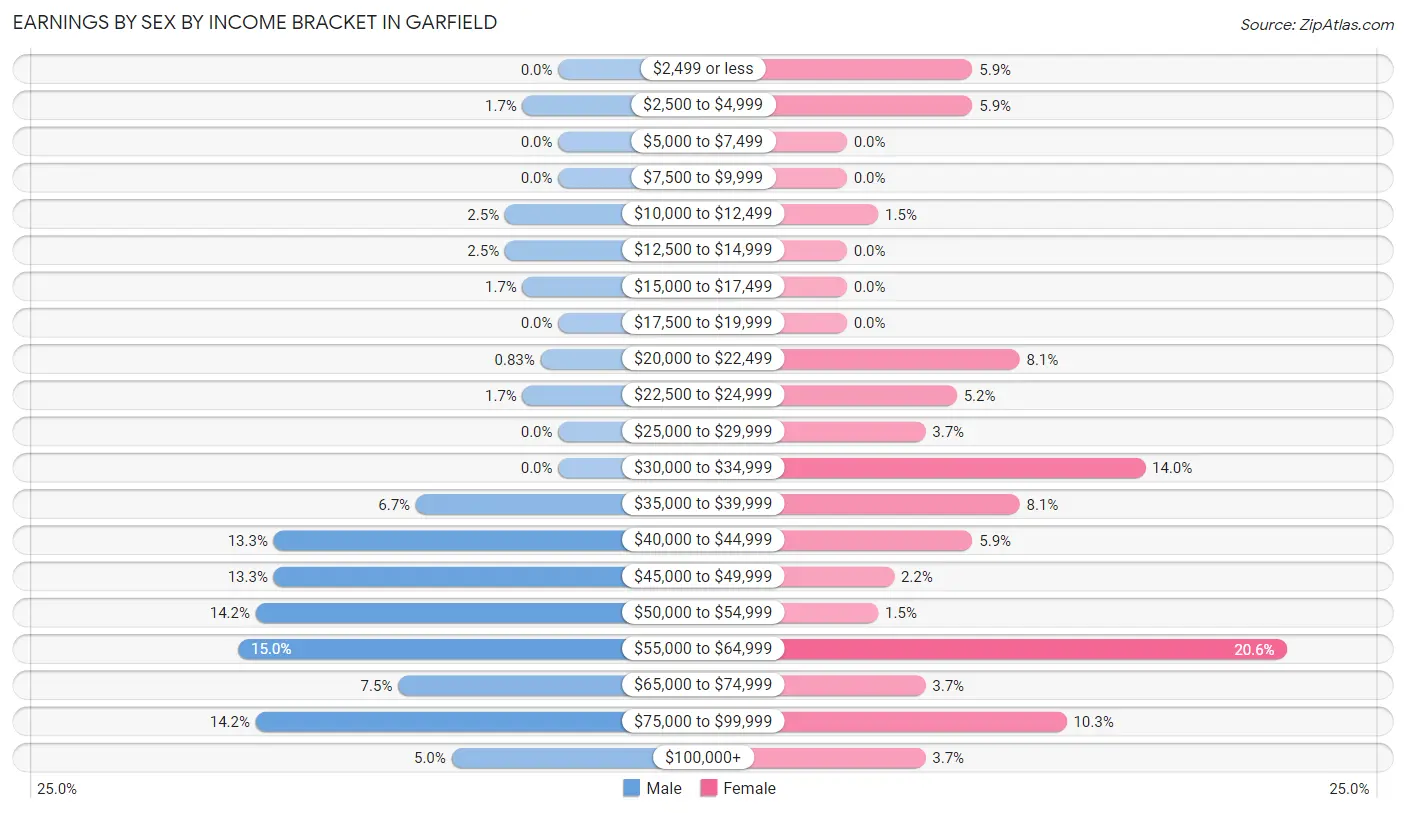
Earnings by Sex by Income Bracket in Garfield
The most common earnings brackets in Garfield are $55,000 to $64,999 for men (18 | 15.0%) and $55,000 to $64,999 for women (28 | 20.6%).
| Income | Male | Female |
| $2,499 or less | 0 (0.0%) | 8 (5.9%) |
| $2,500 to $4,999 | 2 (1.7%) | 8 (5.9%) |
| $5,000 to $7,499 | 0 (0.0%) | 0 (0.0%) |
| $7,500 to $9,999 | 0 (0.0%) | 0 (0.0%) |
| $10,000 to $12,499 | 3 (2.5%) | 2 (1.5%) |
| $12,500 to $14,999 | 3 (2.5%) | 0 (0.0%) |
| $15,000 to $17,499 | 2 (1.7%) | 0 (0.0%) |
| $17,500 to $19,999 | 0 (0.0%) | 0 (0.0%) |
| $20,000 to $22,499 | 1 (0.8%) | 11 (8.1%) |
| $22,500 to $24,999 | 2 (1.7%) | 7 (5.1%) |
| $25,000 to $29,999 | 0 (0.0%) | 5 (3.7%) |
| $30,000 to $34,999 | 0 (0.0%) | 19 (14.0%) |
| $35,000 to $39,999 | 8 (6.7%) | 11 (8.1%) |
| $40,000 to $44,999 | 16 (13.3%) | 8 (5.9%) |
| $45,000 to $49,999 | 16 (13.3%) | 3 (2.2%) |
| $50,000 to $54,999 | 17 (14.2%) | 2 (1.5%) |
| $55,000 to $64,999 | 18 (15.0%) | 28 (20.6%) |
| $65,000 to $74,999 | 9 (7.5%) | 5 (3.7%) |
| $75,000 to $99,999 | 17 (14.2%) | 14 (10.3%) |
| $100,000+ | 6 (5.0%) | 5 (3.7%) |
| Total | 120 (100.0%) | 136 (100.0%) |
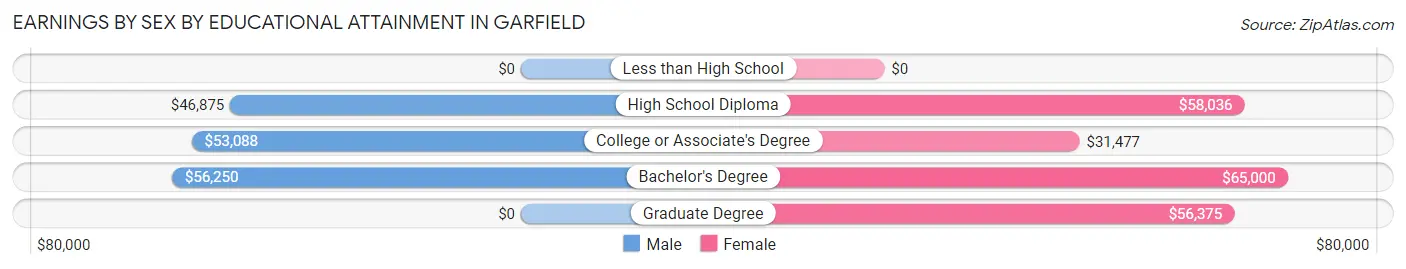
Earnings by Sex by Educational Attainment in Garfield
Average earnings in Garfield are $53,676 for men and $37,386 for women, a difference of 30.3%. Men with an educational attainment of bachelor's degree enjoy the highest average annual earnings of $56,250, while those with high school diploma education earn the least with $46,875. Women with an educational attainment of bachelor's degree earn the most with the average annual earnings of $65,000, while those with college or associate's degree education have the smallest earnings of $31,477.
| Educational Attainment | Male Income | Female Income |
| Less than High School | - | - |
| High School Diploma | $46,875 | $58,036 |
| College or Associate's Degree | $53,088 | $31,477 |
| Bachelor's Degree | $56,250 | $65,000 |
| Graduate Degree | - | - |
| Total | $53,676 | $37,386 |
Family Income in Garfield
Family Income Brackets in Garfield
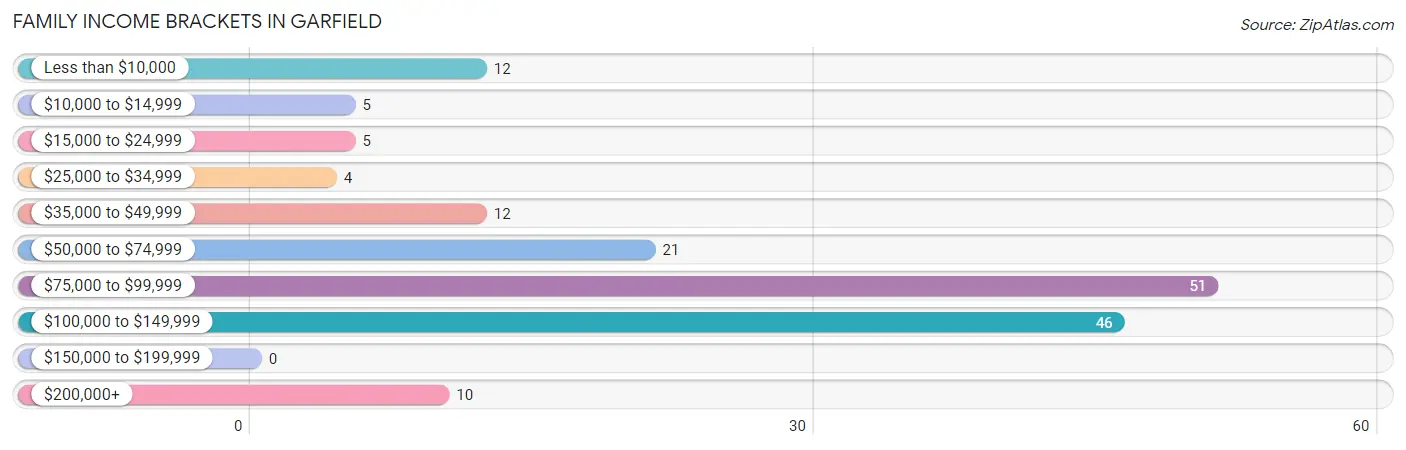
According to the Garfield family income data, there are 51 families falling into the $75,000 to $99,999 income range, which is the most common income bracket and makes up 30.7% of all families.
| Income Bracket | # Families | % Families |
| Less than $10,000 | 12 | 7.2% |
| $10,000 to $14,999 | 5 | 3.0% |
| $15,000 to $24,999 | 5 | 3.0% |
| $25,000 to $34,999 | 4 | 2.4% |
| $35,000 to $49,999 | 12 | 7.2% |
| $50,000 to $74,999 | 21 | 12.7% |
| $75,000 to $99,999 | 51 | 30.7% |
| $100,000 to $149,999 | 46 | 27.7% |
| $150,000 to $199,999 | 0 | 0.0% |
| $200,000+ | 10 | 6.0% |
Family Income by Famaliy Size in Garfield
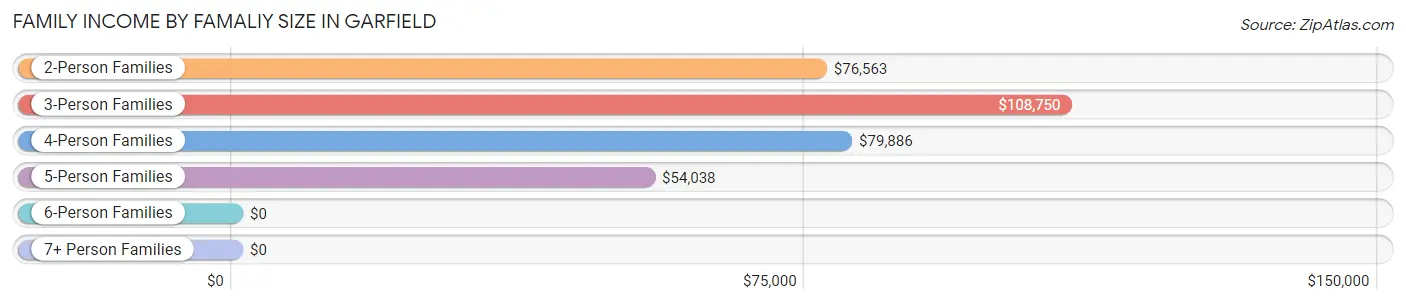
3-person families (42 | 25.3%) account for the highest median family income in Garfield with $108,750 per family, while 2-person families (70 | 42.2%) have the highest median income of $38,282 per family member.
| Income Bracket | # Families | Median Income |
| 2-Person Families | 70 (42.2%) | $76,563 |
| 3-Person Families | 42 (25.3%) | $108,750 |
| 4-Person Families | 35 (21.1%) | $79,886 |
| 5-Person Families | 16 (9.6%) | $54,038 |
| 6-Person Families | 0 (0.0%) | $0 |
| 7+ Person Families | 3 (1.8%) | $0 |
| Total | 166 (100.0%) | $83,250 |
Family Income by Number of Earners in Garfield
| Number of Earners | # Families | Median Income |
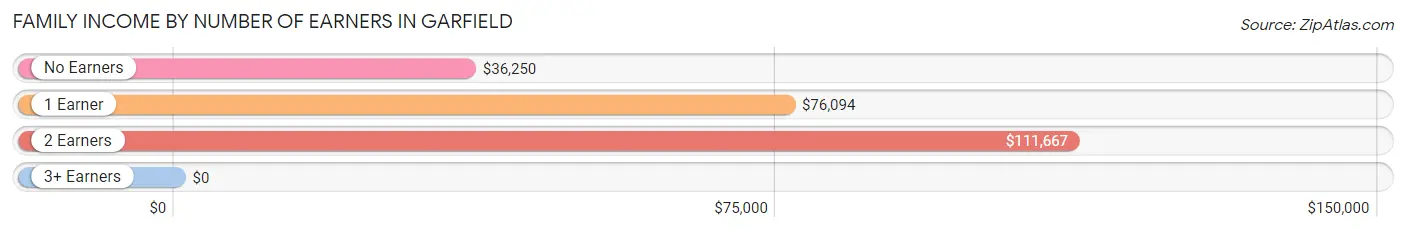
| No Earners | 41 (24.7%) | $36,250 |
| 1 Earner | 45 (27.1%) | $76,094 |
| 2 Earners | 64 (38.6%) | $111,667 |
| 3+ Earners | 16 (9.6%) | $0 |
| Total | 166 (100.0%) | $83,250 |
Household Income in Garfield
Household Income Brackets in Garfield
With 52 households falling in the category, the $75,000 to $99,999 income range is the most frequent in Garfield, accounting for 22.6% of all households.

| Income Bracket | # Households | % Households |
| Less than $10,000 | 11 | 4.8% |
| $10,000 to $14,999 | 23 | 10.0% |
| $15,000 to $24,999 | 10 | 4.3% |
| $25,000 to $34,999 | 20 | 8.7% |
| $35,000 to $49,999 | 22 | 9.6% |
| $50,000 to $74,999 | 32 | 13.9% |
| $75,000 to $99,999 | 52 | 22.6% |
| $100,000 to $149,999 | 50 | 21.7% |
| $150,000 to $199,999 | 0 | 0.0% |
| $200,000+ | 10 | 4.3% |
Household Income by Householder Age in Garfield
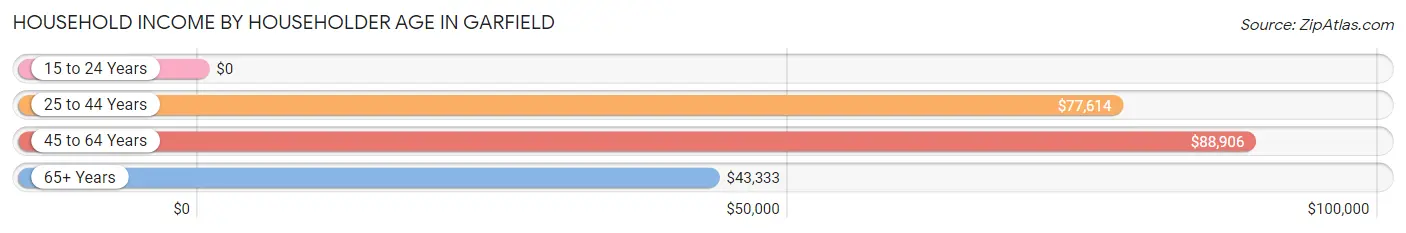
The median household income in Garfield is $64,583, with the highest median household income of $88,906 found in the 45 to 64 years age bracket for the primary householder. A total of 71 households (30.9%) fall into this category.
| Income Bracket | # Households | Median Income |
| 15 to 24 Years | 0 (0.0%) | $0 |
| 25 to 44 Years | 87 (37.8%) | $77,614 |
| 45 to 64 Years | 71 (30.9%) | $88,906 |
| 65+ Years | 72 (31.3%) | $43,333 |
| Total | 230 (100.0%) | $64,583 |
Poverty in Garfield
Income Below Poverty by Sex and Age in Garfield
With 6.1% poverty level for males and 17.9% for females among the residents of Garfield, 45 to 54 year old males and 5 year old females are the most vulnerable to poverty, with 7 males (17.9%) and 3 females (100.0%) in their respective age groups living below the poverty level.
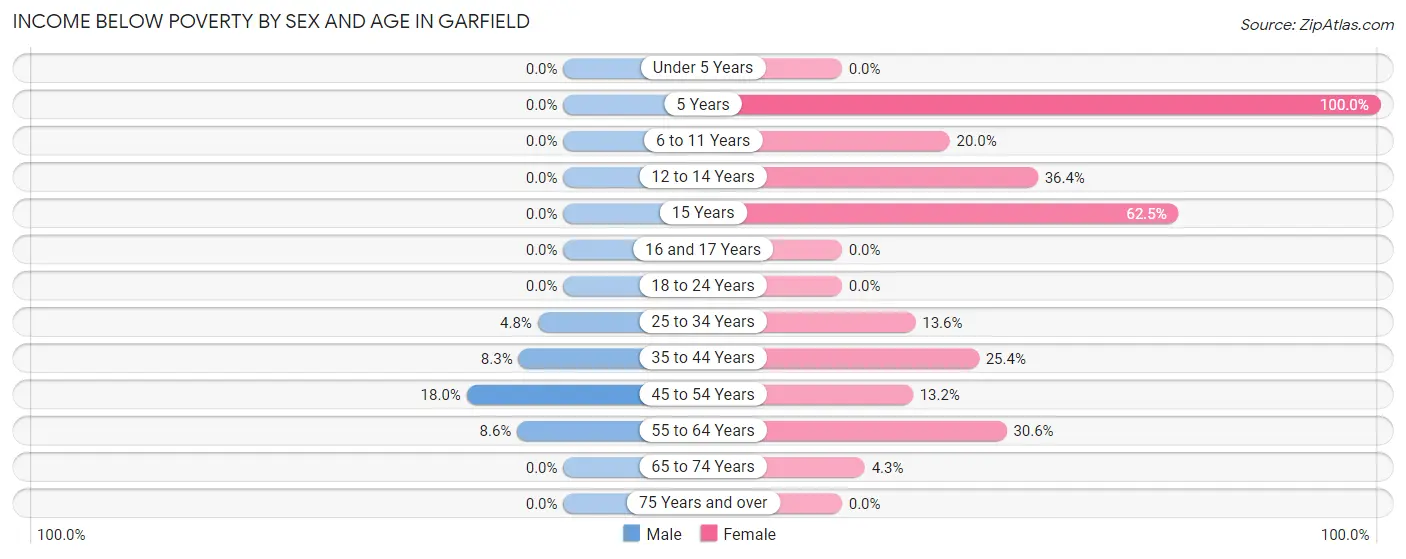
| Age Bracket | Male | Female |
| Under 5 Years | 0 (0.0%) | 0 (0.0%) |
| 5 Years | 0 (0.0%) | 3 (100.0%) |
| 6 to 11 Years | 0 (0.0%) | 6 (20.0%) |
| 12 to 14 Years | 0 (0.0%) | 8 (36.4%) |
| 15 Years | 0 (0.0%) | 5 (62.5%) |
| 16 and 17 Years | 0 (0.0%) | 0 (0.0%) |
| 18 to 24 Years | 0 (0.0%) | 0 (0.0%) |
| 25 to 34 Years | 2 (4.8%) | 6 (13.6%) |
| 35 to 44 Years | 3 (8.3%) | 15 (25.4%) |
| 45 to 54 Years | 7 (17.9%) | 5 (13.2%) |
| 55 to 64 Years | 3 (8.6%) | 11 (30.6%) |
| 65 to 74 Years | 0 (0.0%) | 2 (4.3%) |
| 75 Years and over | 0 (0.0%) | 0 (0.0%) |
| Total | 15 (6.1%) | 61 (17.9%) |
Income Above Poverty by Sex and Age in Garfield
According to the poverty statistics in Garfield, males aged under 5 years and females aged under 5 years are the age groups that are most secure financially, with 100.0% of males and 100.0% of females in these age groups living above the poverty line.
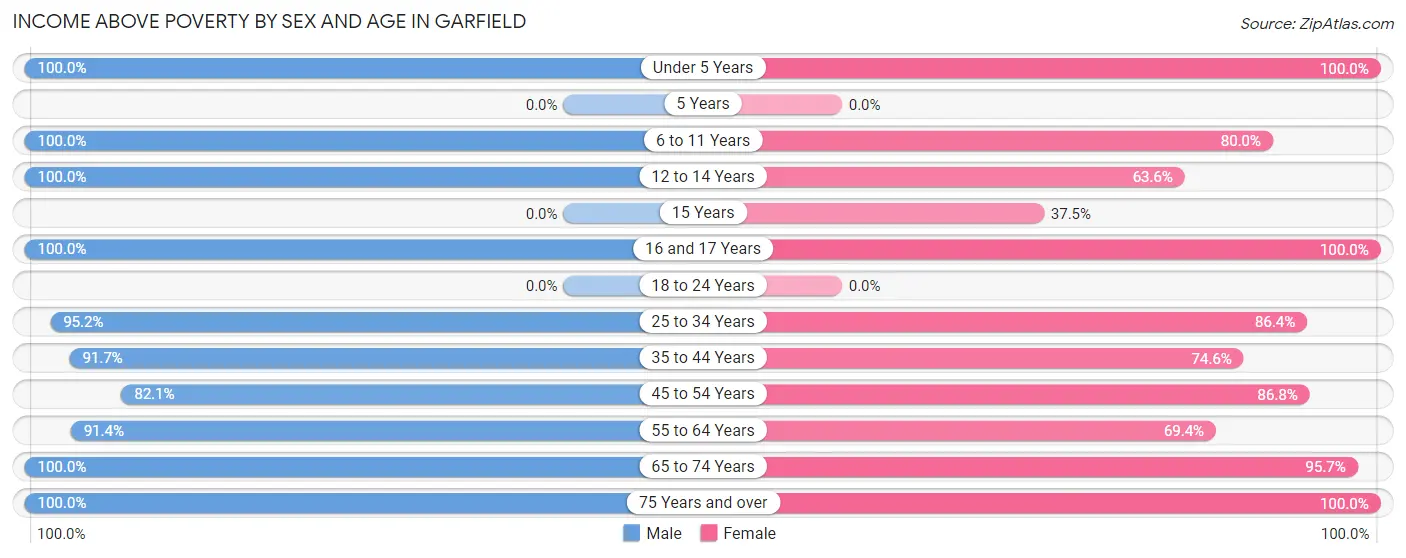
| Age Bracket | Male | Female |
| Under 5 Years | 20 (100.0%) | 20 (100.0%) |
| 5 Years | 0 (0.0%) | 0 (0.0%) |
| 6 to 11 Years | 29 (100.0%) | 24 (80.0%) |
| 12 to 14 Years | 7 (100.0%) | 14 (63.6%) |
| 15 Years | 0 (0.0%) | 3 (37.5%) |
| 16 and 17 Years | 2 (100.0%) | 13 (100.0%) |
| 18 to 24 Years | 0 (0.0%) | 0 (0.0%) |
| 25 to 34 Years | 40 (95.2%) | 38 (86.4%) |
| 35 to 44 Years | 33 (91.7%) | 44 (74.6%) |
| 45 to 54 Years | 32 (82.1%) | 33 (86.8%) |
| 55 to 64 Years | 32 (91.4%) | 25 (69.4%) |
| 65 to 74 Years | 24 (100.0%) | 45 (95.7%) |
| 75 Years and over | 12 (100.0%) | 20 (100.0%) |
| Total | 231 (93.9%) | 279 (82.1%) |
Income Below Poverty Among Married-Couple Families in Garfield
The poverty statistics for married-couple families in Garfield show that 6.2% or 8 of the total 129 families live below the poverty line. Families with no children have the highest poverty rate of 7.8%, comprising of 5 families. On the other hand, families with 3 or 4 children have the lowest poverty rate of 0.0%, which includes 0 families.
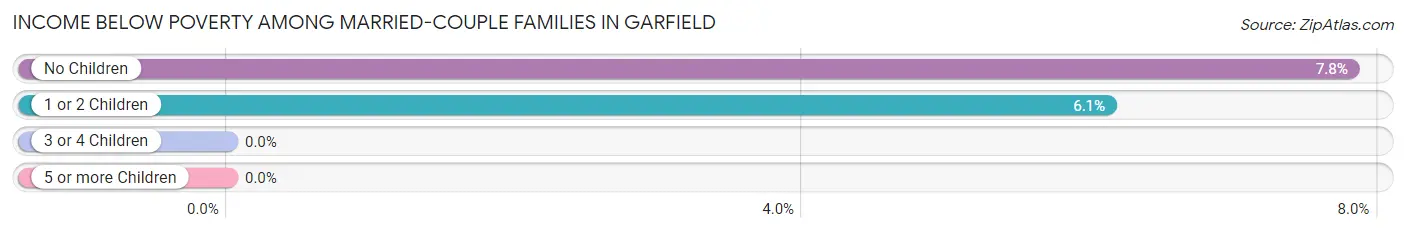
| Children | Above Poverty | Below Poverty |
| No Children | 59 (92.2%) | 5 (7.8%) |
| 1 or 2 Children | 46 (93.9%) | 3 (6.1%) |
| 3 or 4 Children | 16 (100.0%) | 0 (0.0%) |
| 5 or more Children | 0 (0.0%) | 0 (0.0%) |
| Total | 121 (93.8%) | 8 (6.2%) |
Income Below Poverty Among Single-Parent Households in Garfield
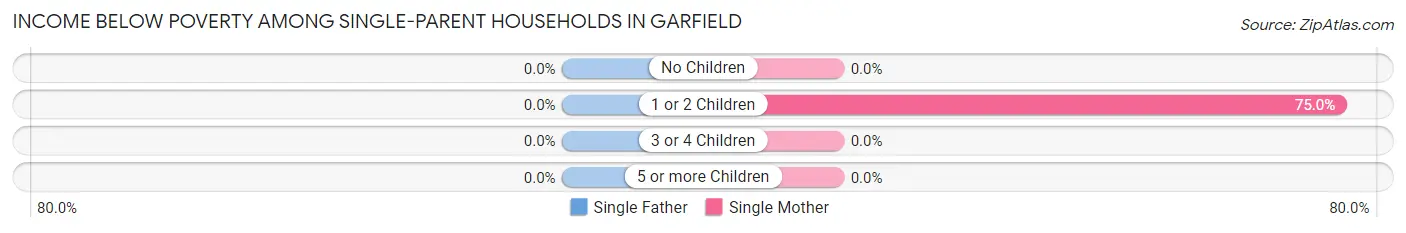
| Children | Single Father | Single Mother |
| No Children | 0 (0.0%) | 0 (0.0%) |
| 1 or 2 Children | 0 (0.0%) | 12 (75.0%) |
| 3 or 4 Children | 0 (0.0%) | 0 (0.0%) |
| 5 or more Children | 0 (0.0%) | 0 (0.0%) |
| Total | 0 (0.0%) | 12 (38.7%) |
Income Below Poverty Among Married-Couple vs Single-Parent Households in Garfield
The poverty data for Garfield shows that 8 of the married-couple family households (6.2%) and 12 of the single-parent households (32.4%) are living below the poverty level. Within the married-couple family households, those with no children have the highest poverty rate, with 5 households (7.8%) falling below the poverty line. Among the single-parent households, those with 1 or 2 children have the highest poverty rate, with 12 household (54.5%) living below poverty.
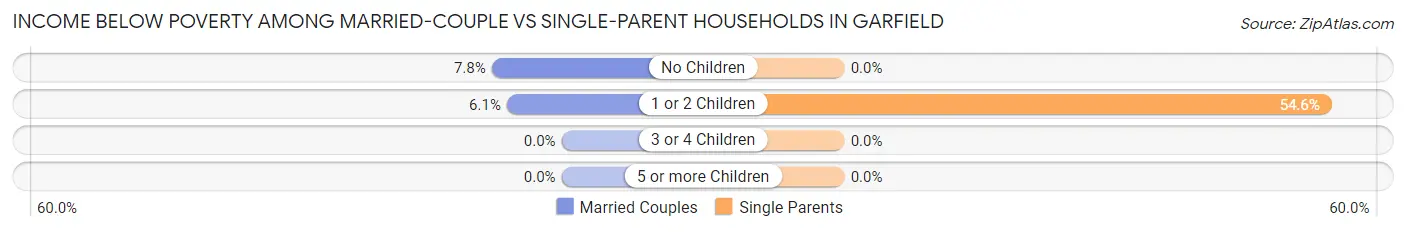
| Children | Married-Couple Families | Single-Parent Households |
| No Children | 5 (7.8%) | 0 (0.0%) |
| 1 or 2 Children | 3 (6.1%) | 12 (54.5%) |
| 3 or 4 Children | 0 (0.0%) | 0 (0.0%) |
| 5 or more Children | 0 (0.0%) | 0 (0.0%) |
| Total | 8 (6.2%) | 12 (32.4%) |
Race in Garfield
The most populous races in Garfield are White / Caucasian (504 | 86.0%), Two or more Races (74 | 12.6%), and Native / Alaskan (8 | 1.4%).
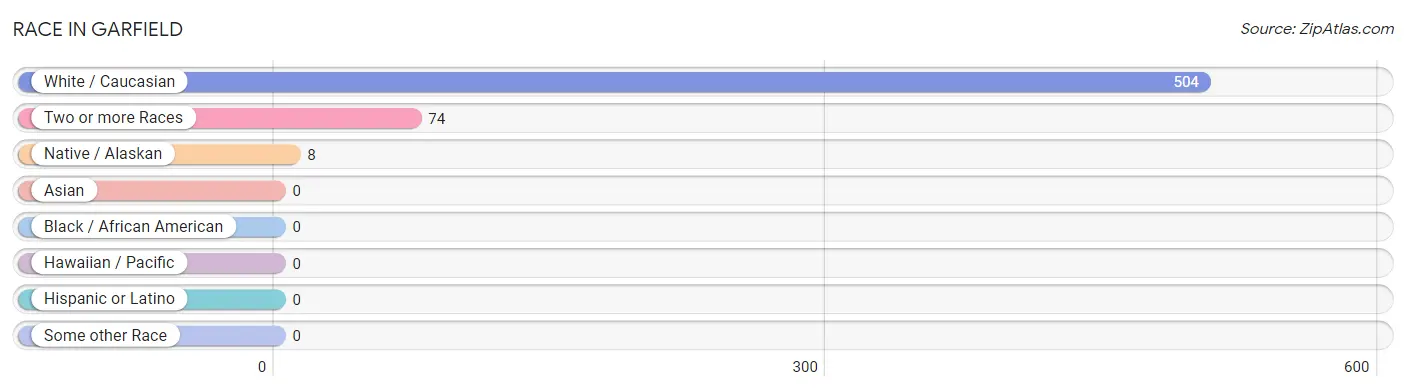
| Race | # Population | % Population |
| Asian | 0 | 0.0% |
| Black / African American | 0 | 0.0% |
| Hawaiian / Pacific | 0 | 0.0% |
| Hispanic or Latino | 0 | 0.0% |
| Native / Alaskan | 8 | 1.4% |
| White / Caucasian | 504 | 86.0% |
| Two or more Races | 74 | 12.6% |
| Some other Race | 0 | 0.0% |
| Total | 586 | 100.0% |
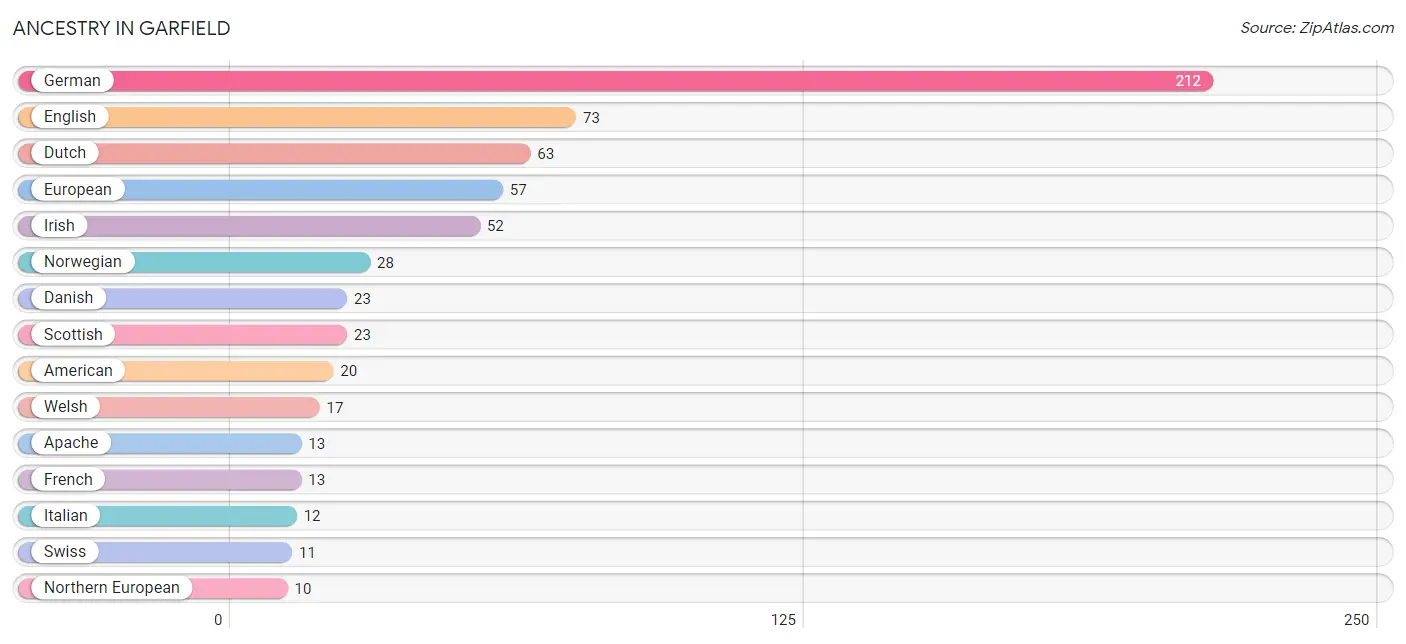
Ancestry in Garfield
The most populous ancestries reported in Garfield are German (212 | 36.2%), English (73 | 12.5%), Dutch (63 | 10.7%), European (57 | 9.7%), and Irish (52 | 8.9%), together accounting for 78.0% of all Garfield residents.
| Ancestry | # Population | % Population |
| American | 20 | 3.4% |
| Apache | 13 | 2.2% |
| British | 3 | 0.5% |
| Canadian | 3 | 0.5% |
| Cherokee | 7 | 1.2% |
| Choctaw | 6 | 1.0% |
| Croatian | 3 | 0.5% |
| Czech | 7 | 1.2% |
| Danish | 23 | 3.9% |
| Dutch | 63 | 10.7% |
| English | 73 | 12.5% |
| European | 57 | 9.7% |
| French | 13 | 2.2% |
| French American Indian | 2 | 0.3% |
| French Canadian | 2 | 0.3% |
| German | 212 | 36.2% |
| Irish | 52 | 8.9% |
| Italian | 12 | 2.1% |
| Lithuanian | 6 | 1.0% |
| Northern European | 10 | 1.7% |
| Norwegian | 28 | 4.8% |
| Scotch-Irish | 7 | 1.2% |
| Scottish | 23 | 3.9% |
| Swedish | 10 | 1.7% |
| Swiss | 11 | 1.9% |
| Tlingit-Haida | 2 | 0.3% |
| Welsh | 17 | 2.9% | View All 27 Rows |
Immigrants in Garfield

| Immigration Origin | # Population | % Population | View All 0 Rows |
Sex and Age in Garfield
Sex and Age in Garfield
The most populous age groups in Garfield are 40 to 44 Years (31 | 12.6%) for men and 35 to 39 Years (52 | 15.3%) for women.
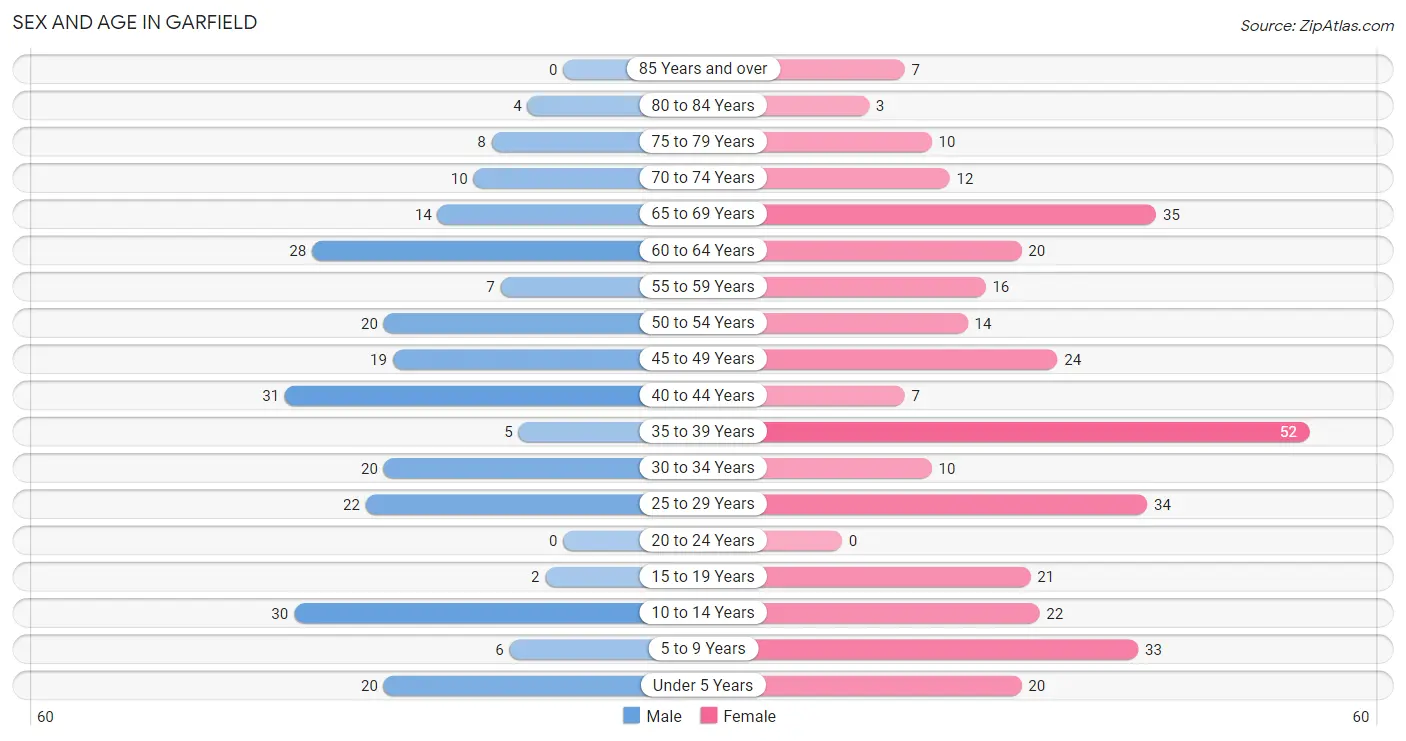
| Age Bracket | Male | Female |
| Under 5 Years | 20 (8.1%) | 20 (5.9%) |
| 5 to 9 Years | 6 (2.4%) | 33 (9.7%) |
| 10 to 14 Years | 30 (12.2%) | 22 (6.5%) |
| 15 to 19 Years | 2 (0.8%) | 21 (6.2%) |
| 20 to 24 Years | 0 (0.0%) | 0 (0.0%) |
| 25 to 29 Years | 22 (8.9%) | 34 (10.0%) |
| 30 to 34 Years | 20 (8.1%) | 10 (2.9%) |
| 35 to 39 Years | 5 (2.0%) | 52 (15.3%) |
| 40 to 44 Years | 31 (12.6%) | 7 (2.1%) |
| 45 to 49 Years | 19 (7.7%) | 24 (7.1%) |
| 50 to 54 Years | 20 (8.1%) | 14 (4.1%) |
| 55 to 59 Years | 7 (2.9%) | 16 (4.7%) |
| 60 to 64 Years | 28 (11.4%) | 20 (5.9%) |
| 65 to 69 Years | 14 (5.7%) | 35 (10.3%) |
| 70 to 74 Years | 10 (4.1%) | 12 (3.5%) |
| 75 to 79 Years | 8 (3.3%) | 10 (2.9%) |
| 80 to 84 Years | 4 (1.6%) | 3 (0.9%) |
| 85 Years and over | 0 (0.0%) | 7 (2.1%) |
| Total | 246 (100.0%) | 340 (100.0%) |
Families and Households in Garfield
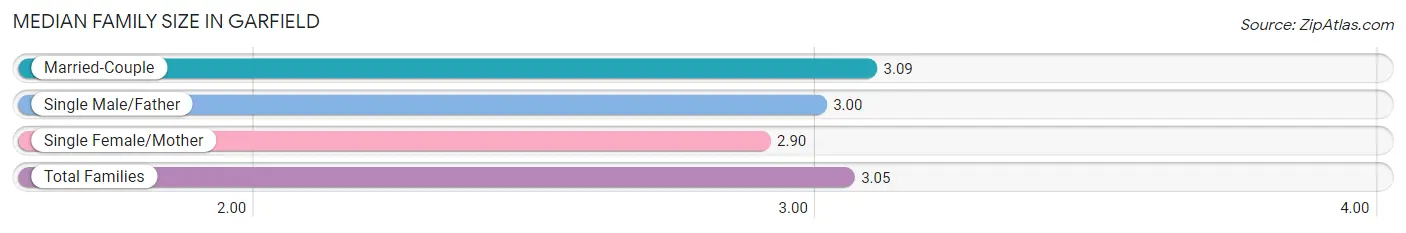
Median Family Size in Garfield
The median family size in Garfield is 3.05 persons per family, with married-couple families (129 | 77.7%) accounting for the largest median family size of 3.09 persons per family. On the other hand, single female/mother families (31 | 18.7%) represent the smallest median family size with 2.90 persons per family.
| Family Type | # Families | Family Size |
| Married-Couple | 129 (77.7%) | 3.09 |
| Single Male/Father | 6 (3.6%) | 3.00 |
| Single Female/Mother | 31 (18.7%) | 2.90 |
| Total Families | 166 (100.0%) | 3.05 |
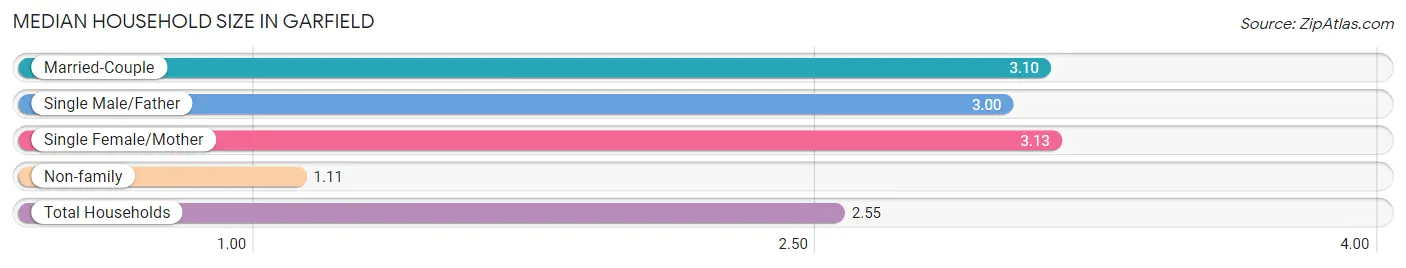
Median Household Size in Garfield
The median household size in Garfield is 2.55 persons per household, with single female/mother households (31 | 13.5%) accounting for the largest median household size of 3.13 persons per household. non-family households (64 | 27.8%) represent the smallest median household size with 1.11 persons per household.
| Household Type | # Households | Household Size |
| Married-Couple | 129 (56.1%) | 3.10 |
| Single Male/Father | 6 (2.6%) | 3.00 |
| Single Female/Mother | 31 (13.5%) | 3.13 |
| Non-family | 64 (27.8%) | 1.11 |
| Total Households | 230 (100.0%) | 2.55 |
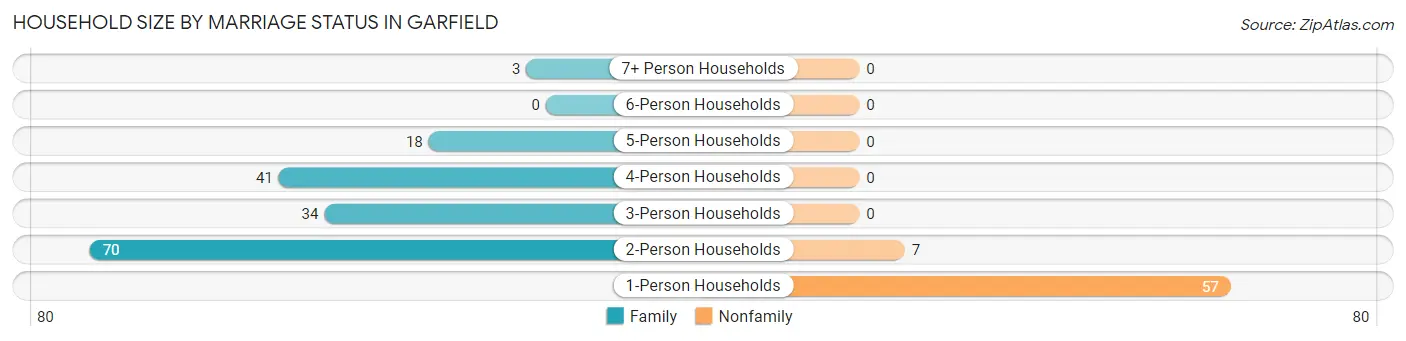
Household Size by Marriage Status in Garfield
Out of a total of 230 households in Garfield, 166 (72.2%) are family households, while 64 (27.8%) are nonfamily households. The most numerous type of family households are 2-person households, comprising 70, and the most common type of nonfamily households are 1-person households, comprising 57.
| Household Size | Family Households | Nonfamily Households |
| 1-Person Households | - | 57 (24.8%) |
| 2-Person Households | 70 (30.4%) | 7 (3.0%) |
| 3-Person Households | 34 (14.8%) | 0 (0.0%) |
| 4-Person Households | 41 (17.8%) | 0 (0.0%) |
| 5-Person Households | 18 (7.8%) | 0 (0.0%) |
| 6-Person Households | 0 (0.0%) | 0 (0.0%) |
| 7+ Person Households | 3 (1.3%) | 0 (0.0%) |
| Total | 166 (72.2%) | 64 (27.8%) |
Female Fertility in Garfield
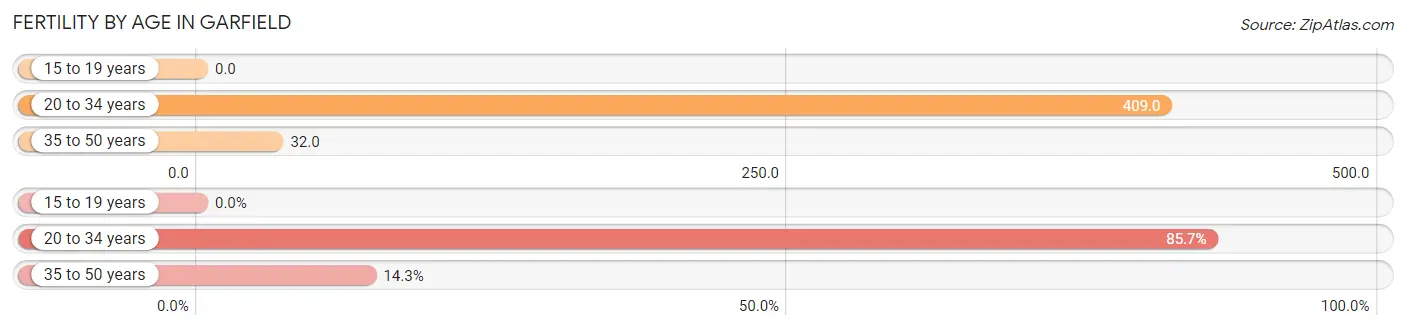
Fertility by Age in Garfield
Average fertility rate in Garfield is 131.0 births per 1,000 women. Women in the age bracket of 20 to 34 years have the highest fertility rate with 409.0 births per 1,000 women. Women in the age bracket of 20 to 34 years acount for 85.7% of all women with births.
| Age Bracket | Women with Births | Births / 1,000 Women |
| 15 to 19 years | 0 (0.0%) | 0.0 |
| 20 to 34 years | 18 (85.7%) | 409.0 |
| 35 to 50 years | 3 (14.3%) | 32.0 |
| Total | 21 (100.0%) | 131.0 |
Fertility by Age by Marriage Status in Garfield
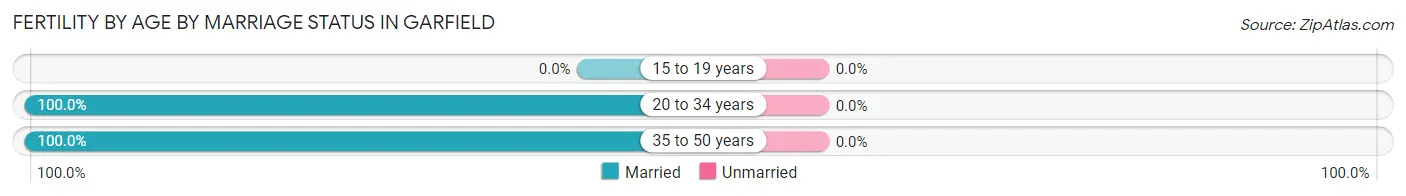
| Age Bracket | Married | Unmarried |
| 15 to 19 years | 0 (0.0%) | 0 (0.0%) |
| 20 to 34 years | 18 (100.0%) | 0 (0.0%) |
| 35 to 50 years | 3 (100.0%) | 0 (0.0%) |
| Total | 21 (100.0%) | 0 (0.0%) |
Fertility by Education in Garfield
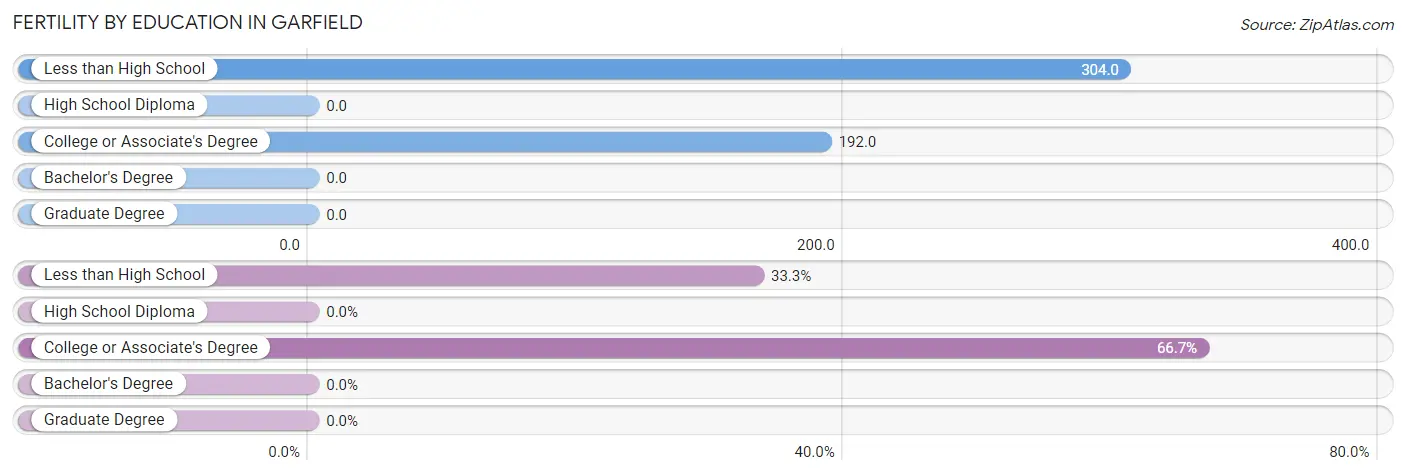
| Educational Attainment | Women with Births | Births / 1,000 Women |
| Less than High School | 7 (33.3%) | 304.0 |
| High School Diploma | 0 (0.0%) | 0.0 |
| College or Associate's Degree | 14 (66.7%) | 192.0 |
| Bachelor's Degree | 0 (0.0%) | 0.0 |
| Graduate Degree | 0 (0.0%) | 0.0 |
| Total | 21 (100.0%) | 131.0 |
Fertility by Education by Marriage Status in Garfield
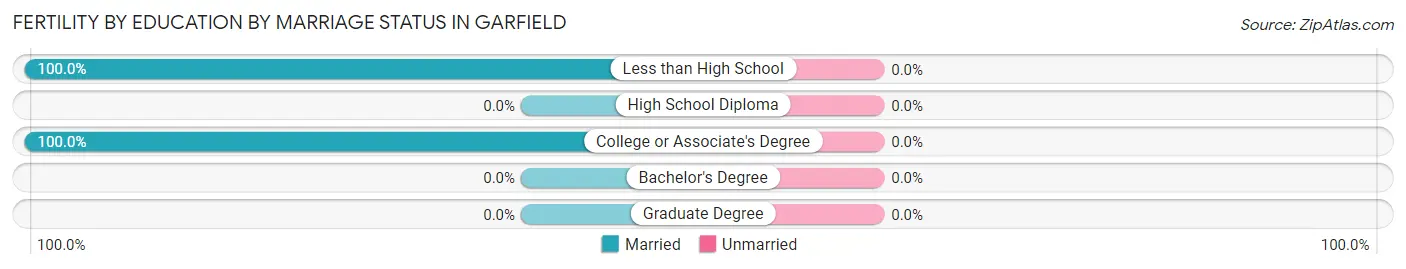
| Educational Attainment | Married | Unmarried |
| Less than High School | 7 (100.0%) | 0 (0.0%) |
| High School Diploma | 0 (0.0%) | 0 (0.0%) |
| College or Associate's Degree | 14 (100.0%) | 0 (0.0%) |
| Bachelor's Degree | 0 (0.0%) | 0 (0.0%) |
| Graduate Degree | 0 (0.0%) | 0 (0.0%) |
| Total | 21 (100.0%) | 0 (0.0%) |
Employment Characteristics in Garfield
Employment by Class of Employer in Garfield
Among the 243 employed individuals in Garfield, private company employees (130 | 53.5%), state government employees (28 | 11.5%), and local government employees (23 | 9.5%) make up the most common classes of employment.
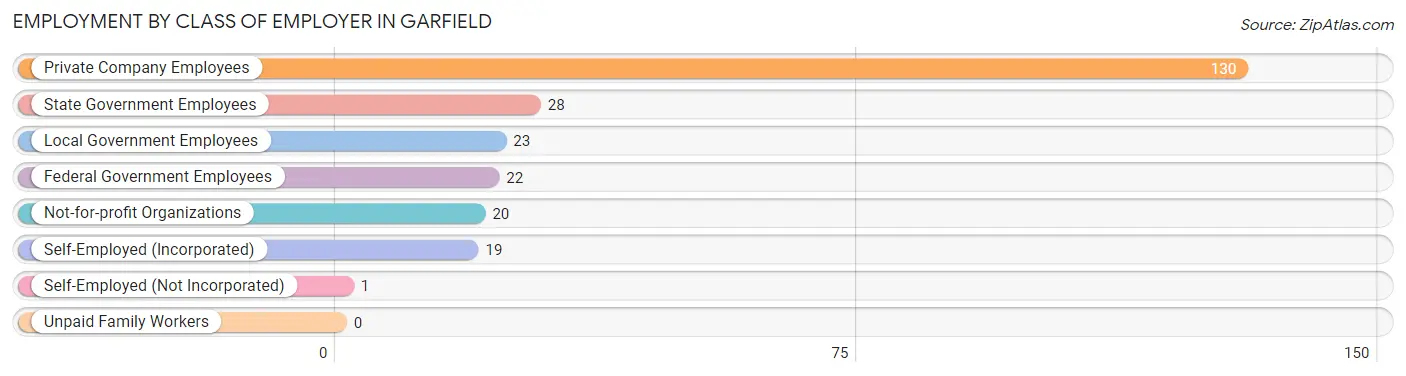
| Employer Class | # Employees | % Employees |
| Private Company Employees | 130 | 53.5% |
| Self-Employed (Incorporated) | 19 | 7.8% |
| Self-Employed (Not Incorporated) | 1 | 0.4% |
| Not-for-profit Organizations | 20 | 8.2% |
| Local Government Employees | 23 | 9.5% |
| State Government Employees | 28 | 11.5% |
| Federal Government Employees | 22 | 9.0% |
| Unpaid Family Workers | 0 | 0.0% |
| Total | 243 | 100.0% |
Employment Status by Age in Garfield
According to the labor force statistics for Garfield, out of the total population over 16 years of age (447), 57.0% or 255 individuals are in the labor force, with 3.5% or 9 of them unemployed. The age group with the highest labor force participation rate is 30 to 34 years, with 100.0% or 30 individuals in the labor force. Within the labor force, the 30 to 34 years age range has the highest percentage of unemployed individuals, with 20.0% or 6 of them being unemployed.
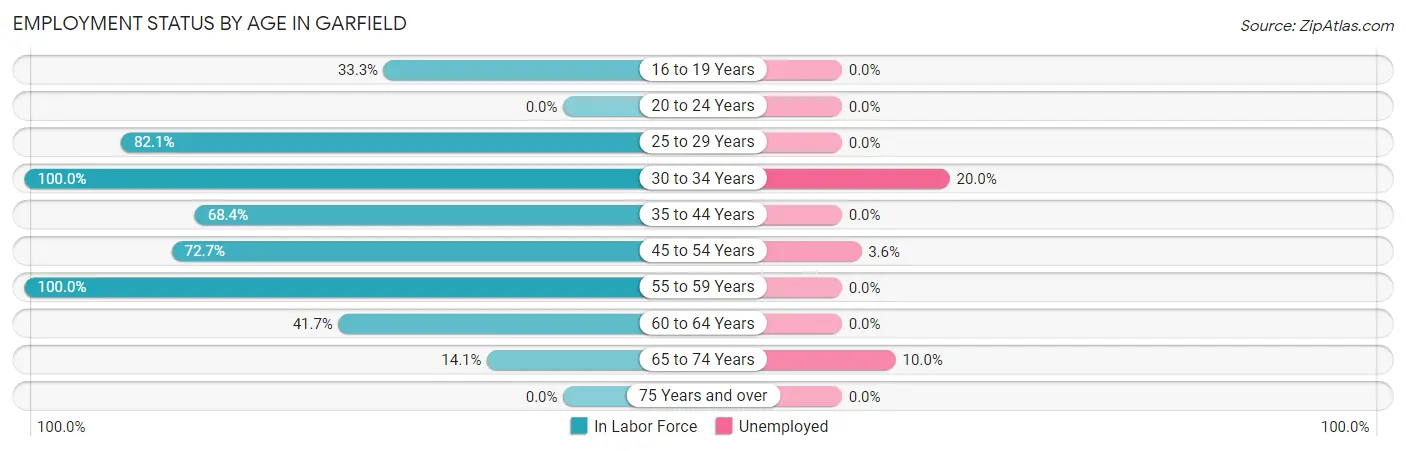
| Age Bracket | In Labor Force | Unemployed |
| 16 to 19 Years | 5 (33.3%) | 0 (0.0%) |
| 20 to 24 Years | 0 (0.0%) | 0 (0.0%) |
| 25 to 29 Years | 46 (82.1%) | 0 (0.0%) |
| 30 to 34 Years | 30 (100.0%) | 6 (20.0%) |
| 35 to 44 Years | 65 (68.4%) | 0 (0.0%) |
| 45 to 54 Years | 56 (72.7%) | 2 (3.6%) |
| 55 to 59 Years | 23 (100.0%) | 0 (0.0%) |
| 60 to 64 Years | 20 (41.7%) | 0 (0.0%) |
| 65 to 74 Years | 10 (14.1%) | 1 (10.0%) |
| 75 Years and over | 0 (0.0%) | 0 (0.0%) |
| Total | 255 (57.0%) | 9 (3.5%) |
Employment Status by Educational Attainment in Garfield
According to labor force statistics for Garfield, 72.9% of individuals (240) out of the total population between 25 and 64 years of age (329) are in the labor force, with 3.3% or 8 of them being unemployed. The group with the highest labor force participation rate are those with the educational attainment of college / associate degree, with 78.6% or 114 individuals in the labor force. Within the labor force, individuals with less than high school education have the highest percentage of unemployment, with 100.0% or 2 of them being unemployed.
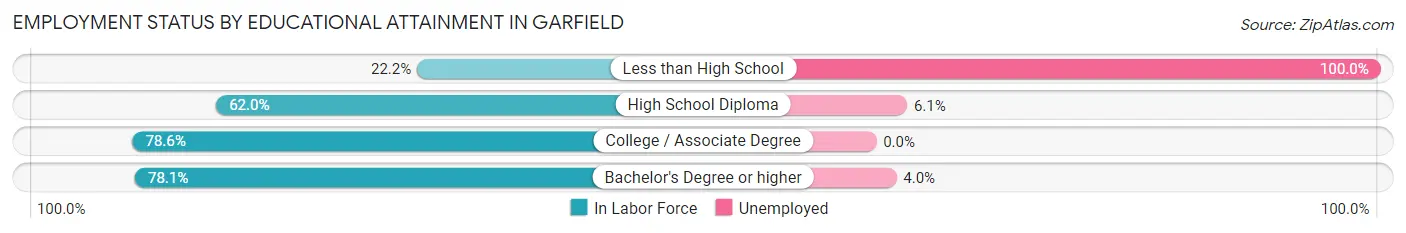
| Educational Attainment | In Labor Force | Unemployed |
| Less than High School | 2 (22.2%) | 9 (100.0%) |
| High School Diploma | 49 (62.0%) | 5 (6.1%) |
| College / Associate Degree | 114 (78.6%) | 0 (0.0%) |
| Bachelor's Degree or higher | 75 (78.1%) | 4 (4.0%) |
| Total | 240 (72.9%) | 11 (3.3%) |
Employment Occupations by Sex in Garfield
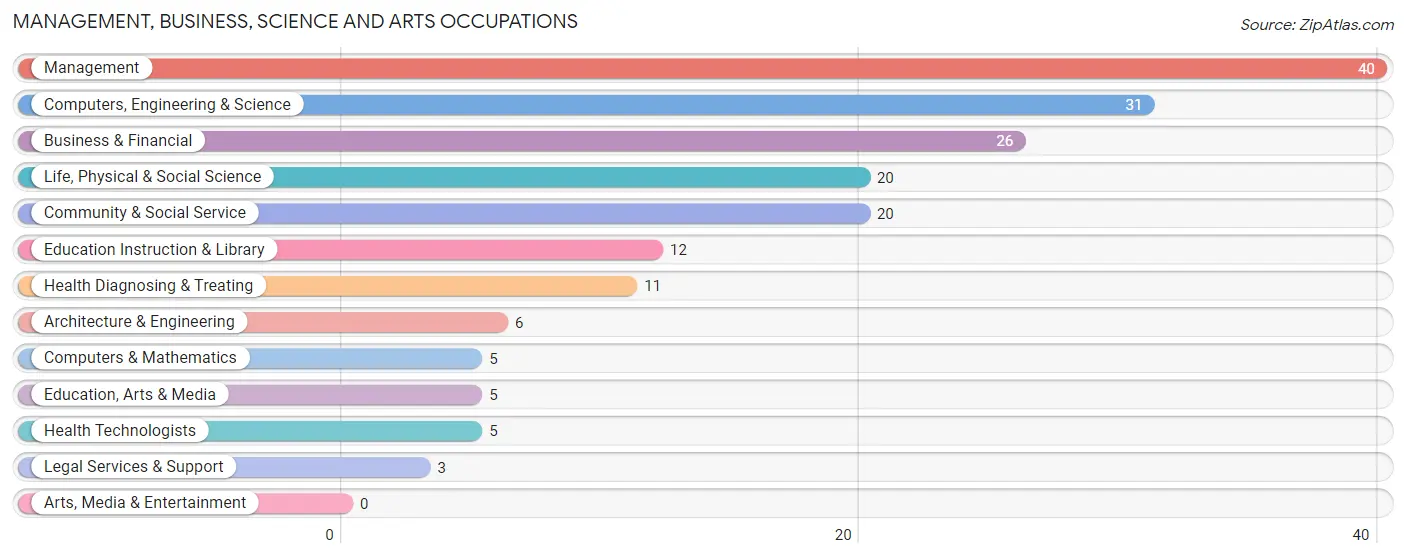
Management, Business, Science and Arts Occupations
The most common Management, Business, Science and Arts occupations in Garfield are Management (40 | 16.3%), Computers, Engineering & Science (31 | 12.6%), Business & Financial (26 | 10.6%), Life, Physical & Social Science (20 | 8.1%), and Community & Social Service (20 | 8.1%).
Management, Business, Science and Arts Occupations by Sex
Within the Management, Business, Science and Arts occupations in Garfield, the most male-oriented occupations are Computers, Engineering & Science (100.0%), Computers & Mathematics (100.0%), and Architecture & Engineering (100.0%), while the most female-oriented occupations are Legal Services & Support (100.0%), Education Instruction & Library (100.0%), and Health Diagnosing & Treating (100.0%).
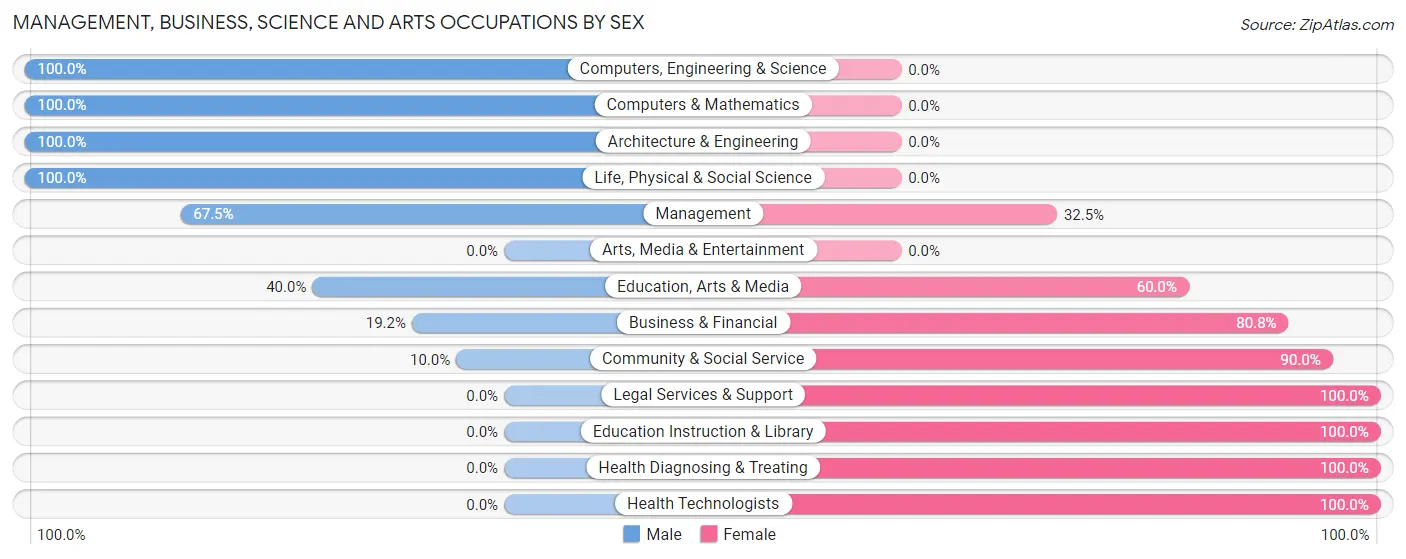
| Occupation | Male | Female |
| Management | 27 (67.5%) | 13 (32.5%) |
| Business & Financial | 5 (19.2%) | 21 (80.8%) |
| Computers, Engineering & Science | 31 (100.0%) | 0 (0.0%) |
| Computers & Mathematics | 5 (100.0%) | 0 (0.0%) |
| Architecture & Engineering | 6 (100.0%) | 0 (0.0%) |
| Life, Physical & Social Science | 20 (100.0%) | 0 (0.0%) |
| Community & Social Service | 2 (10.0%) | 18 (90.0%) |
| Education, Arts & Media | 2 (40.0%) | 3 (60.0%) |
| Legal Services & Support | 0 (0.0%) | 3 (100.0%) |
| Education Instruction & Library | 0 (0.0%) | 12 (100.0%) |
| Arts, Media & Entertainment | 0 (0.0%) | 0 (0.0%) |
| Health Diagnosing & Treating | 0 (0.0%) | 11 (100.0%) |
| Health Technologists | 0 (0.0%) | 5 (100.0%) |
| Total (Category) | 65 (50.8%) | 63 (49.2%) |
| Total (Overall) | 113 (45.9%) | 133 (54.1%) |
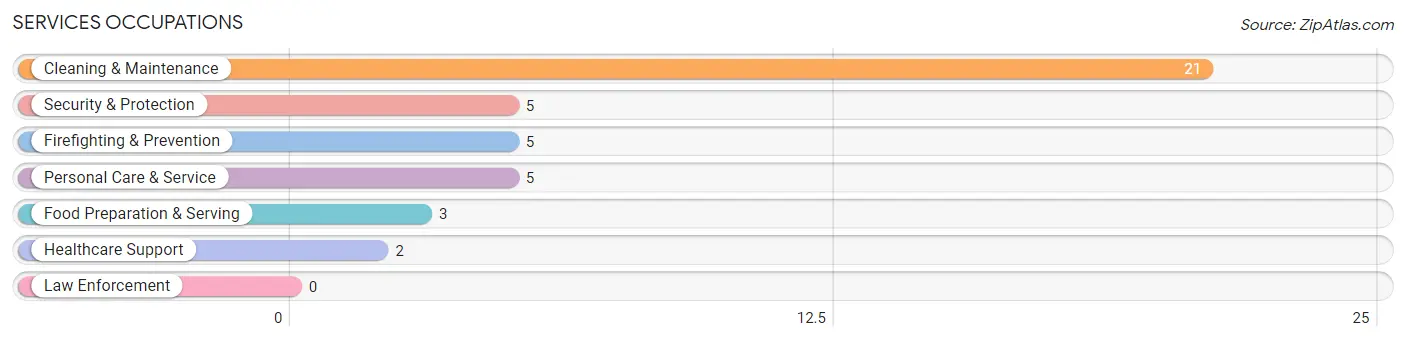
Services Occupations
The most common Services occupations in Garfield are Cleaning & Maintenance (21 | 8.5%), Security & Protection (5 | 2.0%), Firefighting & Prevention (5 | 2.0%), Personal Care & Service (5 | 2.0%), and Food Preparation & Serving (3 | 1.2%).
Services Occupations by Sex
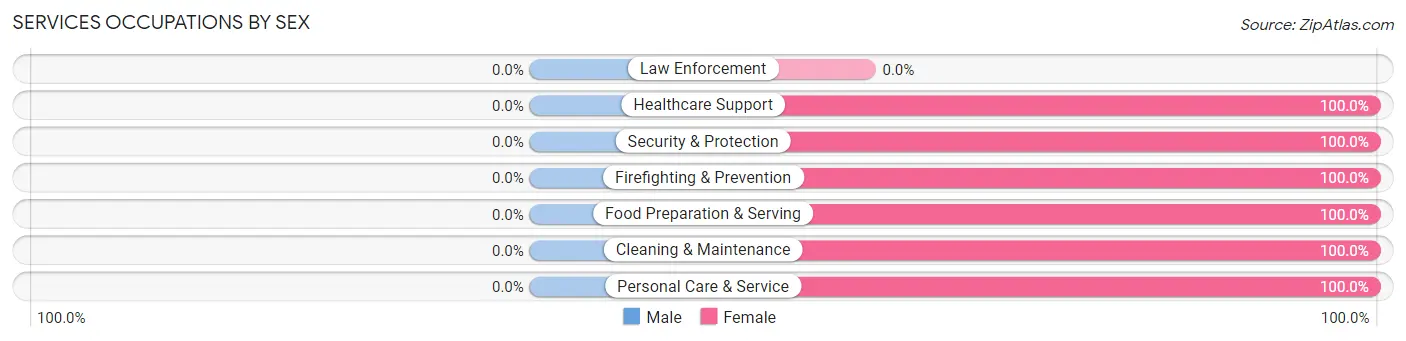
| Occupation | Male | Female |
| Healthcare Support | 0 (0.0%) | 2 (100.0%) |
| Security & Protection | 0 (0.0%) | 5 (100.0%) |
| Firefighting & Prevention | 0 (0.0%) | 5 (100.0%) |
| Law Enforcement | 0 (0.0%) | 0 (0.0%) |
| Food Preparation & Serving | 0 (0.0%) | 3 (100.0%) |
| Cleaning & Maintenance | 0 (0.0%) | 21 (100.0%) |
| Personal Care & Service | 0 (0.0%) | 5 (100.0%) |
| Total (Category) | 0 (0.0%) | 36 (100.0%) |
| Total (Overall) | 113 (45.9%) | 133 (54.1%) |
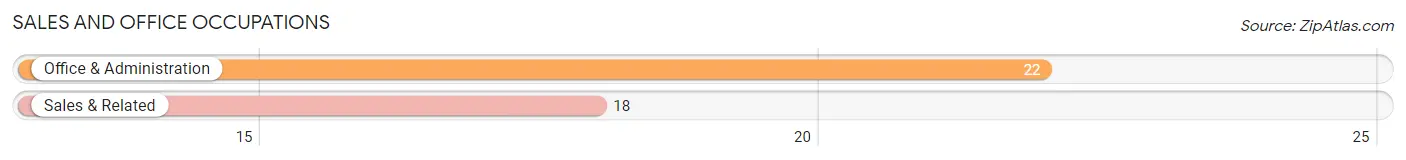
Sales and Office Occupations
The most common Sales and Office occupations in Garfield are Office & Administration (22 | 8.9%), and Sales & Related (18 | 7.3%).
Sales and Office Occupations by Sex
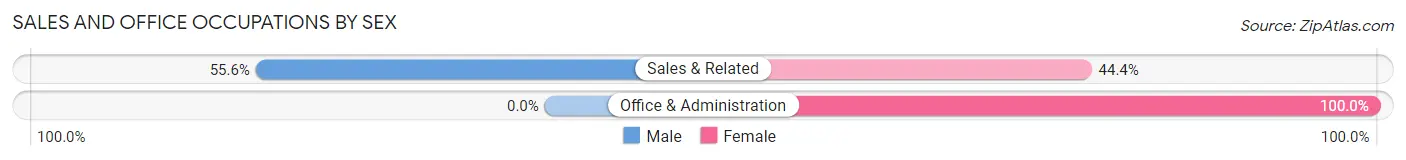
| Occupation | Male | Female |
| Sales & Related | 10 (55.6%) | 8 (44.4%) |
| Office & Administration | 0 (0.0%) | 22 (100.0%) |
| Total (Category) | 10 (25.0%) | 30 (75.0%) |
| Total (Overall) | 113 (45.9%) | 133 (54.1%) |
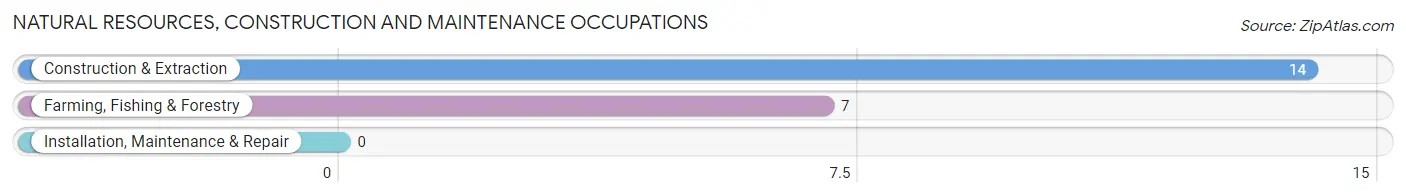
Natural Resources, Construction and Maintenance Occupations
The most common Natural Resources, Construction and Maintenance occupations in Garfield are Construction & Extraction (14 | 5.7%), and Farming, Fishing & Forestry (7 | 2.9%).
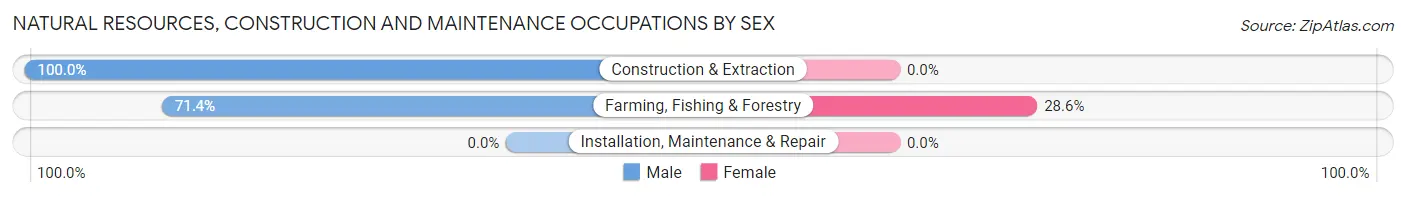
Natural Resources, Construction and Maintenance Occupations by Sex
| Occupation | Male | Female |
| Farming, Fishing & Forestry | 5 (71.4%) | 2 (28.6%) |
| Construction & Extraction | 14 (100.0%) | 0 (0.0%) |
| Installation, Maintenance & Repair | 0 (0.0%) | 0 (0.0%) |
| Total (Category) | 19 (90.5%) | 2 (9.5%) |
| Total (Overall) | 113 (45.9%) | 133 (54.1%) |
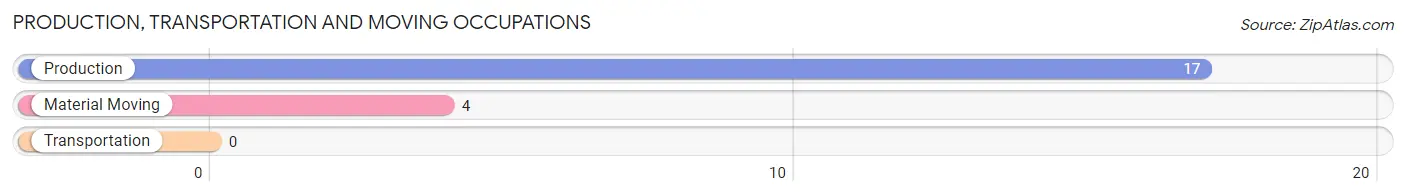
Production, Transportation and Moving Occupations
The most common Production, Transportation and Moving occupations in Garfield are Production (17 | 6.9%), and Material Moving (4 | 1.6%).
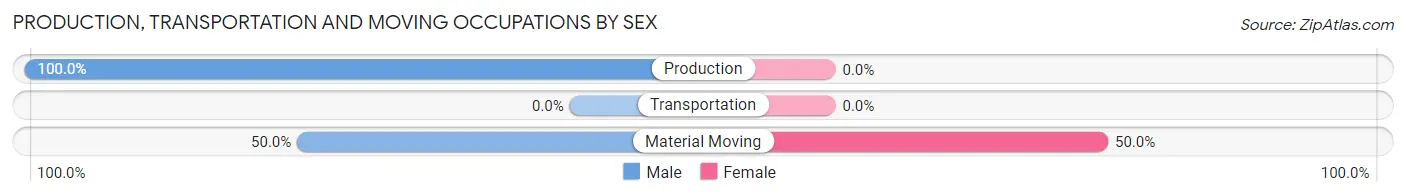
Production, Transportation and Moving Occupations by Sex
| Occupation | Male | Female |
| Production | 17 (100.0%) | 0 (0.0%) |
| Transportation | 0 (0.0%) | 0 (0.0%) |
| Material Moving | 2 (50.0%) | 2 (50.0%) |
| Total (Category) | 19 (90.5%) | 2 (9.5%) |
| Total (Overall) | 113 (45.9%) | 133 (54.1%) |
Employment Industries by Sex in Garfield
Employment Industries in Garfield
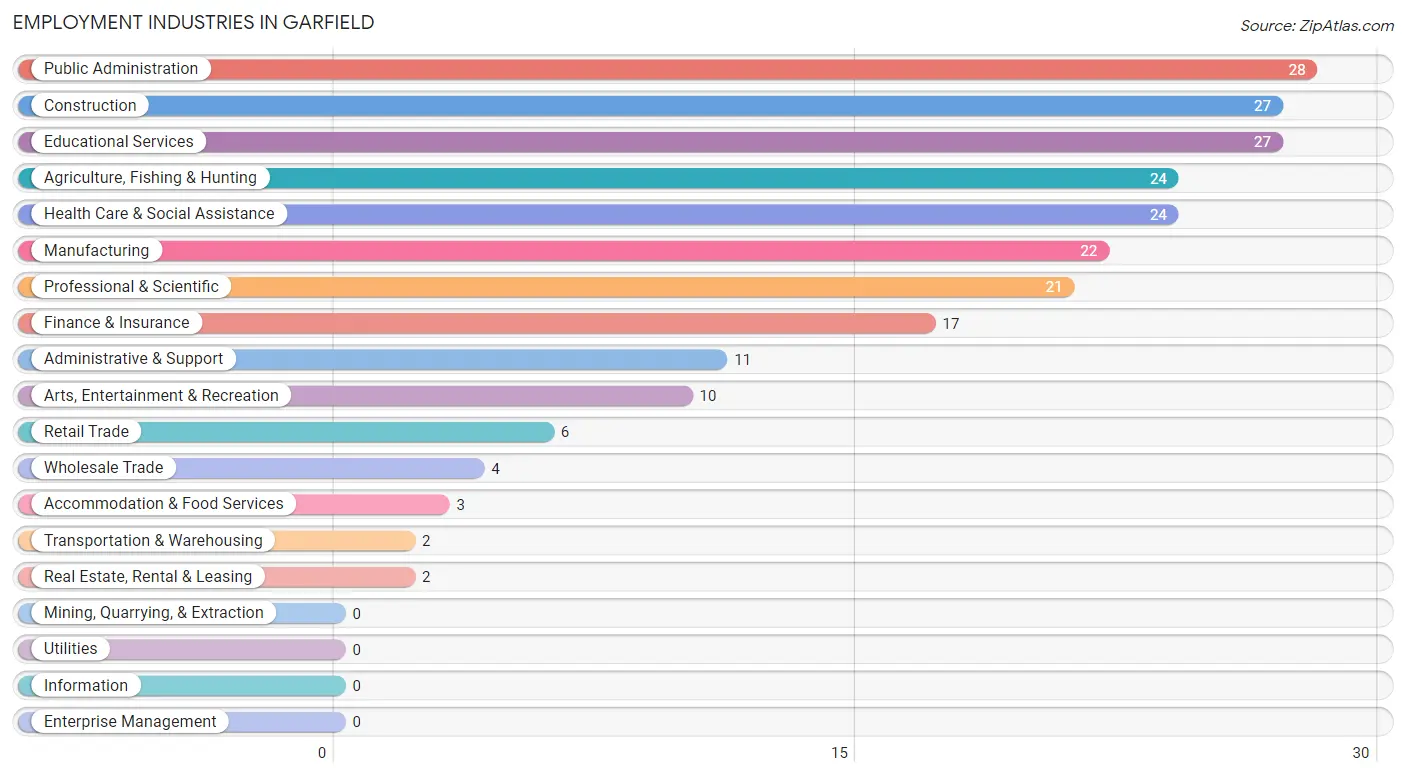
The major employment industries in Garfield include Public Administration (28 | 11.4%), Construction (27 | 11.0%), Educational Services (27 | 11.0%), Agriculture, Fishing & Hunting (24 | 9.8%), and Health Care & Social Assistance (24 | 9.8%).
Employment Industries by Sex in Garfield
The Garfield industries that see more men than women are Construction (100.0%), Transportation & Warehousing (100.0%), and Manufacturing (90.9%), whereas the industries that tend to have a higher number of women are Finance & Insurance (100.0%), Real Estate, Rental & Leasing (100.0%), and Administrative & Support (100.0%).
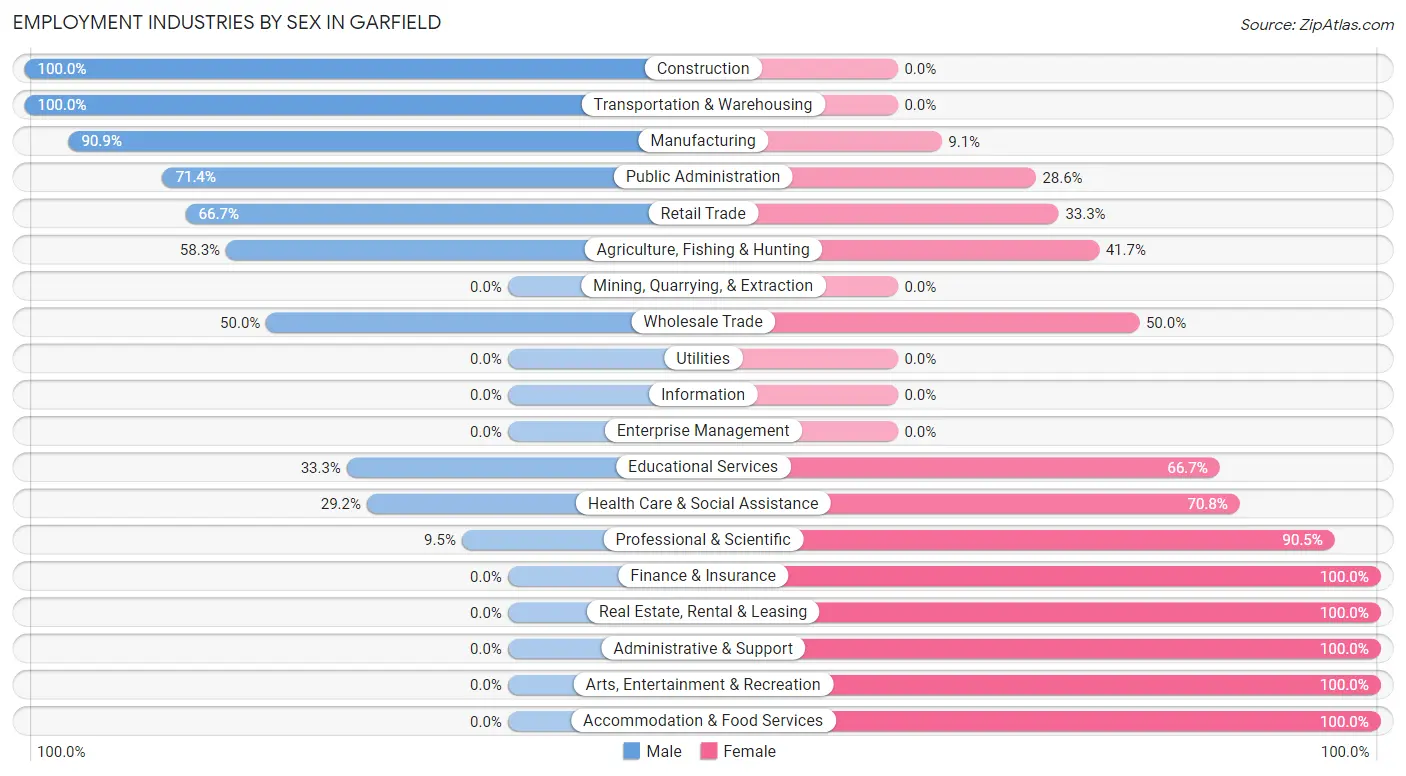
| Industry | Male | Female |
| Agriculture, Fishing & Hunting | 14 (58.3%) | 10 (41.7%) |
| Mining, Quarrying, & Extraction | 0 (0.0%) | 0 (0.0%) |
| Construction | 27 (100.0%) | 0 (0.0%) |
| Manufacturing | 20 (90.9%) | 2 (9.1%) |
| Wholesale Trade | 2 (50.0%) | 2 (50.0%) |
| Retail Trade | 4 (66.7%) | 2 (33.3%) |
| Transportation & Warehousing | 2 (100.0%) | 0 (0.0%) |
| Utilities | 0 (0.0%) | 0 (0.0%) |
| Information | 0 (0.0%) | 0 (0.0%) |
| Finance & Insurance | 0 (0.0%) | 17 (100.0%) |
| Real Estate, Rental & Leasing | 0 (0.0%) | 2 (100.0%) |
| Professional & Scientific | 2 (9.5%) | 19 (90.5%) |
| Enterprise Management | 0 (0.0%) | 0 (0.0%) |
| Administrative & Support | 0 (0.0%) | 11 (100.0%) |
| Educational Services | 9 (33.3%) | 18 (66.7%) |
| Health Care & Social Assistance | 7 (29.2%) | 17 (70.8%) |
| Arts, Entertainment & Recreation | 0 (0.0%) | 10 (100.0%) |
| Accommodation & Food Services | 0 (0.0%) | 3 (100.0%) |
| Public Administration | 20 (71.4%) | 8 (28.6%) |
| Total | 113 (45.9%) | 133 (54.1%) |
Education in Garfield
School Enrollment in Garfield
The most common levels of schooling among the 125 students in Garfield are middle school (38 | 30.4%), elementary school (36 | 28.8%), and high school (23 | 18.4%).
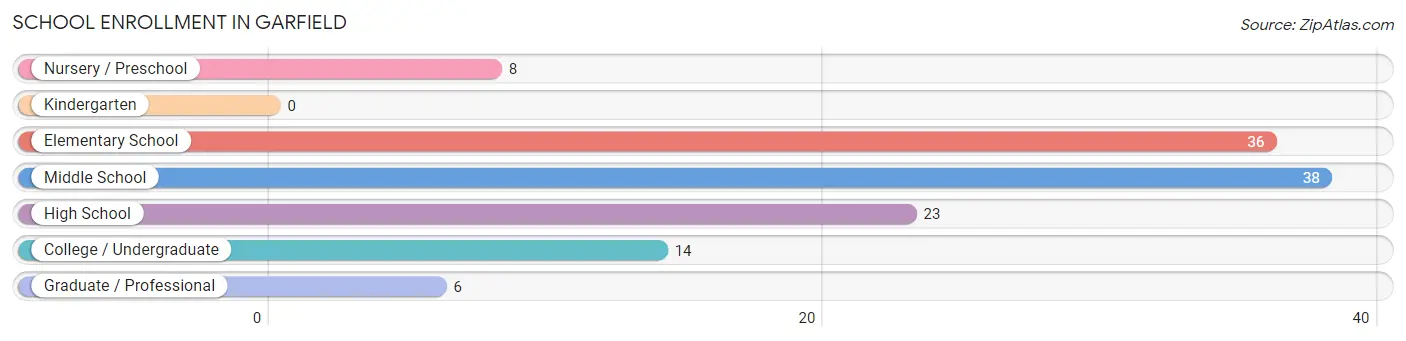
| School Level | # Students | % Students |
| Nursery / Preschool | 8 | 6.4% |
| Kindergarten | 0 | 0.0% |
| Elementary School | 36 | 28.8% |
| Middle School | 38 | 30.4% |
| High School | 23 | 18.4% |
| College / Undergraduate | 14 | 11.2% |
| Graduate / Professional | 6 | 4.8% |
| Total | 125 | 100.0% |
School Enrollment by Age by Funding Source in Garfield
Out of a total of 125 students who are enrolled in schools in Garfield, 25 (20.0%) attend a private institution, while the remaining 100 (80.0%) are enrolled in public schools. The age group of 5 to 9 year old has the highest likelihood of being enrolled in private schools, with 14 (38.9% in the age bracket) enrolled. Conversely, the age group of 3 to 4 year olds has the lowest likelihood of being enrolled in a private school, with 2 (100.0% in the age bracket) attending a public institution.
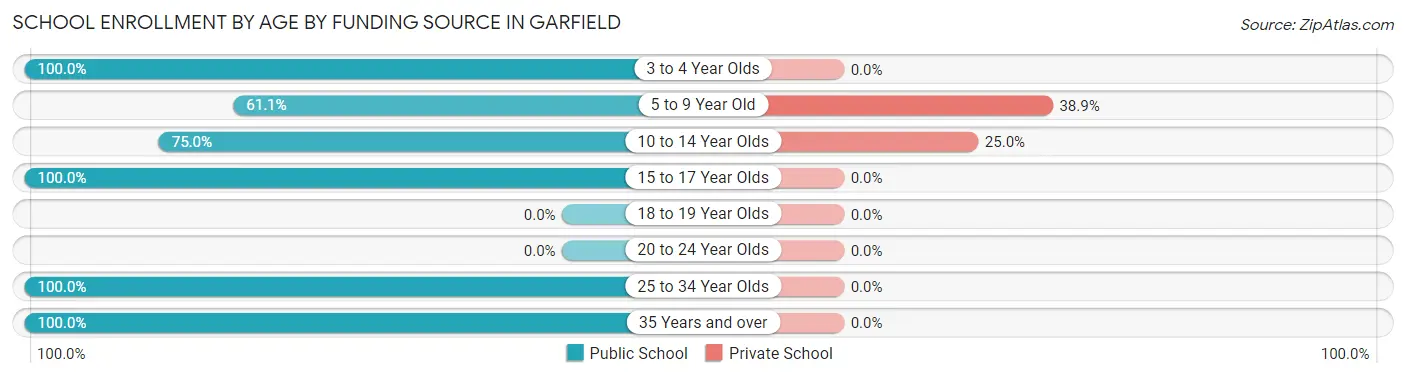
| Age Bracket | Public School | Private School |
| 3 to 4 Year Olds | 2 (100.0%) | 0 (0.0%) |
| 5 to 9 Year Old | 22 (61.1%) | 14 (38.9%) |
| 10 to 14 Year Olds | 33 (75.0%) | 11 (25.0%) |
| 15 to 17 Year Olds | 23 (100.0%) | 0 (0.0%) |
| 18 to 19 Year Olds | 0 (0.0%) | 0 (0.0%) |
| 20 to 24 Year Olds | 0 (0.0%) | 0 (0.0%) |
| 25 to 34 Year Olds | 17 (100.0%) | 0 (0.0%) |
| 35 Years and over | 3 (100.0%) | 0 (0.0%) |
| Total | 100 (80.0%) | 25 (20.0%) |
Educational Attainment by Field of Study in Garfield
Bio, nature & agricultural (36 | 31.3%), business (17 | 14.8%), education (15 | 13.0%), engineering (10 | 8.7%), and social sciences (8 | 7.0%) are the most common fields of study among 115 individuals in Garfield who have obtained a bachelor's degree or higher.
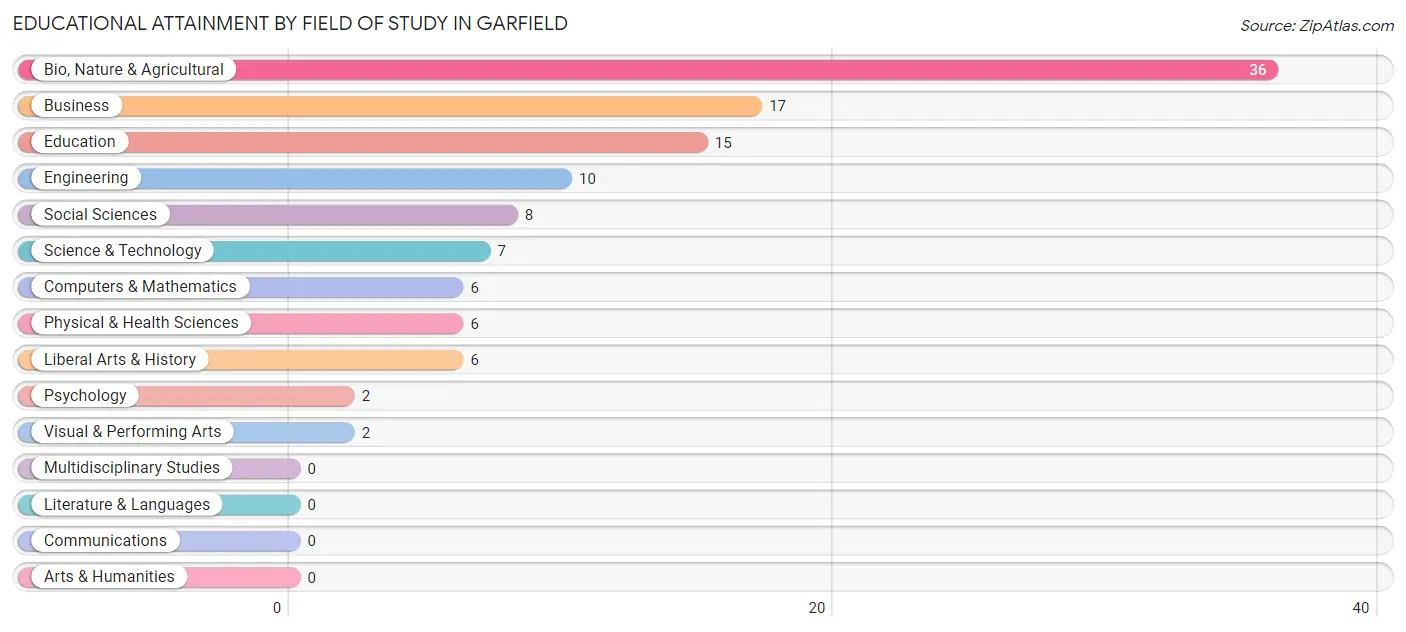
| Field of Study | # Graduates | % Graduates |
| Computers & Mathematics | 6 | 5.2% |
| Bio, Nature & Agricultural | 36 | 31.3% |
| Physical & Health Sciences | 6 | 5.2% |
| Psychology | 2 | 1.7% |
| Social Sciences | 8 | 7.0% |
| Engineering | 10 | 8.7% |
| Multidisciplinary Studies | 0 | 0.0% |
| Science & Technology | 7 | 6.1% |
| Business | 17 | 14.8% |
| Education | 15 | 13.0% |
| Literature & Languages | 0 | 0.0% |
| Liberal Arts & History | 6 | 5.2% |
| Visual & Performing Arts | 2 | 1.7% |
| Communications | 0 | 0.0% |
| Arts & Humanities | 0 | 0.0% |
| Total | 115 | 100.0% |
Transportation & Commute in Garfield
Vehicle Availability by Sex in Garfield
The most prevalent vehicle ownership categories in Garfield are males with 3 vehicles (43, accounting for 38.1%) and females with 3 vehicles (24, making up 33.1%).
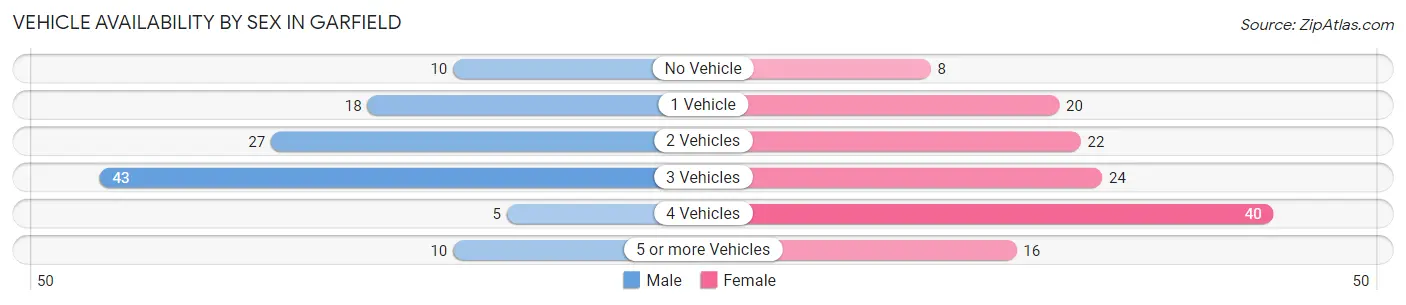
| Vehicles Available | Male | Female |
| No Vehicle | 10 (8.8%) | 8 (6.1%) |
| 1 Vehicle | 18 (15.9%) | 20 (15.4%) |
| 2 Vehicles | 27 (23.9%) | 22 (16.9%) |
| 3 Vehicles | 43 (38.1%) | 24 (18.5%) |
| 4 Vehicles | 5 (4.4%) | 40 (30.8%) |
| 5 or more Vehicles | 10 (8.8%) | 16 (12.3%) |
| Total | 113 (100.0%) | 130 (100.0%) |
Commute Time in Garfield
The most frequently occuring commute durations in Garfield are 30 to 34 minutes (62 commuters, 25.7%), 45 to 59 minutes (44 commuters, 18.3%), and less than 5 minutes (29 commuters, 12.0%).
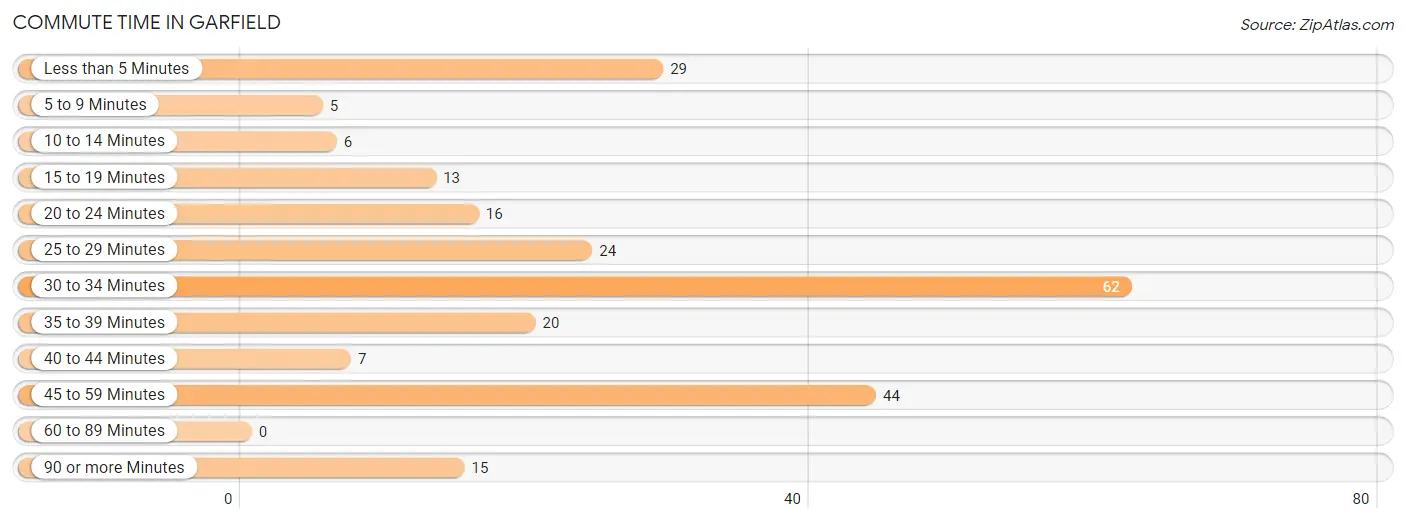
| Commute Time | # Commuters | % Commuters |
| Less than 5 Minutes | 29 | 12.0% |
| 5 to 9 Minutes | 5 | 2.1% |
| 10 to 14 Minutes | 6 | 2.5% |
| 15 to 19 Minutes | 13 | 5.4% |
| 20 to 24 Minutes | 16 | 6.6% |
| 25 to 29 Minutes | 24 | 10.0% |
| 30 to 34 Minutes | 62 | 25.7% |
| 35 to 39 Minutes | 20 | 8.3% |
| 40 to 44 Minutes | 7 | 2.9% |
| 45 to 59 Minutes | 44 | 18.3% |
| 60 to 89 Minutes | 0 | 0.0% |
| 90 or more Minutes | 15 | 6.2% |
Commute Time by Sex in Garfield
The most common commute times in Garfield are 30 to 34 minutes (36 commuters, 31.9%) for males and 45 to 59 minutes (38 commuters, 29.7%) for females.
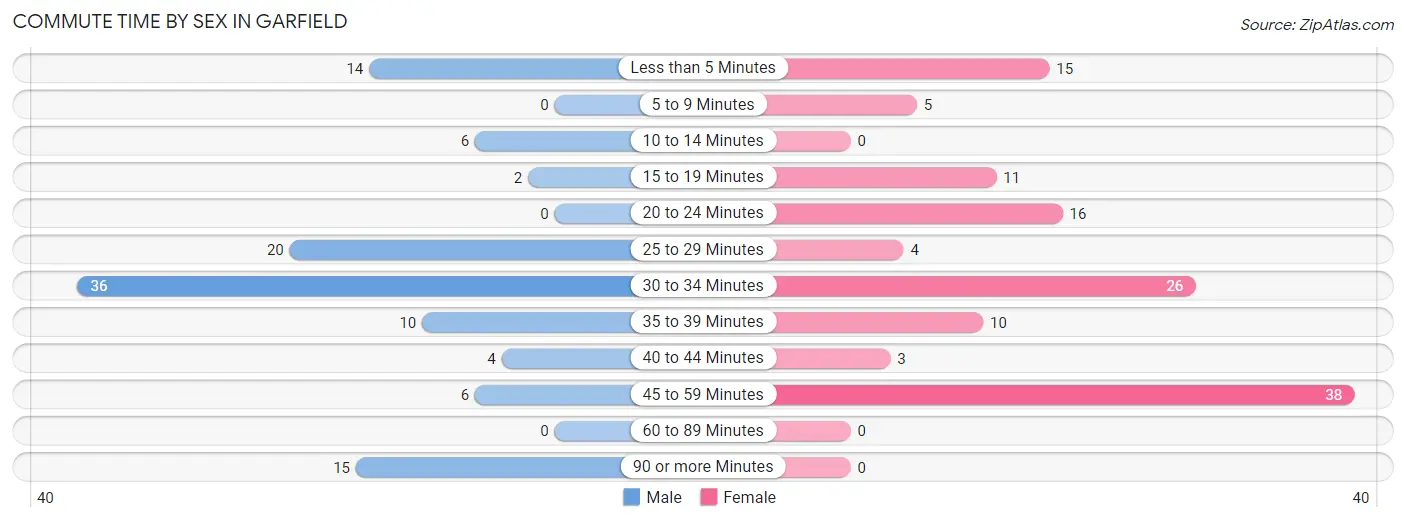
| Commute Time | Male | Female |
| Less than 5 Minutes | 14 (12.4%) | 15 (11.7%) |
| 5 to 9 Minutes | 0 (0.0%) | 5 (3.9%) |
| 10 to 14 Minutes | 6 (5.3%) | 0 (0.0%) |
| 15 to 19 Minutes | 2 (1.8%) | 11 (8.6%) |
| 20 to 24 Minutes | 0 (0.0%) | 16 (12.5%) |
| 25 to 29 Minutes | 20 (17.7%) | 4 (3.1%) |
| 30 to 34 Minutes | 36 (31.9%) | 26 (20.3%) |
| 35 to 39 Minutes | 10 (8.8%) | 10 (7.8%) |
| 40 to 44 Minutes | 4 (3.5%) | 3 (2.3%) |
| 45 to 59 Minutes | 6 (5.3%) | 38 (29.7%) |
| 60 to 89 Minutes | 0 (0.0%) | 0 (0.0%) |
| 90 or more Minutes | 15 (13.3%) | 0 (0.0%) |
Time of Departure to Work by Sex in Garfield
The most frequent times of departure to work in Garfield are 7:00 AM to 7:29 AM (33, 29.2%) for males and 7:00 AM to 7:29 AM (25, 19.5%) for females.
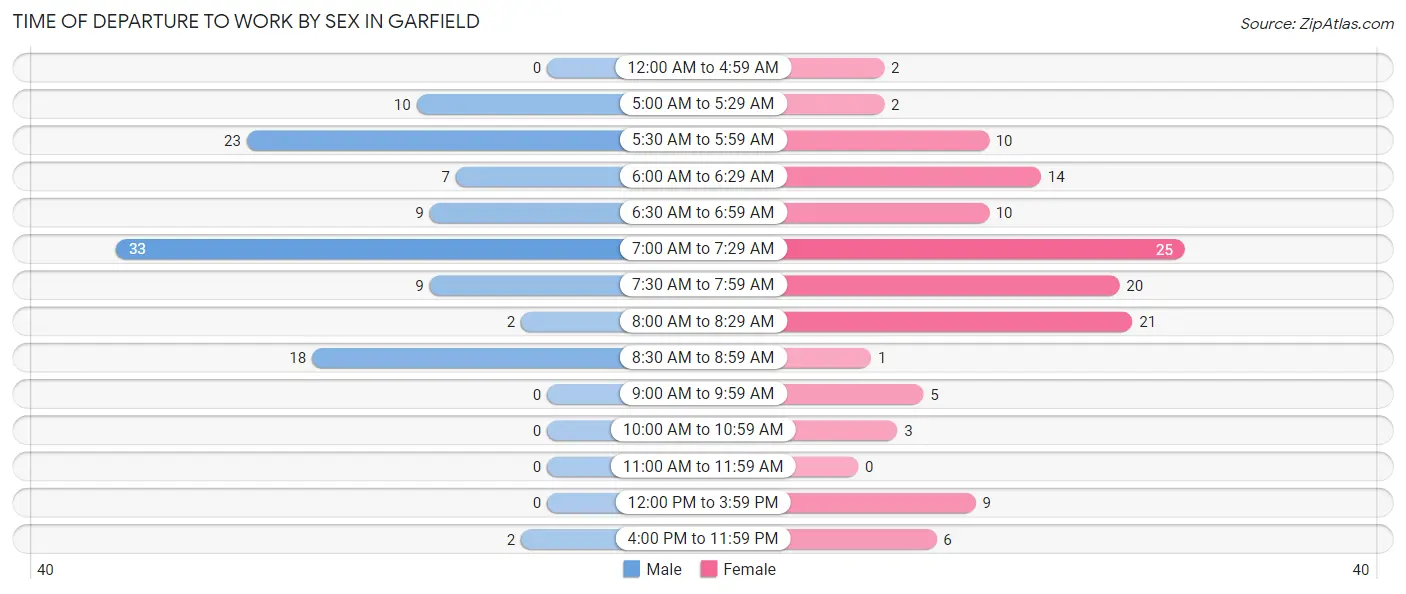
| Time of Departure | Male | Female |
| 12:00 AM to 4:59 AM | 0 (0.0%) | 2 (1.6%) |
| 5:00 AM to 5:29 AM | 10 (8.8%) | 2 (1.6%) |
| 5:30 AM to 5:59 AM | 23 (20.3%) | 10 (7.8%) |
| 6:00 AM to 6:29 AM | 7 (6.2%) | 14 (10.9%) |
| 6:30 AM to 6:59 AM | 9 (8.0%) | 10 (7.8%) |
| 7:00 AM to 7:29 AM | 33 (29.2%) | 25 (19.5%) |
| 7:30 AM to 7:59 AM | 9 (8.0%) | 20 (15.6%) |
| 8:00 AM to 8:29 AM | 2 (1.8%) | 21 (16.4%) |
| 8:30 AM to 8:59 AM | 18 (15.9%) | 1 (0.8%) |
| 9:00 AM to 9:59 AM | 0 (0.0%) | 5 (3.9%) |
| 10:00 AM to 10:59 AM | 0 (0.0%) | 3 (2.3%) |
| 11:00 AM to 11:59 AM | 0 (0.0%) | 0 (0.0%) |
| 12:00 PM to 3:59 PM | 0 (0.0%) | 9 (7.0%) |
| 4:00 PM to 11:59 PM | 2 (1.8%) | 6 (4.7%) |
| Total | 113 (100.0%) | 128 (100.0%) |
Housing Occupancy in Garfield
Occupancy by Ownership in Garfield
Of the total 230 dwellings in Garfield, owner-occupied units account for 190 (82.6%), while renter-occupied units make up 40 (17.4%).
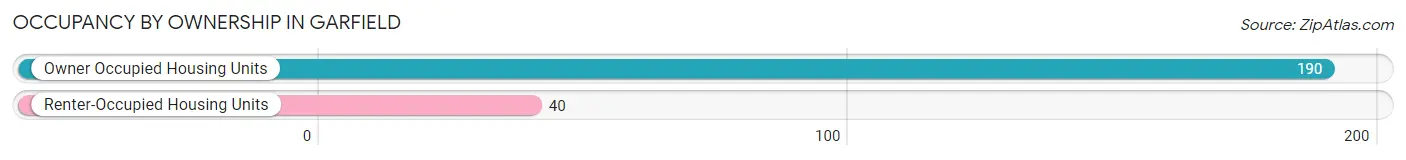
| Occupancy | # Housing Units | % Housing Units |
| Owner Occupied Housing Units | 190 | 82.6% |
| Renter-Occupied Housing Units | 40 | 17.4% |
| Total Occupied Housing Units | 230 | 100.0% |
Occupancy by Household Size in Garfield
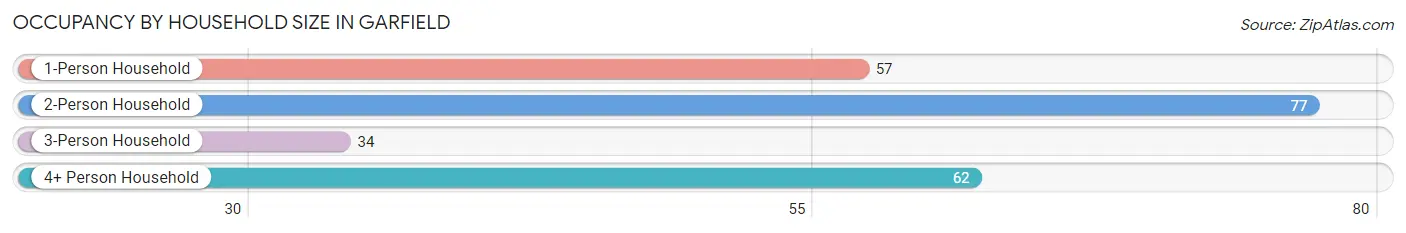
| Household Size | # Housing Units | % Housing Units |
| 1-Person Household | 57 | 24.8% |
| 2-Person Household | 77 | 33.5% |
| 3-Person Household | 34 | 14.8% |
| 4+ Person Household | 62 | 27.0% |
| Total Housing Units | 230 | 100.0% |
Occupancy by Ownership by Household Size in Garfield
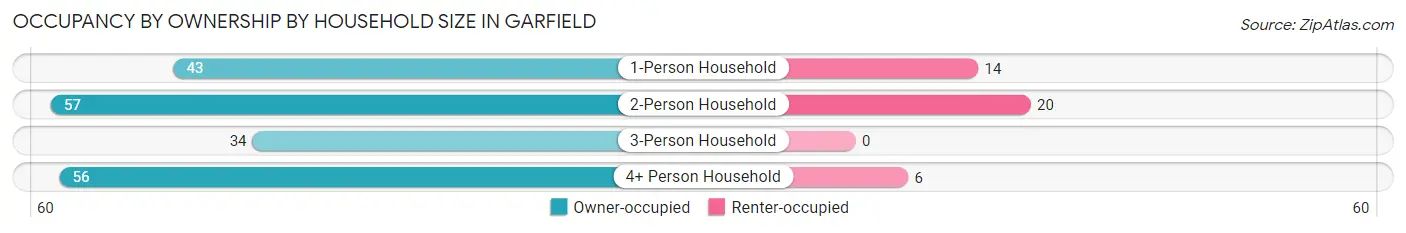
| Household Size | Owner-occupied | Renter-occupied |
| 1-Person Household | 43 (75.4%) | 14 (24.6%) |
| 2-Person Household | 57 (74.0%) | 20 (26.0%) |
| 3-Person Household | 34 (100.0%) | 0 (0.0%) |
| 4+ Person Household | 56 (90.3%) | 6 (9.7%) |
| Total Housing Units | 190 (82.6%) | 40 (17.4%) |
Occupancy by Educational Attainment in Garfield
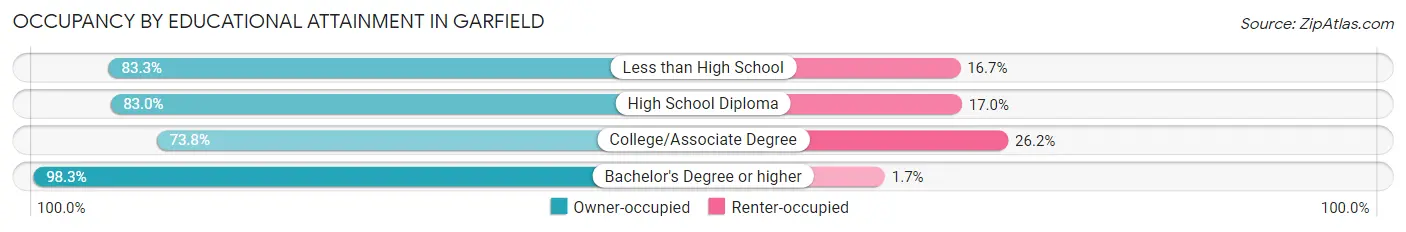
| Household Size | Owner-occupied | Renter-occupied |
| Less than High School | 10 (83.3%) | 2 (16.7%) |
| High School Diploma | 44 (83.0%) | 9 (17.0%) |
| College/Associate Degree | 79 (73.8%) | 28 (26.2%) |
| Bachelor's Degree or higher | 57 (98.3%) | 1 (1.7%) |
Occupancy by Age of Householder in Garfield
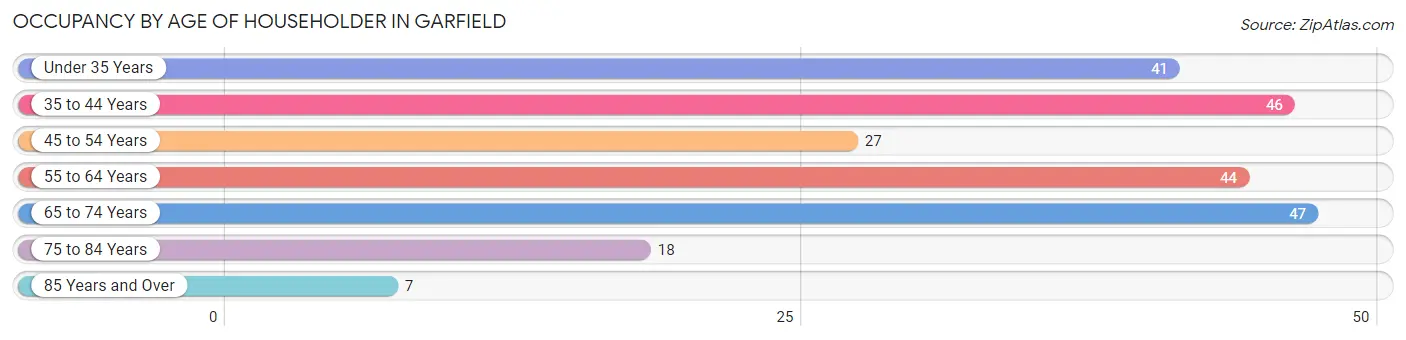
| Age Bracket | # Households | % Households |
| Under 35 Years | 41 | 17.8% |
| 35 to 44 Years | 46 | 20.0% |
| 45 to 54 Years | 27 | 11.7% |
| 55 to 64 Years | 44 | 19.1% |
| 65 to 74 Years | 47 | 20.4% |
| 75 to 84 Years | 18 | 7.8% |
| 85 Years and Over | 7 | 3.0% |
| Total | 230 | 100.0% |
Housing Finances in Garfield
Median Income by Occupancy in Garfield
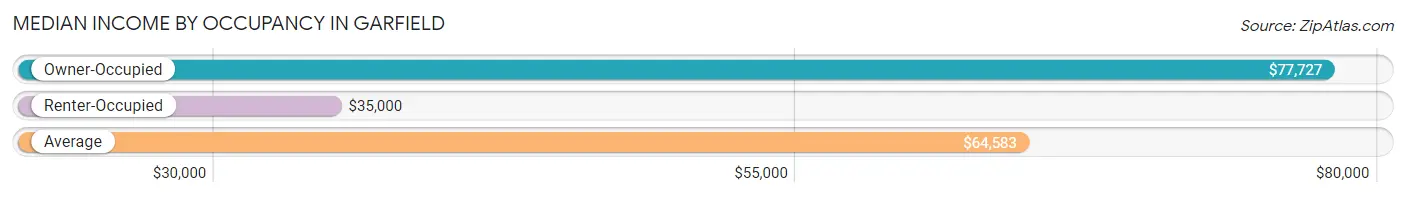
| Occupancy Type | # Households | Median Income |
| Owner-Occupied | 190 (82.6%) | $77,727 |
| Renter-Occupied | 40 (17.4%) | $35,000 |
| Average | 230 (100.0%) | $64,583 |
Occupancy by Householder Income Bracket in Garfield
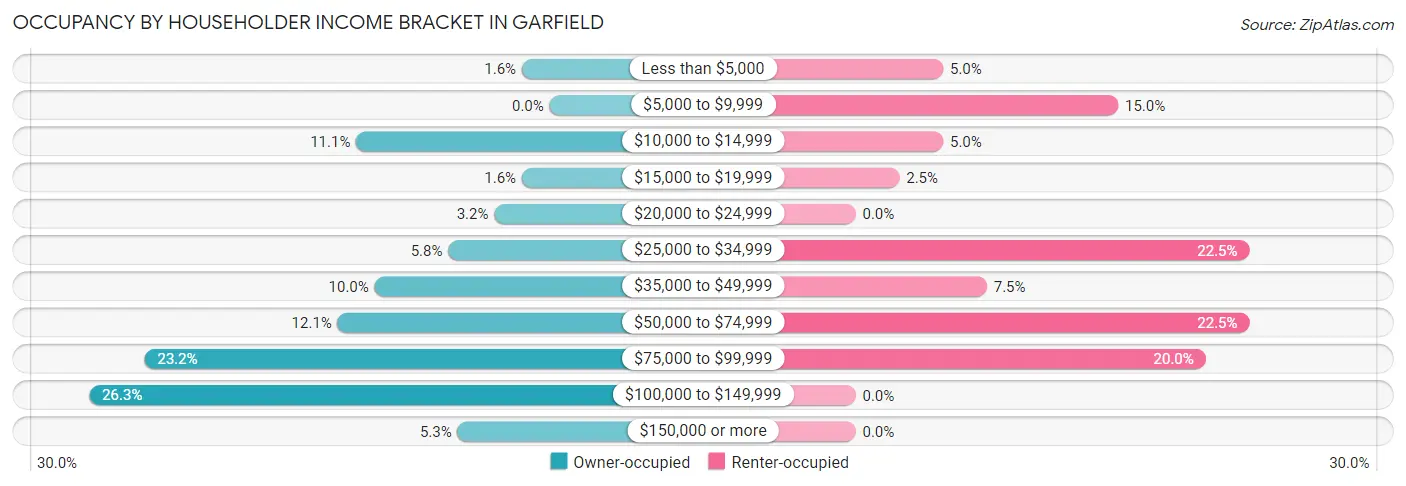
| Income Bracket | Owner-occupied | Renter-occupied |
| Less than $5,000 | 3 (1.6%) | 2 (5.0%) |
| $5,000 to $9,999 | 0 (0.0%) | 6 (15.0%) |
| $10,000 to $14,999 | 21 (11.1%) | 2 (5.0%) |
| $15,000 to $19,999 | 3 (1.6%) | 1 (2.5%) |
| $20,000 to $24,999 | 6 (3.2%) | 0 (0.0%) |
| $25,000 to $34,999 | 11 (5.8%) | 9 (22.5%) |
| $35,000 to $49,999 | 19 (10.0%) | 3 (7.5%) |
| $50,000 to $74,999 | 23 (12.1%) | 9 (22.5%) |
| $75,000 to $99,999 | 44 (23.2%) | 8 (20.0%) |
| $100,000 to $149,999 | 50 (26.3%) | 0 (0.0%) |
| $150,000 or more | 10 (5.3%) | 0 (0.0%) |
| Total | 190 (100.0%) | 40 (100.0%) |
Monthly Housing Cost Tiers in Garfield
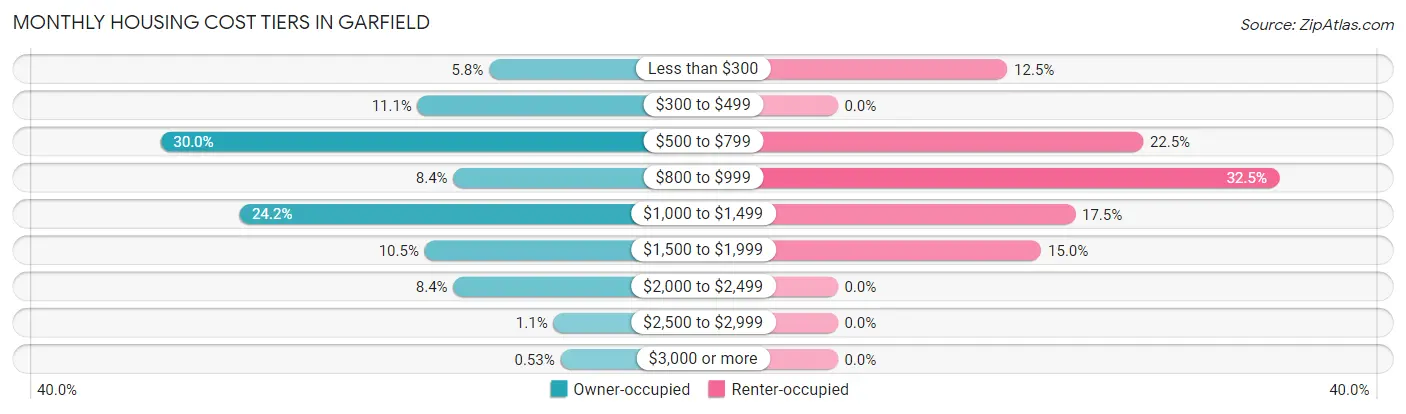
| Monthly Cost | Owner-occupied | Renter-occupied |
| Less than $300 | 11 (5.8%) | 5 (12.5%) |
| $300 to $499 | 21 (11.1%) | 0 (0.0%) |
| $500 to $799 | 57 (30.0%) | 9 (22.5%) |
| $800 to $999 | 16 (8.4%) | 13 (32.5%) |
| $1,000 to $1,499 | 46 (24.2%) | 7 (17.5%) |
| $1,500 to $1,999 | 20 (10.5%) | 6 (15.0%) |
| $2,000 to $2,499 | 16 (8.4%) | 0 (0.0%) |
| $2,500 to $2,999 | 2 (1.1%) | 0 (0.0%) |
| $3,000 or more | 1 (0.5%) | 0 (0.0%) |
| Total | 190 (100.0%) | 40 (100.0%) |
Physical Housing Characteristics in Garfield
Housing Structures in Garfield
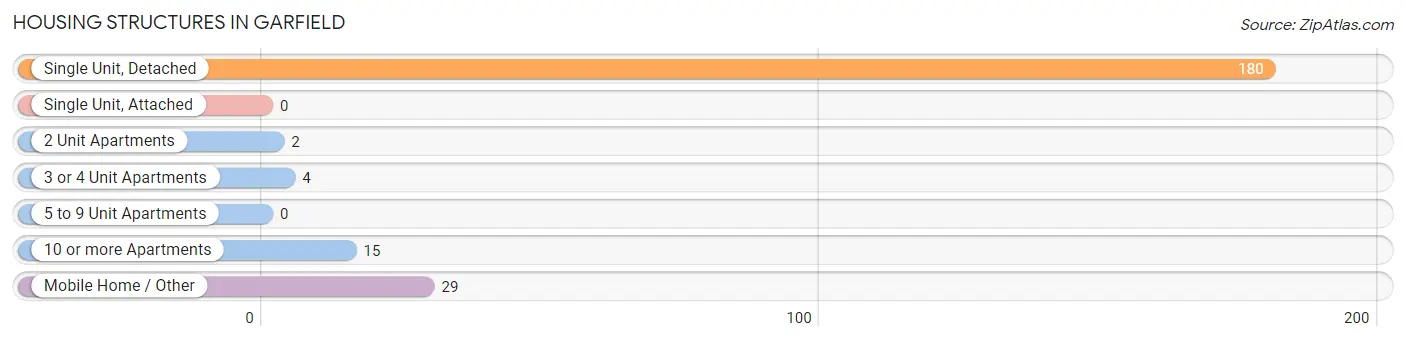
| Structure Type | # Housing Units | % Housing Units |
| Single Unit, Detached | 180 | 78.3% |
| Single Unit, Attached | 0 | 0.0% |
| 2 Unit Apartments | 2 | 0.9% |
| 3 or 4 Unit Apartments | 4 | 1.7% |
| 5 to 9 Unit Apartments | 0 | 0.0% |
| 10 or more Apartments | 15 | 6.5% |
| Mobile Home / Other | 29 | 12.6% |
| Total | 230 | 100.0% |
Housing Structures by Occupancy in Garfield
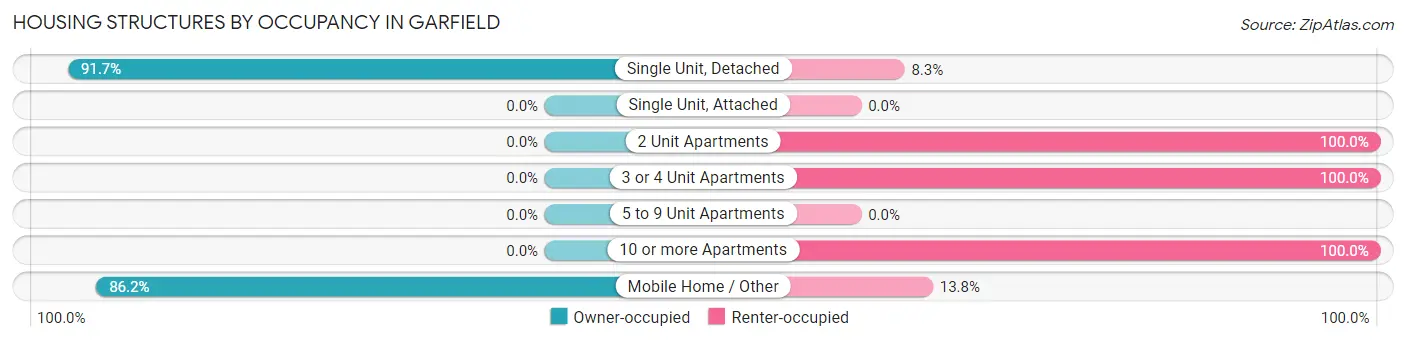
| Structure Type | Owner-occupied | Renter-occupied |
| Single Unit, Detached | 165 (91.7%) | 15 (8.3%) |
| Single Unit, Attached | 0 (0.0%) | 0 (0.0%) |
| 2 Unit Apartments | 0 (0.0%) | 2 (100.0%) |
| 3 or 4 Unit Apartments | 0 (0.0%) | 4 (100.0%) |
| 5 to 9 Unit Apartments | 0 (0.0%) | 0 (0.0%) |
| 10 or more Apartments | 0 (0.0%) | 15 (100.0%) |
| Mobile Home / Other | 25 (86.2%) | 4 (13.8%) |
| Total | 190 (82.6%) | 40 (17.4%) |
Housing Structures by Number of Rooms in Garfield
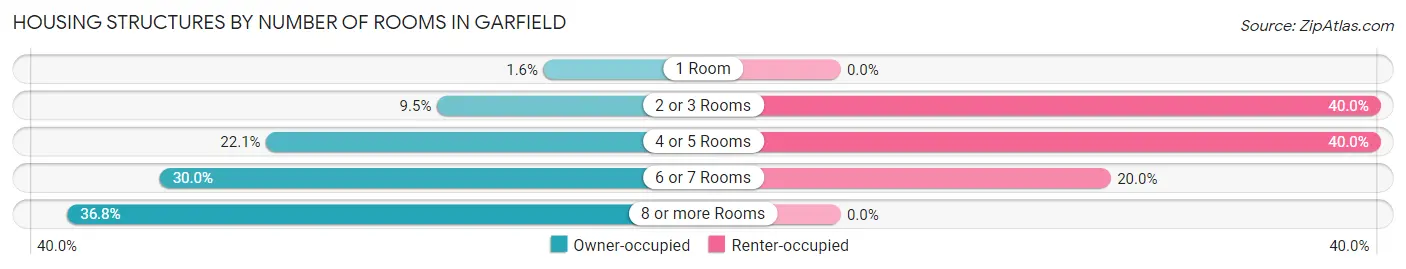
| Number of Rooms | Owner-occupied | Renter-occupied |
| 1 Room | 3 (1.6%) | 0 (0.0%) |
| 2 or 3 Rooms | 18 (9.5%) | 16 (40.0%) |
| 4 or 5 Rooms | 42 (22.1%) | 16 (40.0%) |
| 6 or 7 Rooms | 57 (30.0%) | 8 (20.0%) |
| 8 or more Rooms | 70 (36.8%) | 0 (0.0%) |
| Total | 190 (100.0%) | 40 (100.0%) |
Housing Structure by Heating Type in Garfield
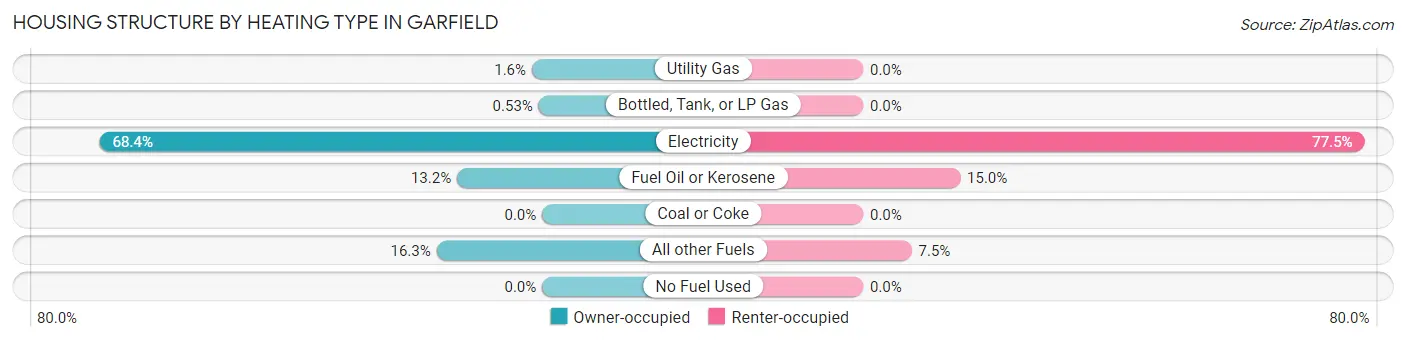
| Heating Type | Owner-occupied | Renter-occupied |
| Utility Gas | 3 (1.6%) | 0 (0.0%) |
| Bottled, Tank, or LP Gas | 1 (0.5%) | 0 (0.0%) |
| Electricity | 130 (68.4%) | 31 (77.5%) |
| Fuel Oil or Kerosene | 25 (13.2%) | 6 (15.0%) |
| Coal or Coke | 0 (0.0%) | 0 (0.0%) |
| All other Fuels | 31 (16.3%) | 3 (7.5%) |
| No Fuel Used | 0 (0.0%) | 0 (0.0%) |
| Total | 190 (100.0%) | 40 (100.0%) |
Household Vehicle Usage in Garfield
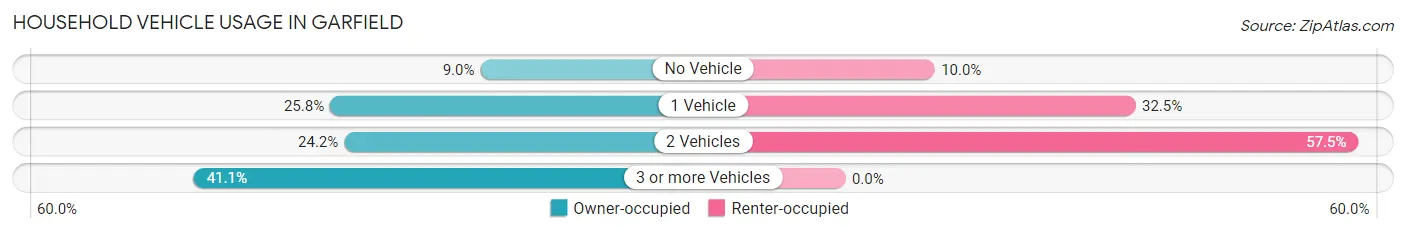
| Vehicles per Household | Owner-occupied | Renter-occupied |
| No Vehicle | 17 (8.9%) | 4 (10.0%) |
| 1 Vehicle | 49 (25.8%) | 13 (32.5%) |
| 2 Vehicles | 46 (24.2%) | 23 (57.5%) |
| 3 or more Vehicles | 78 (41.0%) | 0 (0.0%) |
| Total | 190 (100.0%) | 40 (100.0%) |
Real Estate & Mortgages in Garfield
Real Estate and Mortgage Overview in Garfield
| Characteristic | Without Mortgage | With Mortgage |
| Housing Units | 52 | 138 |
| Median Property Value | $153,600 | $192,000 |
| Median Household Income | $44,583 | $0 |
| Monthly Housing Costs | $455 | $1 |
| Real Estate Taxes | $1,417 | $10 |
Property Value by Mortgage Status in Garfield
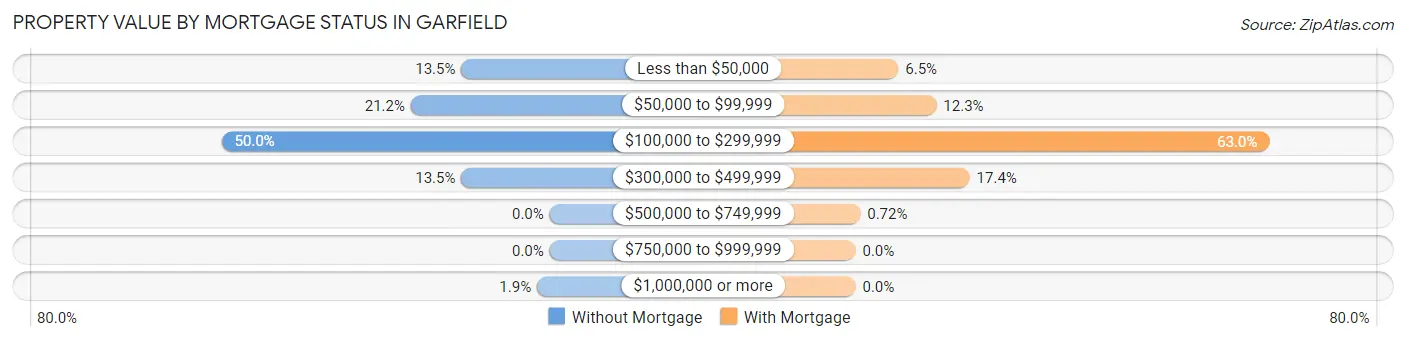
| Property Value | Without Mortgage | With Mortgage |
| Less than $50,000 | 7 (13.5%) | 9 (6.5%) |
| $50,000 to $99,999 | 11 (21.1%) | 17 (12.3%) |
| $100,000 to $299,999 | 26 (50.0%) | 87 (63.0%) |
| $300,000 to $499,999 | 7 (13.5%) | 24 (17.4%) |
| $500,000 to $749,999 | 0 (0.0%) | 1 (0.7%) |
| $750,000 to $999,999 | 0 (0.0%) | 0 (0.0%) |
| $1,000,000 or more | 1 (1.9%) | 0 (0.0%) |
| Total | 52 (100.0%) | 138 (100.0%) |
Household Income by Mortgage Status in Garfield
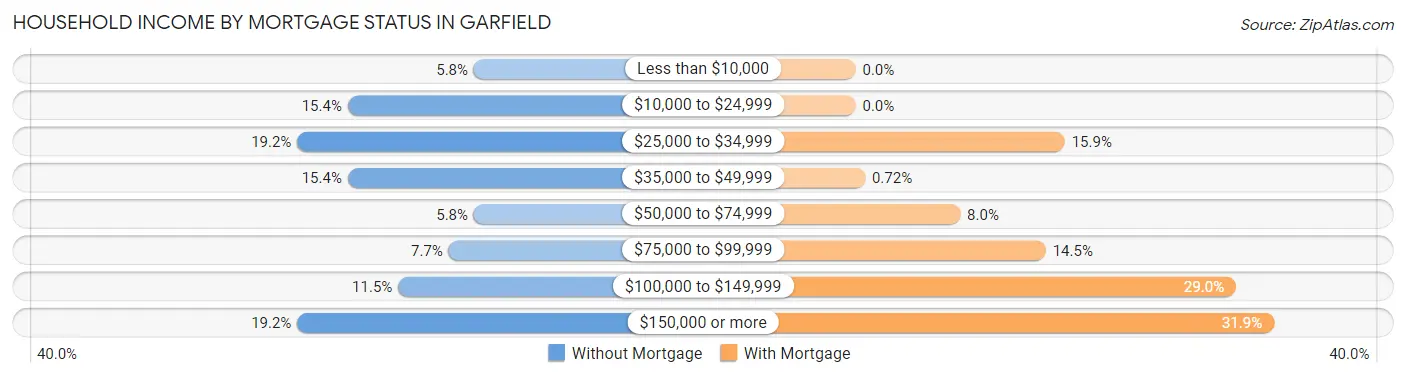
| Household Income | Without Mortgage | With Mortgage |
| Less than $10,000 | 3 (5.8%) | 0 (0.0%) |
| $10,000 to $24,999 | 8 (15.4%) | 0 (0.0%) |
| $25,000 to $34,999 | 10 (19.2%) | 22 (15.9%) |
| $35,000 to $49,999 | 8 (15.4%) | 1 (0.7%) |
| $50,000 to $74,999 | 3 (5.8%) | 11 (8.0%) |
| $75,000 to $99,999 | 4 (7.7%) | 20 (14.5%) |
| $100,000 to $149,999 | 6 (11.5%) | 40 (29.0%) |
| $150,000 or more | 10 (19.2%) | 44 (31.9%) |
| Total | 52 (100.0%) | 138 (100.0%) |
Property Value to Household Income Ratio in Garfield
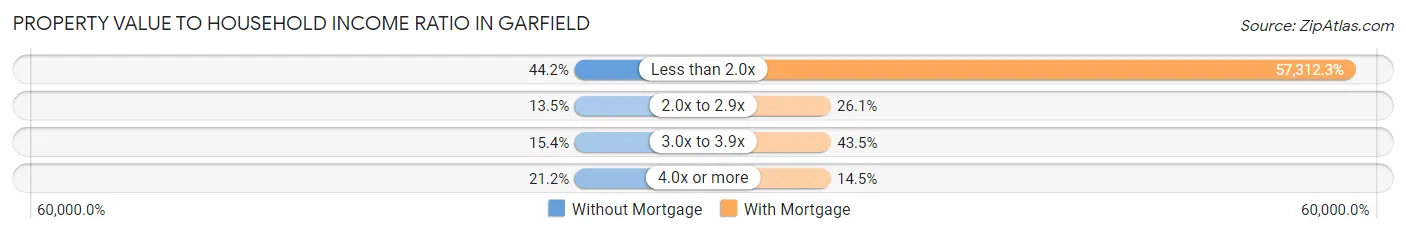
| Value-to-Income Ratio | Without Mortgage | With Mortgage |
| Less than 2.0x | 23 (44.2%) | 79,091 (57,312.3%) |
| 2.0x to 2.9x | 7 (13.5%) | 36 (26.1%) |
| 3.0x to 3.9x | 8 (15.4%) | 60 (43.5%) |
| 4.0x or more | 11 (21.1%) | 20 (14.5%) |
| Total | 52 (100.0%) | 138 (100.0%) |
Real Estate Taxes by Mortgage Status in Garfield
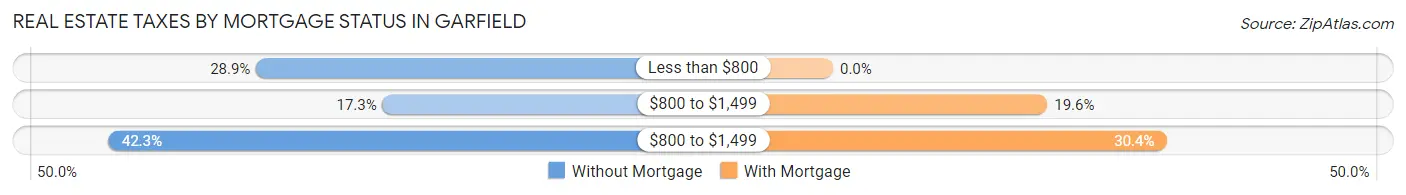
| Property Taxes | Without Mortgage | With Mortgage |
| Less than $800 | 15 (28.8%) | 0 (0.0%) |
| $800 to $1,499 | 9 (17.3%) | 27 (19.6%) |
| $800 to $1,499 | 22 (42.3%) | 42 (30.4%) |
| Total | 52 (100.0%) | 138 (100.0%) |
Health & Disability in Garfield
Health Insurance Coverage by Age in Garfield
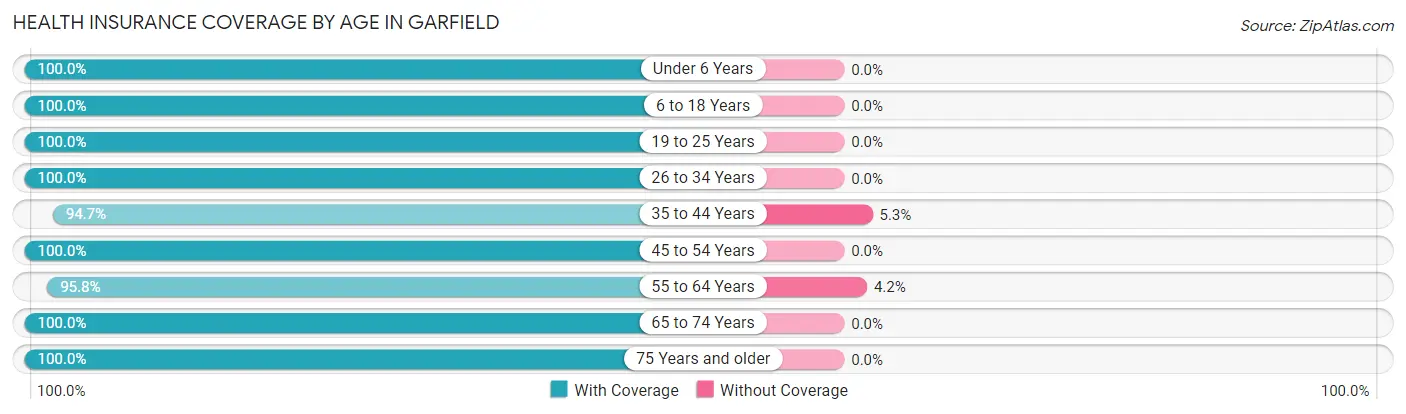
| Age Bracket | With Coverage | Without Coverage |
| Under 6 Years | 43 (100.0%) | 0 (0.0%) |
| 6 to 18 Years | 111 (100.0%) | 0 (0.0%) |
| 19 to 25 Years | 3 (100.0%) | 0 (0.0%) |
| 26 to 34 Years | 83 (100.0%) | 0 (0.0%) |
| 35 to 44 Years | 90 (94.7%) | 5 (5.3%) |
| 45 to 54 Years | 77 (100.0%) | 0 (0.0%) |
| 55 to 64 Years | 68 (95.8%) | 3 (4.2%) |
| 65 to 74 Years | 71 (100.0%) | 0 (0.0%) |
| 75 Years and older | 32 (100.0%) | 0 (0.0%) |
| Total | 578 (98.6%) | 8 (1.4%) |
Health Insurance Coverage by Citizenship Status in Garfield
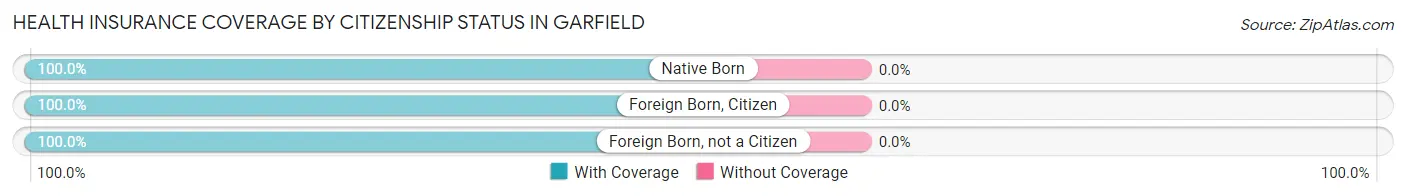
| Citizenship Status | With Coverage | Without Coverage |
| Native Born | 43 (100.0%) | 0 (0.0%) |
| Foreign Born, Citizen | 111 (100.0%) | 0 (0.0%) |
| Foreign Born, not a Citizen | 3 (100.0%) | 0 (0.0%) |
Health Insurance Coverage by Household Income in Garfield
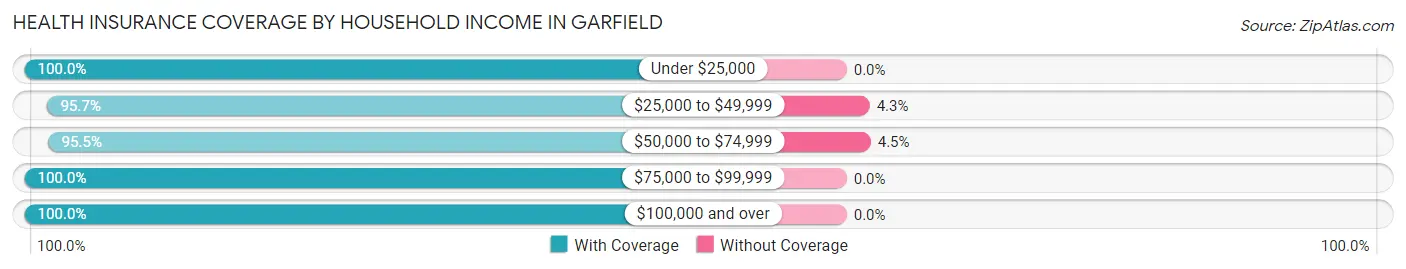
| Household Income | With Coverage | Without Coverage |
| Under $25,000 | 75 (100.0%) | 0 (0.0%) |
| $25,000 to $49,999 | 67 (95.7%) | 3 (4.3%) |
| $50,000 to $74,999 | 106 (95.5%) | 5 (4.5%) |
| $75,000 to $99,999 | 131 (100.0%) | 0 (0.0%) |
| $100,000 and over | 199 (100.0%) | 0 (0.0%) |
Public vs Private Health Insurance Coverage by Age in Garfield
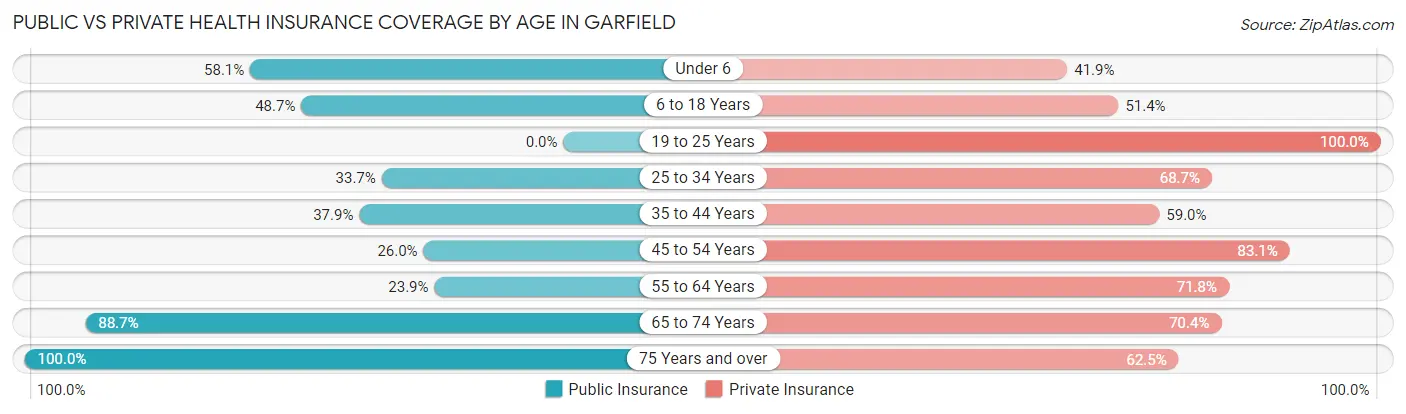
| Age Bracket | Public Insurance | Private Insurance |
| Under 6 | 25 (58.1%) | 18 (41.9%) |
| 6 to 18 Years | 54 (48.6%) | 57 (51.3%) |
| 19 to 25 Years | 0 (0.0%) | 3 (100.0%) |
| 25 to 34 Years | 28 (33.7%) | 57 (68.7%) |
| 35 to 44 Years | 36 (37.9%) | 56 (59.0%) |
| 45 to 54 Years | 20 (26.0%) | 64 (83.1%) |
| 55 to 64 Years | 17 (23.9%) | 51 (71.8%) |
| 65 to 74 Years | 63 (88.7%) | 50 (70.4%) |
| 75 Years and over | 32 (100.0%) | 20 (62.5%) |
| Total | 275 (46.9%) | 376 (64.2%) |
Disability Status by Sex by Age in Garfield
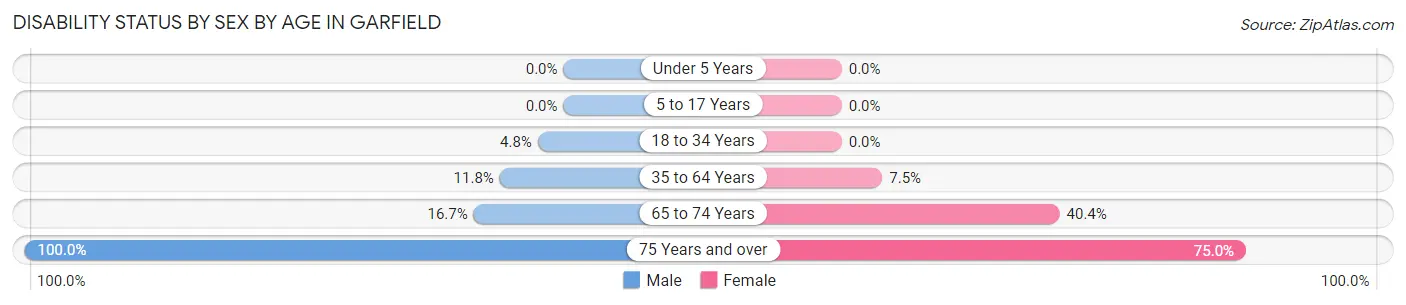
| Age Bracket | Male | Female |
| Under 5 Years | 0 (0.0%) | 0 (0.0%) |
| 5 to 17 Years | 0 (0.0%) | 0 (0.0%) |
| 18 to 34 Years | 2 (4.8%) | 0 (0.0%) |
| 35 to 64 Years | 13 (11.8%) | 10 (7.5%) |
| 65 to 74 Years | 4 (16.7%) | 19 (40.4%) |
| 75 Years and over | 12 (100.0%) | 15 (75.0%) |
Disability Class by Sex by Age in Garfield
Disability Class: Hearing Difficulty
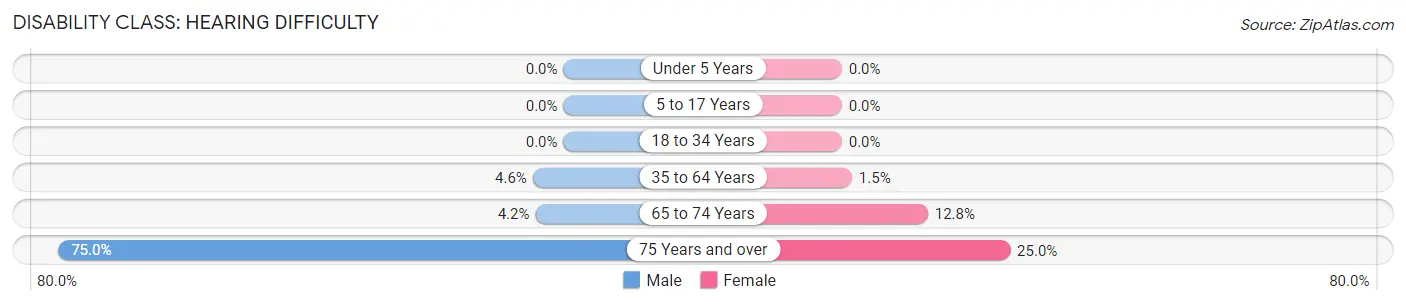
| Age Bracket | Male | Female |
| Under 5 Years | 0 (0.0%) | 0 (0.0%) |
| 5 to 17 Years | 0 (0.0%) | 0 (0.0%) |
| 18 to 34 Years | 0 (0.0%) | 0 (0.0%) |
| 35 to 64 Years | 5 (4.5%) | 2 (1.5%) |
| 65 to 74 Years | 1 (4.2%) | 6 (12.8%) |
| 75 Years and over | 9 (75.0%) | 5 (25.0%) |
Disability Class: Vision Difficulty
| Age Bracket | Male | Female |
| Under 5 Years | 0 (0.0%) | 0 (0.0%) |
| 5 to 17 Years | 0 (0.0%) | 0 (0.0%) |
| 18 to 34 Years | 0 (0.0%) | 0 (0.0%) |
| 35 to 64 Years | 0 (0.0%) | 0 (0.0%) |
| 65 to 74 Years | 0 (0.0%) | 0 (0.0%) |
| 75 Years and over | 0 (0.0%) | 0 (0.0%) |
Disability Class: Cognitive Difficulty
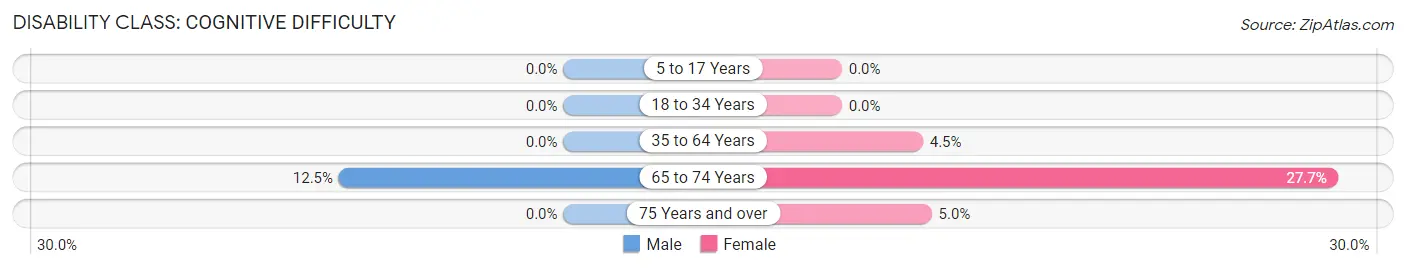
| Age Bracket | Male | Female |
| 5 to 17 Years | 0 (0.0%) | 0 (0.0%) |
| 18 to 34 Years | 0 (0.0%) | 0 (0.0%) |
| 35 to 64 Years | 0 (0.0%) | 6 (4.5%) |
| 65 to 74 Years | 3 (12.5%) | 13 (27.7%) |
| 75 Years and over | 0 (0.0%) | 1 (5.0%) |
Disability Class: Ambulatory Difficulty
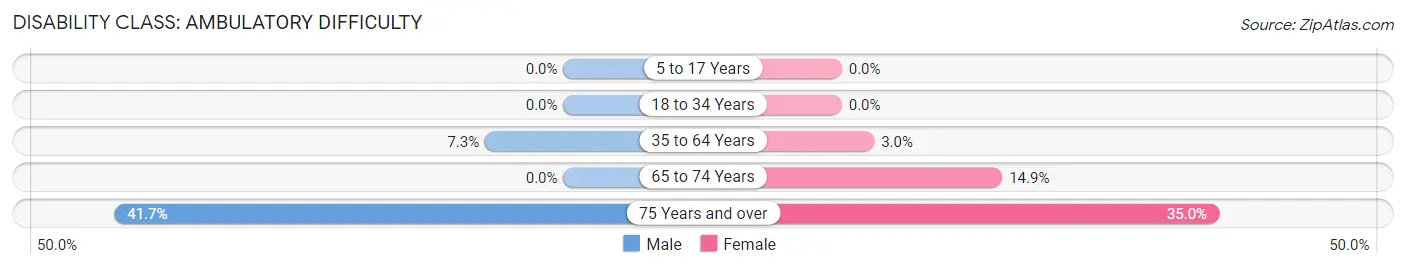
| Age Bracket | Male | Female |
| 5 to 17 Years | 0 (0.0%) | 0 (0.0%) |
| 18 to 34 Years | 0 (0.0%) | 0 (0.0%) |
| 35 to 64 Years | 8 (7.3%) | 4 (3.0%) |
| 65 to 74 Years | 0 (0.0%) | 7 (14.9%) |
| 75 Years and over | 5 (41.7%) | 7 (35.0%) |
Disability Class: Self-Care Difficulty
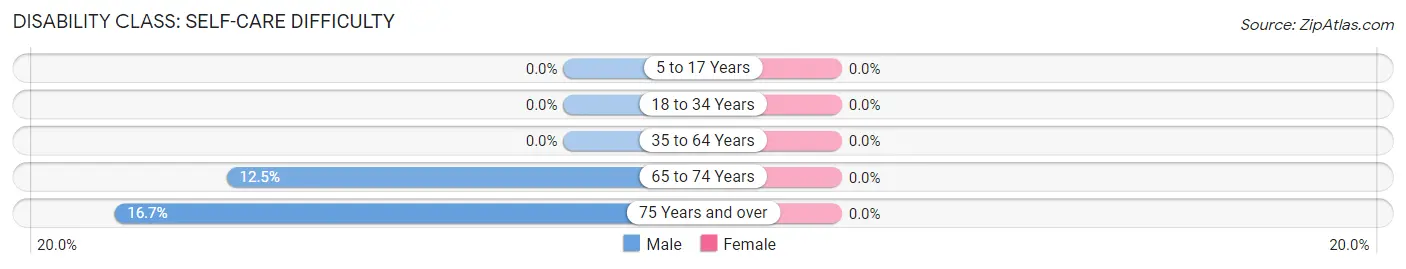
| Age Bracket | Male | Female |
| 5 to 17 Years | 0 (0.0%) | 0 (0.0%) |
| 18 to 34 Years | 0 (0.0%) | 0 (0.0%) |
| 35 to 64 Years | 0 (0.0%) | 0 (0.0%) |
| 65 to 74 Years | 3 (12.5%) | 0 (0.0%) |
| 75 Years and over | 2 (16.7%) | 0 (0.0%) |
Technology Access in Garfield
Computing Device Access in Garfield
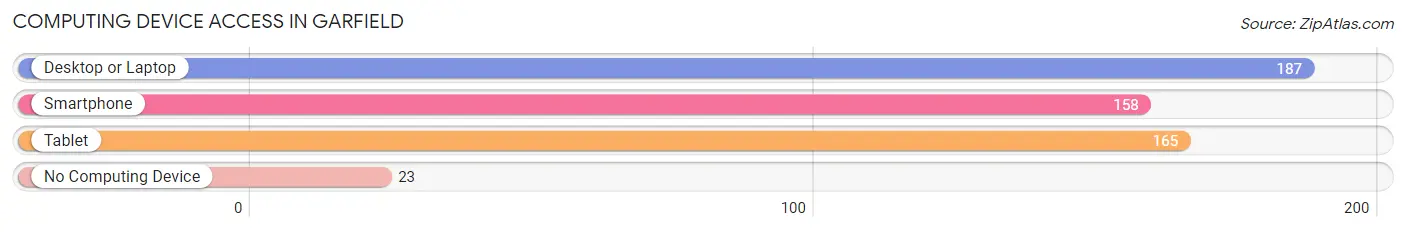
| Device Type | # Households | % Households |
| Desktop or Laptop | 187 | 81.3% |
| Smartphone | 158 | 68.7% |
| Tablet | 165 | 71.7% |
| No Computing Device | 23 | 10.0% |
| Total | 230 | 100.0% |
Internet Access in Garfield
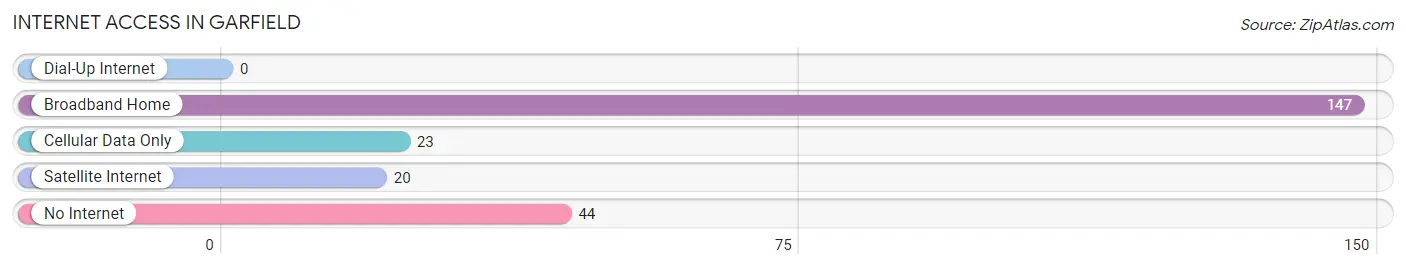
| Internet Type | # Households | % Households |
| Dial-Up Internet | 0 | 0.0% |
| Broadband Home | 147 | 63.9% |
| Cellular Data Only | 23 | 10.0% |
| Satellite Internet | 20 | 8.7% |
| No Internet | 44 | 19.1% |
| Total | 230 | 100.0% |
Garfield Summary
Garfield, Washington is a small town located in the eastern part of the state, about 20 miles south of Spokane. It is situated in the Spokane Valley, which is part of the Columbia Plateau. The town is surrounded by rolling hills and farmland, and is home to a population of just over 1,000 people.
Geography
Garfield is located in the Spokane Valley, which is part of the Columbia Plateau. The town is situated at an elevation of 1,890 feet above sea level. The area is characterized by rolling hills and farmland, with the Spokane River running through the valley. The climate in Garfield is generally mild, with hot summers and cold winters.
Economy
Garfield’s economy is largely based on agriculture. The town is home to several farms, which produce a variety of crops, including wheat, barley, and hay. The town also has a small manufacturing sector, which produces a variety of products, including furniture, clothing, and electronics.
Demographics
As of the 2010 census, Garfield had a population of 1,072 people. The population is predominantly white, with a small minority of African Americans, Hispanics, and Native Americans. The median household income in Garfield is $41,250, and the median age is 37.
History
Garfield was founded in 1883 by a group of settlers from the Midwest. The town was named after President James Garfield, who had recently been assassinated. The town quickly grew, and by the early 1900s, it had become a thriving agricultural center. In the 1950s, the town began to decline, as many of its residents moved away in search of better economic opportunities. However, in recent years, the town has seen a resurgence, as more people have moved to the area in search of a rural lifestyle.
Garfield is a small town with a rich history and a bright future. It is a great place to live, work, and raise a family. With its rolling hills and farmland, Garfield is a great place to get away from the hustle and bustle of city life. The town is home to a diverse population, and its economy is largely based on agriculture. Garfield is a great place to call home.
Common Questions
What is Per Capita Income in Garfield?
Per Capita income in Garfield is $32,212.
What is the Median Family Income in Garfield?
Median Family Income in Garfield is $83,250.
What is the Median Household income in Garfield?
Median Household Income in Garfield is $64,583.
What is Income or Wage Gap in Garfield?
Income or Wage Gap in Garfield is 31.2%.
Women in Garfield earn 68.8 cents for every dollar earned by a man.
What is Inequality or Gini Index in Garfield?
Inequality or Gini Index in Garfield is 0.43.
What is the Total Population of Garfield?
Total Population of Garfield is 586.
What is the Total Male Population of Garfield?
Total Male Population of Garfield is 246.
What is the Total Female Population of Garfield?
Total Female Population of Garfield is 340.
What is the Ratio of Males per 100 Females in Garfield?
There are 72.35 Males per 100 Females in Garfield.
What is the Ratio of Females per 100 Males in Garfield?
There are 138.21 Females per 100 Males in Garfield.
What is the Median Population Age in Garfield?
Median Population Age in Garfield is 39.6 Years.
What is the Average Family Size in Garfield
Average Family Size in Garfield is 3.0 People.
What is the Average Household Size in Garfield
Average Household Size in Garfield is 2.5 People.
How Large is the Labor Force in Garfield?
There are 255 People in the Labor Forcein in Garfield.
What is the Percentage of People in the Labor Force in Garfield?
57.0% of People are in the Labor Force in Garfield.
What is the Unemployment Rate in Garfield?
Unemployment Rate in Garfield is 3.5%.