Coulee Dam, WA Map & Demographics
Coulee Dam Map
Coulee Dam Overview
$41,629
PER CAPITA INCOME
$82,039
AVG FAMILY INCOME
$65,313
AVG HOUSEHOLD INCOME
19.6%
WAGE / INCOME GAP [ % ]
80.4¢/ $1
WAGE / INCOME GAP [ $ ]
0.38
INEQUALITY / GINI INDEX
1,334
TOTAL POPULATION
681
MALE POPULATION
653
FEMALE POPULATION
104.29
MALES / 100 FEMALES
95.89
FEMALES / 100 MALES
43.2
MEDIAN AGE
3.0
AVG FAMILY SIZE
2.2
AVG HOUSEHOLD SIZE
632
LABOR FORCE [ PEOPLE ]
57.0%
PERCENT IN LABOR FORCE
6.0%
UNEMPLOYMENT RATE
Coulee Dam Zip Codes
Coulee Dam Area Codes
Income in Coulee Dam
Income Overview in Coulee Dam
Per Capita Income in Coulee Dam is $41,629, while median incomes of families and households are $82,039 and $65,313 respectively.
| Characteristic | Number | Measure |
| Per Capita Income | 1,334 | $41,629 |
| Median Family Income | 315 | $82,039 |
| Mean Family Income | 315 | $98,848 |
| Median Household Income | 583 | $65,313 |
| Mean Household Income | 583 | $87,941 |
| Income Deficit | 315 | $0 |
| Wage / Income Gap (%) | 1,334 | 19.58% |
| Wage / Income Gap ($) | 1,334 | 80.42¢ per $1 |
| Gini / Inequality Index | 1,334 | 0.38 |
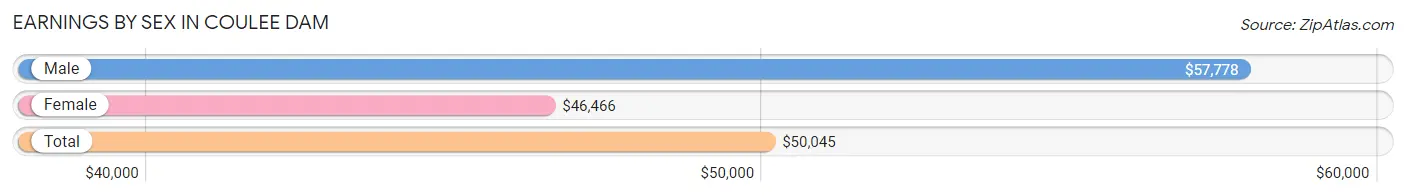
Earnings by Sex in Coulee Dam
Average Earnings in Coulee Dam are $50,045, $57,778 for men and $46,466 for women, a difference of 19.6%.
| Sex | Number | Average Earnings |
| Male | 370 (50.8%) | $57,778 |
| Female | 358 (49.2%) | $46,466 |
| Total | 728 (100.0%) | $50,045 |
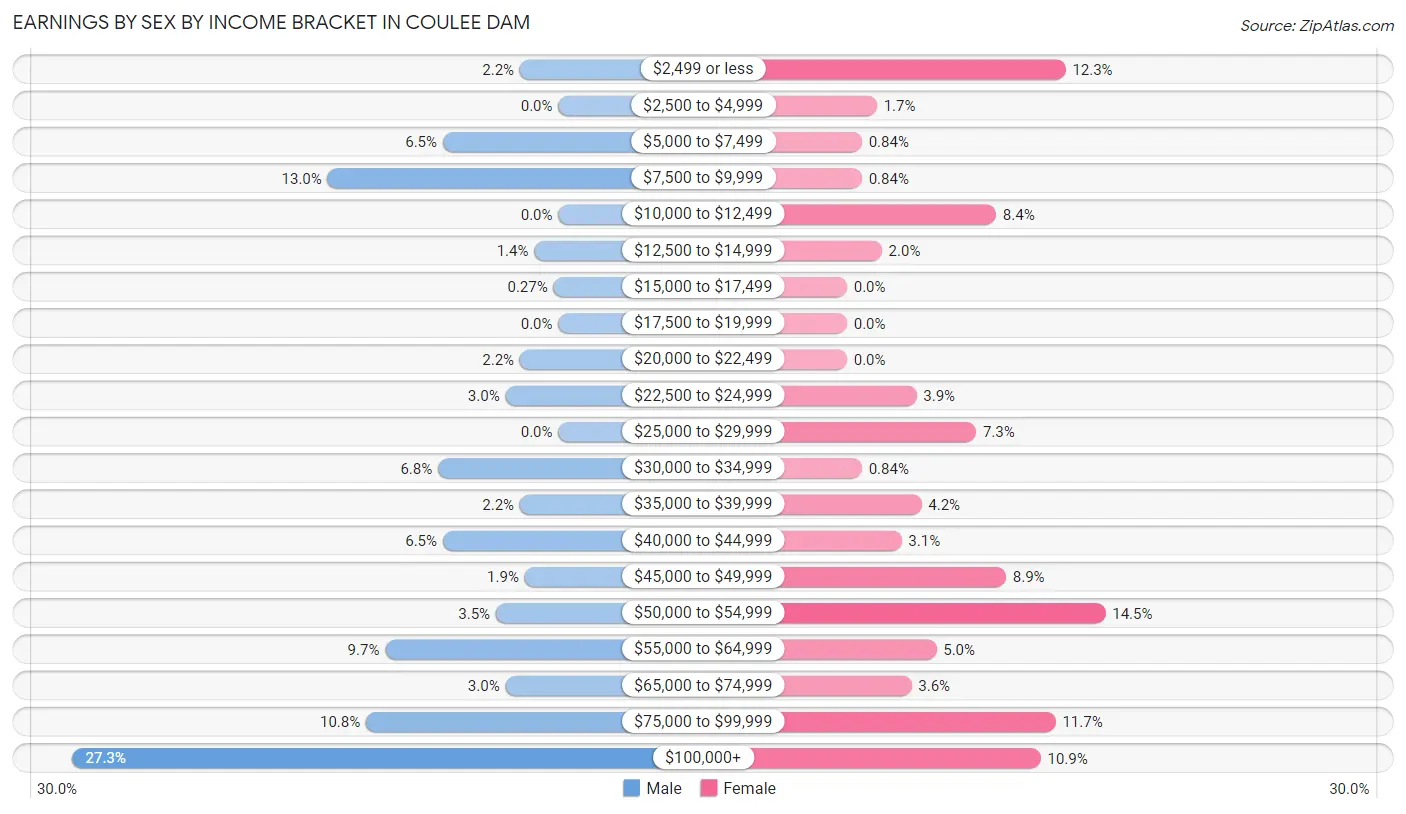
Earnings by Sex by Income Bracket in Coulee Dam
The most common earnings brackets in Coulee Dam are $100,000+ for men (101 | 27.3%) and $50,000 to $54,999 for women (52 | 14.5%).
| Income | Male | Female |
| $2,499 or less | 8 (2.2%) | 44 (12.3%) |
| $2,500 to $4,999 | 0 (0.0%) | 6 (1.7%) |
| $5,000 to $7,499 | 24 (6.5%) | 3 (0.8%) |
| $7,500 to $9,999 | 48 (13.0%) | 3 (0.8%) |
| $10,000 to $12,499 | 0 (0.0%) | 30 (8.4%) |
| $12,500 to $14,999 | 5 (1.3%) | 7 (2.0%) |
| $15,000 to $17,499 | 1 (0.3%) | 0 (0.0%) |
| $17,500 to $19,999 | 0 (0.0%) | 0 (0.0%) |
| $20,000 to $22,499 | 8 (2.2%) | 0 (0.0%) |
| $22,500 to $24,999 | 11 (3.0%) | 14 (3.9%) |
| $25,000 to $29,999 | 0 (0.0%) | 26 (7.3%) |
| $30,000 to $34,999 | 25 (6.8%) | 3 (0.8%) |
| $35,000 to $39,999 | 8 (2.2%) | 15 (4.2%) |
| $40,000 to $44,999 | 24 (6.5%) | 11 (3.1%) |
| $45,000 to $49,999 | 7 (1.9%) | 32 (8.9%) |
| $50,000 to $54,999 | 13 (3.5%) | 52 (14.5%) |
| $55,000 to $64,999 | 36 (9.7%) | 18 (5.0%) |
| $65,000 to $74,999 | 11 (3.0%) | 13 (3.6%) |
| $75,000 to $99,999 | 40 (10.8%) | 42 (11.7%) |
| $100,000+ | 101 (27.3%) | 39 (10.9%) |
| Total | 370 (100.0%) | 358 (100.0%) |
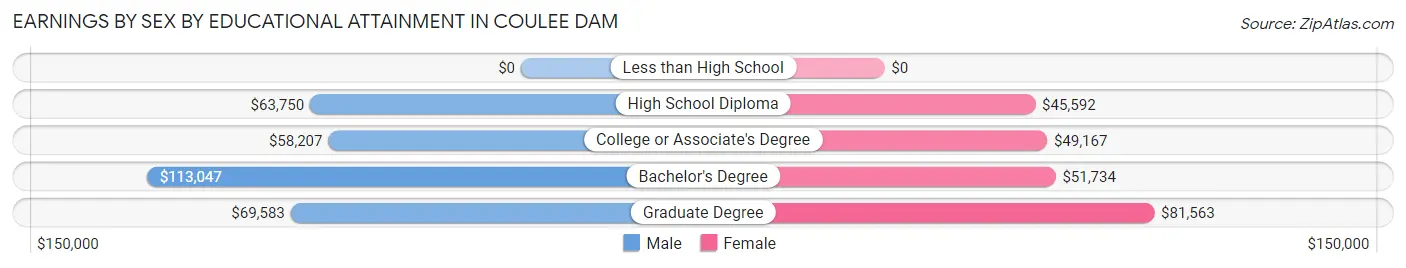
Earnings by Sex by Educational Attainment in Coulee Dam
Average earnings in Coulee Dam are $75,962 for men and $50,878 for women, a difference of 33.0%. Men with an educational attainment of bachelor's degree enjoy the highest average annual earnings of $113,047, while those with college or associate's degree education earn the least with $58,207. Women with an educational attainment of graduate degree earn the most with the average annual earnings of $81,563, while those with high school diploma education have the smallest earnings of $45,592.
| Educational Attainment | Male Income | Female Income |
| Less than High School | - | - |
| High School Diploma | $63,750 | $45,592 |
| College or Associate's Degree | $58,207 | $49,167 |
| Bachelor's Degree | $113,047 | $51,734 |
| Graduate Degree | $69,583 | $81,563 |
| Total | $75,962 | $50,878 |
Family Income in Coulee Dam
Family Income Brackets in Coulee Dam
According to the Coulee Dam family income data, there are 70 families falling into the $50,000 to $74,999 income range, which is the most common income bracket and makes up 22.2% of all families. Conversely, the $25,000 to $34,999 income bracket is the least frequent group with only 7 families (2.2%) belonging to this category.
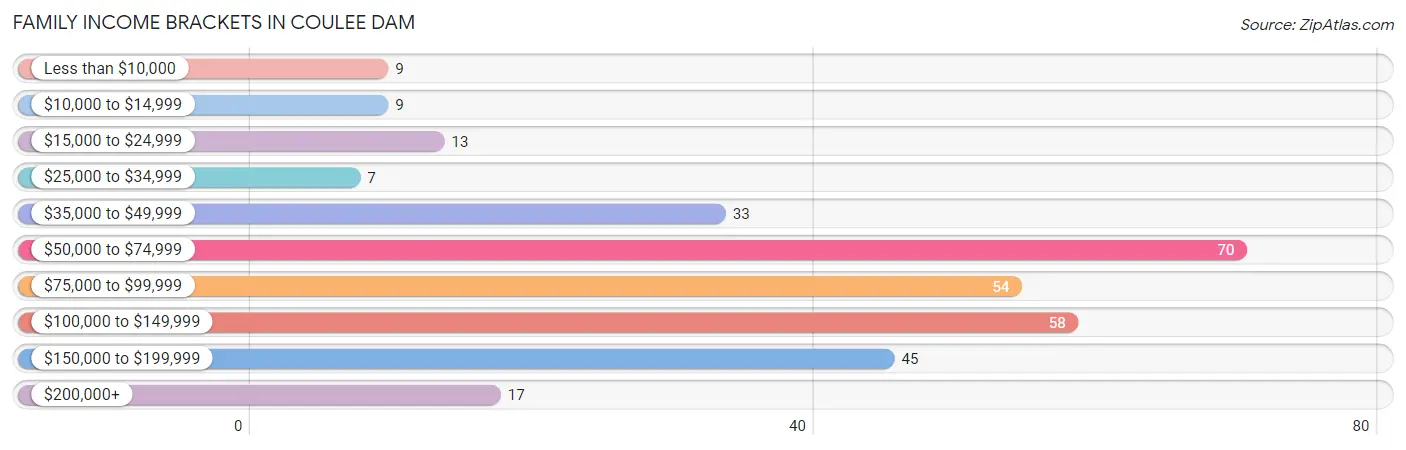
| Income Bracket | # Families | % Families |
| Less than $10,000 | 9 | 2.9% |
| $10,000 to $14,999 | 9 | 2.9% |
| $15,000 to $24,999 | 13 | 4.1% |
| $25,000 to $34,999 | 7 | 2.2% |
| $35,000 to $49,999 | 33 | 10.5% |
| $50,000 to $74,999 | 70 | 22.2% |
| $75,000 to $99,999 | 54 | 17.1% |
| $100,000 to $149,999 | 58 | 18.4% |
| $150,000 to $199,999 | 45 | 14.3% |
| $200,000+ | 17 | 5.4% |
Family Income by Famaliy Size in Coulee Dam
4-person families (49 | 15.6%) account for the highest median family income in Coulee Dam with $167,708 per family, while 4-person families (49 | 15.6%) have the highest median income of $41,927 per family member.
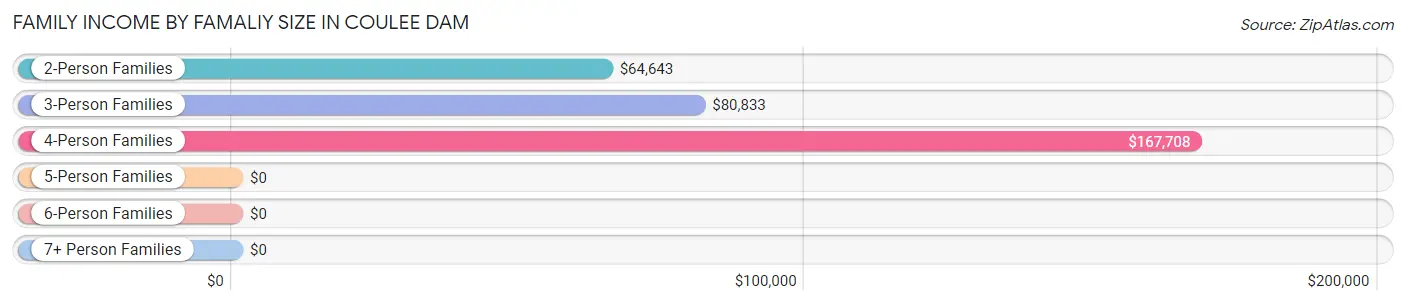
| Income Bracket | # Families | Median Income |
| 2-Person Families | 170 (54.0%) | $64,643 |
| 3-Person Families | 70 (22.2%) | $80,833 |
| 4-Person Families | 49 (15.6%) | $167,708 |
| 5-Person Families | 18 (5.7%) | $0 |
| 6-Person Families | 5 (1.6%) | $0 |
| 7+ Person Families | 3 (0.9%) | $0 |
| Total | 315 (100.0%) | $82,039 |
Family Income by Number of Earners in Coulee Dam
The median family income in Coulee Dam is $82,039, with families comprising 3+ earners (46) having the highest median family income of $168,750, while families with no earners (81) have the lowest median family income of $52,250, accounting for 14.6% and 25.7% of families, respectively.
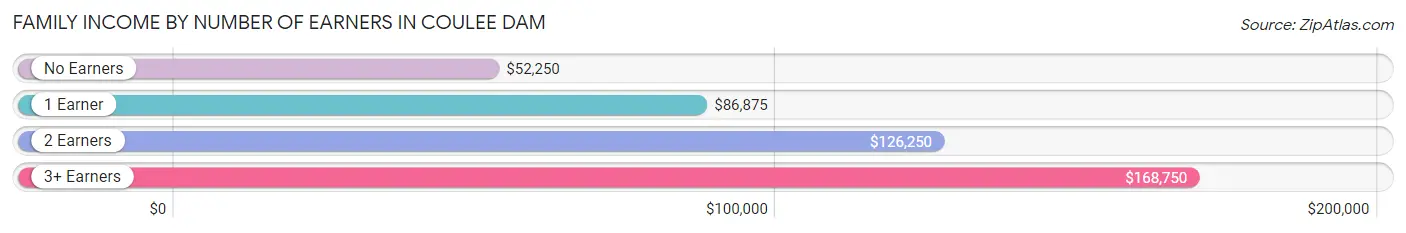
| Number of Earners | # Families | Median Income |
| No Earners | 81 (25.7%) | $52,250 |
| 1 Earner | 115 (36.5%) | $86,875 |
| 2 Earners | 73 (23.2%) | $126,250 |
| 3+ Earners | 46 (14.6%) | $168,750 |
| Total | 315 (100.0%) | $82,039 |
Household Income in Coulee Dam
Household Income Brackets in Coulee Dam
With 155 households falling in the category, the $50,000 to $74,999 income range is the most frequent in Coulee Dam, accounting for 26.6% of all households. In contrast, only 10 households (1.7%) fall into the less than $10,000 income bracket, making it the least populous group.
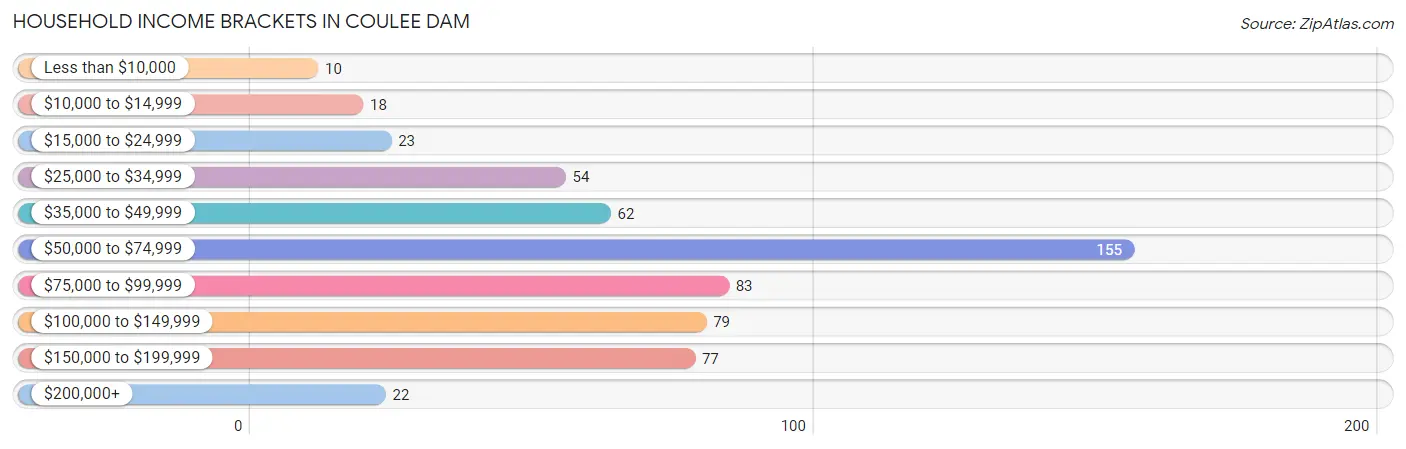
| Income Bracket | # Households | % Households |
| Less than $10,000 | 10 | 1.7% |
| $10,000 to $14,999 | 18 | 3.1% |
| $15,000 to $24,999 | 23 | 3.9% |
| $25,000 to $34,999 | 54 | 9.3% |
| $35,000 to $49,999 | 62 | 10.6% |
| $50,000 to $74,999 | 155 | 26.6% |
| $75,000 to $99,999 | 83 | 14.2% |
| $100,000 to $149,999 | 79 | 13.6% |
| $150,000 to $199,999 | 77 | 13.2% |
| $200,000+ | 22 | 3.8% |
Household Income by Householder Age in Coulee Dam
The median household income in Coulee Dam is $65,313, with the highest median household income of $93,750 found in the 45 to 64 years age bracket for the primary householder. A total of 205 households (35.2%) fall into this category. Meanwhile, the 15 to 24 years age bracket for the primary householder has the lowest median household income of $46,250, with 36 households (6.2%) in this group.
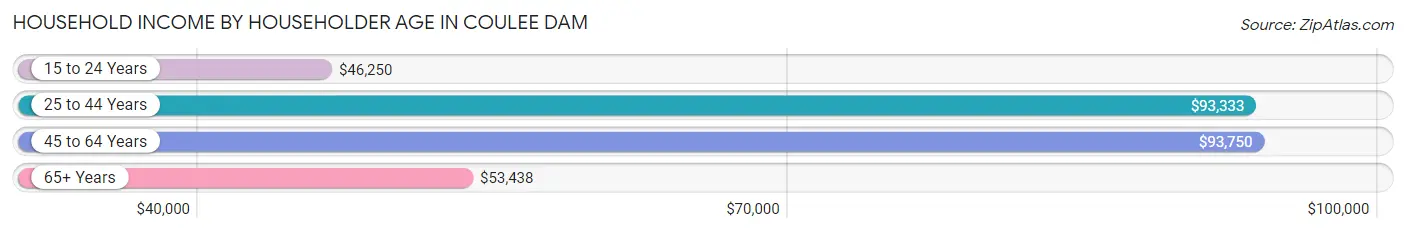
| Income Bracket | # Households | Median Income |
| 15 to 24 Years | 36 (6.2%) | $46,250 |
| 25 to 44 Years | 144 (24.7%) | $93,333 |
| 45 to 64 Years | 205 (35.2%) | $93,750 |
| 65+ Years | 198 (34.0%) | $53,438 |
| Total | 583 (100.0%) | $65,313 |
Poverty in Coulee Dam
Income Below Poverty by Sex and Age in Coulee Dam
With 12.3% poverty level for males and 12.2% for females among the residents of Coulee Dam, 18 to 24 year old males and 18 to 24 year old females are the most vulnerable to poverty, with 56 males (52.3%) and 34 females (47.2%) in their respective age groups living below the poverty level.
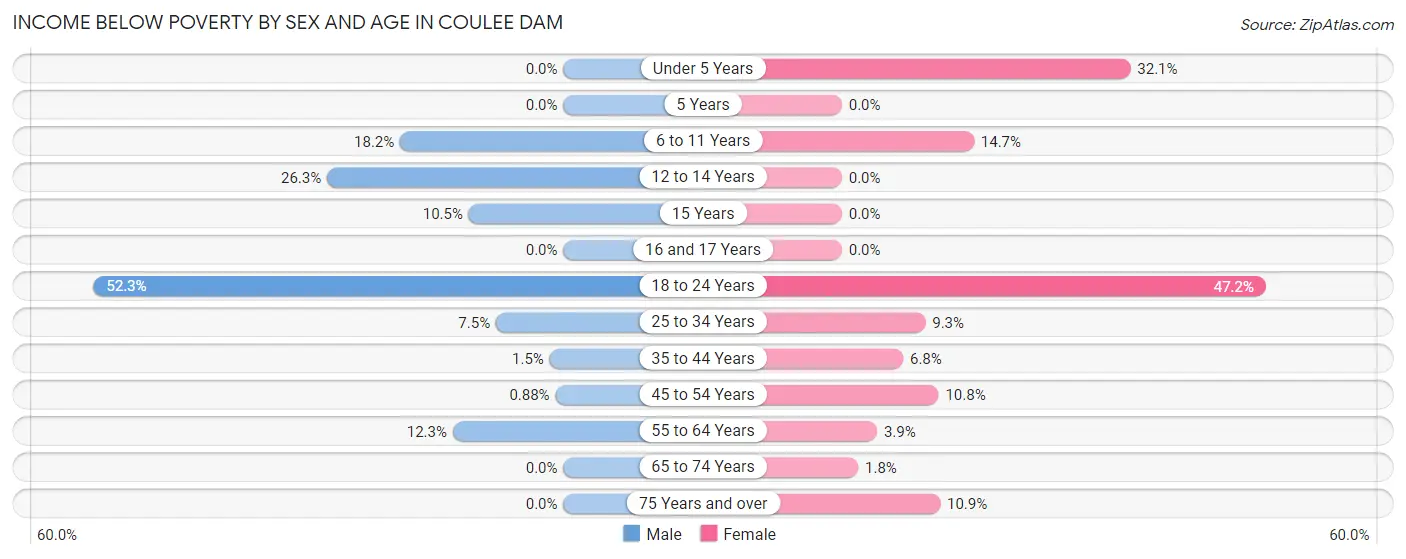
| Age Bracket | Male | Female |
| Under 5 Years | 0 (0.0%) | 9 (32.1%) |
| 5 Years | 0 (0.0%) | 0 (0.0%) |
| 6 to 11 Years | 8 (18.2%) | 5 (14.7%) |
| 12 to 14 Years | 5 (26.3%) | 0 (0.0%) |
| 15 Years | 2 (10.5%) | 0 (0.0%) |
| 16 and 17 Years | 0 (0.0%) | 0 (0.0%) |
| 18 to 24 Years | 56 (52.3%) | 34 (47.2%) |
| 25 to 34 Years | 3 (7.5%) | 8 (9.3%) |
| 35 to 44 Years | 1 (1.5%) | 6 (6.8%) |
| 45 to 54 Years | 1 (0.9%) | 7 (10.8%) |
| 55 to 64 Years | 8 (12.3%) | 2 (3.9%) |
| 65 to 74 Years | 0 (0.0%) | 2 (1.8%) |
| 75 Years and over | 0 (0.0%) | 7 (10.9%) |
| Total | 84 (12.3%) | 80 (12.2%) |
Income Above Poverty by Sex and Age in Coulee Dam
According to the poverty statistics in Coulee Dam, males aged under 5 years and females aged 5 years are the age groups that are most secure financially, with 100.0% of males and 100.0% of females in these age groups living above the poverty line.
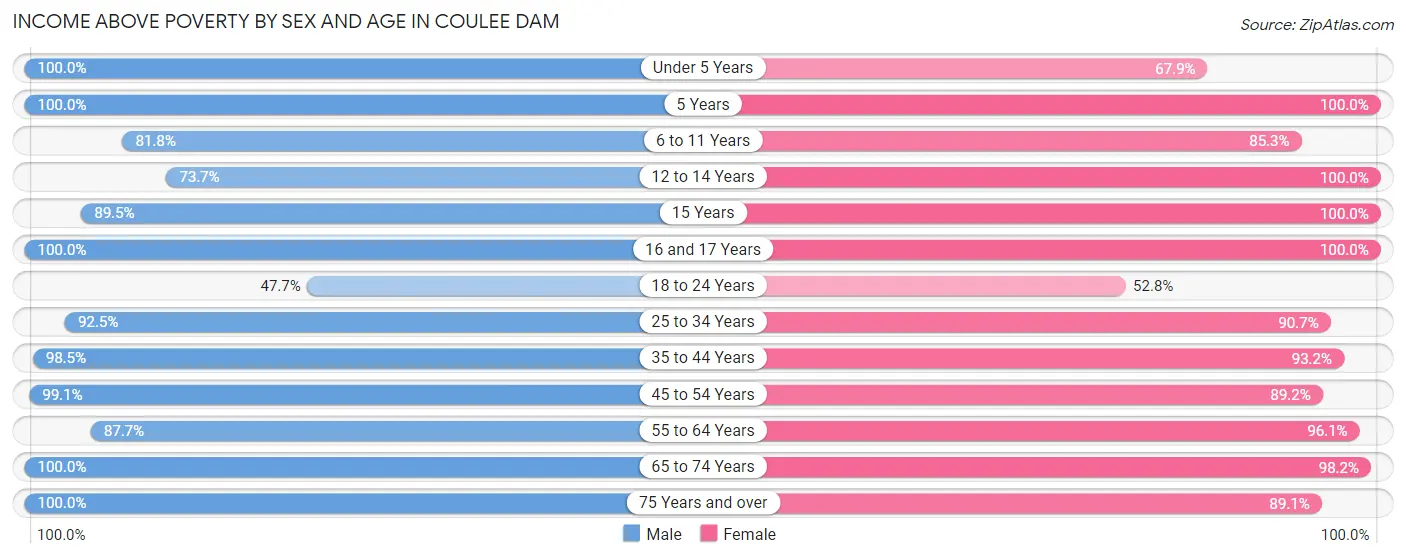
| Age Bracket | Male | Female |
| Under 5 Years | 47 (100.0%) | 19 (67.9%) |
| 5 Years | 2 (100.0%) | 6 (100.0%) |
| 6 to 11 Years | 36 (81.8%) | 29 (85.3%) |
| 12 to 14 Years | 14 (73.7%) | 26 (100.0%) |
| 15 Years | 17 (89.5%) | 1 (100.0%) |
| 16 and 17 Years | 9 (100.0%) | 22 (100.0%) |
| 18 to 24 Years | 51 (47.7%) | 38 (52.8%) |
| 25 to 34 Years | 37 (92.5%) | 78 (90.7%) |
| 35 to 44 Years | 65 (98.5%) | 82 (93.2%) |
| 45 to 54 Years | 112 (99.1%) | 58 (89.2%) |
| 55 to 64 Years | 57 (87.7%) | 49 (96.1%) |
| 65 to 74 Years | 60 (100.0%) | 108 (98.2%) |
| 75 Years and over | 90 (100.0%) | 57 (89.1%) |
| Total | 597 (87.7%) | 573 (87.7%) |
Income Below Poverty Among Married-Couple Families in Coulee Dam
The poverty statistics for married-couple families in Coulee Dam show that 0.5% or 1 of the total 202 families live below the poverty line. Families with 1 or 2 children have the highest poverty rate of 1.8%, comprising of 1 families. On the other hand, families with no children have the lowest poverty rate of 0.0%, which includes 0 families.
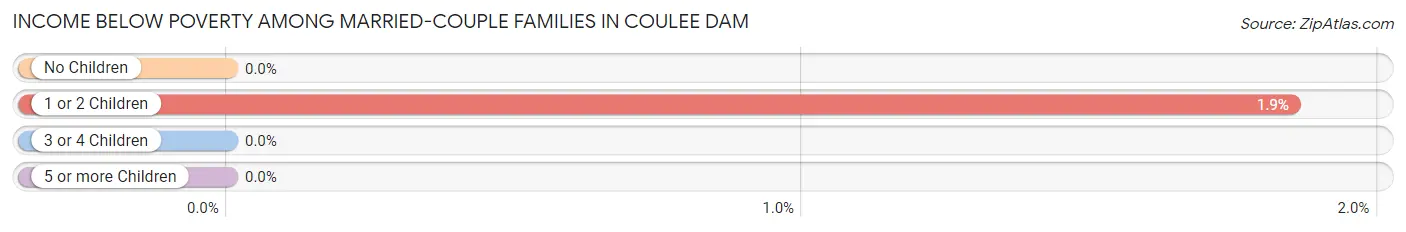
| Children | Above Poverty | Below Poverty |
| No Children | 136 (100.0%) | 0 (0.0%) |
| 1 or 2 Children | 53 (98.2%) | 1 (1.8%) |
| 3 or 4 Children | 12 (100.0%) | 0 (0.0%) |
| 5 or more Children | 0 (0.0%) | 0 (0.0%) |
| Total | 201 (99.5%) | 1 (0.5%) |
Income Below Poverty Among Single-Parent Households in Coulee Dam
According to the poverty data in Coulee Dam, 6.5% or 3 single-father households and 34.3% or 23 single-mother households are living below the poverty line. Among single-father households, those with 3 or 4 children have the highest poverty rate, with 3 households (100.0%) experiencing poverty. Likewise, among single-mother households, those with 3 or 4 children have the highest poverty rate, with 10 households (71.4%) falling below the poverty line.
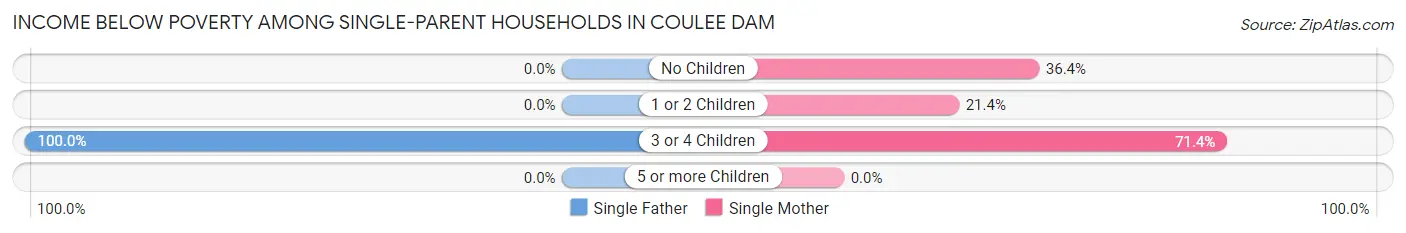
| Children | Single Father | Single Mother |
| No Children | 0 (0.0%) | 4 (36.4%) |
| 1 or 2 Children | 0 (0.0%) | 9 (21.4%) |
| 3 or 4 Children | 3 (100.0%) | 10 (71.4%) |
| 5 or more Children | 0 (0.0%) | 0 (0.0%) |
| Total | 3 (6.5%) | 23 (34.3%) |
Income Below Poverty Among Married-Couple vs Single-Parent Households in Coulee Dam
The poverty data for Coulee Dam shows that 1 of the married-couple family households (0.5%) and 26 of the single-parent households (23.0%) are living below the poverty level. Within the married-couple family households, those with 1 or 2 children have the highest poverty rate, with 1 households (1.8%) falling below the poverty line. Among the single-parent households, those with 3 or 4 children have the highest poverty rate, with 13 household (76.5%) living below poverty.
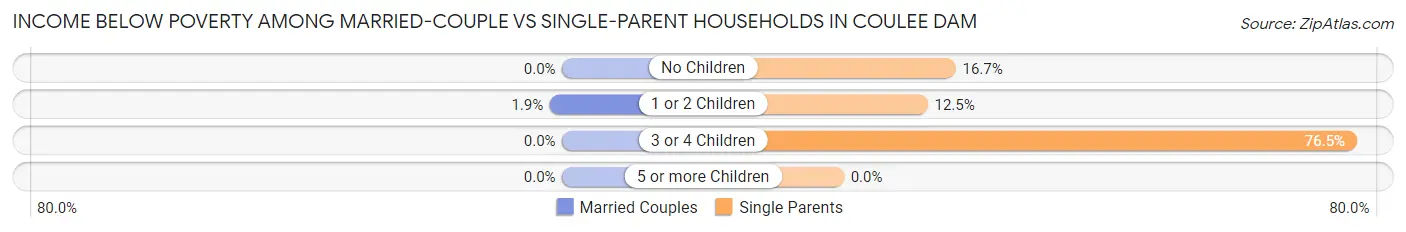
| Children | Married-Couple Families | Single-Parent Households |
| No Children | 0 (0.0%) | 4 (16.7%) |
| 1 or 2 Children | 1 (1.8%) | 9 (12.5%) |
| 3 or 4 Children | 0 (0.0%) | 13 (76.5%) |
| 5 or more Children | 0 (0.0%) | 0 (0.0%) |
| Total | 1 (0.5%) | 26 (23.0%) |
Race in Coulee Dam
The most populous races in Coulee Dam are White / Caucasian (728 | 54.6%), Native / Alaskan (498 | 37.3%), and Two or more Races (82 | 6.1%).
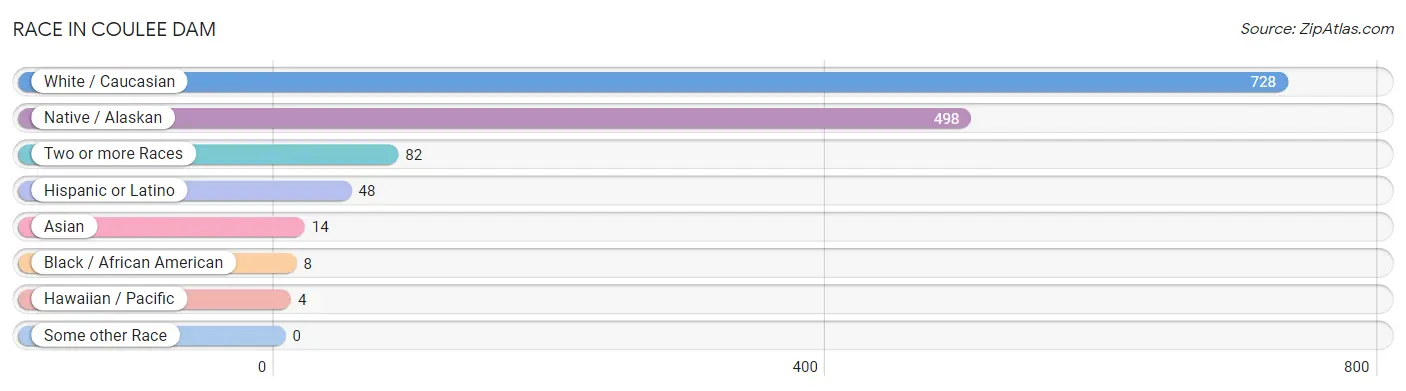
| Race | # Population | % Population |
| Asian | 14 | 1.1% |
| Black / African American | 8 | 0.6% |
| Hawaiian / Pacific | 4 | 0.3% |
| Hispanic or Latino | 48 | 3.6% |
| Native / Alaskan | 498 | 37.3% |
| White / Caucasian | 728 | 54.6% |
| Two or more Races | 82 | 6.1% |
| Some other Race | 0 | 0.0% |
| Total | 1,334 | 100.0% |
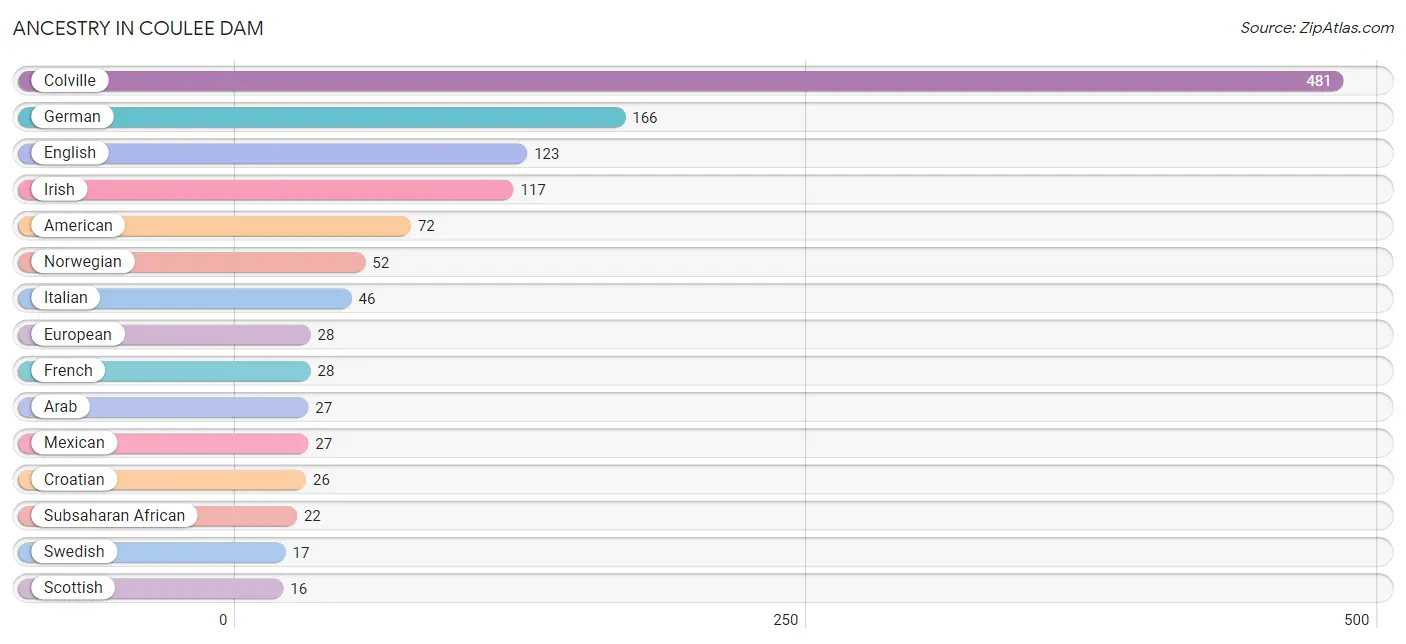
Ancestry in Coulee Dam
The most populous ancestries reported in Coulee Dam are Colville (481 | 36.1%), German (166 | 12.4%), English (123 | 9.2%), Irish (117 | 8.8%), and American (72 | 5.4%), together accounting for 71.9% of all Coulee Dam residents.
| Ancestry | # Population | % Population |
| Aleut | 2 | 0.2% |
| American | 72 | 5.4% |
| Apache | 4 | 0.3% |
| Arab | 27 | 2.0% |
| British | 8 | 0.6% |
| Canadian | 4 | 0.3% |
| Central American | 10 | 0.7% |
| Cheyenne | 3 | 0.2% |
| Chippewa | 5 | 0.4% |
| Choctaw | 1 | 0.1% |
| Colville | 481 | 36.1% |
| Croatian | 26 | 1.9% |
| Czech | 8 | 0.6% |
| Danish | 4 | 0.3% |
| Dutch | 6 | 0.4% |
| English | 123 | 9.2% |
| European | 28 | 2.1% |
| Finnish | 3 | 0.2% |
| French | 28 | 2.1% |
| German | 166 | 12.4% |
| Guamanian / Chamorro | 4 | 0.3% |
| Guatemalan | 10 | 0.7% |
| Indian (Asian) | 4 | 0.3% |
| Irish | 117 | 8.8% |
| Italian | 46 | 3.5% |
| Korean | 11 | 0.8% |
| Mexican | 27 | 2.0% |
| Navajo | 4 | 0.3% |
| Northern European | 14 | 1.1% |
| Norwegian | 52 | 3.9% |
| Polish | 5 | 0.4% |
| Portuguese | 10 | 0.7% |
| Puerto Rican | 11 | 0.8% |
| Russian | 4 | 0.3% |
| Scandinavian | 7 | 0.5% |
| Scotch-Irish | 12 | 0.9% |
| Scottish | 16 | 1.2% |
| Sioux | 15 | 1.1% |
| Subsaharan African | 22 | 1.7% |
| Swedish | 17 | 1.3% |
| Swiss | 4 | 0.3% |
| Welsh | 4 | 0.3% |
| Yakama | 13 | 1.0% | View All 43 Rows |
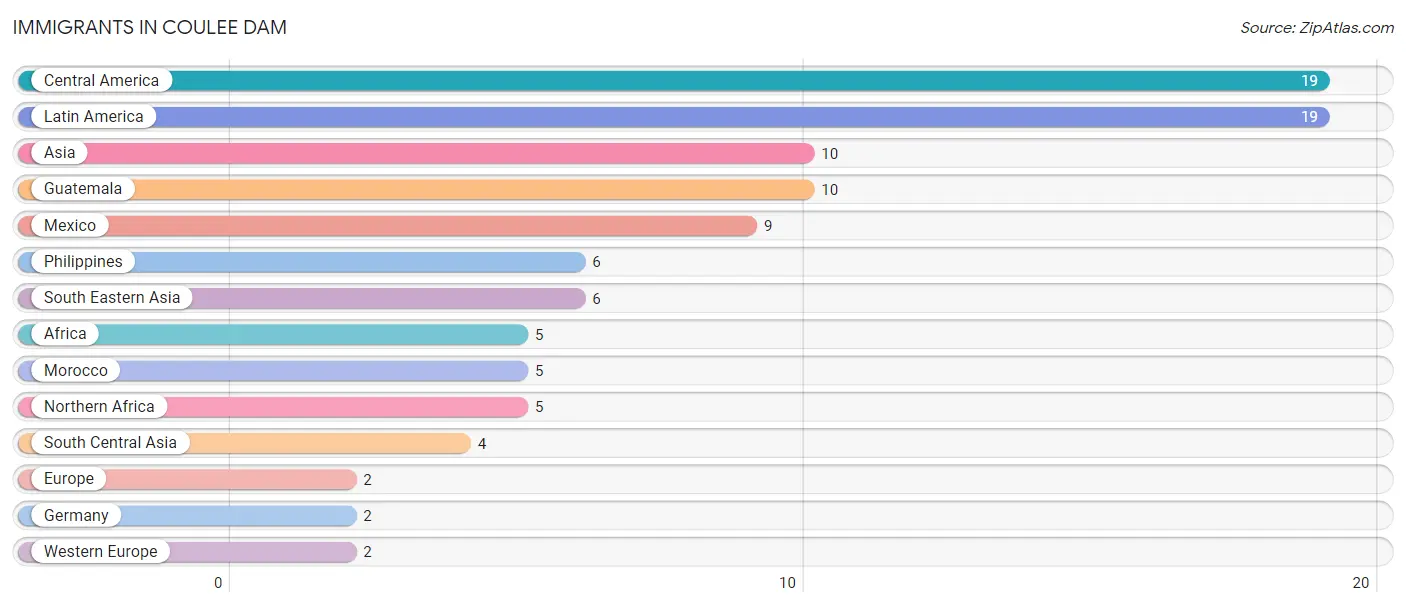
Immigrants in Coulee Dam
The most numerous immigrant groups reported in Coulee Dam came from Central America (19 | 1.4%), Latin America (19 | 1.4%), Asia (10 | 0.7%), Guatemala (10 | 0.7%), and Mexico (9 | 0.7%), together accounting for 5.0% of all Coulee Dam residents.
| Immigration Origin | # Population | % Population |
| Africa | 5 | 0.4% |
| Asia | 10 | 0.7% |
| Central America | 19 | 1.4% |
| Europe | 2 | 0.2% |
| Germany | 2 | 0.2% |
| Guatemala | 10 | 0.7% |
| Latin America | 19 | 1.4% |
| Mexico | 9 | 0.7% |
| Morocco | 5 | 0.4% |
| Northern Africa | 5 | 0.4% |
| Philippines | 6 | 0.4% |
| South Central Asia | 4 | 0.3% |
| South Eastern Asia | 6 | 0.4% |
| Western Europe | 2 | 0.2% | View All 14 Rows |
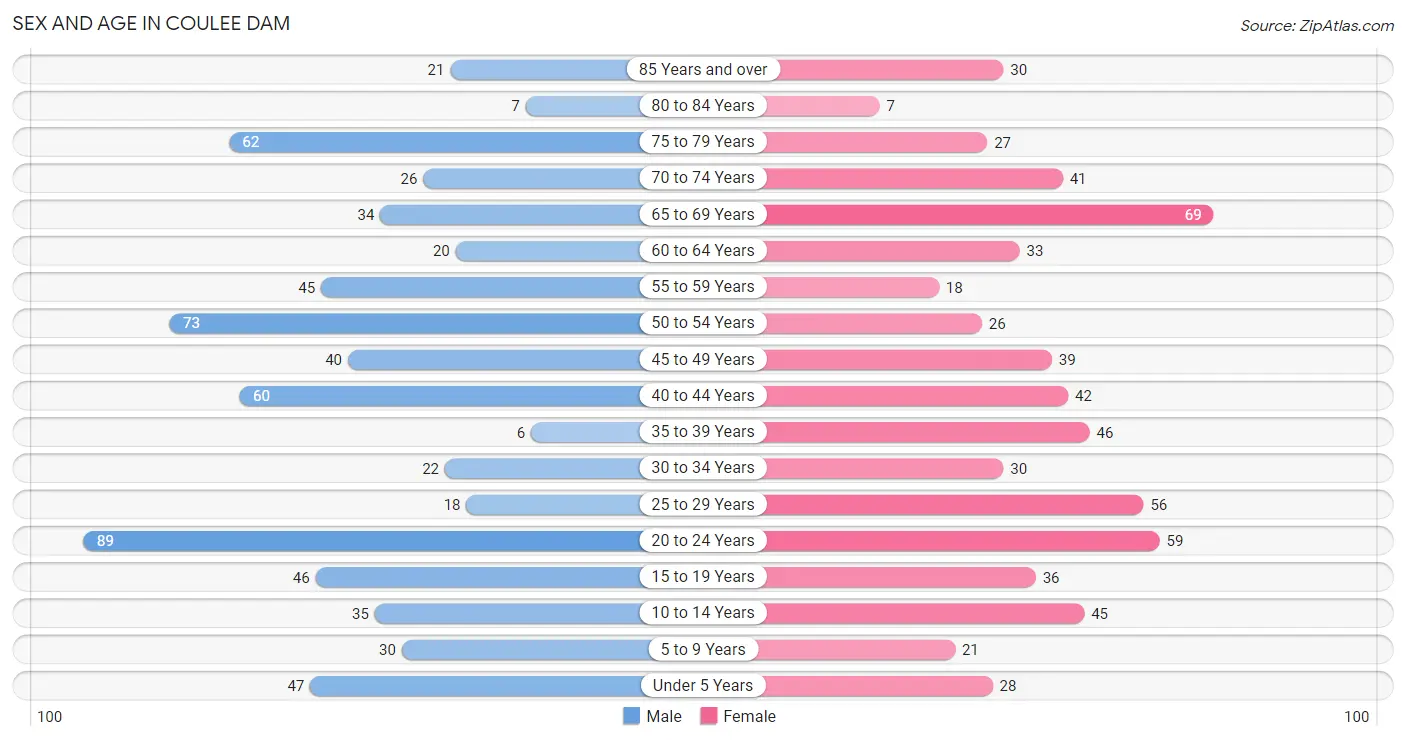
Sex and Age in Coulee Dam
Sex and Age in Coulee Dam
The most populous age groups in Coulee Dam are 20 to 24 Years (89 | 13.1%) for men and 65 to 69 Years (69 | 10.6%) for women.
| Age Bracket | Male | Female |
| Under 5 Years | 47 (6.9%) | 28 (4.3%) |
| 5 to 9 Years | 30 (4.4%) | 21 (3.2%) |
| 10 to 14 Years | 35 (5.1%) | 45 (6.9%) |
| 15 to 19 Years | 46 (6.8%) | 36 (5.5%) |
| 20 to 24 Years | 89 (13.1%) | 59 (9.0%) |
| 25 to 29 Years | 18 (2.6%) | 56 (8.6%) |
| 30 to 34 Years | 22 (3.2%) | 30 (4.6%) |
| 35 to 39 Years | 6 (0.9%) | 46 (7.0%) |
| 40 to 44 Years | 60 (8.8%) | 42 (6.4%) |
| 45 to 49 Years | 40 (5.9%) | 39 (6.0%) |
| 50 to 54 Years | 73 (10.7%) | 26 (4.0%) |
| 55 to 59 Years | 45 (6.6%) | 18 (2.8%) |
| 60 to 64 Years | 20 (2.9%) | 33 (5.1%) |
| 65 to 69 Years | 34 (5.0%) | 69 (10.6%) |
| 70 to 74 Years | 26 (3.8%) | 41 (6.3%) |
| 75 to 79 Years | 62 (9.1%) | 27 (4.1%) |
| 80 to 84 Years | 7 (1.0%) | 7 (1.1%) |
| 85 Years and over | 21 (3.1%) | 30 (4.6%) |
| Total | 681 (100.0%) | 653 (100.0%) |
Families and Households in Coulee Dam
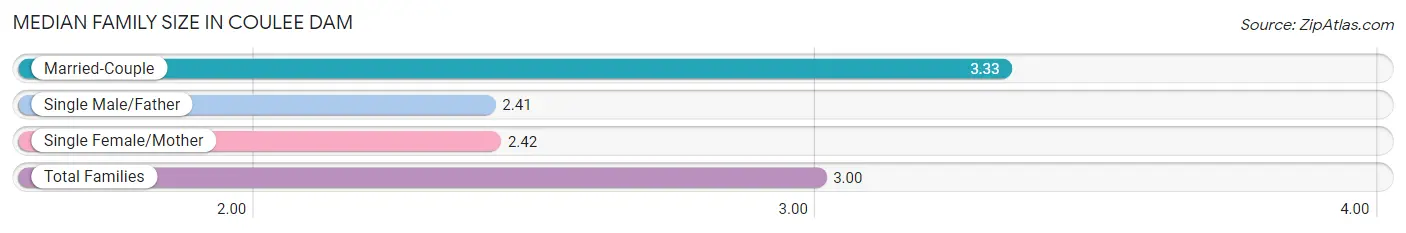
Median Family Size in Coulee Dam
The median family size in Coulee Dam is 3.00 persons per family, with married-couple families (202 | 64.1%) accounting for the largest median family size of 3.33 persons per family. On the other hand, single male/father families (46 | 14.6%) represent the smallest median family size with 2.41 persons per family.
| Family Type | # Families | Family Size |
| Married-Couple | 202 (64.1%) | 3.33 |
| Single Male/Father | 46 (14.6%) | 2.41 |
| Single Female/Mother | 67 (21.3%) | 2.42 |
| Total Families | 315 (100.0%) | 3.00 |
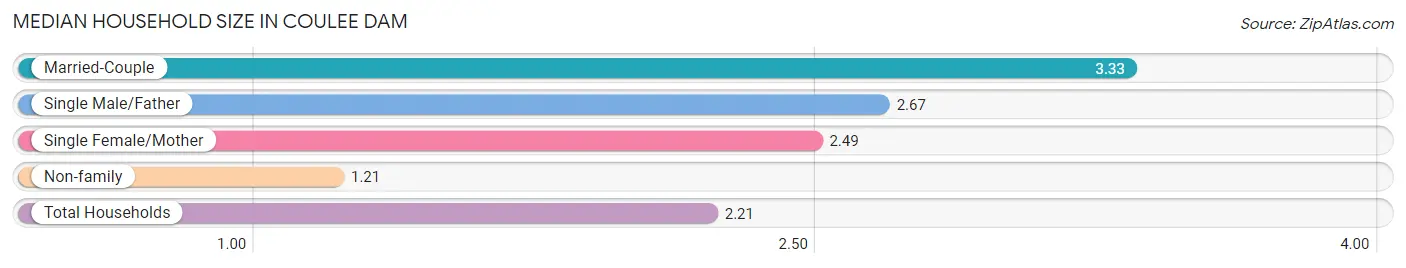
Median Household Size in Coulee Dam
The median household size in Coulee Dam is 2.21 persons per household, with married-couple households (202 | 34.6%) accounting for the largest median household size of 3.33 persons per household. non-family households (268 | 46.0%) represent the smallest median household size with 1.21 persons per household.
| Household Type | # Households | Household Size |
| Married-Couple | 202 (34.6%) | 3.33 |
| Single Male/Father | 46 (7.9%) | 2.67 |
| Single Female/Mother | 67 (11.5%) | 2.49 |
| Non-family | 268 (46.0%) | 1.21 |
| Total Households | 583 (100.0%) | 2.21 |
Household Size by Marriage Status in Coulee Dam
Out of a total of 583 households in Coulee Dam, 315 (54.0%) are family households, while 268 (46.0%) are nonfamily households. The most numerous type of family households are 2-person households, comprising 167, and the most common type of nonfamily households are 1-person households, comprising 227.
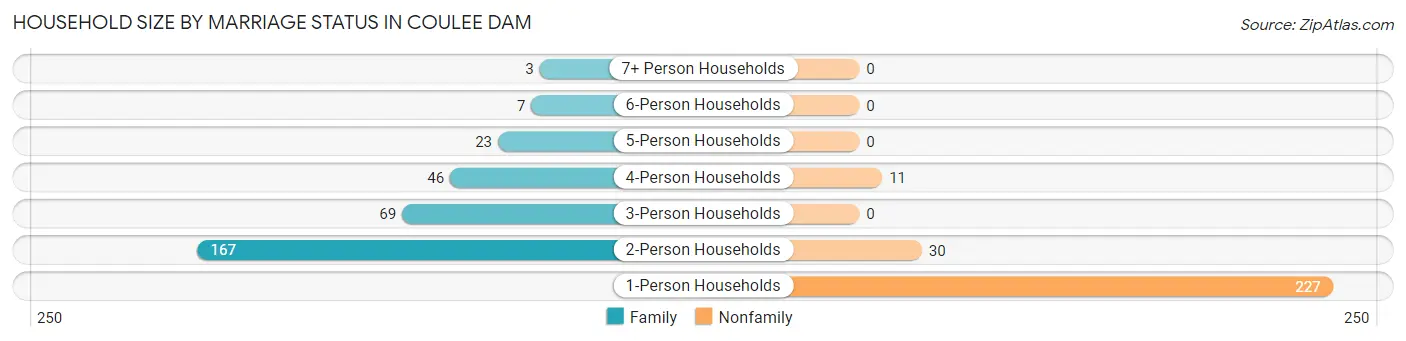
| Household Size | Family Households | Nonfamily Households |
| 1-Person Households | - | 227 (38.9%) |
| 2-Person Households | 167 (28.6%) | 30 (5.1%) |
| 3-Person Households | 69 (11.8%) | 0 (0.0%) |
| 4-Person Households | 46 (7.9%) | 11 (1.9%) |
| 5-Person Households | 23 (4.0%) | 0 (0.0%) |
| 6-Person Households | 7 (1.2%) | 0 (0.0%) |
| 7+ Person Households | 3 (0.5%) | 0 (0.0%) |
| Total | 315 (54.0%) | 268 (46.0%) |
Female Fertility in Coulee Dam
Fertility by Age in Coulee Dam
Average fertility rate in Coulee Dam is 45.0 births per 1,000 women. Women in the age bracket of 35 to 50 years have the highest fertility rate with 69.0 births per 1,000 women. Women in the age bracket of 35 to 50 years acount for 64.3% of all women with births.
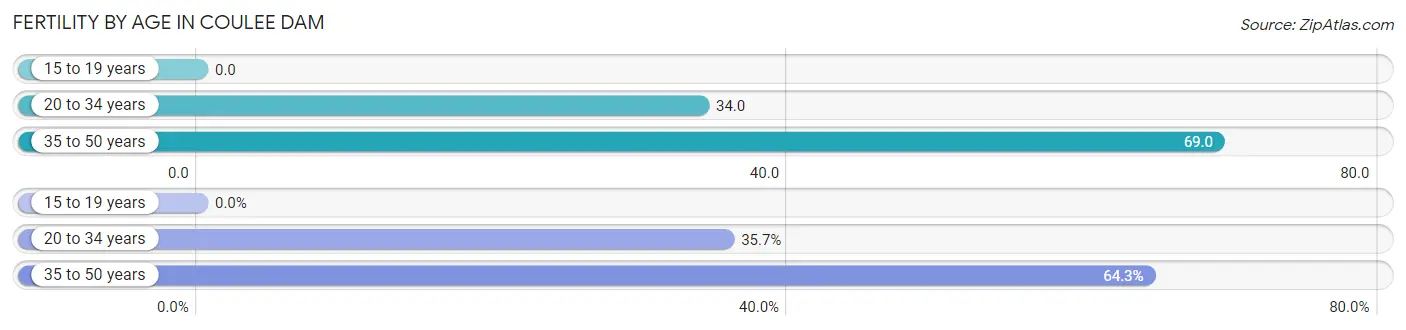
| Age Bracket | Women with Births | Births / 1,000 Women |
| 15 to 19 years | 0 (0.0%) | 0.0 |
| 20 to 34 years | 5 (35.7%) | 34.0 |
| 35 to 50 years | 9 (64.3%) | 69.0 |
| Total | 14 (100.0%) | 45.0 |
Fertility by Age by Marriage Status in Coulee Dam
64.3% of women with births (14) in Coulee Dam are married. The highest percentage of unmarried women with births falls into 35 to 50 years age bracket with 55.6% of them unmarried at the time of birth, while the lowest percentage of unmarried women with births belong to 20 to 34 years age bracket with 0.0% of them unmarried.
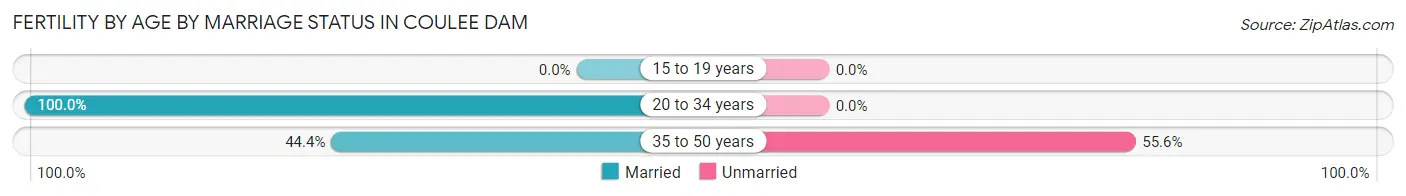
| Age Bracket | Married | Unmarried |
| 15 to 19 years | 0 (0.0%) | 0 (0.0%) |
| 20 to 34 years | 5 (100.0%) | 0 (0.0%) |
| 35 to 50 years | 4 (44.4%) | 5 (55.6%) |
| Total | 9 (64.3%) | 5 (35.7%) |
Fertility by Education in Coulee Dam
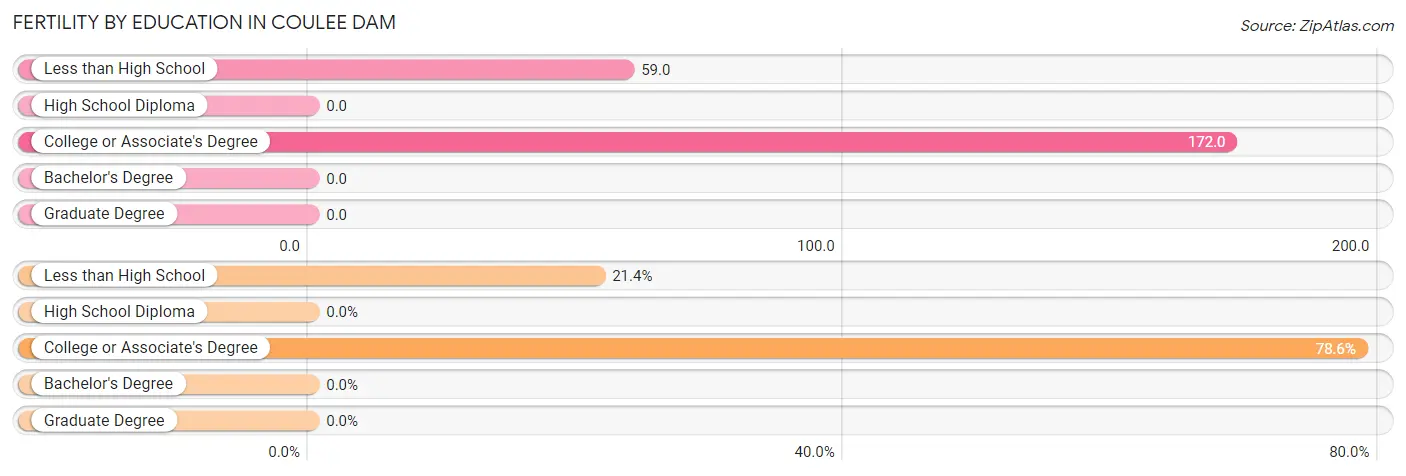
| Educational Attainment | Women with Births | Births / 1,000 Women |
| Less than High School | 3 (21.4%) | 59.0 |
| High School Diploma | 0 (0.0%) | 0.0 |
| College or Associate's Degree | 11 (78.6%) | 172.0 |
| Bachelor's Degree | 0 (0.0%) | 0.0 |
| Graduate Degree | 0 (0.0%) | 0.0 |
| Total | 14 (100.0%) | 45.0 |
Fertility by Education by Marriage Status in Coulee Dam
35.7% of women with births in Coulee Dam are unmarried. Women with the educational attainment of college or associate's degree are most likely to be married with 81.8% of them married at childbirth, while women with the educational attainment of less than high school are least likely to be married with 100.0% of them unmarried at childbirth.
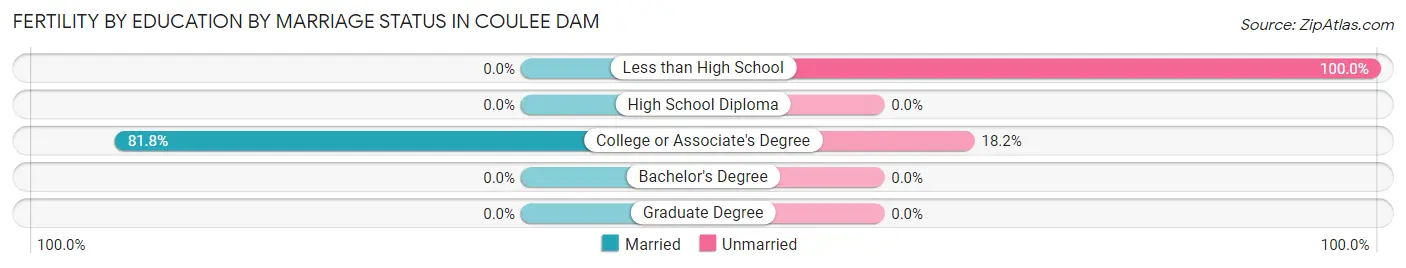
| Educational Attainment | Married | Unmarried |
| Less than High School | 0 (0.0%) | 3 (100.0%) |
| High School Diploma | 0 (0.0%) | 0 (0.0%) |
| College or Associate's Degree | 9 (81.8%) | 2 (18.2%) |
| Bachelor's Degree | 0 (0.0%) | 0 (0.0%) |
| Graduate Degree | 0 (0.0%) | 0 (0.0%) |
| Total | 9 (64.3%) | 5 (35.7%) |
Employment Characteristics in Coulee Dam
Employment by Class of Employer in Coulee Dam
Among the 594 employed individuals in Coulee Dam, federal government employees (177 | 29.8%), private company employees (173 | 29.1%), and local government employees (133 | 22.4%) make up the most common classes of employment.
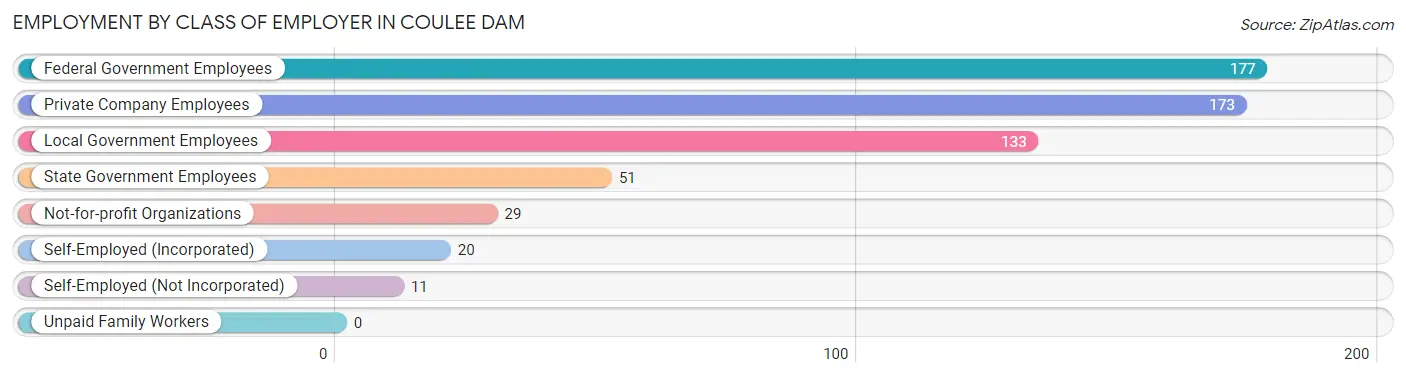
| Employer Class | # Employees | % Employees |
| Private Company Employees | 173 | 29.1% |
| Self-Employed (Incorporated) | 20 | 3.4% |
| Self-Employed (Not Incorporated) | 11 | 1.8% |
| Not-for-profit Organizations | 29 | 4.9% |
| Local Government Employees | 133 | 22.4% |
| State Government Employees | 51 | 8.6% |
| Federal Government Employees | 177 | 29.8% |
| Unpaid Family Workers | 0 | 0.0% |
| Total | 594 | 100.0% |
Employment Status by Age in Coulee Dam
According to the labor force statistics for Coulee Dam, out of the total population over 16 years of age (1,108), 57.0% or 632 individuals are in the labor force, with 6.0% or 38 of them unemployed. The age group with the highest labor force participation rate is 30 to 34 years, with 94.2% or 49 individuals in the labor force. Within the labor force, the 16 to 19 years age range has the highest percentage of unemployed individuals, with 22.9% or 8 of them being unemployed.
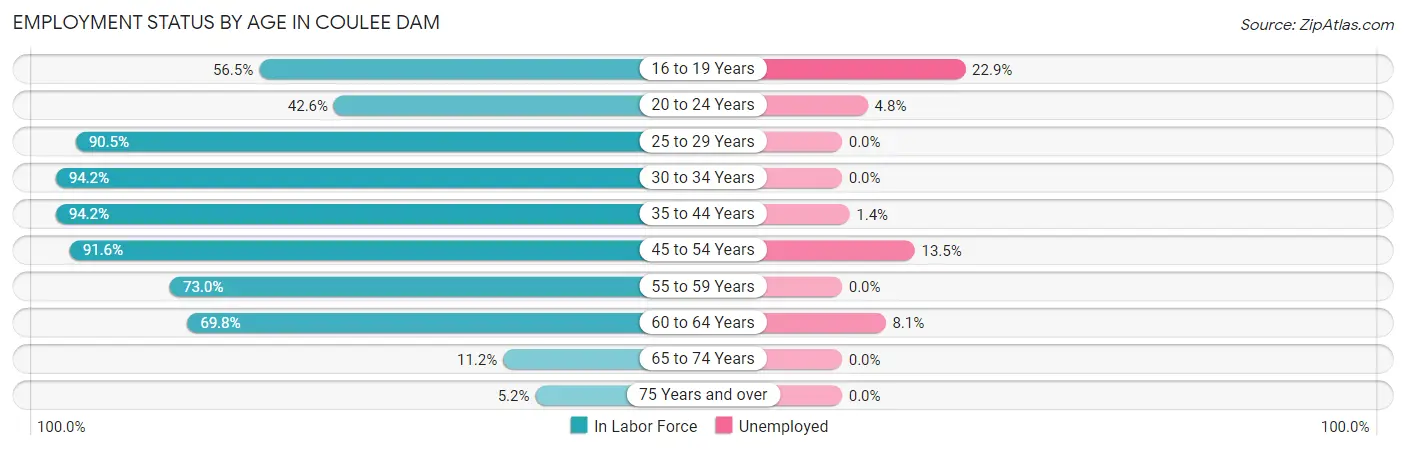
| Age Bracket | In Labor Force | Unemployed |
| 16 to 19 Years | 35 (56.5%) | 8 (22.9%) |
| 20 to 24 Years | 63 (42.6%) | 3 (4.8%) |
| 25 to 29 Years | 67 (90.5%) | 0 (0.0%) |
| 30 to 34 Years | 49 (94.2%) | 0 (0.0%) |
| 35 to 44 Years | 145 (94.2%) | 2 (1.4%) |
| 45 to 54 Years | 163 (91.6%) | 22 (13.5%) |
| 55 to 59 Years | 46 (73.0%) | 0 (0.0%) |
| 60 to 64 Years | 37 (69.8%) | 3 (8.1%) |
| 65 to 74 Years | 19 (11.2%) | 0 (0.0%) |
| 75 Years and over | 8 (5.2%) | 0 (0.0%) |
| Total | 632 (57.0%) | 38 (6.0%) |
Employment Status by Educational Attainment in Coulee Dam
According to labor force statistics for Coulee Dam, 88.3% of individuals (507) out of the total population between 25 and 64 years of age (574) are in the labor force, with 5.3% or 27 of them being unemployed. The group with the highest labor force participation rate are those with the educational attainment of bachelor's degree or higher, with 99.1% or 227 individuals in the labor force. Within the labor force, individuals with college / associate degree education have the highest percentage of unemployment, with 17.9% or 27 of them being unemployed.
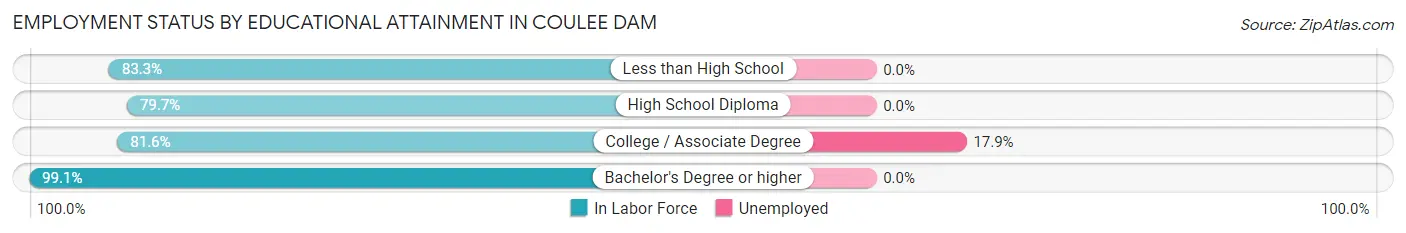
| Educational Attainment | In Labor Force | Unemployed |
| Less than High School | 35 (83.3%) | 0 (0.0%) |
| High School Diploma | 94 (79.7%) | 0 (0.0%) |
| College / Associate Degree | 151 (81.6%) | 33 (17.9%) |
| Bachelor's Degree or higher | 227 (99.1%) | 0 (0.0%) |
| Total | 507 (88.3%) | 30 (5.3%) |
Employment Occupations by Sex in Coulee Dam
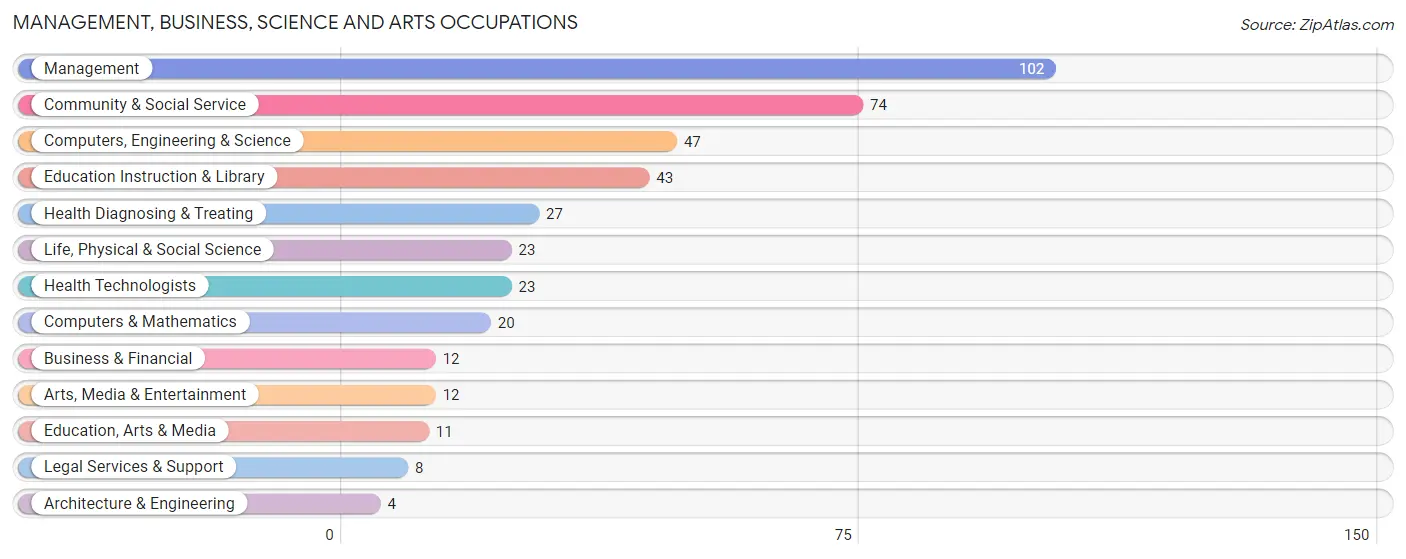
Management, Business, Science and Arts Occupations
The most common Management, Business, Science and Arts occupations in Coulee Dam are Management (102 | 17.2%), Community & Social Service (74 | 12.5%), Computers, Engineering & Science (47 | 7.9%), Education Instruction & Library (43 | 7.2%), and Health Diagnosing & Treating (27 | 4.5%).
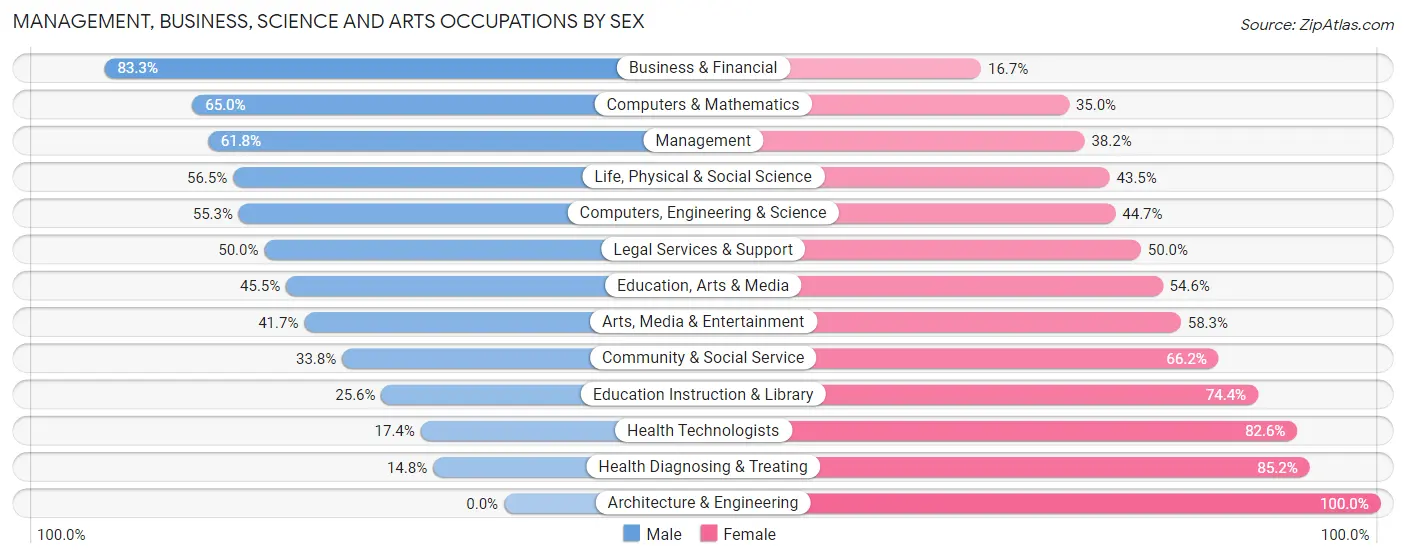
Management, Business, Science and Arts Occupations by Sex
Within the Management, Business, Science and Arts occupations in Coulee Dam, the most male-oriented occupations are Business & Financial (83.3%), Computers & Mathematics (65.0%), and Management (61.8%), while the most female-oriented occupations are Architecture & Engineering (100.0%), Health Diagnosing & Treating (85.2%), and Health Technologists (82.6%).
| Occupation | Male | Female |
| Management | 63 (61.8%) | 39 (38.2%) |
| Business & Financial | 10 (83.3%) | 2 (16.7%) |
| Computers, Engineering & Science | 26 (55.3%) | 21 (44.7%) |
| Computers & Mathematics | 13 (65.0%) | 7 (35.0%) |
| Architecture & Engineering | 0 (0.0%) | 4 (100.0%) |
| Life, Physical & Social Science | 13 (56.5%) | 10 (43.5%) |
| Community & Social Service | 25 (33.8%) | 49 (66.2%) |
| Education, Arts & Media | 5 (45.5%) | 6 (54.5%) |
| Legal Services & Support | 4 (50.0%) | 4 (50.0%) |
| Education Instruction & Library | 11 (25.6%) | 32 (74.4%) |
| Arts, Media & Entertainment | 5 (41.7%) | 7 (58.3%) |
| Health Diagnosing & Treating | 4 (14.8%) | 23 (85.2%) |
| Health Technologists | 4 (17.4%) | 19 (82.6%) |
| Total (Category) | 128 (48.8%) | 134 (51.1%) |
| Total (Overall) | 272 (45.8%) | 322 (54.2%) |
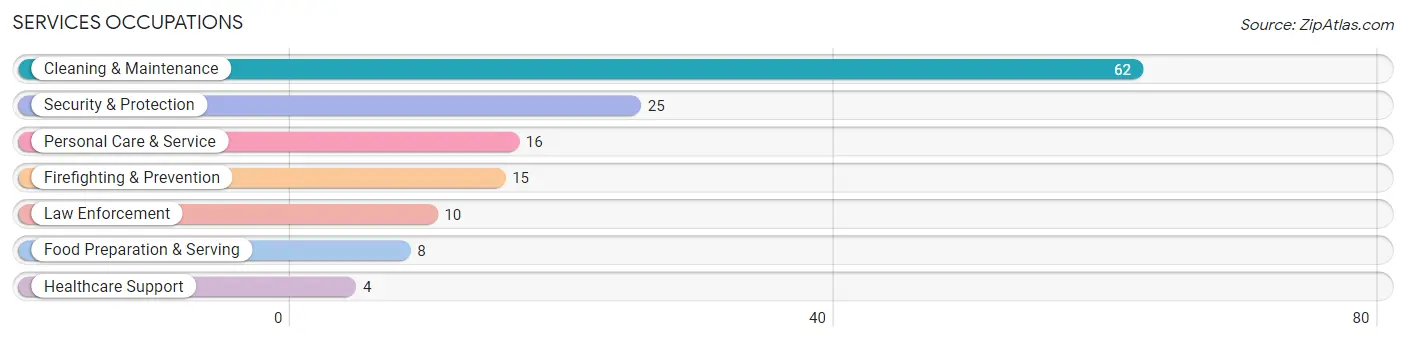
Services Occupations
The most common Services occupations in Coulee Dam are Cleaning & Maintenance (62 | 10.4%), Security & Protection (25 | 4.2%), Personal Care & Service (16 | 2.7%), Firefighting & Prevention (15 | 2.5%), and Law Enforcement (10 | 1.7%).
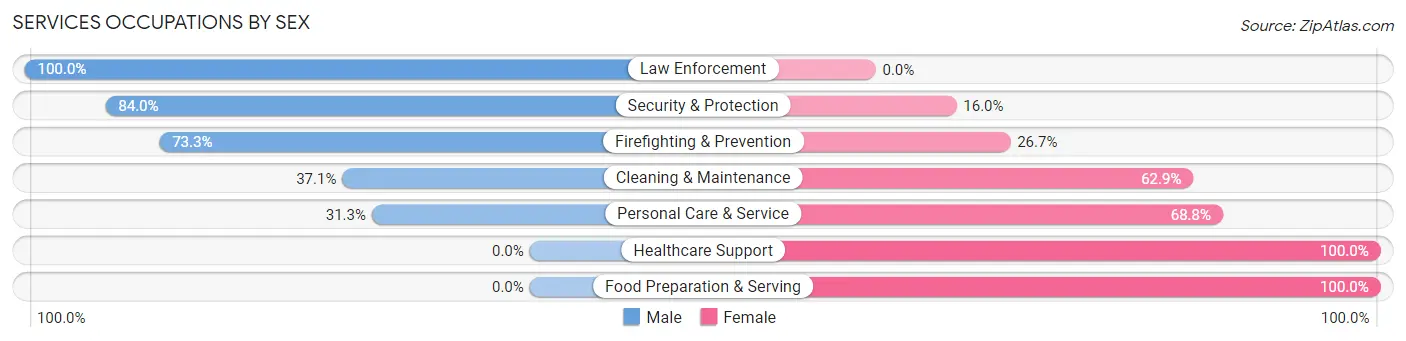
Services Occupations by Sex
Within the Services occupations in Coulee Dam, the most male-oriented occupations are Law Enforcement (100.0%), Security & Protection (84.0%), and Firefighting & Prevention (73.3%), while the most female-oriented occupations are Healthcare Support (100.0%), Food Preparation & Serving (100.0%), and Personal Care & Service (68.8%).
| Occupation | Male | Female |
| Healthcare Support | 0 (0.0%) | 4 (100.0%) |
| Security & Protection | 21 (84.0%) | 4 (16.0%) |
| Firefighting & Prevention | 11 (73.3%) | 4 (26.7%) |
| Law Enforcement | 10 (100.0%) | 0 (0.0%) |
| Food Preparation & Serving | 0 (0.0%) | 8 (100.0%) |
| Cleaning & Maintenance | 23 (37.1%) | 39 (62.9%) |
| Personal Care & Service | 5 (31.2%) | 11 (68.8%) |
| Total (Category) | 49 (42.6%) | 66 (57.4%) |
| Total (Overall) | 272 (45.8%) | 322 (54.2%) |
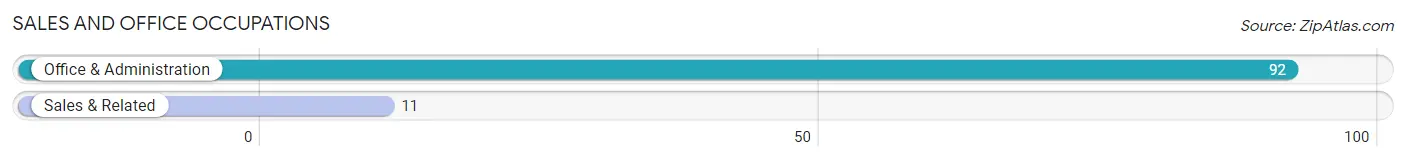
Sales and Office Occupations
The most common Sales and Office occupations in Coulee Dam are Office & Administration (92 | 15.5%), and Sales & Related (11 | 1.8%).
Sales and Office Occupations by Sex
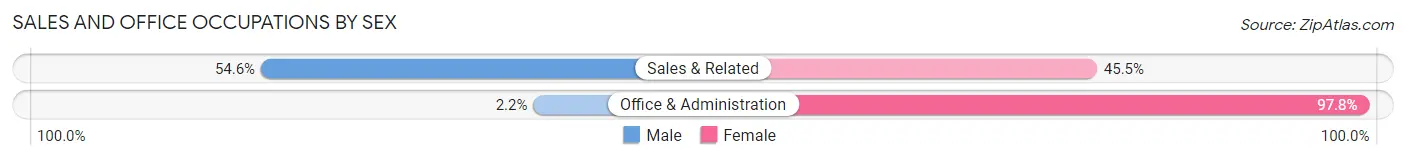
| Occupation | Male | Female |
| Sales & Related | 6 (54.5%) | 5 (45.5%) |
| Office & Administration | 2 (2.2%) | 90 (97.8%) |
| Total (Category) | 8 (7.8%) | 95 (92.2%) |
| Total (Overall) | 272 (45.8%) | 322 (54.2%) |
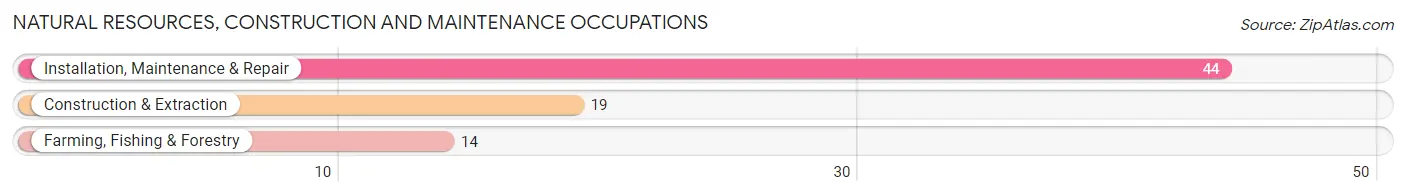
Natural Resources, Construction and Maintenance Occupations
The most common Natural Resources, Construction and Maintenance occupations in Coulee Dam are Installation, Maintenance & Repair (44 | 7.4%), Construction & Extraction (19 | 3.2%), and Farming, Fishing & Forestry (14 | 2.4%).
Natural Resources, Construction and Maintenance Occupations by Sex
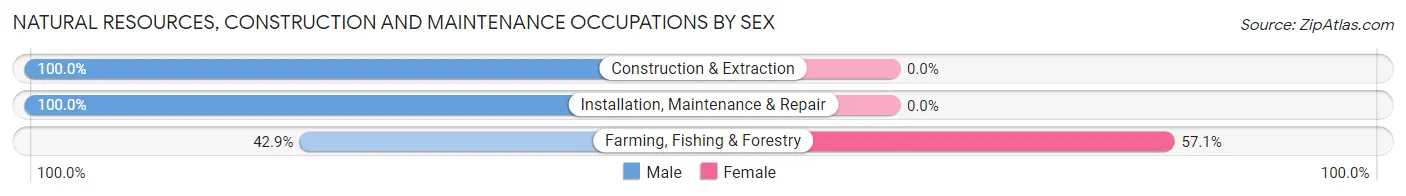
| Occupation | Male | Female |
| Farming, Fishing & Forestry | 6 (42.9%) | 8 (57.1%) |
| Construction & Extraction | 19 (100.0%) | 0 (0.0%) |
| Installation, Maintenance & Repair | 44 (100.0%) | 0 (0.0%) |
| Total (Category) | 69 (89.6%) | 8 (10.4%) |
| Total (Overall) | 272 (45.8%) | 322 (54.2%) |
Production, Transportation and Moving Occupations
The most common Production, Transportation and Moving occupations in Coulee Dam are Production (18 | 3.0%), Material Moving (16 | 2.7%), and Transportation (3 | 0.5%).
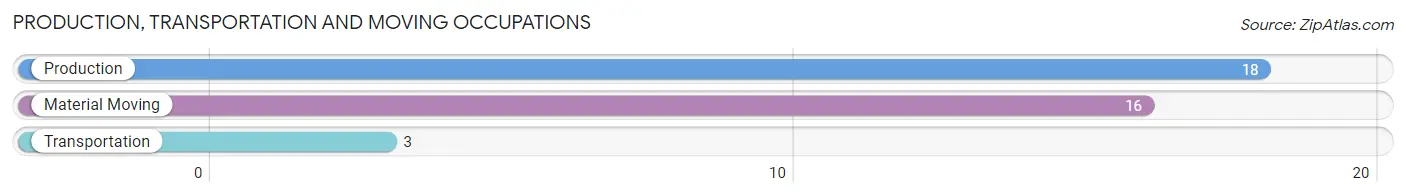
Production, Transportation and Moving Occupations by Sex
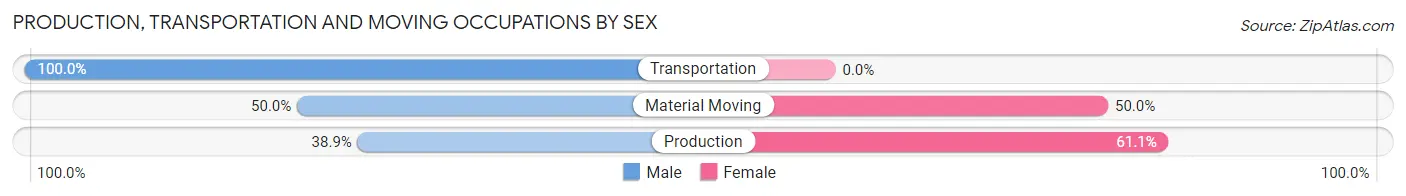
| Occupation | Male | Female |
| Production | 7 (38.9%) | 11 (61.1%) |
| Transportation | 3 (100.0%) | 0 (0.0%) |
| Material Moving | 8 (50.0%) | 8 (50.0%) |
| Total (Category) | 18 (48.6%) | 19 (51.3%) |
| Total (Overall) | 272 (45.8%) | 322 (54.2%) |
Employment Industries by Sex in Coulee Dam
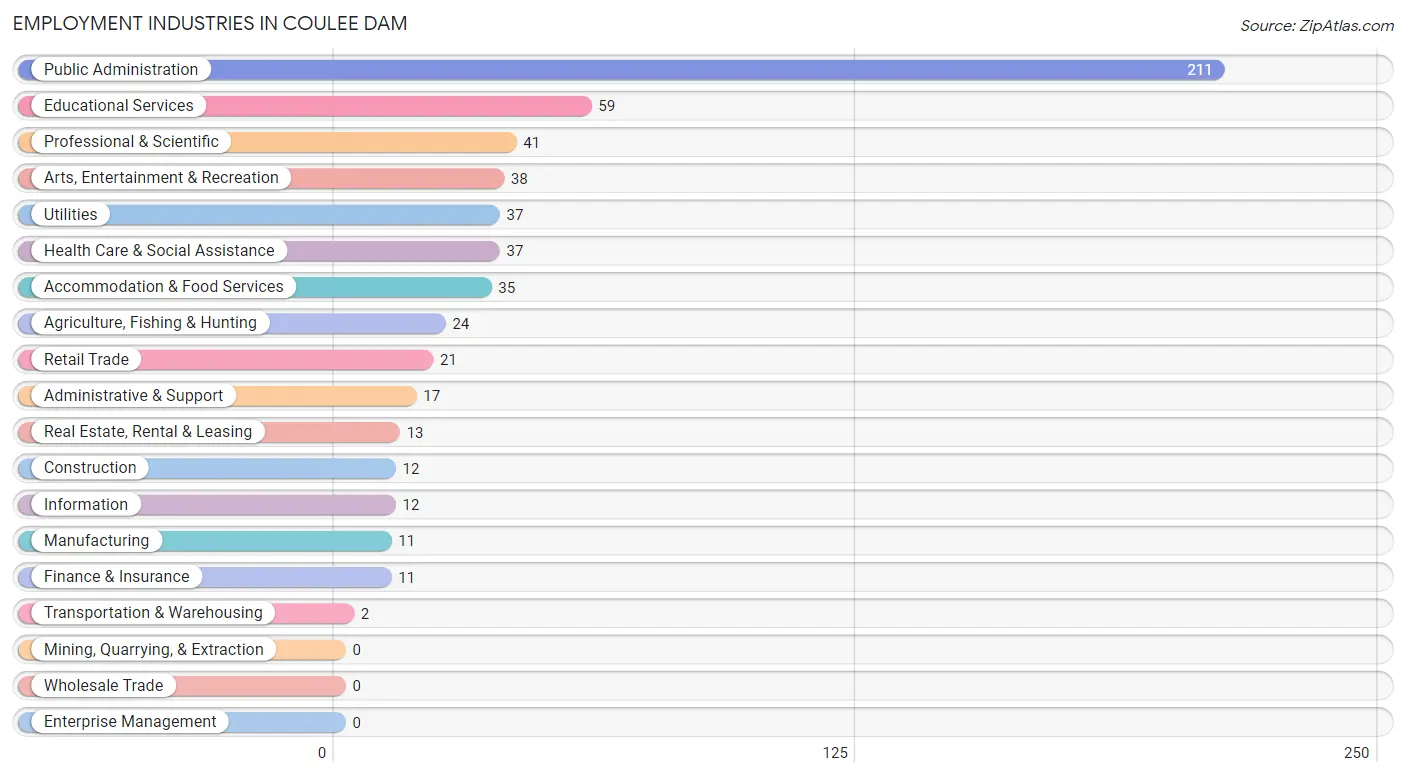
Employment Industries in Coulee Dam
The major employment industries in Coulee Dam include Public Administration (211 | 35.5%), Educational Services (59 | 9.9%), Professional & Scientific (41 | 6.9%), Arts, Entertainment & Recreation (38 | 6.4%), and Utilities (37 | 6.2%).
Employment Industries by Sex in Coulee Dam
The Coulee Dam industries that see more men than women are Construction (100.0%), Utilities (94.6%), and Manufacturing (81.8%), whereas the industries that tend to have a higher number of women are Transportation & Warehousing (100.0%), Information (100.0%), and Finance & Insurance (100.0%).
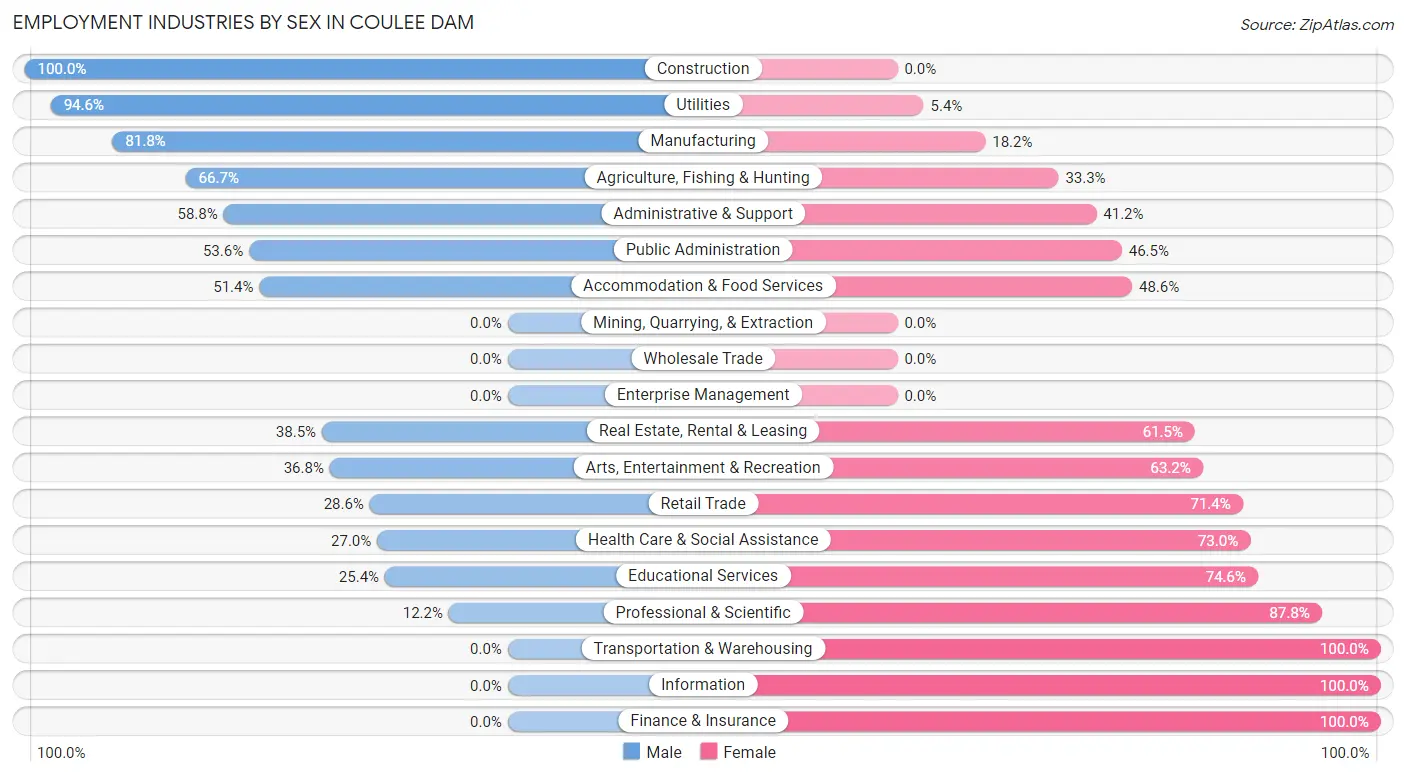
| Industry | Male | Female |
| Agriculture, Fishing & Hunting | 16 (66.7%) | 8 (33.3%) |
| Mining, Quarrying, & Extraction | 0 (0.0%) | 0 (0.0%) |
| Construction | 12 (100.0%) | 0 (0.0%) |
| Manufacturing | 9 (81.8%) | 2 (18.2%) |
| Wholesale Trade | 0 (0.0%) | 0 (0.0%) |
| Retail Trade | 6 (28.6%) | 15 (71.4%) |
| Transportation & Warehousing | 0 (0.0%) | 2 (100.0%) |
| Utilities | 35 (94.6%) | 2 (5.4%) |
| Information | 0 (0.0%) | 12 (100.0%) |
| Finance & Insurance | 0 (0.0%) | 11 (100.0%) |
| Real Estate, Rental & Leasing | 5 (38.5%) | 8 (61.5%) |
| Professional & Scientific | 5 (12.2%) | 36 (87.8%) |
| Enterprise Management | 0 (0.0%) | 0 (0.0%) |
| Administrative & Support | 10 (58.8%) | 7 (41.2%) |
| Educational Services | 15 (25.4%) | 44 (74.6%) |
| Health Care & Social Assistance | 10 (27.0%) | 27 (73.0%) |
| Arts, Entertainment & Recreation | 14 (36.8%) | 24 (63.2%) |
| Accommodation & Food Services | 18 (51.4%) | 17 (48.6%) |
| Public Administration | 113 (53.5%) | 98 (46.5%) |
| Total | 272 (45.8%) | 322 (54.2%) |
Education in Coulee Dam
School Enrollment in Coulee Dam
The most common levels of schooling among the 363 students in Coulee Dam are college / undergraduate (118 | 32.5%), middle school (73 | 20.1%), and high school (56 | 15.4%).
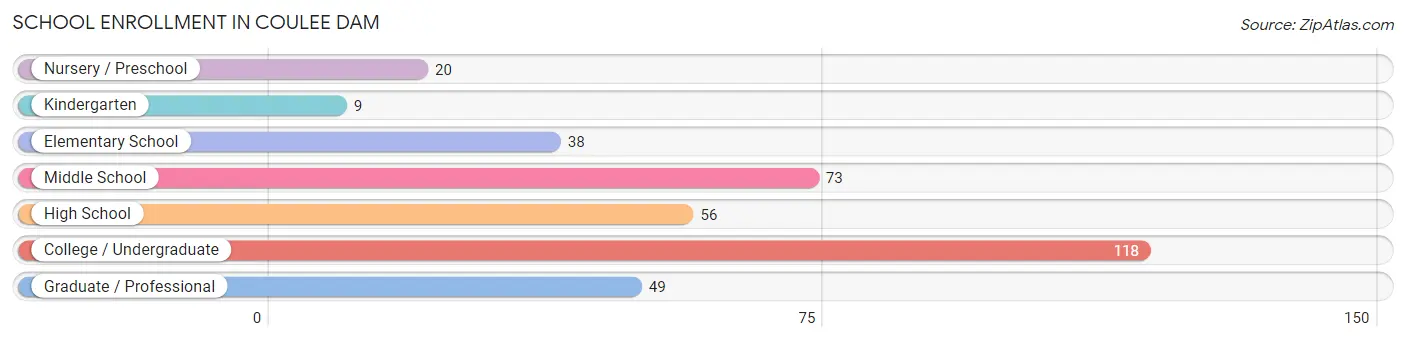
| School Level | # Students | % Students |
| Nursery / Preschool | 20 | 5.5% |
| Kindergarten | 9 | 2.5% |
| Elementary School | 38 | 10.5% |
| Middle School | 73 | 20.1% |
| High School | 56 | 15.4% |
| College / Undergraduate | 118 | 32.5% |
| Graduate / Professional | 49 | 13.5% |
| Total | 363 | 100.0% |
School Enrollment by Age by Funding Source in Coulee Dam
Out of a total of 363 students who are enrolled in schools in Coulee Dam, 78 (21.5%) attend a private institution, while the remaining 285 (78.5%) are enrolled in public schools. The age group of 20 to 24 year olds has the highest likelihood of being enrolled in private schools, with 58 (58.6% in the age bracket) enrolled. Conversely, the age group of 3 to 4 year olds has the lowest likelihood of being enrolled in a private school, with 16 (100.0% in the age bracket) attending a public institution.
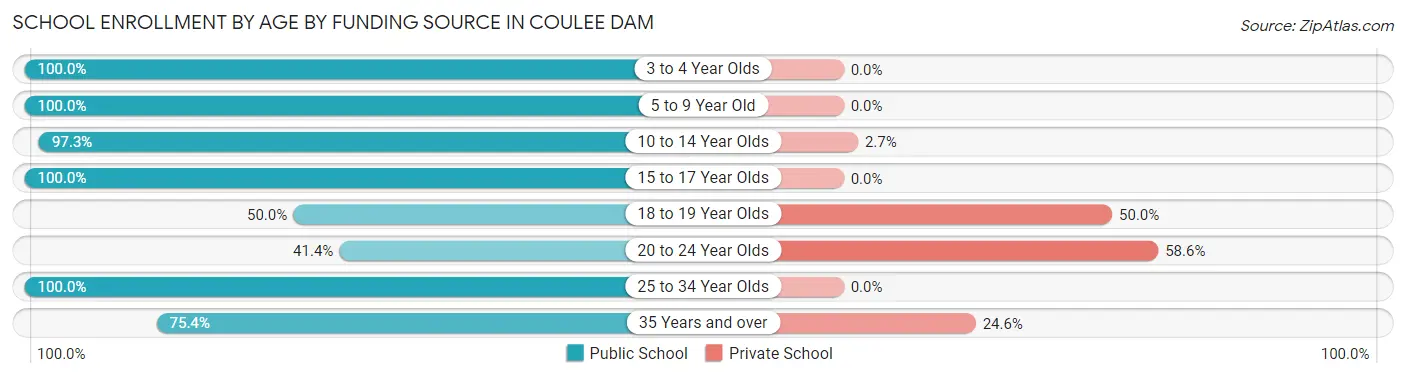
| Age Bracket | Public School | Private School |
| 3 to 4 Year Olds | 16 (100.0%) | 0 (0.0%) |
| 5 to 9 Year Old | 51 (100.0%) | 0 (0.0%) |
| 10 to 14 Year Olds | 73 (97.3%) | 2 (2.7%) |
| 15 to 17 Year Olds | 51 (100.0%) | 0 (0.0%) |
| 18 to 19 Year Olds | 3 (50.0%) | 3 (50.0%) |
| 20 to 24 Year Olds | 41 (41.4%) | 58 (58.6%) |
| 25 to 34 Year Olds | 4 (100.0%) | 0 (0.0%) |
| 35 Years and over | 46 (75.4%) | 15 (24.6%) |
| Total | 285 (78.5%) | 78 (21.5%) |
Educational Attainment by Field of Study in Coulee Dam
Bio, nature & agricultural (80 | 26.3%), business (55 | 18.1%), science & technology (47 | 15.5%), arts & humanities (26 | 8.6%), and social sciences (20 | 6.6%) are the most common fields of study among 304 individuals in Coulee Dam who have obtained a bachelor's degree or higher.
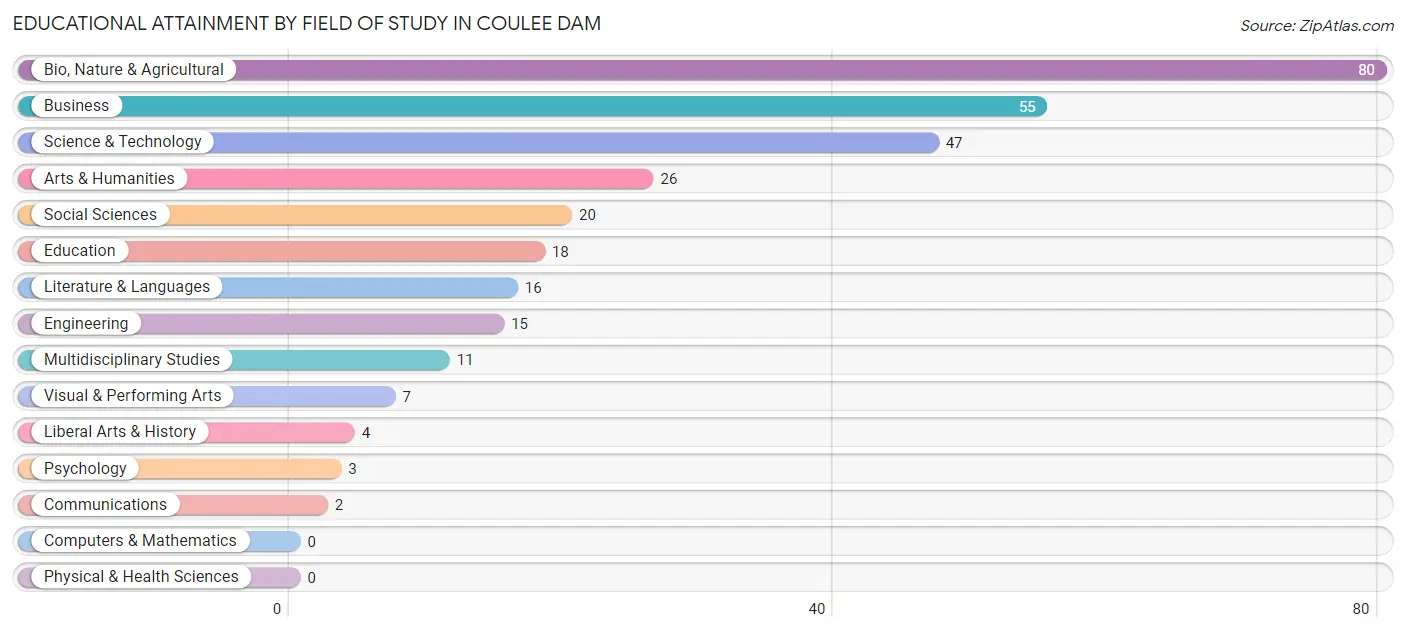
| Field of Study | # Graduates | % Graduates |
| Computers & Mathematics | 0 | 0.0% |
| Bio, Nature & Agricultural | 80 | 26.3% |
| Physical & Health Sciences | 0 | 0.0% |
| Psychology | 3 | 1.0% |
| Social Sciences | 20 | 6.6% |
| Engineering | 15 | 4.9% |
| Multidisciplinary Studies | 11 | 3.6% |
| Science & Technology | 47 | 15.5% |
| Business | 55 | 18.1% |
| Education | 18 | 5.9% |
| Literature & Languages | 16 | 5.3% |
| Liberal Arts & History | 4 | 1.3% |
| Visual & Performing Arts | 7 | 2.3% |
| Communications | 2 | 0.7% |
| Arts & Humanities | 26 | 8.6% |
| Total | 304 | 100.0% |
Transportation & Commute in Coulee Dam
Vehicle Availability by Sex in Coulee Dam
The most prevalent vehicle ownership categories in Coulee Dam are males with 1 vehicle (91, accounting for 33.5%) and females with 1 vehicle (87, making up 28.3%).
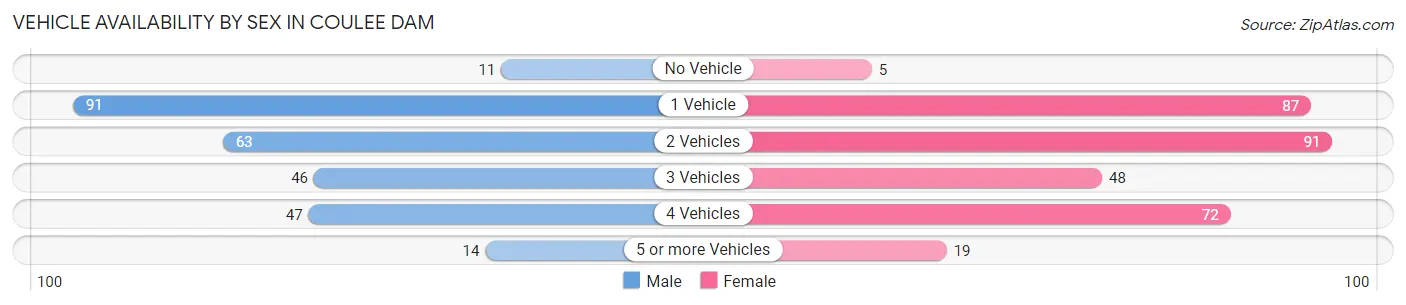
| Vehicles Available | Male | Female |
| No Vehicle | 11 (4.0%) | 5 (1.5%) |
| 1 Vehicle | 91 (33.5%) | 87 (27.0%) |
| 2 Vehicles | 63 (23.2%) | 91 (28.3%) |
| 3 Vehicles | 46 (16.9%) | 48 (14.9%) |
| 4 Vehicles | 47 (17.3%) | 72 (22.4%) |
| 5 or more Vehicles | 14 (5.1%) | 19 (5.9%) |
| Total | 272 (100.0%) | 322 (100.0%) |
Commute Time in Coulee Dam
The most frequently occuring commute durations in Coulee Dam are 5 to 9 minutes (139 commuters, 24.0%), 15 to 19 minutes (111 commuters, 19.2%), and 20 to 24 minutes (108 commuters, 18.6%).
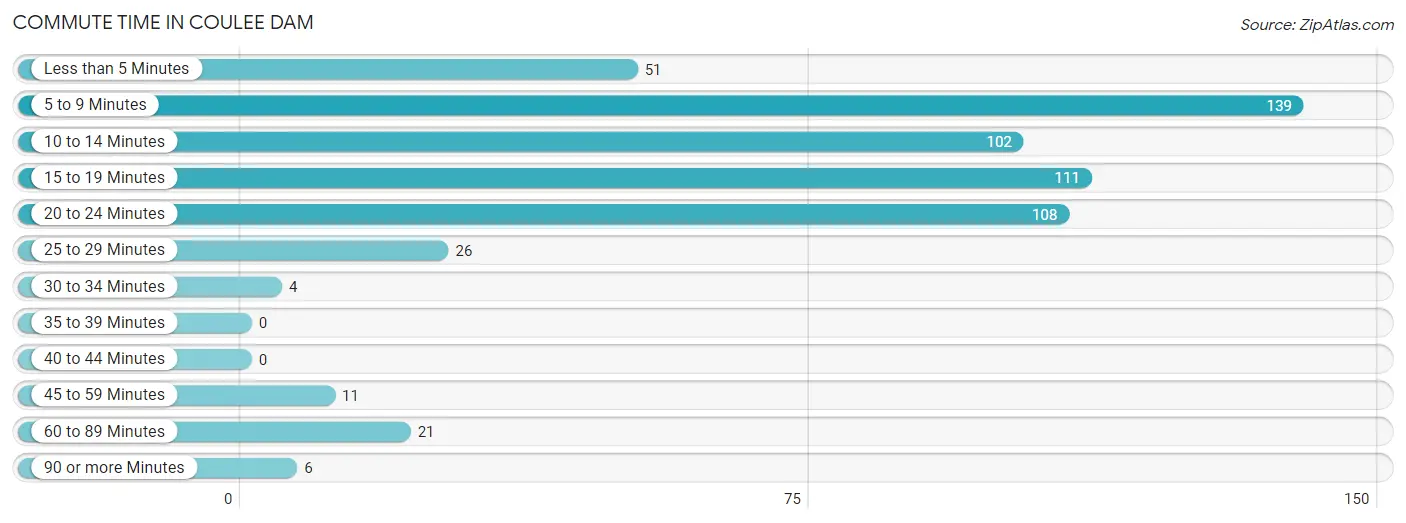
| Commute Time | # Commuters | % Commuters |
| Less than 5 Minutes | 51 | 8.8% |
| 5 to 9 Minutes | 139 | 24.0% |
| 10 to 14 Minutes | 102 | 17.6% |
| 15 to 19 Minutes | 111 | 19.2% |
| 20 to 24 Minutes | 108 | 18.6% |
| 25 to 29 Minutes | 26 | 4.5% |
| 30 to 34 Minutes | 4 | 0.7% |
| 35 to 39 Minutes | 0 | 0.0% |
| 40 to 44 Minutes | 0 | 0.0% |
| 45 to 59 Minutes | 11 | 1.9% |
| 60 to 89 Minutes | 21 | 3.6% |
| 90 or more Minutes | 6 | 1.0% |
Commute Time by Sex in Coulee Dam
The most common commute times in Coulee Dam are 5 to 9 minutes (80 commuters, 30.0%) for males and 10 to 14 minutes (78 commuters, 25.0%) for females.
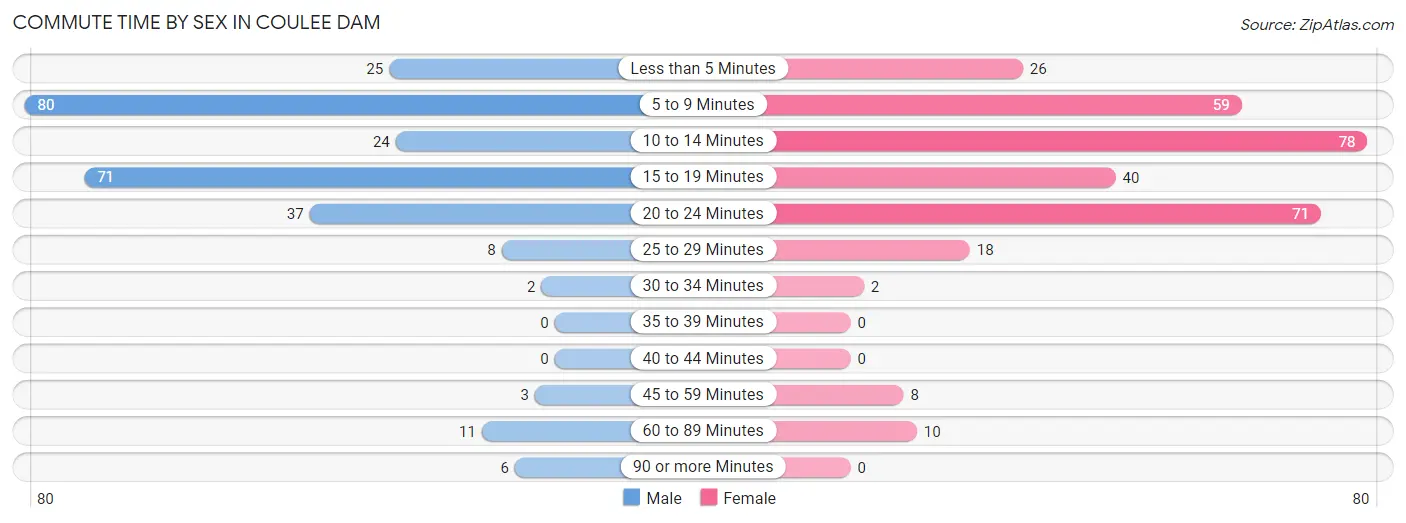
| Commute Time | Male | Female |
| Less than 5 Minutes | 25 (9.4%) | 26 (8.3%) |
| 5 to 9 Minutes | 80 (30.0%) | 59 (18.9%) |
| 10 to 14 Minutes | 24 (9.0%) | 78 (25.0%) |
| 15 to 19 Minutes | 71 (26.6%) | 40 (12.8%) |
| 20 to 24 Minutes | 37 (13.9%) | 71 (22.8%) |
| 25 to 29 Minutes | 8 (3.0%) | 18 (5.8%) |
| 30 to 34 Minutes | 2 (0.7%) | 2 (0.6%) |
| 35 to 39 Minutes | 0 (0.0%) | 0 (0.0%) |
| 40 to 44 Minutes | 0 (0.0%) | 0 (0.0%) |
| 45 to 59 Minutes | 3 (1.1%) | 8 (2.6%) |
| 60 to 89 Minutes | 11 (4.1%) | 10 (3.2%) |
| 90 or more Minutes | 6 (2.2%) | 0 (0.0%) |
Time of Departure to Work by Sex in Coulee Dam
The most frequent times of departure to work in Coulee Dam are 6:00 AM to 6:29 AM (110, 41.2%) for males and 7:30 AM to 7:59 AM (93, 29.8%) for females.
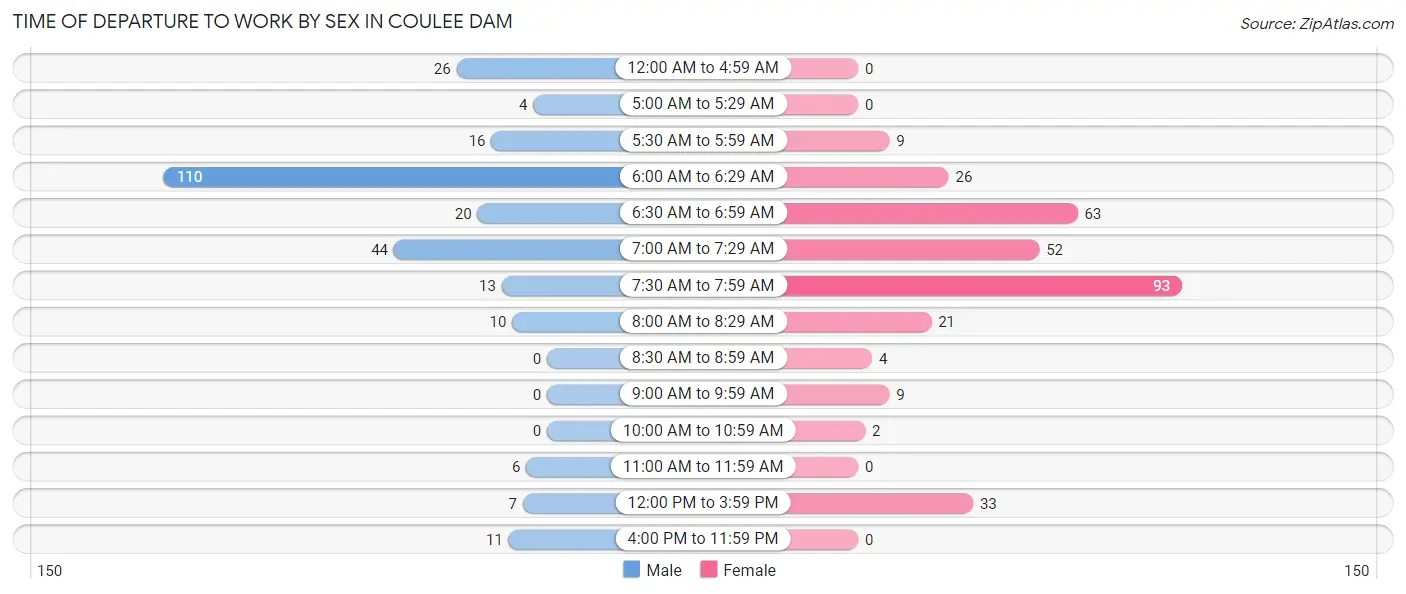
| Time of Departure | Male | Female |
| 12:00 AM to 4:59 AM | 26 (9.7%) | 0 (0.0%) |
| 5:00 AM to 5:29 AM | 4 (1.5%) | 0 (0.0%) |
| 5:30 AM to 5:59 AM | 16 (6.0%) | 9 (2.9%) |
| 6:00 AM to 6:29 AM | 110 (41.2%) | 26 (8.3%) |
| 6:30 AM to 6:59 AM | 20 (7.5%) | 63 (20.2%) |
| 7:00 AM to 7:29 AM | 44 (16.5%) | 52 (16.7%) |
| 7:30 AM to 7:59 AM | 13 (4.9%) | 93 (29.8%) |
| 8:00 AM to 8:29 AM | 10 (3.7%) | 21 (6.7%) |
| 8:30 AM to 8:59 AM | 0 (0.0%) | 4 (1.3%) |
| 9:00 AM to 9:59 AM | 0 (0.0%) | 9 (2.9%) |
| 10:00 AM to 10:59 AM | 0 (0.0%) | 2 (0.6%) |
| 11:00 AM to 11:59 AM | 6 (2.2%) | 0 (0.0%) |
| 12:00 PM to 3:59 PM | 7 (2.6%) | 33 (10.6%) |
| 4:00 PM to 11:59 PM | 11 (4.1%) | 0 (0.0%) |
| Total | 267 (100.0%) | 312 (100.0%) |
Housing Occupancy in Coulee Dam
Occupancy by Ownership in Coulee Dam
Of the total 583 dwellings in Coulee Dam, owner-occupied units account for 389 (66.7%), while renter-occupied units make up 194 (33.3%).
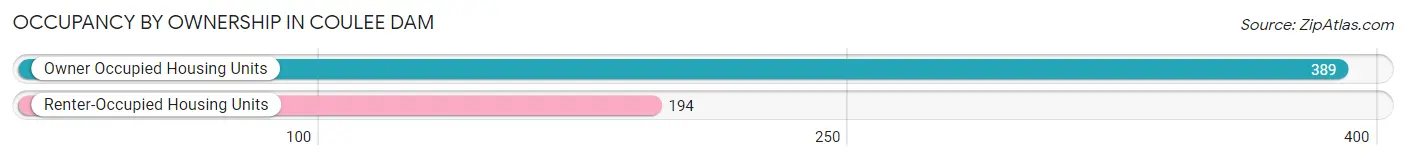
| Occupancy | # Housing Units | % Housing Units |
| Owner Occupied Housing Units | 389 | 66.7% |
| Renter-Occupied Housing Units | 194 | 33.3% |
| Total Occupied Housing Units | 583 | 100.0% |
Occupancy by Household Size in Coulee Dam
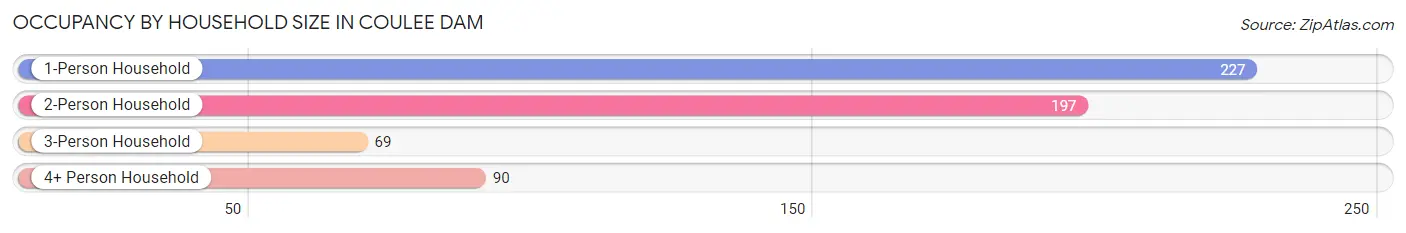
| Household Size | # Housing Units | % Housing Units |
| 1-Person Household | 227 | 38.9% |
| 2-Person Household | 197 | 33.8% |
| 3-Person Household | 69 | 11.8% |
| 4+ Person Household | 90 | 15.4% |
| Total Housing Units | 583 | 100.0% |
Occupancy by Ownership by Household Size in Coulee Dam
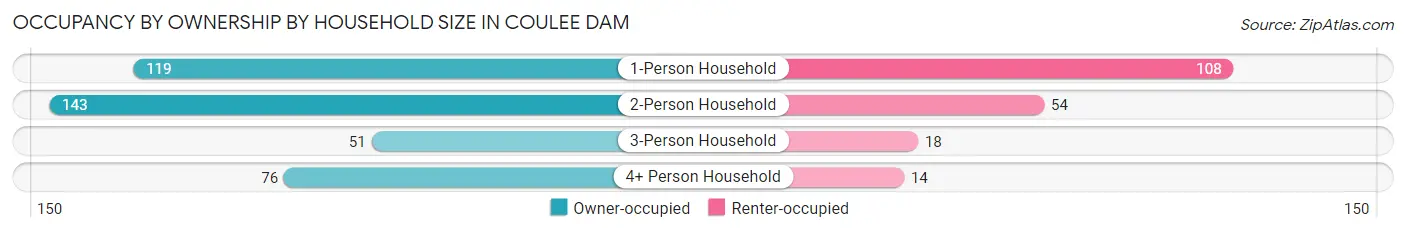
| Household Size | Owner-occupied | Renter-occupied |
| 1-Person Household | 119 (52.4%) | 108 (47.6%) |
| 2-Person Household | 143 (72.6%) | 54 (27.4%) |
| 3-Person Household | 51 (73.9%) | 18 (26.1%) |
| 4+ Person Household | 76 (84.4%) | 14 (15.6%) |
| Total Housing Units | 389 (66.7%) | 194 (33.3%) |
Occupancy by Educational Attainment in Coulee Dam
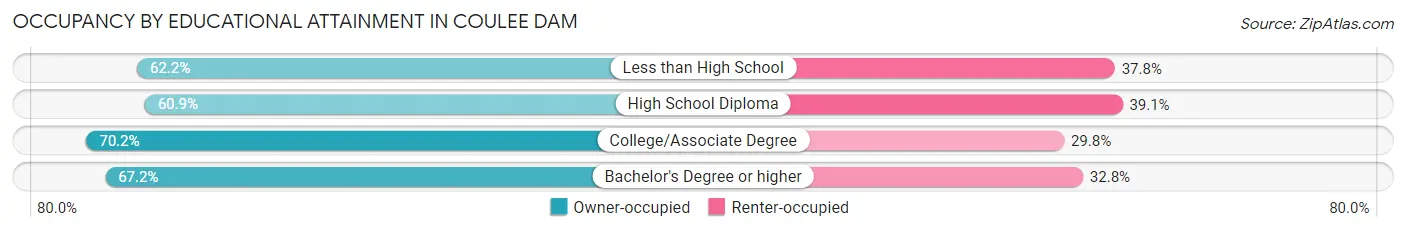
| Household Size | Owner-occupied | Renter-occupied |
| Less than High School | 23 (62.2%) | 14 (37.8%) |
| High School Diploma | 78 (60.9%) | 50 (39.1%) |
| College/Associate Degree | 165 (70.2%) | 70 (29.8%) |
| Bachelor's Degree or higher | 123 (67.2%) | 60 (32.8%) |
Occupancy by Age of Householder in Coulee Dam
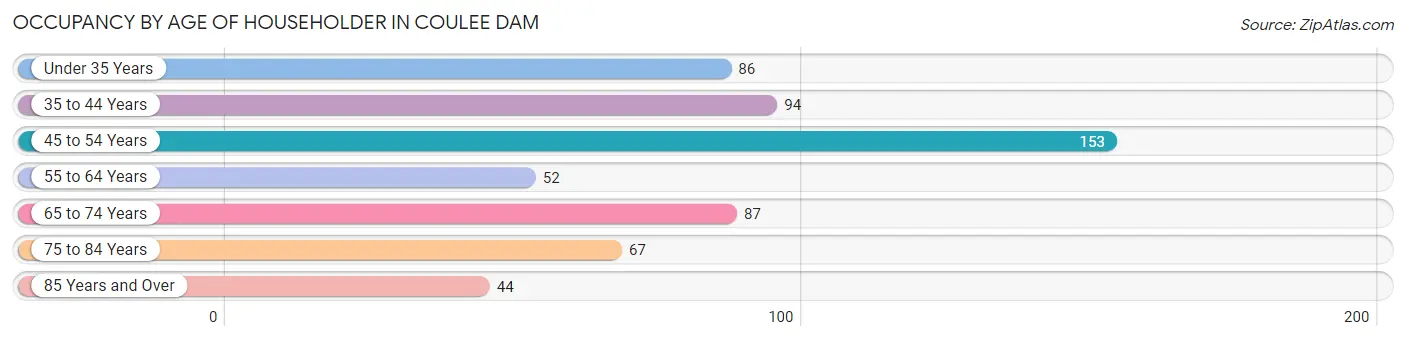
| Age Bracket | # Households | % Households |
| Under 35 Years | 86 | 14.7% |
| 35 to 44 Years | 94 | 16.1% |
| 45 to 54 Years | 153 | 26.2% |
| 55 to 64 Years | 52 | 8.9% |
| 65 to 74 Years | 87 | 14.9% |
| 75 to 84 Years | 67 | 11.5% |
| 85 Years and Over | 44 | 7.5% |
| Total | 583 | 100.0% |
Housing Finances in Coulee Dam
Median Income by Occupancy in Coulee Dam
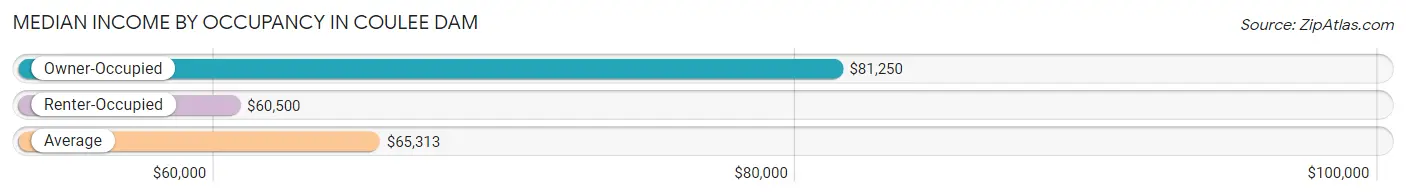
| Occupancy Type | # Households | Median Income |
| Owner-Occupied | 389 (66.7%) | $81,250 |
| Renter-Occupied | 194 (33.3%) | $60,500 |
| Average | 583 (100.0%) | $65,313 |
Occupancy by Householder Income Bracket in Coulee Dam
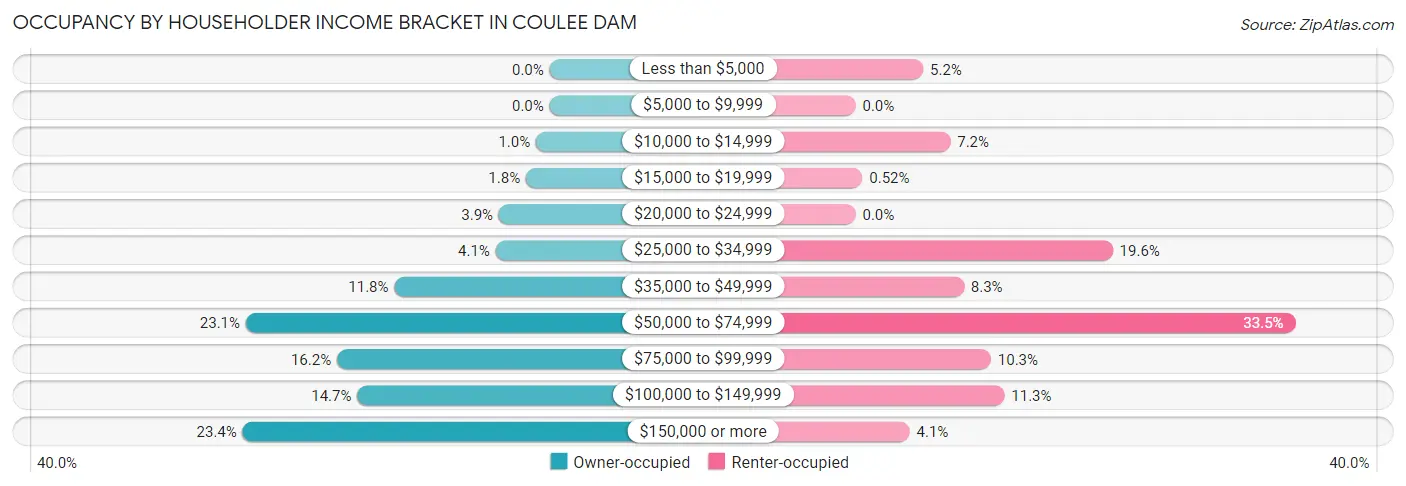
| Income Bracket | Owner-occupied | Renter-occupied |
| Less than $5,000 | 0 (0.0%) | 10 (5.1%) |
| $5,000 to $9,999 | 0 (0.0%) | 0 (0.0%) |
| $10,000 to $14,999 | 4 (1.0%) | 14 (7.2%) |
| $15,000 to $19,999 | 7 (1.8%) | 1 (0.5%) |
| $20,000 to $24,999 | 15 (3.9%) | 0 (0.0%) |
| $25,000 to $34,999 | 16 (4.1%) | 38 (19.6%) |
| $35,000 to $49,999 | 46 (11.8%) | 16 (8.3%) |
| $50,000 to $74,999 | 90 (23.1%) | 65 (33.5%) |
| $75,000 to $99,999 | 63 (16.2%) | 20 (10.3%) |
| $100,000 to $149,999 | 57 (14.6%) | 22 (11.3%) |
| $150,000 or more | 91 (23.4%) | 8 (4.1%) |
| Total | 389 (100.0%) | 194 (100.0%) |
Monthly Housing Cost Tiers in Coulee Dam
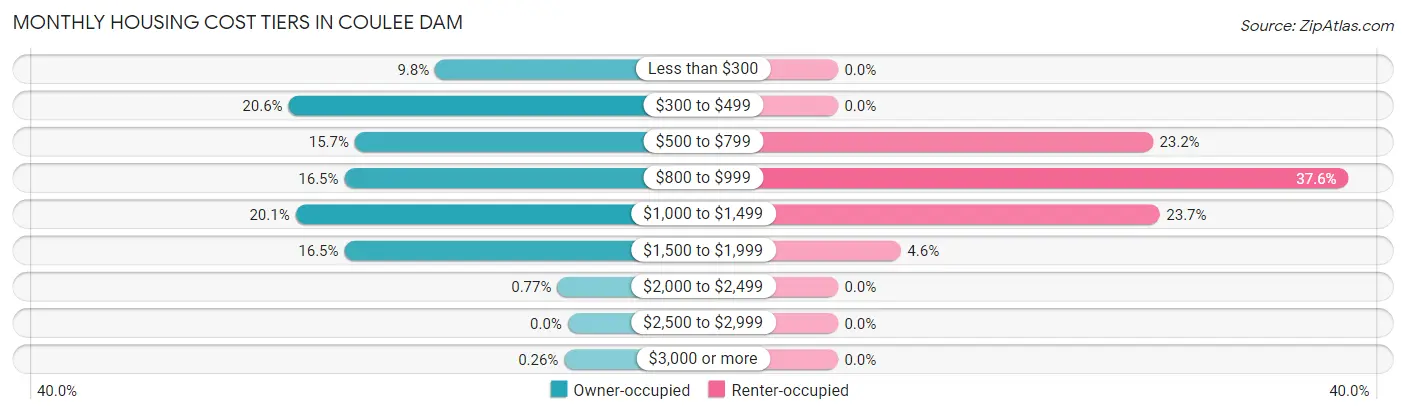
| Monthly Cost | Owner-occupied | Renter-occupied |
| Less than $300 | 38 (9.8%) | 0 (0.0%) |
| $300 to $499 | 80 (20.6%) | 0 (0.0%) |
| $500 to $799 | 61 (15.7%) | 45 (23.2%) |
| $800 to $999 | 64 (16.5%) | 73 (37.6%) |
| $1,000 to $1,499 | 78 (20.1%) | 46 (23.7%) |
| $1,500 to $1,999 | 64 (16.5%) | 9 (4.6%) |
| $2,000 to $2,499 | 3 (0.8%) | 0 (0.0%) |
| $2,500 to $2,999 | 0 (0.0%) | 0 (0.0%) |
| $3,000 or more | 1 (0.3%) | 0 (0.0%) |
| Total | 389 (100.0%) | 194 (100.0%) |
Physical Housing Characteristics in Coulee Dam
Housing Structures in Coulee Dam
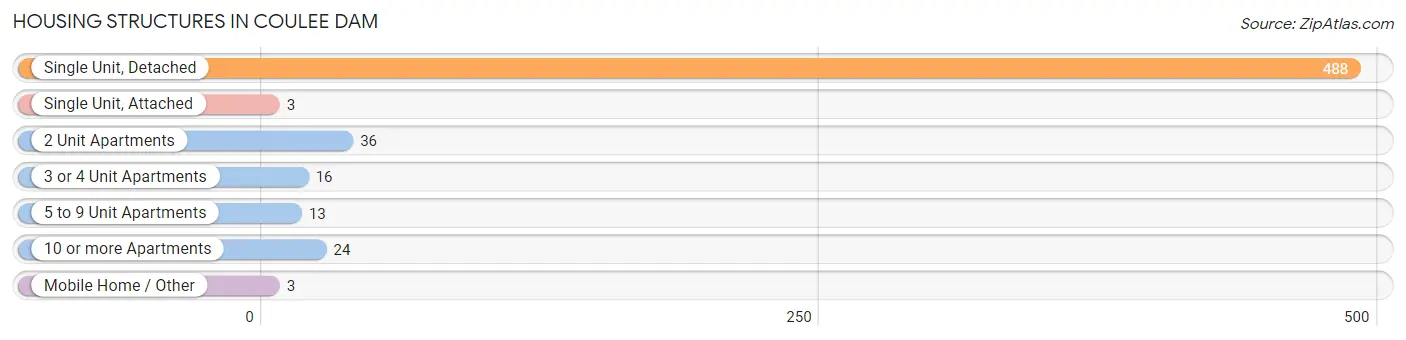
| Structure Type | # Housing Units | % Housing Units |
| Single Unit, Detached | 488 | 83.7% |
| Single Unit, Attached | 3 | 0.5% |
| 2 Unit Apartments | 36 | 6.2% |
| 3 or 4 Unit Apartments | 16 | 2.7% |
| 5 to 9 Unit Apartments | 13 | 2.2% |
| 10 or more Apartments | 24 | 4.1% |
| Mobile Home / Other | 3 | 0.5% |
| Total | 583 | 100.0% |
Housing Structures by Occupancy in Coulee Dam
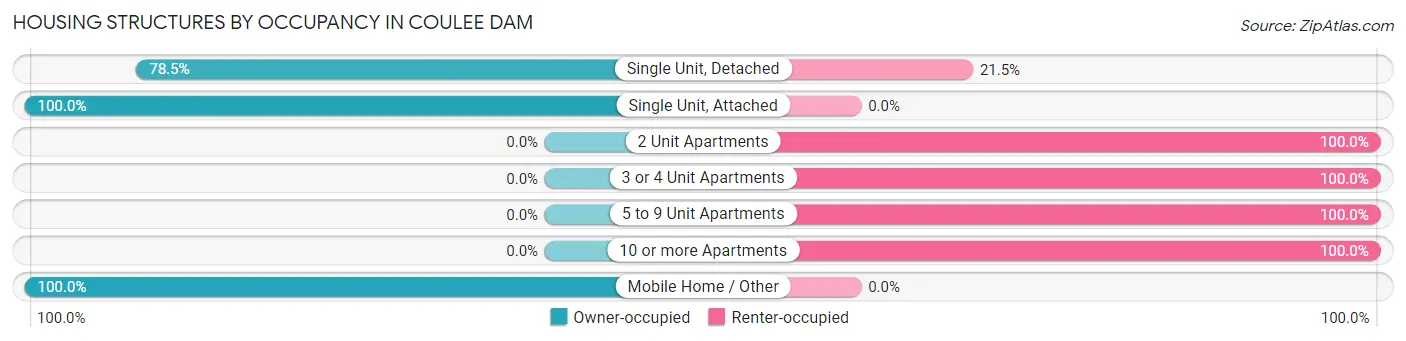
| Structure Type | Owner-occupied | Renter-occupied |
| Single Unit, Detached | 383 (78.5%) | 105 (21.5%) |
| Single Unit, Attached | 3 (100.0%) | 0 (0.0%) |
| 2 Unit Apartments | 0 (0.0%) | 36 (100.0%) |
| 3 or 4 Unit Apartments | 0 (0.0%) | 16 (100.0%) |
| 5 to 9 Unit Apartments | 0 (0.0%) | 13 (100.0%) |
| 10 or more Apartments | 0 (0.0%) | 24 (100.0%) |
| Mobile Home / Other | 3 (100.0%) | 0 (0.0%) |
| Total | 389 (66.7%) | 194 (33.3%) |
Housing Structures by Number of Rooms in Coulee Dam
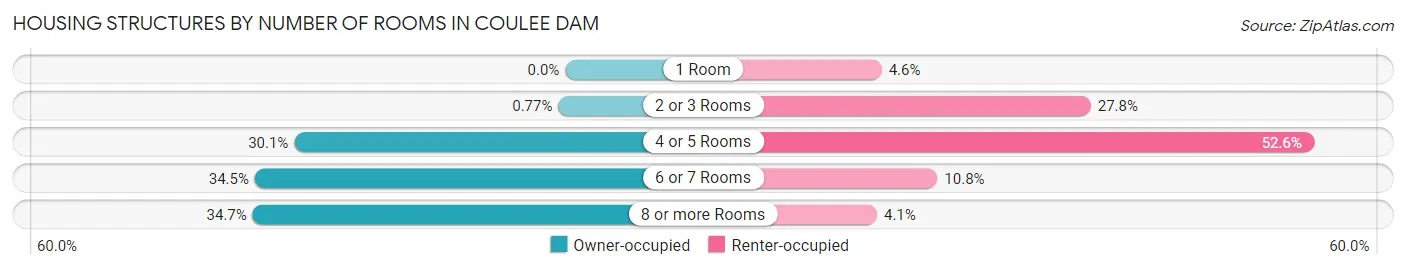
| Number of Rooms | Owner-occupied | Renter-occupied |
| 1 Room | 0 (0.0%) | 9 (4.6%) |
| 2 or 3 Rooms | 3 (0.8%) | 54 (27.8%) |
| 4 or 5 Rooms | 117 (30.1%) | 102 (52.6%) |
| 6 or 7 Rooms | 134 (34.4%) | 21 (10.8%) |
| 8 or more Rooms | 135 (34.7%) | 8 (4.1%) |
| Total | 389 (100.0%) | 194 (100.0%) |
Housing Structure by Heating Type in Coulee Dam
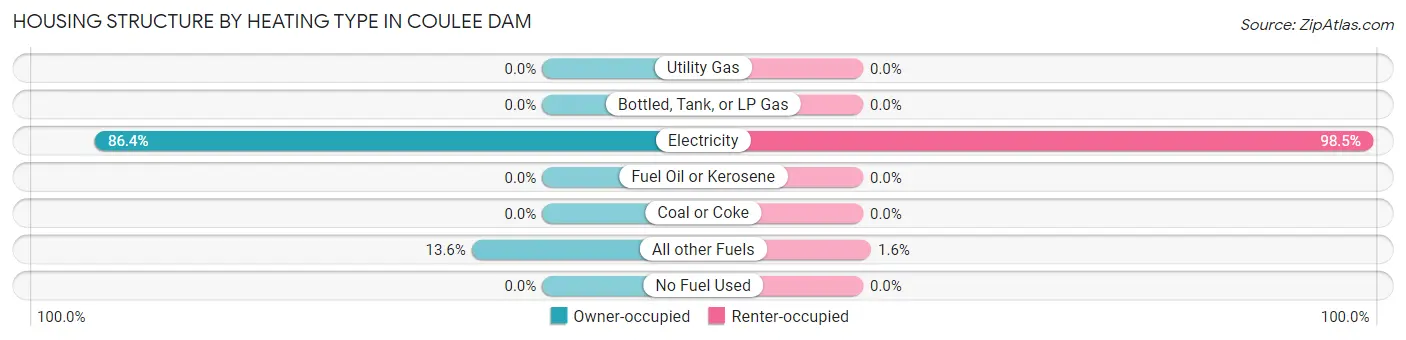
| Heating Type | Owner-occupied | Renter-occupied |
| Utility Gas | 0 (0.0%) | 0 (0.0%) |
| Bottled, Tank, or LP Gas | 0 (0.0%) | 0 (0.0%) |
| Electricity | 336 (86.4%) | 191 (98.5%) |
| Fuel Oil or Kerosene | 0 (0.0%) | 0 (0.0%) |
| Coal or Coke | 0 (0.0%) | 0 (0.0%) |
| All other Fuels | 53 (13.6%) | 3 (1.5%) |
| No Fuel Used | 0 (0.0%) | 0 (0.0%) |
| Total | 389 (100.0%) | 194 (100.0%) |
Household Vehicle Usage in Coulee Dam
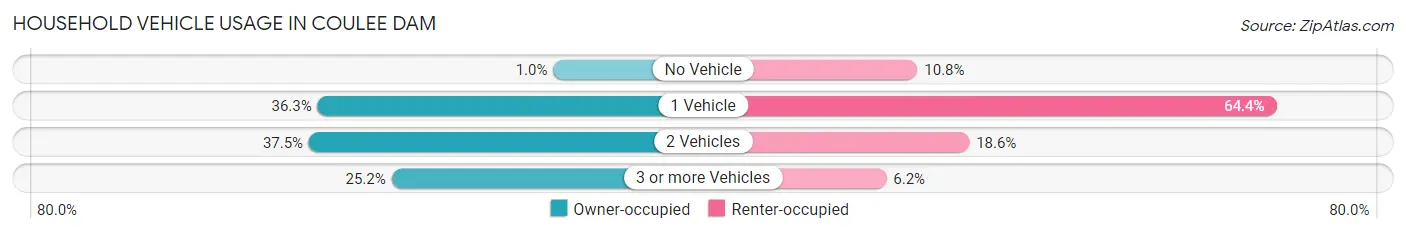
| Vehicles per Household | Owner-occupied | Renter-occupied |
| No Vehicle | 4 (1.0%) | 21 (10.8%) |
| 1 Vehicle | 141 (36.2%) | 125 (64.4%) |
| 2 Vehicles | 146 (37.5%) | 36 (18.6%) |
| 3 or more Vehicles | 98 (25.2%) | 12 (6.2%) |
| Total | 389 (100.0%) | 194 (100.0%) |
Real Estate & Mortgages in Coulee Dam
Real Estate and Mortgage Overview in Coulee Dam
| Characteristic | Without Mortgage | With Mortgage |
| Housing Units | 149 | 240 |
| Median Property Value | $157,900 | $219,600 |
| Median Household Income | $64,219 | $69 |
| Monthly Housing Costs | $421 | $1 |
| Real Estate Taxes | $1,605 | $11 |
Property Value by Mortgage Status in Coulee Dam
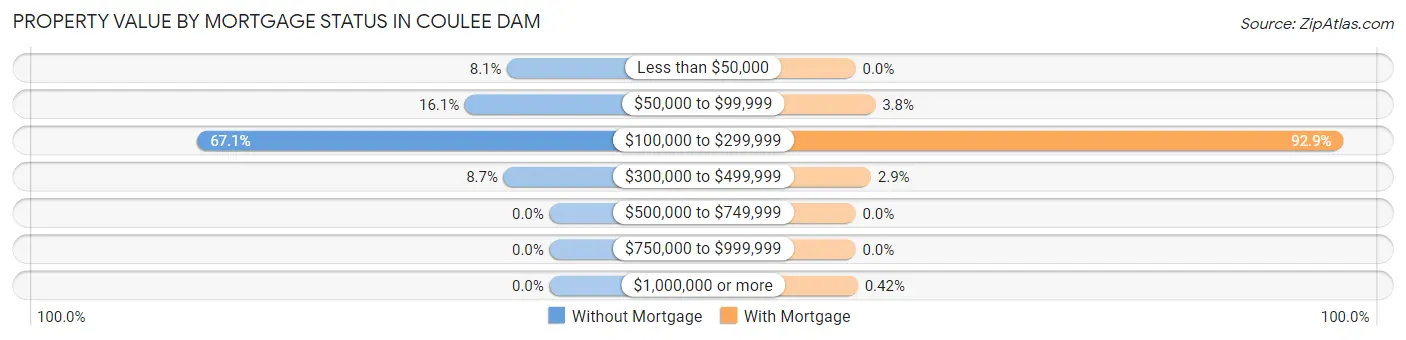
| Property Value | Without Mortgage | With Mortgage |
| Less than $50,000 | 12 (8.1%) | 0 (0.0%) |
| $50,000 to $99,999 | 24 (16.1%) | 9 (3.7%) |
| $100,000 to $299,999 | 100 (67.1%) | 223 (92.9%) |
| $300,000 to $499,999 | 13 (8.7%) | 7 (2.9%) |
| $500,000 to $749,999 | 0 (0.0%) | 0 (0.0%) |
| $750,000 to $999,999 | 0 (0.0%) | 0 (0.0%) |
| $1,000,000 or more | 0 (0.0%) | 1 (0.4%) |
| Total | 149 (100.0%) | 240 (100.0%) |
Household Income by Mortgage Status in Coulee Dam
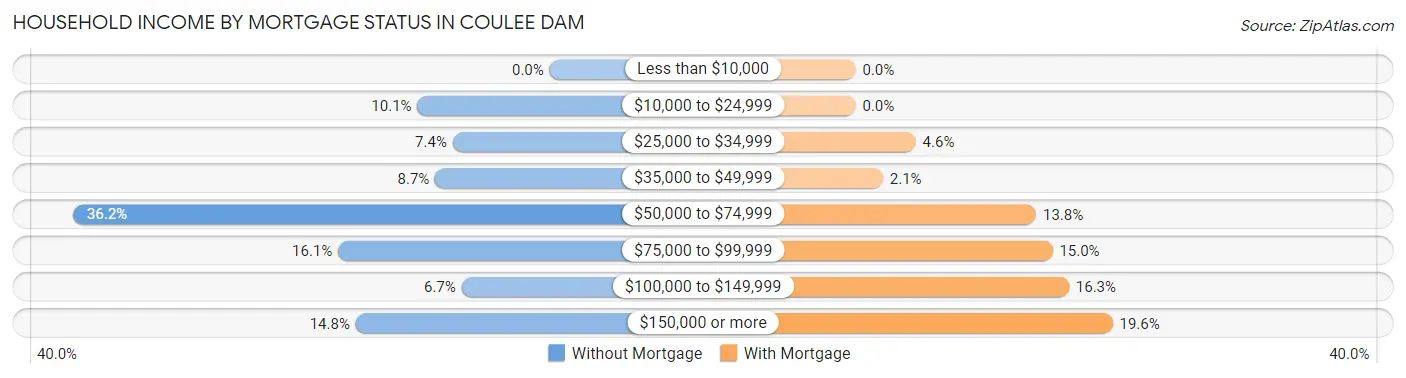
| Household Income | Without Mortgage | With Mortgage |
| Less than $10,000 | 0 (0.0%) | 0 (0.0%) |
| $10,000 to $24,999 | 15 (10.1%) | 0 (0.0%) |
| $25,000 to $34,999 | 11 (7.4%) | 11 (4.6%) |
| $35,000 to $49,999 | 13 (8.7%) | 5 (2.1%) |
| $50,000 to $74,999 | 54 (36.2%) | 33 (13.8%) |
| $75,000 to $99,999 | 24 (16.1%) | 36 (15.0%) |
| $100,000 to $149,999 | 10 (6.7%) | 39 (16.3%) |
| $150,000 or more | 22 (14.8%) | 47 (19.6%) |
| Total | 149 (100.0%) | 240 (100.0%) |
Property Value to Household Income Ratio in Coulee Dam
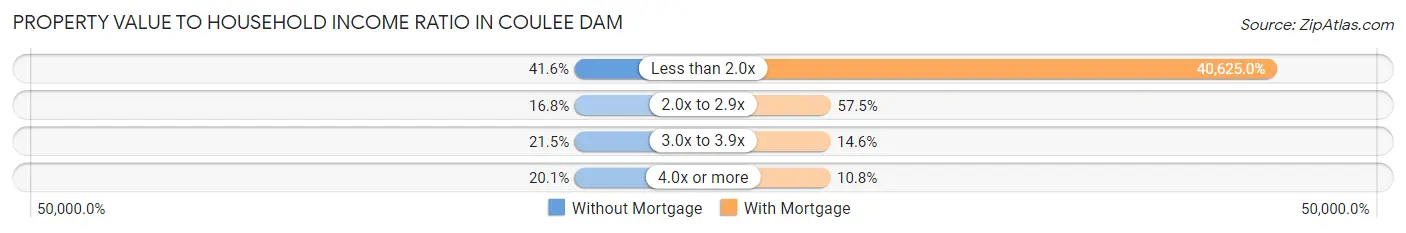
| Value-to-Income Ratio | Without Mortgage | With Mortgage |
| Less than 2.0x | 62 (41.6%) | 97,500 (40,625.0%) |
| 2.0x to 2.9x | 25 (16.8%) | 138 (57.5%) |
| 3.0x to 3.9x | 32 (21.5%) | 35 (14.6%) |
| 4.0x or more | 30 (20.1%) | 26 (10.8%) |
| Total | 149 (100.0%) | 240 (100.0%) |
Real Estate Taxes by Mortgage Status in Coulee Dam
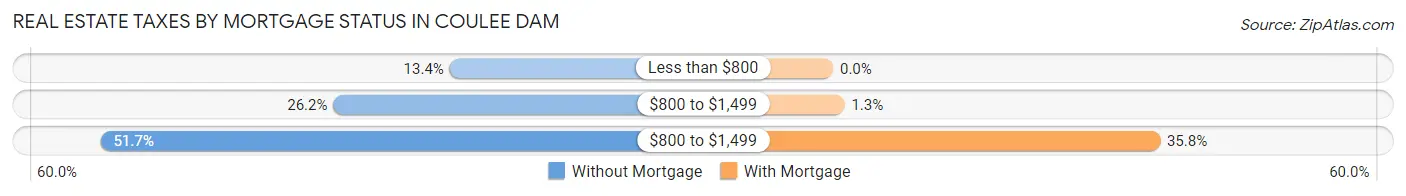
| Property Taxes | Without Mortgage | With Mortgage |
| Less than $800 | 20 (13.4%) | 0 (0.0%) |
| $800 to $1,499 | 39 (26.2%) | 3 (1.3%) |
| $800 to $1,499 | 77 (51.7%) | 86 (35.8%) |
| Total | 149 (100.0%) | 240 (100.0%) |
Health & Disability in Coulee Dam
Health Insurance Coverage by Age in Coulee Dam
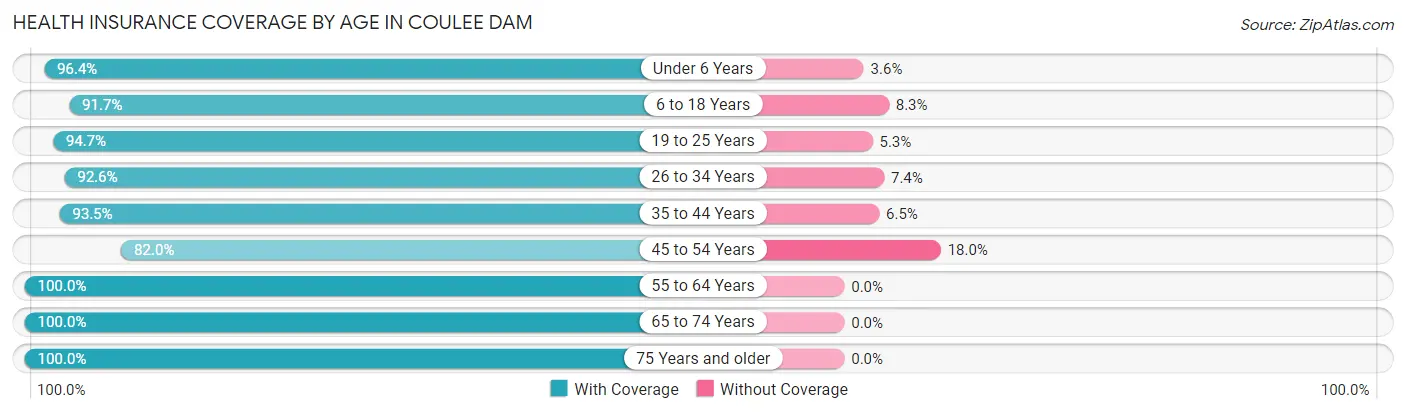
| Age Bracket | With Coverage | Without Coverage |
| Under 6 Years | 80 (96.4%) | 3 (3.6%) |
| 6 to 18 Years | 166 (91.7%) | 15 (8.3%) |
| 19 to 25 Years | 180 (94.7%) | 10 (5.3%) |
| 26 to 34 Years | 100 (92.6%) | 8 (7.4%) |
| 35 to 44 Years | 144 (93.5%) | 10 (6.5%) |
| 45 to 54 Years | 146 (82.0%) | 32 (18.0%) |
| 55 to 64 Years | 116 (100.0%) | 0 (0.0%) |
| 65 to 74 Years | 170 (100.0%) | 0 (0.0%) |
| 75 Years and older | 154 (100.0%) | 0 (0.0%) |
| Total | 1,256 (94.2%) | 78 (5.9%) |
Health Insurance Coverage by Citizenship Status in Coulee Dam
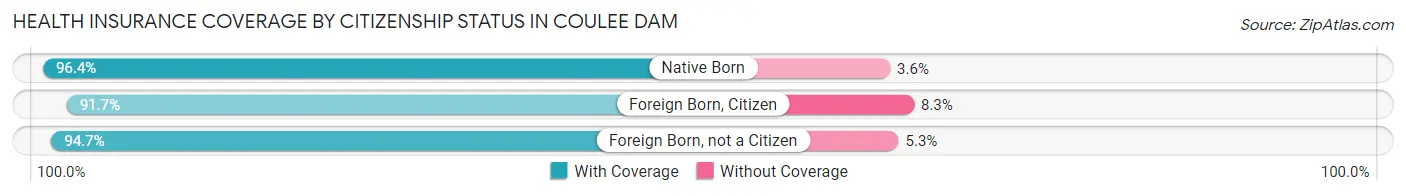
| Citizenship Status | With Coverage | Without Coverage |
| Native Born | 80 (96.4%) | 3 (3.6%) |
| Foreign Born, Citizen | 166 (91.7%) | 15 (8.3%) |
| Foreign Born, not a Citizen | 180 (94.7%) | 10 (5.3%) |
Health Insurance Coverage by Household Income in Coulee Dam
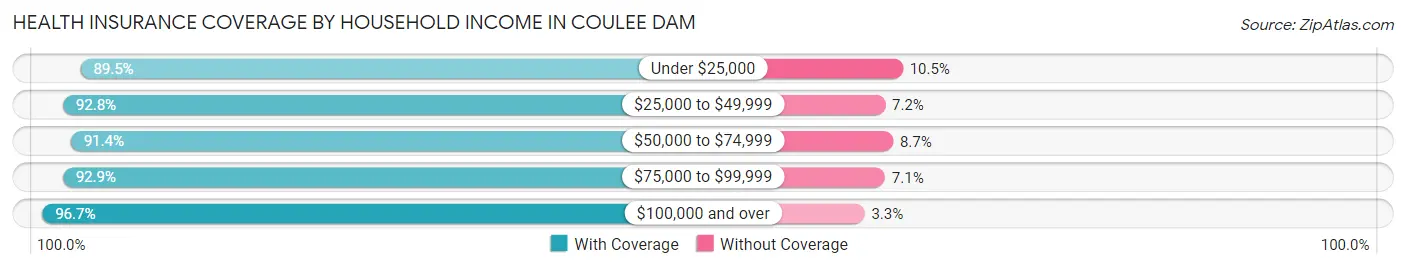
| Household Income | With Coverage | Without Coverage |
| Under $25,000 | 77 (89.5%) | 9 (10.5%) |
| $25,000 to $49,999 | 181 (92.8%) | 14 (7.2%) |
| $50,000 to $74,999 | 243 (91.3%) | 23 (8.6%) |
| $75,000 to $99,999 | 182 (92.9%) | 14 (7.1%) |
| $100,000 and over | 525 (96.7%) | 18 (3.3%) |
Public vs Private Health Insurance Coverage by Age in Coulee Dam
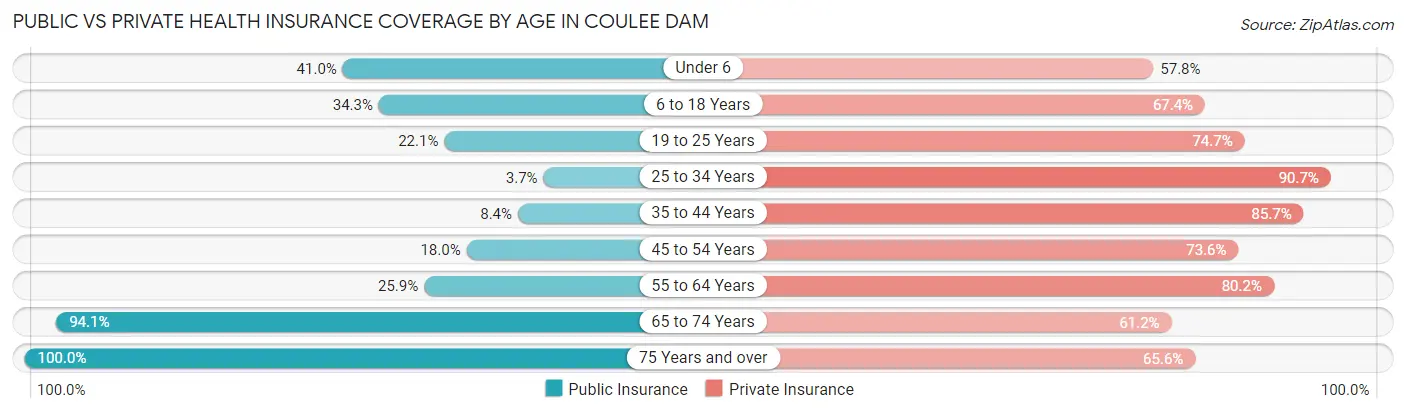
| Age Bracket | Public Insurance | Private Insurance |
| Under 6 | 34 (41.0%) | 48 (57.8%) |
| 6 to 18 Years | 62 (34.3%) | 122 (67.4%) |
| 19 to 25 Years | 42 (22.1%) | 142 (74.7%) |
| 25 to 34 Years | 4 (3.7%) | 98 (90.7%) |
| 35 to 44 Years | 13 (8.4%) | 132 (85.7%) |
| 45 to 54 Years | 32 (18.0%) | 131 (73.6%) |
| 55 to 64 Years | 30 (25.9%) | 93 (80.2%) |
| 65 to 74 Years | 160 (94.1%) | 104 (61.2%) |
| 75 Years and over | 154 (100.0%) | 101 (65.6%) |
| Total | 531 (39.8%) | 971 (72.8%) |
Disability Status by Sex by Age in Coulee Dam
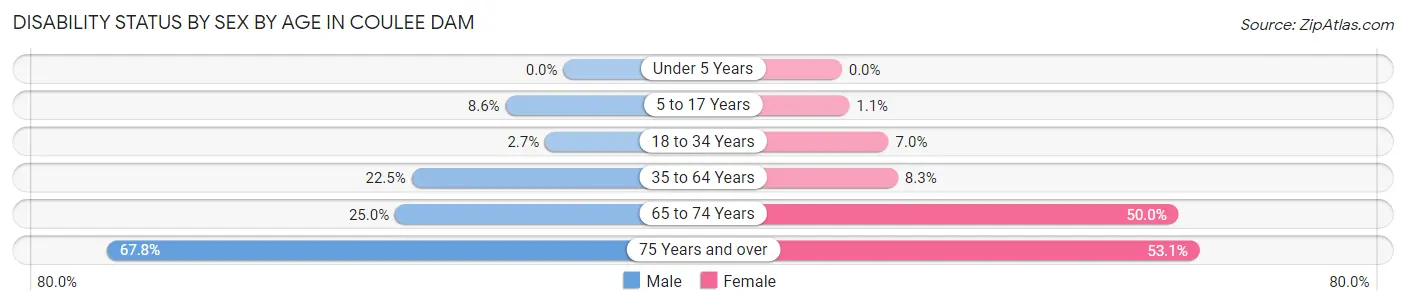
| Age Bracket | Male | Female |
| Under 5 Years | 0 (0.0%) | 0 (0.0%) |
| 5 to 17 Years | 8 (8.6%) | 1 (1.1%) |
| 18 to 34 Years | 4 (2.7%) | 11 (7.0%) |
| 35 to 64 Years | 55 (22.5%) | 17 (8.3%) |
| 65 to 74 Years | 15 (25.0%) | 55 (50.0%) |
| 75 Years and over | 61 (67.8%) | 34 (53.1%) |
Disability Class by Sex by Age in Coulee Dam
Disability Class: Hearing Difficulty
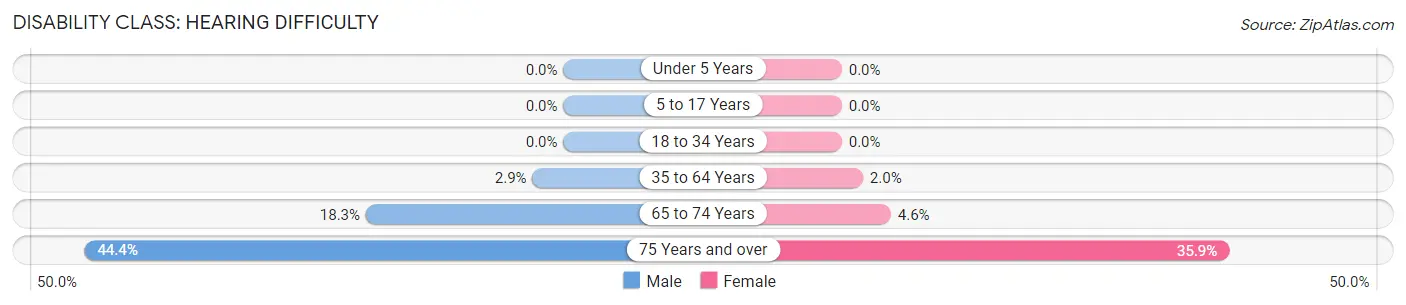
| Age Bracket | Male | Female |
| Under 5 Years | 0 (0.0%) | 0 (0.0%) |
| 5 to 17 Years | 0 (0.0%) | 0 (0.0%) |
| 18 to 34 Years | 0 (0.0%) | 0 (0.0%) |
| 35 to 64 Years | 7 (2.9%) | 4 (2.0%) |
| 65 to 74 Years | 11 (18.3%) | 5 (4.5%) |
| 75 Years and over | 40 (44.4%) | 23 (35.9%) |
Disability Class: Vision Difficulty
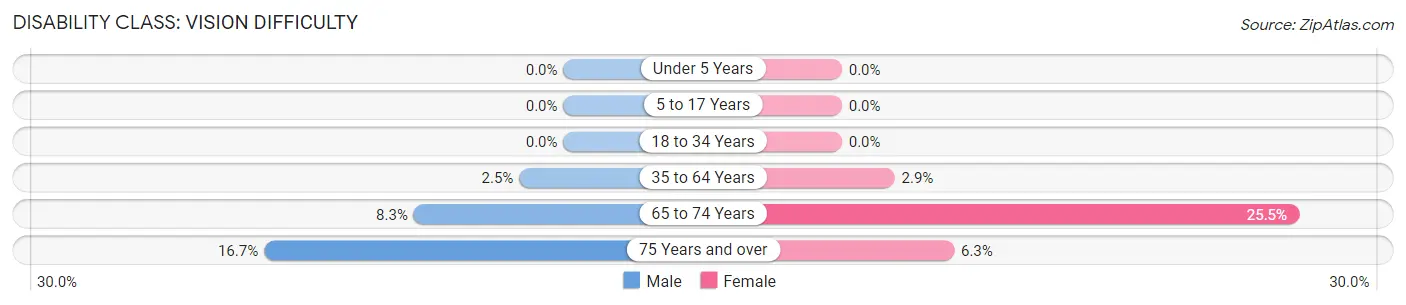
| Age Bracket | Male | Female |
| Under 5 Years | 0 (0.0%) | 0 (0.0%) |
| 5 to 17 Years | 0 (0.0%) | 0 (0.0%) |
| 18 to 34 Years | 0 (0.0%) | 0 (0.0%) |
| 35 to 64 Years | 6 (2.5%) | 6 (2.9%) |
| 65 to 74 Years | 5 (8.3%) | 28 (25.5%) |
| 75 Years and over | 15 (16.7%) | 4 (6.2%) |
Disability Class: Cognitive Difficulty
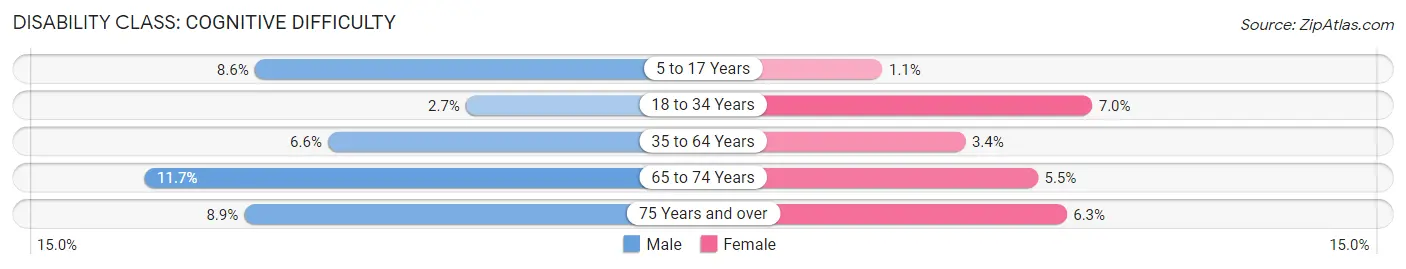
| Age Bracket | Male | Female |
| 5 to 17 Years | 8 (8.6%) | 1 (1.1%) |
| 18 to 34 Years | 4 (2.7%) | 11 (7.0%) |
| 35 to 64 Years | 16 (6.6%) | 7 (3.4%) |
| 65 to 74 Years | 7 (11.7%) | 6 (5.4%) |
| 75 Years and over | 8 (8.9%) | 4 (6.2%) |
Disability Class: Ambulatory Difficulty
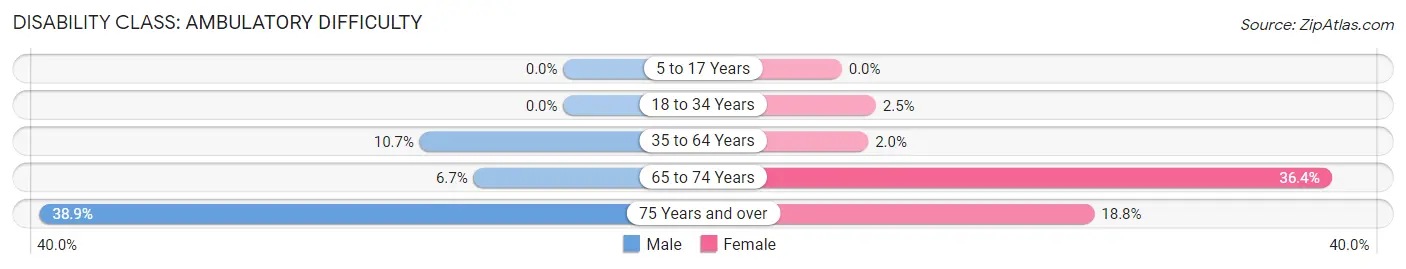
| Age Bracket | Male | Female |
| 5 to 17 Years | 0 (0.0%) | 0 (0.0%) |
| 18 to 34 Years | 0 (0.0%) | 4 (2.5%) |
| 35 to 64 Years | 26 (10.7%) | 4 (2.0%) |
| 65 to 74 Years | 4 (6.7%) | 40 (36.4%) |
| 75 Years and over | 35 (38.9%) | 12 (18.8%) |
Disability Class: Self-Care Difficulty
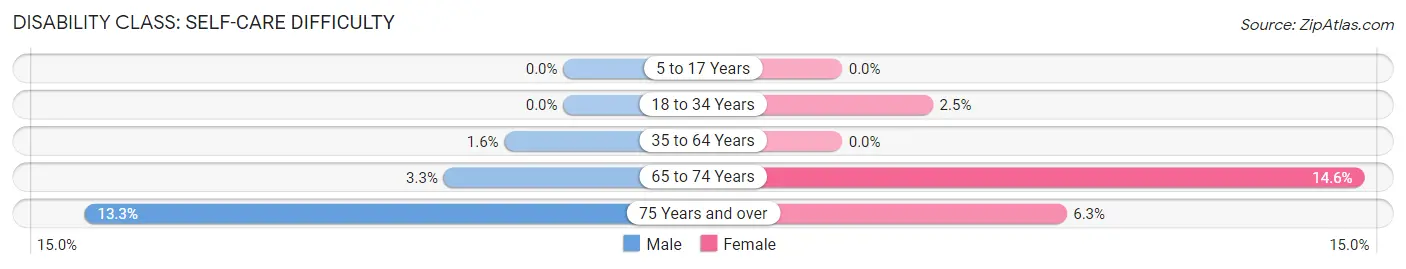
| Age Bracket | Male | Female |
| 5 to 17 Years | 0 (0.0%) | 0 (0.0%) |
| 18 to 34 Years | 0 (0.0%) | 4 (2.5%) |
| 35 to 64 Years | 4 (1.6%) | 0 (0.0%) |
| 65 to 74 Years | 2 (3.3%) | 16 (14.5%) |
| 75 Years and over | 12 (13.3%) | 4 (6.2%) |
Technology Access in Coulee Dam
Computing Device Access in Coulee Dam
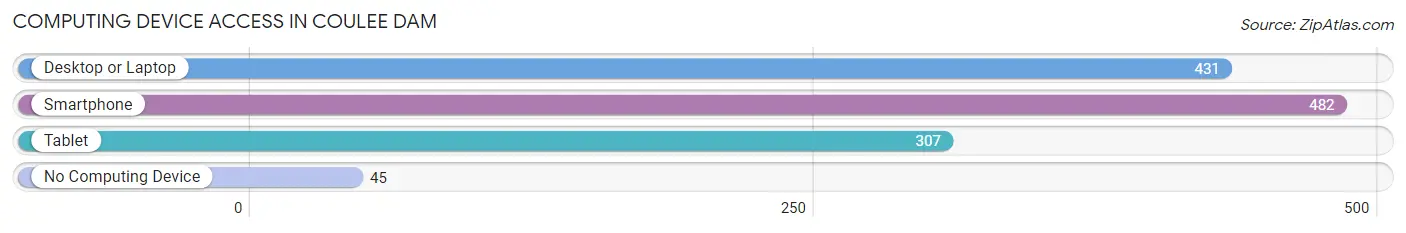
| Device Type | # Households | % Households |
| Desktop or Laptop | 431 | 73.9% |
| Smartphone | 482 | 82.7% |
| Tablet | 307 | 52.7% |
| No Computing Device | 45 | 7.7% |
| Total | 583 | 100.0% |
Internet Access in Coulee Dam
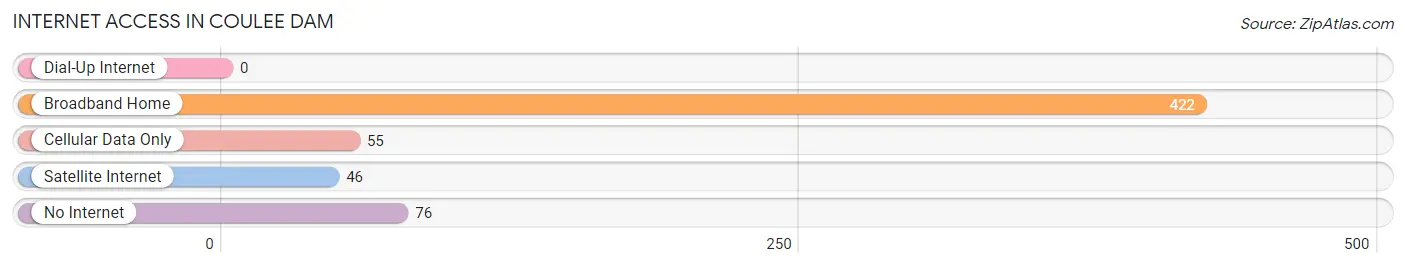
| Internet Type | # Households | % Households |
| Dial-Up Internet | 0 | 0.0% |
| Broadband Home | 422 | 72.4% |
| Cellular Data Only | 55 | 9.4% |
| Satellite Internet | 46 | 7.9% |
| No Internet | 76 | 13.0% |
| Total | 583 | 100.0% |
Coulee Dam Summary
Coulee Dam is a small town located in the state of Washington, United States. It is situated in the Columbia River Gorge, at the base of Grand Coulee Dam. The town is located in Okanogan County, and is part of the Omak Micropolitan Statistical Area. The population of Coulee Dam was 1,120 at the 2010 census.
History
The area around Coulee Dam has been inhabited by Native Americans for thousands of years. The first European settlers arrived in the area in the late 1800s, and the town was officially founded in 1909. The town was named after the Grand Coulee Dam, which was built in the 1930s. The dam was built to provide hydroelectric power to the region, and it also created the Lake Roosevelt reservoir.
The town of Coulee Dam was incorporated in 1951. The town was initially a small farming community, but it grew rapidly after the construction of the Grand Coulee Dam. The dam provided jobs and economic opportunities to the town, and it also attracted tourists to the area.
Geography
Coulee Dam is located at 47°59′N 118°59′W (47.983, -118.983). It is situated in the Columbia River Gorge, at the base of Grand Coulee Dam. The town is located in Okanogan County, and is part of the Omak Micropolitan Statistical Area.
The town has a total area of 0.9 square miles (2.3 km2), all of it land. The town is located in a semi-arid climate zone, with hot summers and cold winters. The average annual precipitation is 11.5 inches (292 mm).
Economy
The economy of Coulee Dam is largely based on tourism and the Grand Coulee Dam. The dam provides hydroelectric power to the region, and it also attracts tourists to the area. The town is home to several tourist attractions, including the Grand Coulee Dam Visitor Center, the Grand Coulee Dam Museum, and the Grand Coulee Dam National Recreation Area.
The town is also home to several businesses, including restaurants, hotels, and retail stores. The town is served by the Coulee Dam Airport, which provides general aviation services.
Demographics
As of the 2010 census, there were 1,120 people, 463 households, and 287 families residing in the town. The population density was 1,250.0 people per square mile (482.2/km2). There were 517 housing units at an average density of 572.2 per square mile (221.3/km2). The racial makeup of the town was 87.2% White, 0.2% African American, 5.2% Native American, 0.2% Asian, 0.1% Pacific Islander, 0.7% from other races, and 6.0% from two or more races. Hispanic or Latino of any race were 3.2% of the population.
There were 463 households, out of which 28.2% had children under the age of 18 living with them, 44.2% were married couples living together, 12.2% had a female householder with no husband present, and 37.2% were non-families. 32.2% of all households were made up of individuals, and 14.2% had someone living alone who was 65 years of age or older. The average household size was 2.41 and the average family size was 3.04.
In the town, the population was spread out, with 25.7% under the age of 18, 8.2% from 18 to 24, 24.2% from 25 to 44, 25.2% from 45 to 64, and 16.7% who were 65 years of age or older. The median age was 38 years. For every 100 females, there were 97.2 males. For every 100 females age 18 and over, there were 94.2 males.
The median income for a household in the town was $27,500, and the median income for a family was $31,250. Males had a median income of $30,000 versus $20,000 for females. The per capita income for the town was $14,845. About 15.2% of families and 19.2% of the population were below the poverty line, including 25.2% of those under age 18 and 10.2% of those age 65 or over.
Common Questions
What is Per Capita Income in Coulee Dam?
Per Capita income in Coulee Dam is $41,629.
What is the Median Family Income in Coulee Dam?
Median Family Income in Coulee Dam is $82,039.
What is the Median Household income in Coulee Dam?
Median Household Income in Coulee Dam is $65,313.
What is Income or Wage Gap in Coulee Dam?
Income or Wage Gap in Coulee Dam is 19.6%.
Women in Coulee Dam earn 80.4 cents for every dollar earned by a man.
What is Inequality or Gini Index in Coulee Dam?
Inequality or Gini Index in Coulee Dam is 0.38.
What is the Total Population of Coulee Dam?
Total Population of Coulee Dam is 1,334.
What is the Total Male Population of Coulee Dam?
Total Male Population of Coulee Dam is 681.
What is the Total Female Population of Coulee Dam?
Total Female Population of Coulee Dam is 653.
What is the Ratio of Males per 100 Females in Coulee Dam?
There are 104.29 Males per 100 Females in Coulee Dam.
What is the Ratio of Females per 100 Males in Coulee Dam?
There are 95.89 Females per 100 Males in Coulee Dam.
What is the Median Population Age in Coulee Dam?
Median Population Age in Coulee Dam is 43.2 Years.
What is the Average Family Size in Coulee Dam
Average Family Size in Coulee Dam is 3.0 People.
What is the Average Household Size in Coulee Dam
Average Household Size in Coulee Dam is 2.2 People.
How Large is the Labor Force in Coulee Dam?
There are 632 People in the Labor Forcein in Coulee Dam.
What is the Percentage of People in the Labor Force in Coulee Dam?
57.0% of People are in the Labor Force in Coulee Dam.
What is the Unemployment Rate in Coulee Dam?
Unemployment Rate in Coulee Dam is 6.0%.