College Place, WA Map & Demographics
College Place Map
College Place Overview
$31,101
PER CAPITA INCOME
$79,884
AVG FAMILY INCOME
$60,417
AVG HOUSEHOLD INCOME
45.7%
WAGE / INCOME GAP [ % ]
54.3¢/ $1
WAGE / INCOME GAP [ $ ]
$9,097
FAMILY INCOME DEFICIT
0.45
INEQUALITY / GINI INDEX
9,796
TOTAL POPULATION
4,546
MALE POPULATION
5,250
FEMALE POPULATION
86.59
MALES / 100 FEMALES
115.49
FEMALES / 100 MALES
32.2
MEDIAN AGE
3.2
AVG FAMILY SIZE
2.6
AVG HOUSEHOLD SIZE
4,666
LABOR FORCE [ PEOPLE ]
58.9%
PERCENT IN LABOR FORCE
5.6%
UNEMPLOYMENT RATE
College Place Zip Codes
College Place Area Codes
Income in College Place
Income Overview in College Place
Per Capita Income in College Place is $31,101, while median incomes of families and households are $79,884 and $60,417 respectively.
| Characteristic | Number | Measure |
| Per Capita Income | 9,796 | $31,101 |
| Median Family Income | 2,120 | $79,884 |
| Mean Family Income | 2,120 | $99,755 |
| Median Household Income | 3,347 | $60,417 |
| Mean Household Income | 3,347 | $84,064 |
| Income Deficit | 2,120 | $9,097 |
| Wage / Income Gap (%) | 9,796 | 45.67% |
| Wage / Income Gap ($) | 9,796 | 54.33¢ per $1 |
| Gini / Inequality Index | 9,796 | 0.45 |
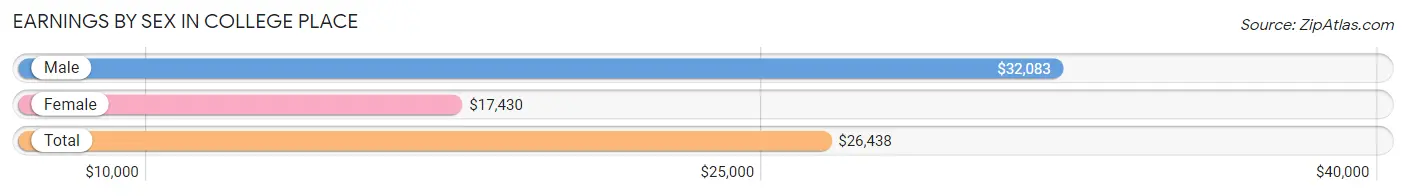
Earnings by Sex in College Place
Average Earnings in College Place are $26,438, $32,083 for men and $17,430 for women, a difference of 45.7%.
| Sex | Number | Average Earnings |
| Male | 2,600 (51.1%) | $32,083 |
| Female | 2,490 (48.9%) | $17,430 |
| Total | 5,090 (100.0%) | $26,438 |
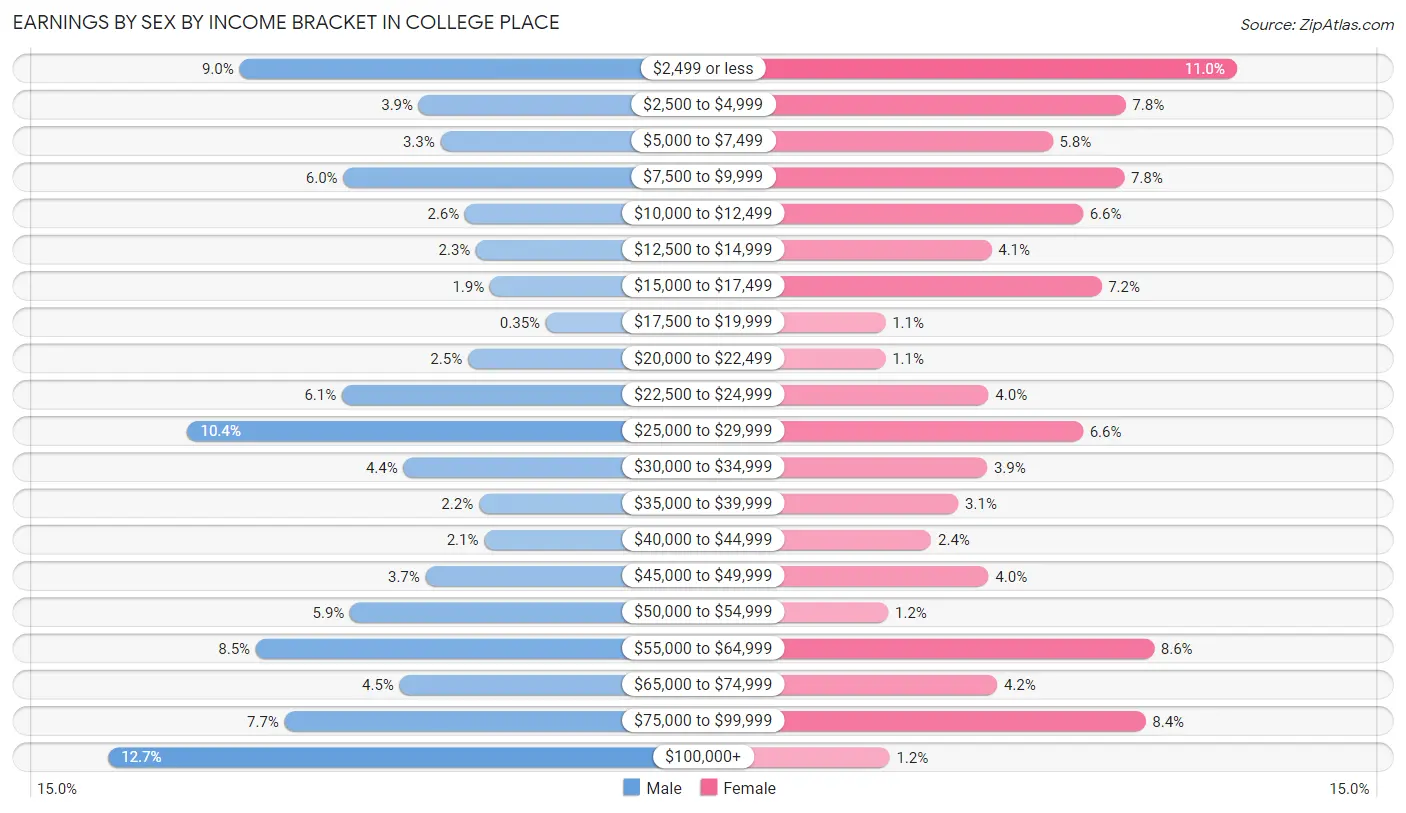
Earnings by Sex by Income Bracket in College Place
The most common earnings brackets in College Place are $100,000+ for men (329 | 12.7%) and $2,499 or less for women (273 | 11.0%).
| Income | Male | Female |
| $2,499 or less | 233 (9.0%) | 273 (11.0%) |
| $2,500 to $4,999 | 102 (3.9%) | 195 (7.8%) |
| $5,000 to $7,499 | 86 (3.3%) | 144 (5.8%) |
| $7,500 to $9,999 | 157 (6.0%) | 194 (7.8%) |
| $10,000 to $12,499 | 68 (2.6%) | 165 (6.6%) |
| $12,500 to $14,999 | 60 (2.3%) | 101 (4.1%) |
| $15,000 to $17,499 | 50 (1.9%) | 178 (7.1%) |
| $17,500 to $19,999 | 9 (0.4%) | 27 (1.1%) |
| $20,000 to $22,499 | 66 (2.5%) | 27 (1.1%) |
| $22,500 to $24,999 | 158 (6.1%) | 99 (4.0%) |
| $25,000 to $29,999 | 271 (10.4%) | 165 (6.6%) |
| $30,000 to $34,999 | 113 (4.3%) | 98 (3.9%) |
| $35,000 to $39,999 | 58 (2.2%) | 78 (3.1%) |
| $40,000 to $44,999 | 54 (2.1%) | 59 (2.4%) |
| $45,000 to $49,999 | 97 (3.7%) | 99 (4.0%) |
| $50,000 to $54,999 | 152 (5.9%) | 29 (1.2%) |
| $55,000 to $64,999 | 221 (8.5%) | 215 (8.6%) |
| $65,000 to $74,999 | 116 (4.5%) | 105 (4.2%) |
| $75,000 to $99,999 | 200 (7.7%) | 209 (8.4%) |
| $100,000+ | 329 (12.7%) | 30 (1.2%) |
| Total | 2,600 (100.0%) | 2,490 (100.0%) |
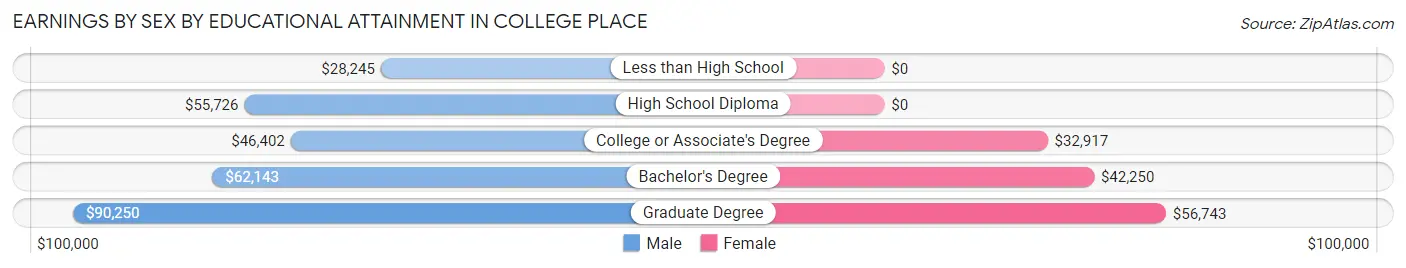
Earnings by Sex by Educational Attainment in College Place
Average earnings in College Place are $51,903 for men and $38,477 for women, a difference of 25.9%. Men with an educational attainment of graduate degree enjoy the highest average annual earnings of $90,250, while those with less than high school education earn the least with $28,245. Women with an educational attainment of graduate degree earn the most with the average annual earnings of $56,743, while those with college or associate's degree education have the smallest earnings of $32,917.
| Educational Attainment | Male Income | Female Income |
| Less than High School | $28,245 | $0 |
| High School Diploma | $55,726 | $0 |
| College or Associate's Degree | $46,402 | $32,917 |
| Bachelor's Degree | $62,143 | $42,250 |
| Graduate Degree | $90,250 | $56,743 |
| Total | $51,903 | $38,477 |
Family Income in College Place
Family Income Brackets in College Place
According to the College Place family income data, there are 454 families falling into the $100,000 to $149,999 income range, which is the most common income bracket and makes up 21.4% of all families. Conversely, the $10,000 to $14,999 income bracket is the least frequent group with only 32 families (1.5%) belonging to this category.
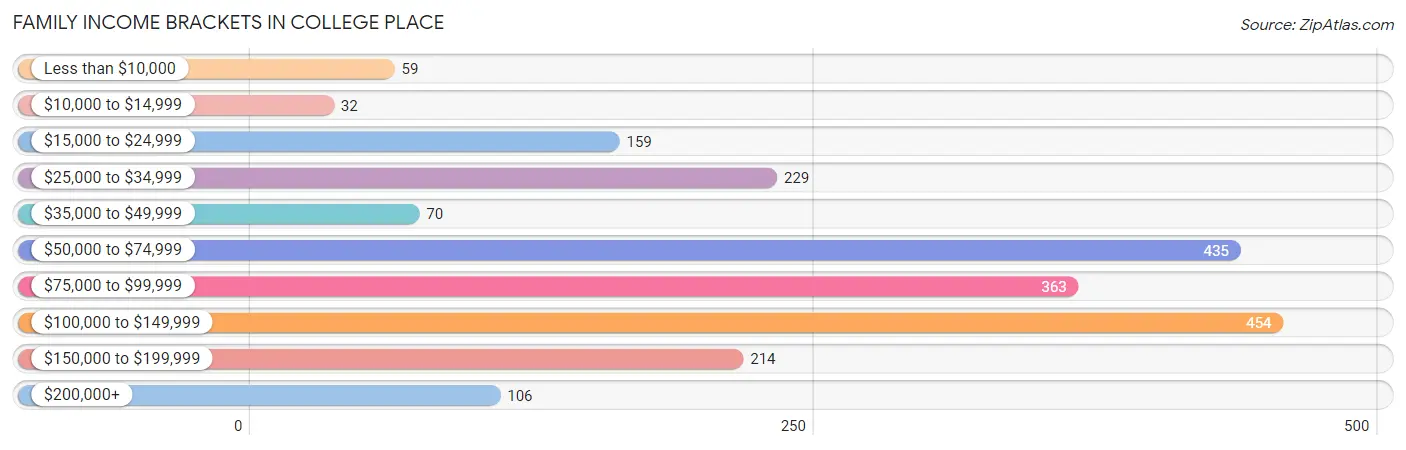
| Income Bracket | # Families | % Families |
| Less than $10,000 | 59 | 2.8% |
| $10,000 to $14,999 | 32 | 1.5% |
| $15,000 to $24,999 | 159 | 7.5% |
| $25,000 to $34,999 | 229 | 10.8% |
| $35,000 to $49,999 | 70 | 3.3% |
| $50,000 to $74,999 | 435 | 20.5% |
| $75,000 to $99,999 | 363 | 17.1% |
| $100,000 to $149,999 | 454 | 21.4% |
| $150,000 to $199,999 | 214 | 10.1% |
| $200,000+ | 106 | 5.0% |
Family Income by Famaliy Size in College Place
4-person families (292 | 13.8%) account for the highest median family income in College Place with $143,534 per family, while 4-person families (292 | 13.8%) have the highest median income of $35,884 per family member.
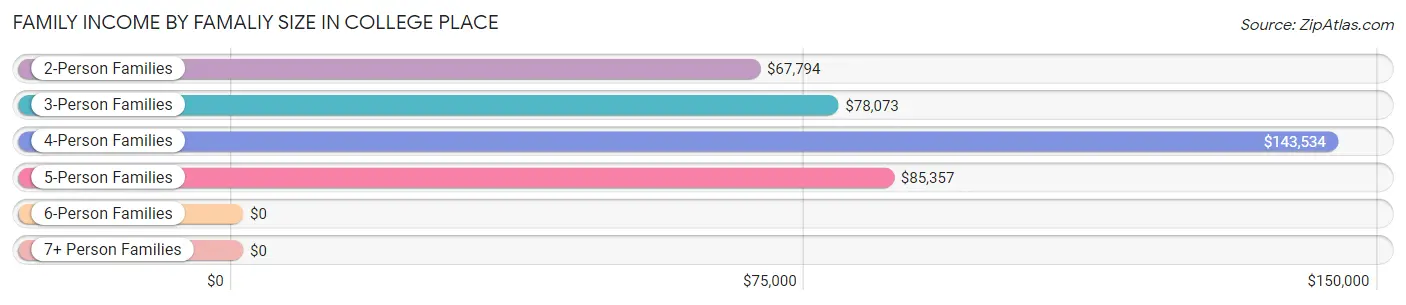
| Income Bracket | # Families | Median Income |
| 2-Person Families | 946 (44.6%) | $67,794 |
| 3-Person Families | 545 (25.7%) | $78,073 |
| 4-Person Families | 292 (13.8%) | $143,534 |
| 5-Person Families | 236 (11.1%) | $85,357 |
| 6-Person Families | 67 (3.2%) | $0 |
| 7+ Person Families | 34 (1.6%) | $0 |
| Total | 2,120 (100.0%) | $79,884 |
Family Income by Number of Earners in College Place
The median family income in College Place is $79,884, with families comprising 3+ earners (231) having the highest median family income of $152,250, while families with no earners (491) have the lowest median family income of $51,826, accounting for 10.9% and 23.2% of families, respectively.
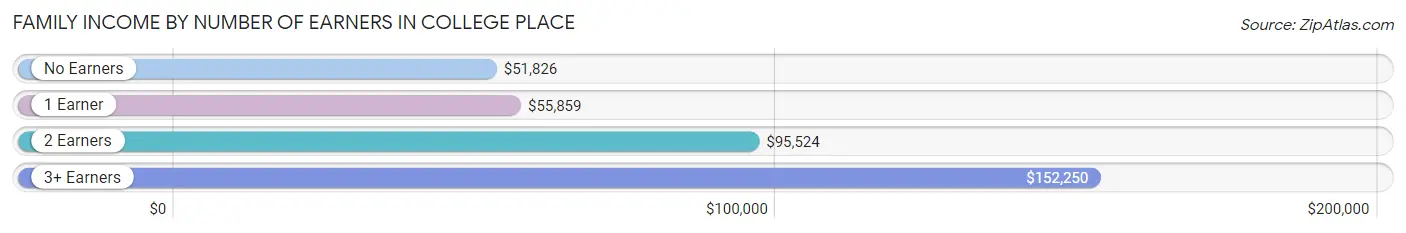
| Number of Earners | # Families | Median Income |
| No Earners | 491 (23.2%) | $51,826 |
| 1 Earner | 554 (26.1%) | $55,859 |
| 2 Earners | 844 (39.8%) | $95,524 |
| 3+ Earners | 231 (10.9%) | $152,250 |
| Total | 2,120 (100.0%) | $79,884 |
Household Income in College Place
Household Income Brackets in College Place
With 653 households falling in the category, the $50,000 to $74,999 income range is the most frequent in College Place, accounting for 19.5% of all households. In contrast, only 87 households (2.6%) fall into the less than $10,000 income bracket, making it the least populous group.
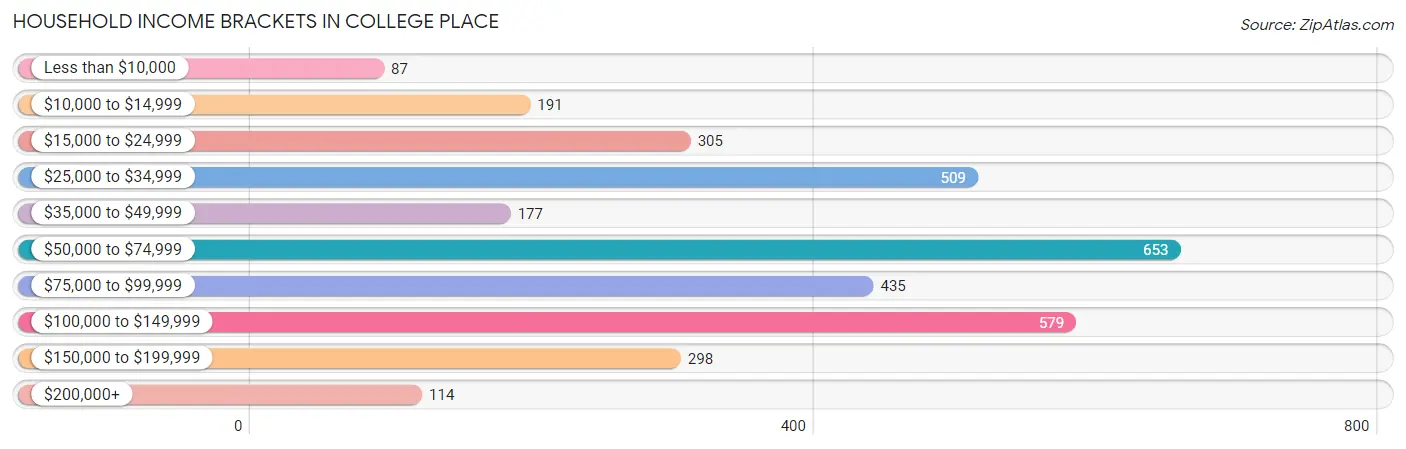
| Income Bracket | # Households | % Households |
| Less than $10,000 | 87 | 2.6% |
| $10,000 to $14,999 | 191 | 5.7% |
| $15,000 to $24,999 | 305 | 9.1% |
| $25,000 to $34,999 | 509 | 15.2% |
| $35,000 to $49,999 | 177 | 5.3% |
| $50,000 to $74,999 | 653 | 19.5% |
| $75,000 to $99,999 | 435 | 13.0% |
| $100,000 to $149,999 | 579 | 17.3% |
| $150,000 to $199,999 | 298 | 8.9% |
| $200,000+ | 114 | 3.4% |
Household Income by Householder Age in College Place
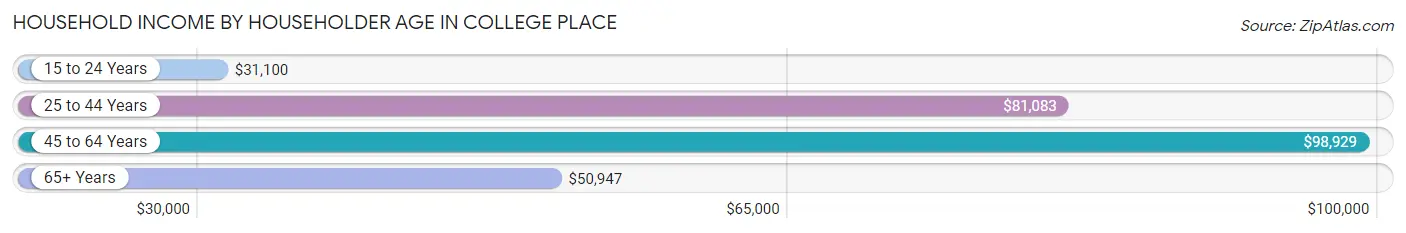
The median household income in College Place is $60,417, with the highest median household income of $98,929 found in the 45 to 64 years age bracket for the primary householder. A total of 740 households (22.1%) fall into this category. Meanwhile, the 15 to 24 years age bracket for the primary householder has the lowest median household income of $31,100, with 306 households (9.1%) in this group.
| Income Bracket | # Households | Median Income |
| 15 to 24 Years | 306 (9.1%) | $31,100 |
| 25 to 44 Years | 1,151 (34.4%) | $81,083 |
| 45 to 64 Years | 740 (22.1%) | $98,929 |
| 65+ Years | 1,150 (34.4%) | $50,947 |
| Total | 3,347 (100.0%) | $60,417 |
Poverty in College Place
Income Below Poverty by Sex and Age in College Place
With 8.4% poverty level for males and 14.7% for females among the residents of College Place, 15 year old males and 16 and 17 year old females are the most vulnerable to poverty, with 25 males (100.0%) and 62 females (38.8%) in their respective age groups living below the poverty level.
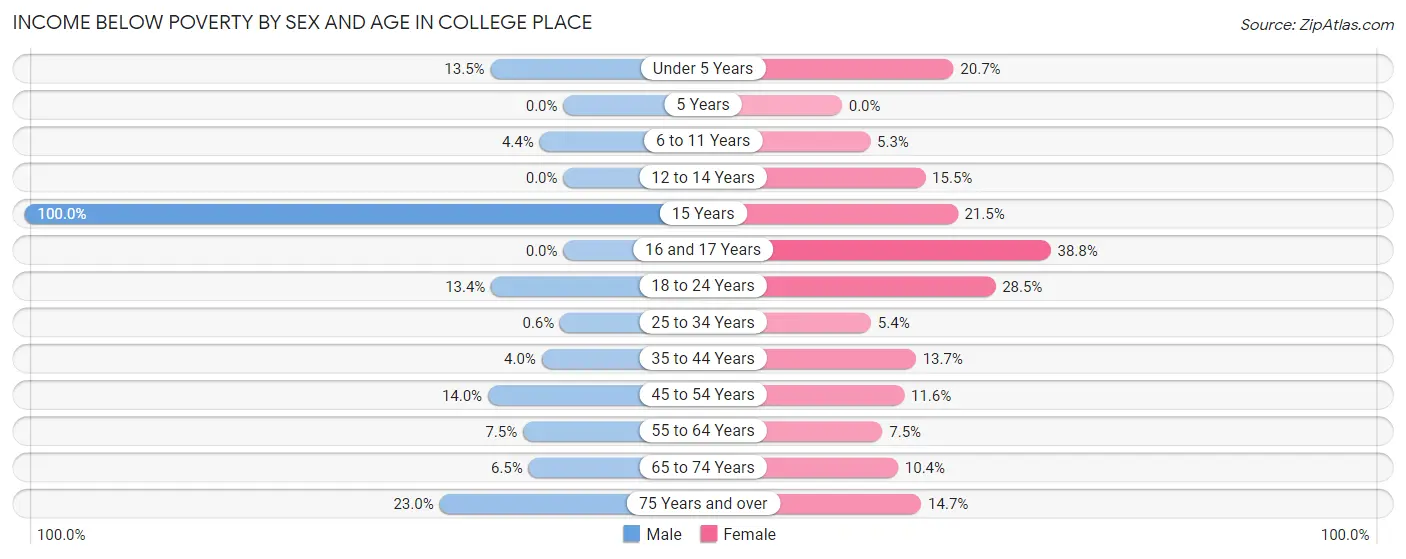
| Age Bracket | Male | Female |
| Under 5 Years | 31 (13.5%) | 81 (20.7%) |
| 5 Years | 0 (0.0%) | 0 (0.0%) |
| 6 to 11 Years | 10 (4.4%) | 20 (5.3%) |
| 12 to 14 Years | 0 (0.0%) | 28 (15.5%) |
| 15 Years | 25 (100.0%) | 35 (21.5%) |
| 16 and 17 Years | 0 (0.0%) | 62 (38.8%) |
| 18 to 24 Years | 64 (13.4%) | 162 (28.5%) |
| 25 to 34 Years | 4 (0.6%) | 23 (5.4%) |
| 35 to 44 Years | 22 (4.0%) | 83 (13.7%) |
| 45 to 54 Years | 49 (14.0%) | 38 (11.6%) |
| 55 to 64 Years | 27 (7.5%) | 35 (7.5%) |
| 65 to 74 Years | 34 (6.5%) | 63 (10.4%) |
| 75 Years and over | 77 (23.0%) | 52 (14.7%) |
| Total | 343 (8.4%) | 682 (14.7%) |
Income Above Poverty by Sex and Age in College Place
According to the poverty statistics in College Place, males aged 5 years and females aged 5 years are the age groups that are most secure financially, with 100.0% of males and 100.0% of females in these age groups living above the poverty line.
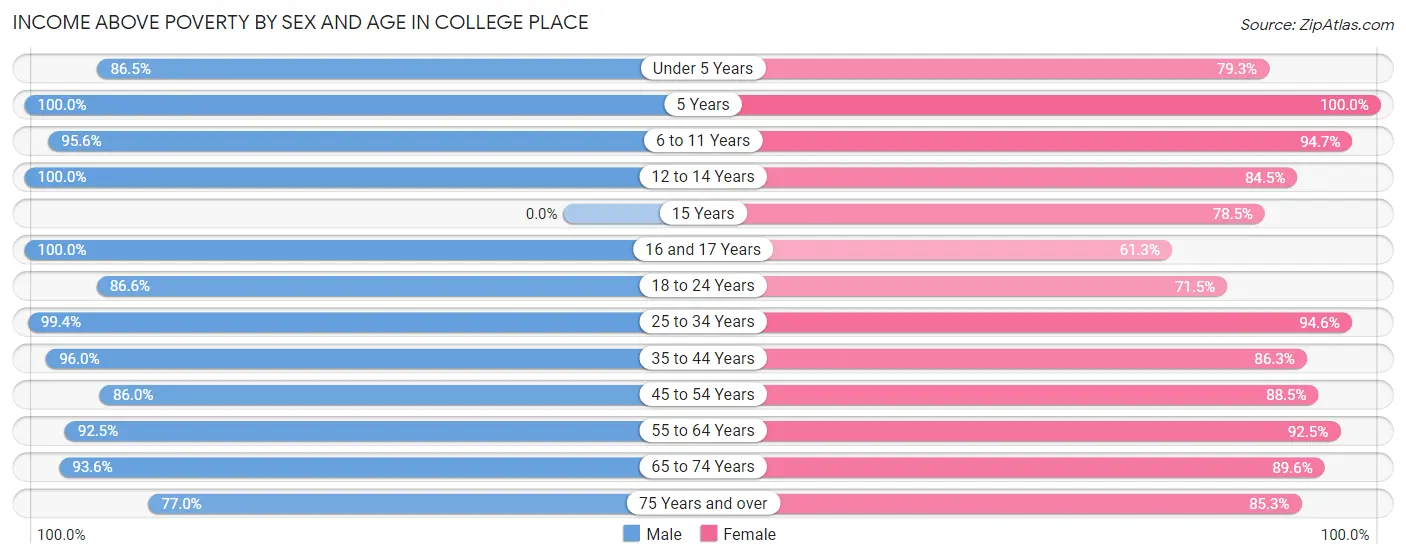
| Age Bracket | Male | Female |
| Under 5 Years | 198 (86.5%) | 310 (79.3%) |
| 5 Years | 84 (100.0%) | 13 (100.0%) |
| 6 to 11 Years | 216 (95.6%) | 360 (94.7%) |
| 12 to 14 Years | 154 (100.0%) | 153 (84.5%) |
| 15 Years | 0 (0.0%) | 128 (78.5%) |
| 16 and 17 Years | 111 (100.0%) | 98 (61.3%) |
| 18 to 24 Years | 414 (86.6%) | 407 (71.5%) |
| 25 to 34 Years | 658 (99.4%) | 403 (94.6%) |
| 35 to 44 Years | 525 (96.0%) | 522 (86.3%) |
| 45 to 54 Years | 301 (86.0%) | 291 (88.4%) |
| 55 to 64 Years | 334 (92.5%) | 430 (92.5%) |
| 65 to 74 Years | 493 (93.5%) | 542 (89.6%) |
| 75 Years and over | 258 (77.0%) | 301 (85.3%) |
| Total | 3,746 (91.6%) | 3,958 (85.3%) |
Income Below Poverty Among Married-Couple Families in College Place
The poverty statistics for married-couple families in College Place show that 3.8% or 65 of the total 1,693 families live below the poverty line. Families with 1 or 2 children have the highest poverty rate of 4.4%, comprising of 26 families. On the other hand, families with 3 or 4 children have the lowest poverty rate of 0.0%, which includes 0 families.
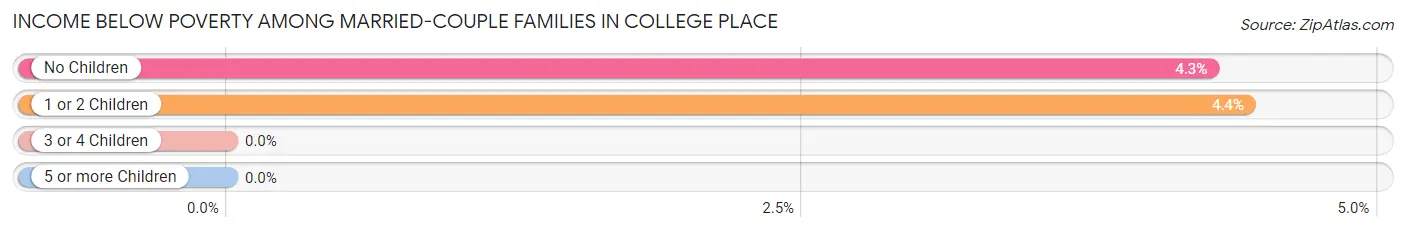
| Children | Above Poverty | Below Poverty |
| No Children | 875 (95.7%) | 39 (4.3%) |
| 1 or 2 Children | 561 (95.6%) | 26 (4.4%) |
| 3 or 4 Children | 166 (100.0%) | 0 (0.0%) |
| 5 or more Children | 26 (100.0%) | 0 (0.0%) |
| Total | 1,628 (96.2%) | 65 (3.8%) |
Income Below Poverty Among Single-Parent Households in College Place
According to the poverty data in College Place, 39.8% or 45 single-father households and 36.9% or 116 single-mother households are living below the poverty line. Among single-father households, those with 3 or 4 children have the highest poverty rate, with 21 households (100.0%) experiencing poverty. Likewise, among single-mother households, those with 5 or more children have the highest poverty rate, with 9 households (100.0%) falling below the poverty line.
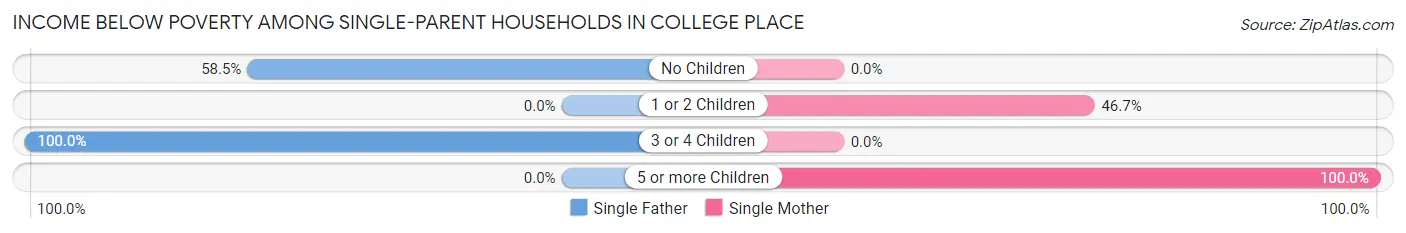
| Children | Single Father | Single Mother |
| No Children | 24 (58.5%) | 0 (0.0%) |
| 1 or 2 Children | 0 (0.0%) | 107 (46.7%) |
| 3 or 4 Children | 21 (100.0%) | 0 (0.0%) |
| 5 or more Children | 0 (0.0%) | 9 (100.0%) |
| Total | 45 (39.8%) | 116 (36.9%) |
Income Below Poverty Among Married-Couple vs Single-Parent Households in College Place
The poverty data for College Place shows that 65 of the married-couple family households (3.8%) and 161 of the single-parent households (37.7%) are living below the poverty level. Within the married-couple family households, those with 1 or 2 children have the highest poverty rate, with 26 households (4.4%) falling below the poverty line. Among the single-parent households, those with 3 or 4 children have the highest poverty rate, with 21 household (100.0%) living below poverty.
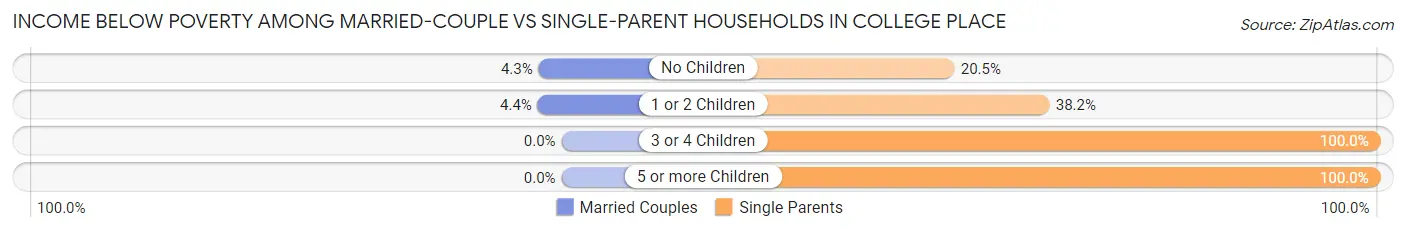
| Children | Married-Couple Families | Single-Parent Households |
| No Children | 39 (4.3%) | 24 (20.5%) |
| 1 or 2 Children | 26 (4.4%) | 107 (38.2%) |
| 3 or 4 Children | 0 (0.0%) | 21 (100.0%) |
| 5 or more Children | 0 (0.0%) | 9 (100.0%) |
| Total | 65 (3.8%) | 161 (37.7%) |
Race in College Place
The most populous races in College Place are White / Caucasian (7,977 | 81.4%), Hispanic or Latino (1,776 | 18.1%), and Two or more Races (761 | 7.8%).
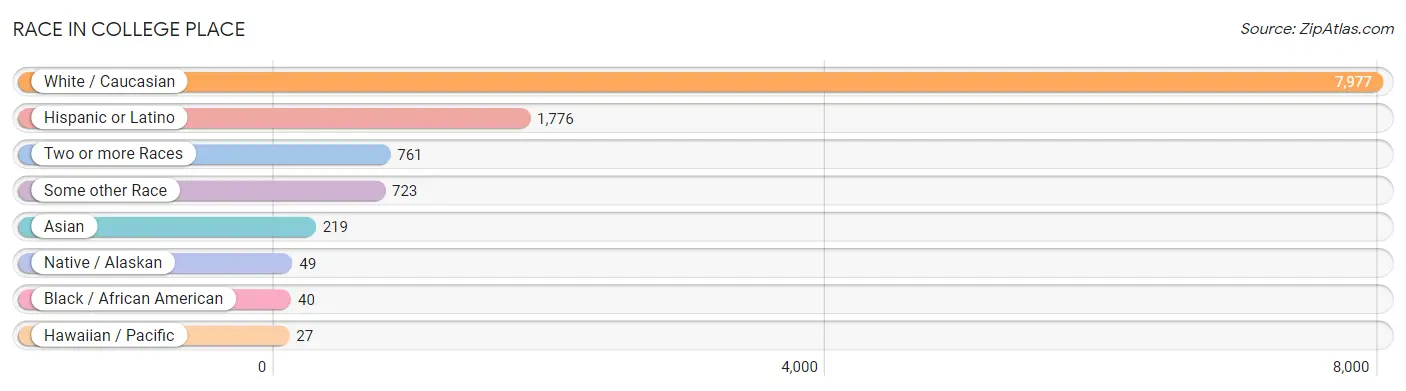
| Race | # Population | % Population |
| Asian | 219 | 2.2% |
| Black / African American | 40 | 0.4% |
| Hawaiian / Pacific | 27 | 0.3% |
| Hispanic or Latino | 1,776 | 18.1% |
| Native / Alaskan | 49 | 0.5% |
| White / Caucasian | 7,977 | 81.4% |
| Two or more Races | 761 | 7.8% |
| Some other Race | 723 | 7.4% |
| Total | 9,796 | 100.0% |
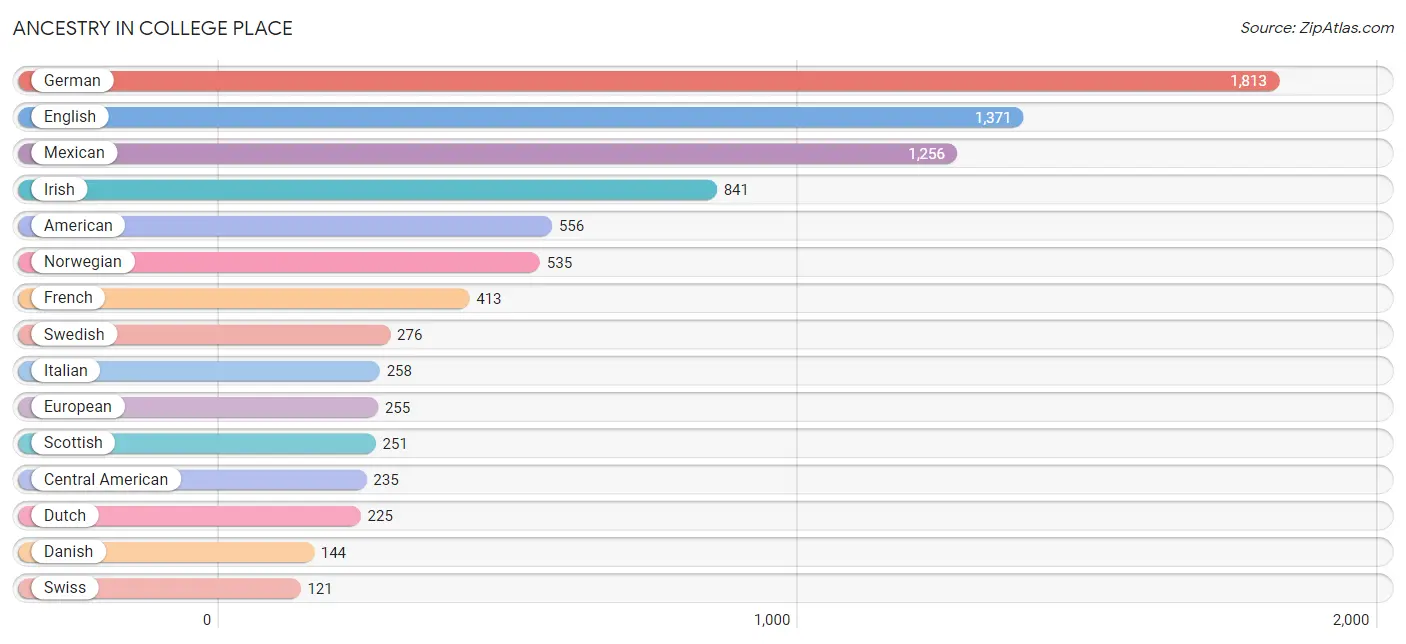
Ancestry in College Place
The most populous ancestries reported in College Place are German (1,813 | 18.5%), English (1,371 | 14.0%), Mexican (1,256 | 12.8%), Irish (841 | 8.6%), and American (556 | 5.7%), together accounting for 59.6% of all College Place residents.
| Ancestry | # Population | % Population |
| Alaska Native | 11 | 0.1% |
| American | 556 | 5.7% |
| Apache | 4 | 0.0% |
| Arab | 29 | 0.3% |
| Armenian | 12 | 0.1% |
| Australian | 23 | 0.2% |
| Austrian | 23 | 0.2% |
| Bhutanese | 63 | 0.6% |
| Blackfeet | 18 | 0.2% |
| British | 100 | 1.0% |
| Bulgarian | 14 | 0.1% |
| Burmese | 26 | 0.3% |
| Canadian | 30 | 0.3% |
| Central American | 235 | 2.4% |
| Central American Indian | 26 | 0.3% |
| Cherokee | 58 | 0.6% |
| Choctaw | 4 | 0.0% |
| Colombian | 13 | 0.1% |
| Costa Rican | 116 | 1.2% |
| Croatian | 5 | 0.1% |
| Cuban | 29 | 0.3% |
| Czechoslovakian | 22 | 0.2% |
| Danish | 144 | 1.5% |
| Dominican | 28 | 0.3% |
| Dutch | 225 | 2.3% |
| Egyptian | 25 | 0.3% |
| English | 1,371 | 14.0% |
| European | 255 | 2.6% |
| Finnish | 15 | 0.2% |
| French | 413 | 4.2% |
| French Canadian | 26 | 0.3% |
| German | 1,813 | 18.5% |
| Greek | 3 | 0.0% |
| Guamanian / Chamorro | 33 | 0.3% |
| Guatemalan | 23 | 0.2% |
| Honduran | 44 | 0.4% |
| Hungarian | 19 | 0.2% |
| Indian (Asian) | 50 | 0.5% |
| Inupiat | 4 | 0.0% |
| Iranian | 4 | 0.0% |
| Irish | 841 | 8.6% |
| Israeli | 28 | 0.3% |
| Italian | 258 | 2.6% |
| Jamaican | 4 | 0.0% |
| Korean | 92 | 0.9% |
| Laotian | 11 | 0.1% |
| Mexican | 1,256 | 12.8% |
| Mexican American Indian | 13 | 0.1% |
| Native Hawaiian | 10 | 0.1% |
| Northern European | 73 | 0.7% |
| Norwegian | 535 | 5.5% |
| Pakistani | 8 | 0.1% |
| Pennsylvania German | 31 | 0.3% |
| Polish | 91 | 0.9% |
| Portuguese | 4 | 0.0% |
| Puerto Rican | 58 | 0.6% |
| Puget Sound Salish | 38 | 0.4% |
| Russian | 77 | 0.8% |
| Salvadoran | 52 | 0.5% |
| Scandinavian | 44 | 0.4% |
| Scotch-Irish | 44 | 0.4% |
| Scottish | 251 | 2.6% |
| Sioux | 23 | 0.2% |
| South American | 13 | 0.1% |
| Spaniard | 108 | 1.1% |
| Spanish | 40 | 0.4% |
| Sri Lankan | 65 | 0.7% |
| Swedish | 276 | 2.8% |
| Swiss | 121 | 1.2% |
| Thai | 39 | 0.4% |
| U.S. Virgin Islander | 58 | 0.6% |
| Ukrainian | 50 | 0.5% |
| Welsh | 12 | 0.1% | View All 73 Rows |
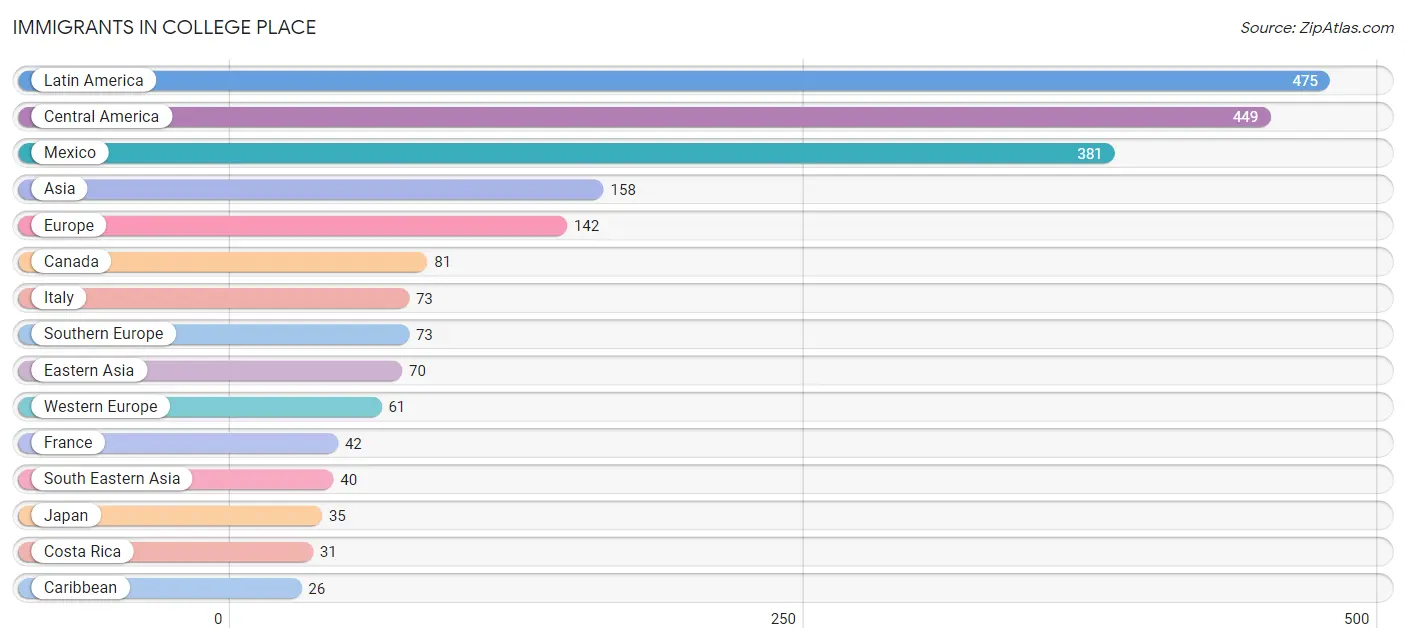
Immigrants in College Place
The most numerous immigrant groups reported in College Place came from Latin America (475 | 4.9%), Central America (449 | 4.6%), Mexico (381 | 3.9%), Asia (158 | 1.6%), and Europe (142 | 1.5%), together accounting for 16.4% of all College Place residents.
| Immigration Origin | # Population | % Population |
| Asia | 158 | 1.6% |
| Australia | 4 | 0.0% |
| Canada | 81 | 0.8% |
| Caribbean | 26 | 0.3% |
| Central America | 449 | 4.6% |
| China | 18 | 0.2% |
| Costa Rica | 31 | 0.3% |
| Dominican Republic | 26 | 0.3% |
| Eastern Asia | 70 | 0.7% |
| Eastern Europe | 8 | 0.1% |
| El Salvador | 20 | 0.2% |
| Europe | 142 | 1.5% |
| France | 42 | 0.4% |
| Honduras | 17 | 0.2% |
| Hong Kong | 5 | 0.1% |
| India | 14 | 0.1% |
| Indonesia | 9 | 0.1% |
| Israel | 11 | 0.1% |
| Italy | 73 | 0.7% |
| Japan | 35 | 0.4% |
| Korea | 17 | 0.2% |
| Latin America | 475 | 4.9% |
| Lebanon | 4 | 0.0% |
| Mexico | 381 | 3.9% |
| Nepal | 5 | 0.1% |
| Netherlands | 19 | 0.2% |
| Oceania | 4 | 0.0% |
| Philippines | 12 | 0.1% |
| Russia | 8 | 0.1% |
| Saudi Arabia | 9 | 0.1% |
| South Central Asia | 24 | 0.2% |
| South Eastern Asia | 40 | 0.4% |
| Southern Europe | 73 | 0.7% |
| Thailand | 8 | 0.1% |
| Vietnam | 11 | 0.1% |
| Western Asia | 24 | 0.2% |
| Western Europe | 61 | 0.6% | View All 37 Rows |
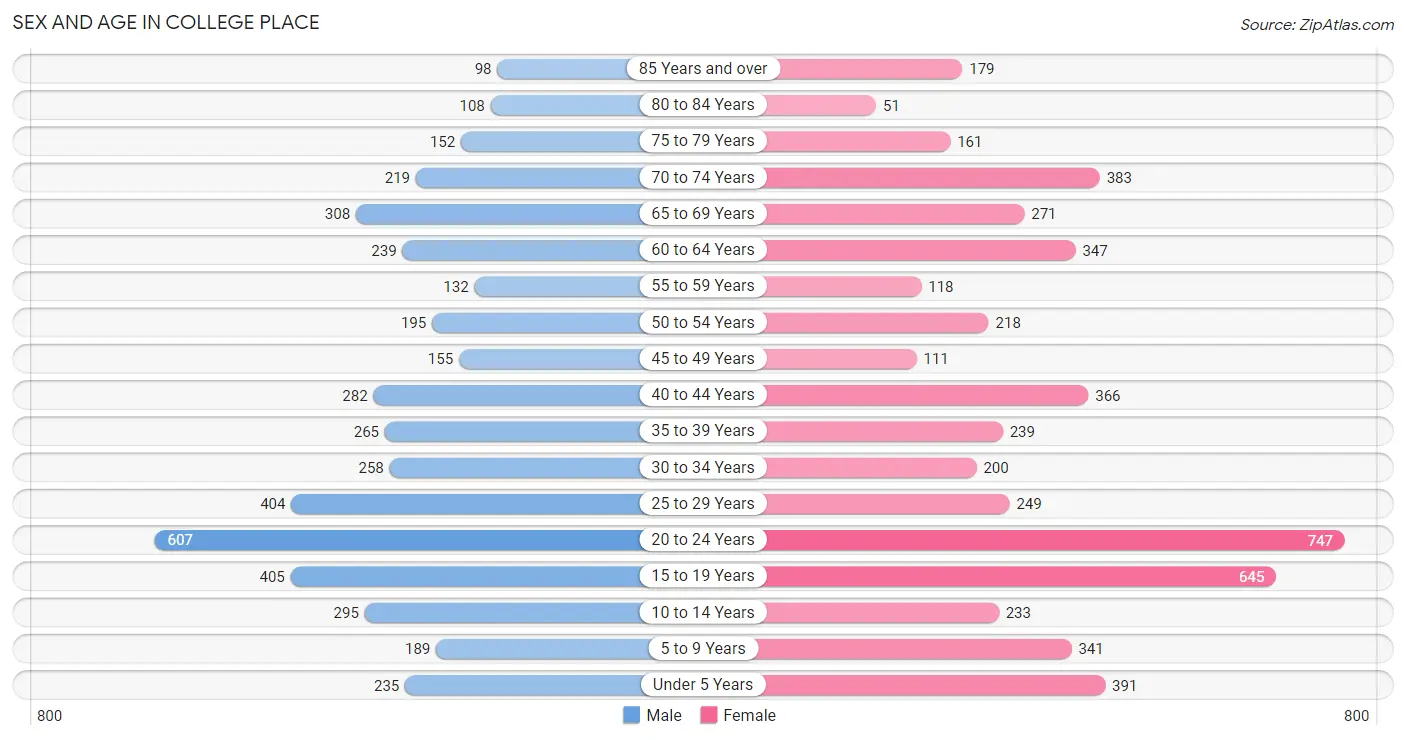
Sex and Age in College Place
Sex and Age in College Place
The most populous age groups in College Place are 20 to 24 Years (607 | 13.4%) for men and 20 to 24 Years (747 | 14.2%) for women.
| Age Bracket | Male | Female |
| Under 5 Years | 235 (5.2%) | 391 (7.4%) |
| 5 to 9 Years | 189 (4.2%) | 341 (6.5%) |
| 10 to 14 Years | 295 (6.5%) | 233 (4.4%) |
| 15 to 19 Years | 405 (8.9%) | 645 (12.3%) |
| 20 to 24 Years | 607 (13.4%) | 747 (14.2%) |
| 25 to 29 Years | 404 (8.9%) | 249 (4.7%) |
| 30 to 34 Years | 258 (5.7%) | 200 (3.8%) |
| 35 to 39 Years | 265 (5.8%) | 239 (4.5%) |
| 40 to 44 Years | 282 (6.2%) | 366 (7.0%) |
| 45 to 49 Years | 155 (3.4%) | 111 (2.1%) |
| 50 to 54 Years | 195 (4.3%) | 218 (4.2%) |
| 55 to 59 Years | 132 (2.9%) | 118 (2.2%) |
| 60 to 64 Years | 239 (5.3%) | 347 (6.6%) |
| 65 to 69 Years | 308 (6.8%) | 271 (5.2%) |
| 70 to 74 Years | 219 (4.8%) | 383 (7.3%) |
| 75 to 79 Years | 152 (3.3%) | 161 (3.1%) |
| 80 to 84 Years | 108 (2.4%) | 51 (1.0%) |
| 85 Years and over | 98 (2.2%) | 179 (3.4%) |
| Total | 4,546 (100.0%) | 5,250 (100.0%) |
Families and Households in College Place
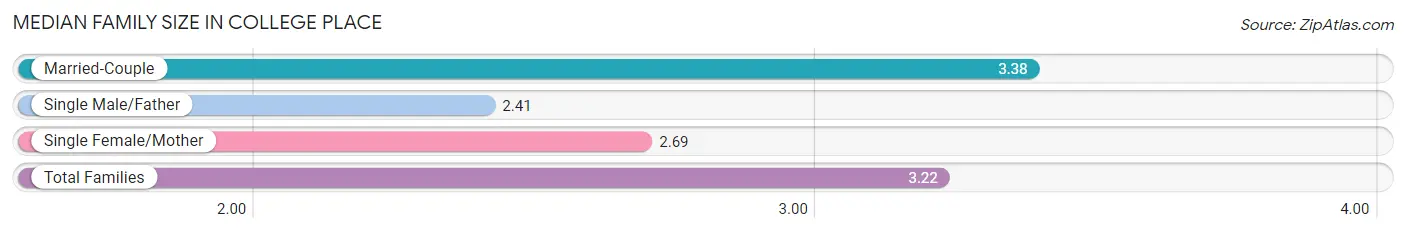
Median Family Size in College Place
The median family size in College Place is 3.22 persons per family, with married-couple families (1,693 | 79.9%) accounting for the largest median family size of 3.38 persons per family. On the other hand, single male/father families (113 | 5.3%) represent the smallest median family size with 2.41 persons per family.
| Family Type | # Families | Family Size |
| Married-Couple | 1,693 (79.9%) | 3.38 |
| Single Male/Father | 113 (5.3%) | 2.41 |
| Single Female/Mother | 314 (14.8%) | 2.69 |
| Total Families | 2,120 (100.0%) | 3.22 |
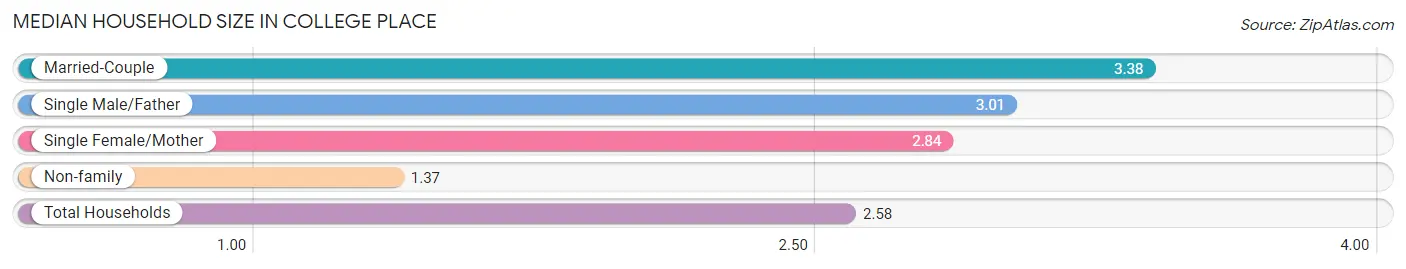
Median Household Size in College Place
The median household size in College Place is 2.58 persons per household, with married-couple households (1,693 | 50.6%) accounting for the largest median household size of 3.38 persons per household. non-family households (1,227 | 36.7%) represent the smallest median household size with 1.37 persons per household.
| Household Type | # Households | Household Size |
| Married-Couple | 1,693 (50.6%) | 3.38 |
| Single Male/Father | 113 (3.4%) | 3.01 |
| Single Female/Mother | 314 (9.4%) | 2.84 |
| Non-family | 1,227 (36.7%) | 1.37 |
| Total Households | 3,347 (100.0%) | 2.58 |
Household Size by Marriage Status in College Place
Out of a total of 3,347 households in College Place, 2,120 (63.3%) are family households, while 1,227 (36.7%) are nonfamily households. The most numerous type of family households are 2-person households, comprising 877, and the most common type of nonfamily households are 1-person households, comprising 963.
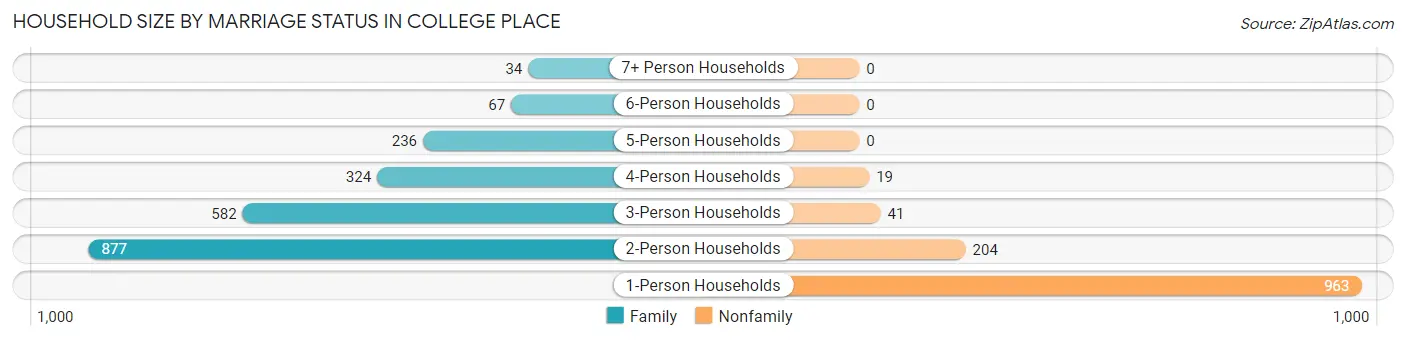
| Household Size | Family Households | Nonfamily Households |
| 1-Person Households | - | 963 (28.8%) |
| 2-Person Households | 877 (26.2%) | 204 (6.1%) |
| 3-Person Households | 582 (17.4%) | 41 (1.2%) |
| 4-Person Households | 324 (9.7%) | 19 (0.6%) |
| 5-Person Households | 236 (7.0%) | 0 (0.0%) |
| 6-Person Households | 67 (2.0%) | 0 (0.0%) |
| 7+ Person Households | 34 (1.0%) | 0 (0.0%) |
| Total | 2,120 (63.3%) | 1,227 (36.7%) |
Female Fertility in College Place
Fertility by Age in College Place
Average fertility rate in College Place is 76.0 births per 1,000 women. Women in the age bracket of 20 to 34 years have the highest fertility rate with 115.0 births per 1,000 women. Women in the age bracket of 20 to 34 years acount for 68.8% of all women with births.
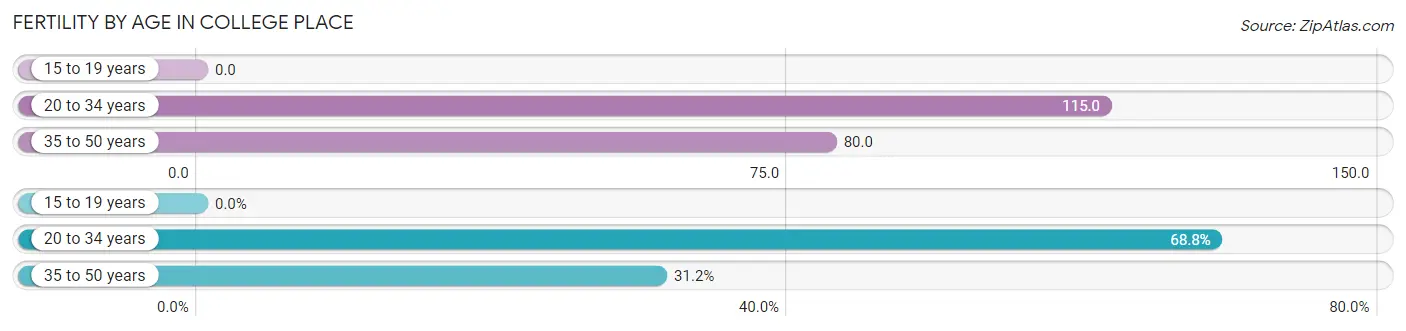
| Age Bracket | Women with Births | Births / 1,000 Women |
| 15 to 19 years | 0 (0.0%) | 0.0 |
| 20 to 34 years | 137 (68.8%) | 115.0 |
| 35 to 50 years | 62 (31.2%) | 80.0 |
| Total | 199 (100.0%) | 76.0 |
Fertility by Age by Marriage Status in College Place
88.4% of women with births (199) in College Place are married. The highest percentage of unmarried women with births falls into 20 to 34 years age bracket with 16.8% of them unmarried at the time of birth, while the lowest percentage of unmarried women with births belong to 35 to 50 years age bracket with 0.0% of them unmarried.
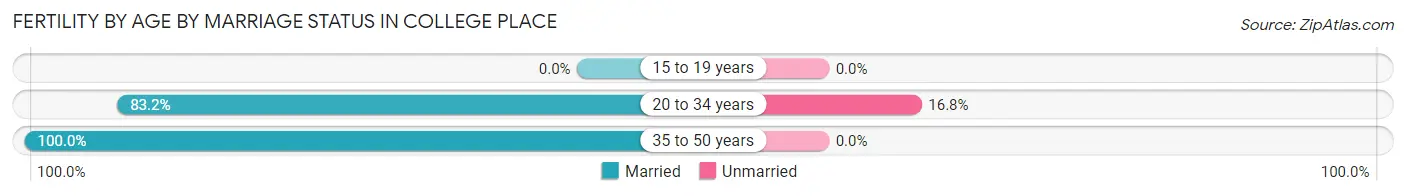
| Age Bracket | Married | Unmarried |
| 15 to 19 years | 0 (0.0%) | 0 (0.0%) |
| 20 to 34 years | 114 (83.2%) | 23 (16.8%) |
| 35 to 50 years | 62 (100.0%) | 0 (0.0%) |
| Total | 176 (88.4%) | 23 (11.6%) |
Fertility by Education in College Place
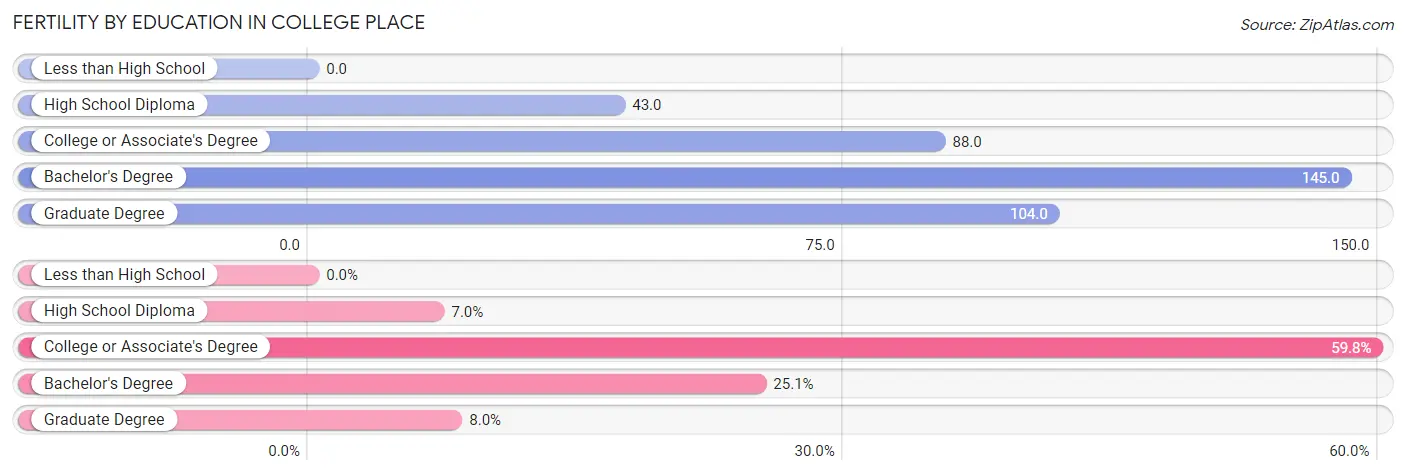
| Educational Attainment | Women with Births | Births / 1,000 Women |
| Less than High School | 0 (0.0%) | 0.0 |
| High School Diploma | 14 (7.0%) | 43.0 |
| College or Associate's Degree | 119 (59.8%) | 88.0 |
| Bachelor's Degree | 50 (25.1%) | 145.0 |
| Graduate Degree | 16 (8.0%) | 104.0 |
| Total | 199 (100.0%) | 76.0 |
Fertility by Education by Marriage Status in College Place
11.6% of women with births in College Place are unmarried. Women with the educational attainment of high school diploma are most likely to be married with 100.0% of them married at childbirth, while women with the educational attainment of college or associate's degree are least likely to be married with 19.3% of them unmarried at childbirth.
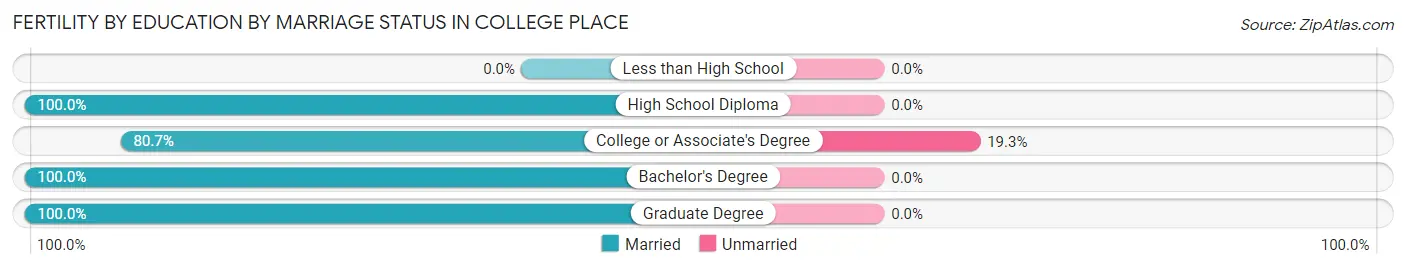
| Educational Attainment | Married | Unmarried |
| Less than High School | 0 (0.0%) | 0 (0.0%) |
| High School Diploma | 14 (100.0%) | 0 (0.0%) |
| College or Associate's Degree | 96 (80.7%) | 23 (19.3%) |
| Bachelor's Degree | 50 (100.0%) | 0 (0.0%) |
| Graduate Degree | 16 (100.0%) | 0 (0.0%) |
| Total | 176 (88.4%) | 23 (11.6%) |
Employment Characteristics in College Place
Employment by Class of Employer in College Place
Among the 4,217 employed individuals in College Place, private company employees (2,309 | 54.7%), not-for-profit organizations (728 | 17.3%), and local government employees (431 | 10.2%) make up the most common classes of employment.
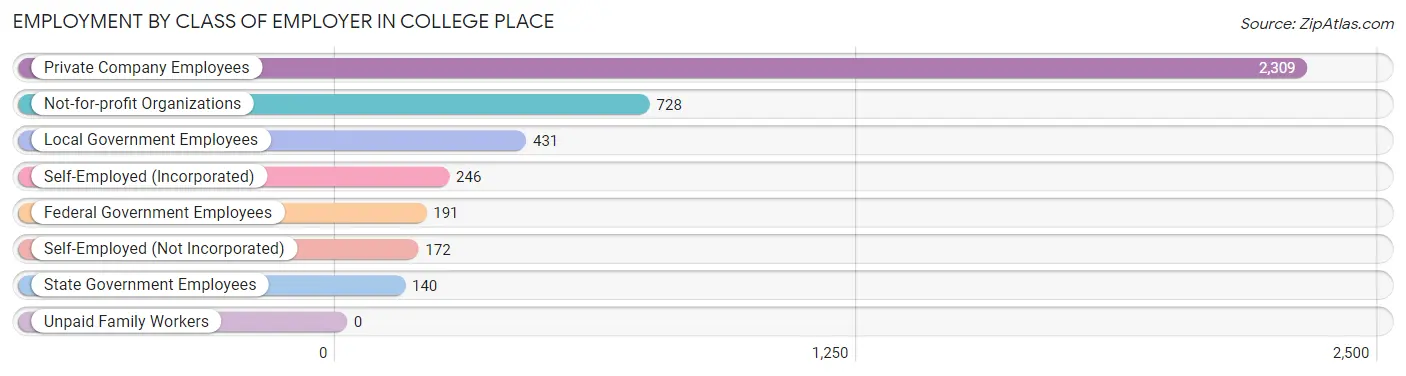
| Employer Class | # Employees | % Employees |
| Private Company Employees | 2,309 | 54.7% |
| Self-Employed (Incorporated) | 246 | 5.8% |
| Self-Employed (Not Incorporated) | 172 | 4.1% |
| Not-for-profit Organizations | 728 | 17.3% |
| Local Government Employees | 431 | 10.2% |
| State Government Employees | 140 | 3.3% |
| Federal Government Employees | 191 | 4.5% |
| Unpaid Family Workers | 0 | 0.0% |
| Total | 4,217 | 100.0% |
Employment Status by Age in College Place
According to the labor force statistics for College Place, out of the total population over 16 years of age (7,922), 58.9% or 4,666 individuals are in the labor force, with 5.6% or 261 of them unemployed. The age group with the highest labor force participation rate is 25 to 29 years, with 98.0% or 640 individuals in the labor force. Within the labor force, the 25 to 29 years age range has the highest percentage of unemployed individuals, with 18.3% or 117 of them being unemployed.
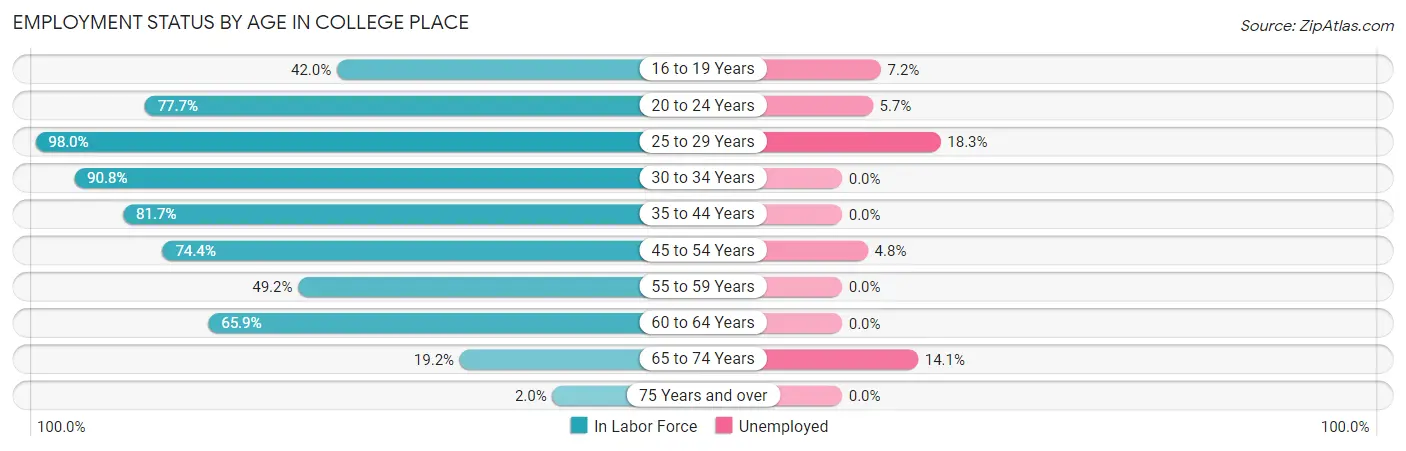
| Age Bracket | In Labor Force | Unemployed |
| 16 to 19 Years | 361 (42.0%) | 26 (7.2%) |
| 20 to 24 Years | 1,052 (77.7%) | 60 (5.7%) |
| 25 to 29 Years | 640 (98.0%) | 117 (18.3%) |
| 30 to 34 Years | 416 (90.8%) | 0 (0.0%) |
| 35 to 44 Years | 941 (81.7%) | 0 (0.0%) |
| 45 to 54 Years | 505 (74.4%) | 24 (4.8%) |
| 55 to 59 Years | 123 (49.2%) | 0 (0.0%) |
| 60 to 64 Years | 386 (65.9%) | 0 (0.0%) |
| 65 to 74 Years | 227 (19.2%) | 32 (14.1%) |
| 75 Years and over | 15 (2.0%) | 0 (0.0%) |
| Total | 4,666 (58.9%) | 261 (5.6%) |
Employment Status by Educational Attainment in College Place
According to labor force statistics for College Place, 79.7% of individuals (3,011) out of the total population between 25 and 64 years of age (3,778) are in the labor force, with 4.7% or 142 of them being unemployed. The group with the highest labor force participation rate are those with the educational attainment of bachelor's degree or higher, with 88.8% or 1,306 individuals in the labor force. Within the labor force, individuals with less than high school education have the highest percentage of unemployment, with 39.3% or 118 of them being unemployed.
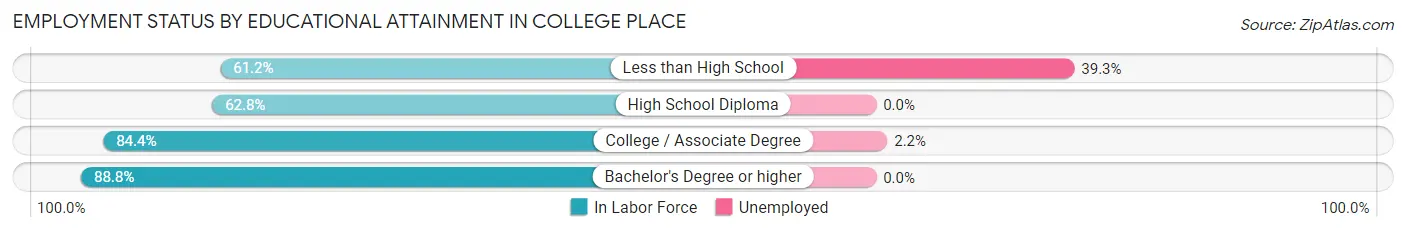
| Educational Attainment | In Labor Force | Unemployed |
| Less than High School | 300 (61.2%) | 193 (39.3%) |
| High School Diploma | 375 (62.8%) | 0 (0.0%) |
| College / Associate Degree | 1,030 (84.4%) | 27 (2.2%) |
| Bachelor's Degree or higher | 1,306 (88.8%) | 0 (0.0%) |
| Total | 3,011 (79.7%) | 178 (4.7%) |
Employment Occupations by Sex in College Place
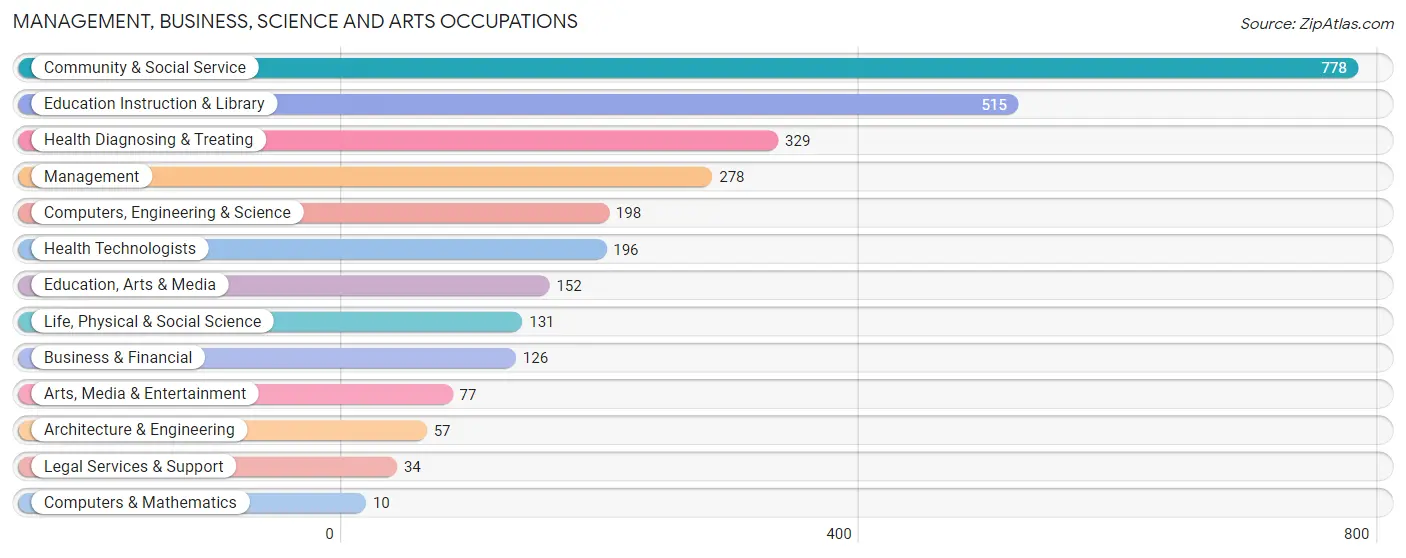
Management, Business, Science and Arts Occupations
The most common Management, Business, Science and Arts occupations in College Place are Community & Social Service (778 | 17.7%), Education Instruction & Library (515 | 11.7%), Health Diagnosing & Treating (329 | 7.5%), Management (278 | 6.3%), and Computers, Engineering & Science (198 | 4.5%).
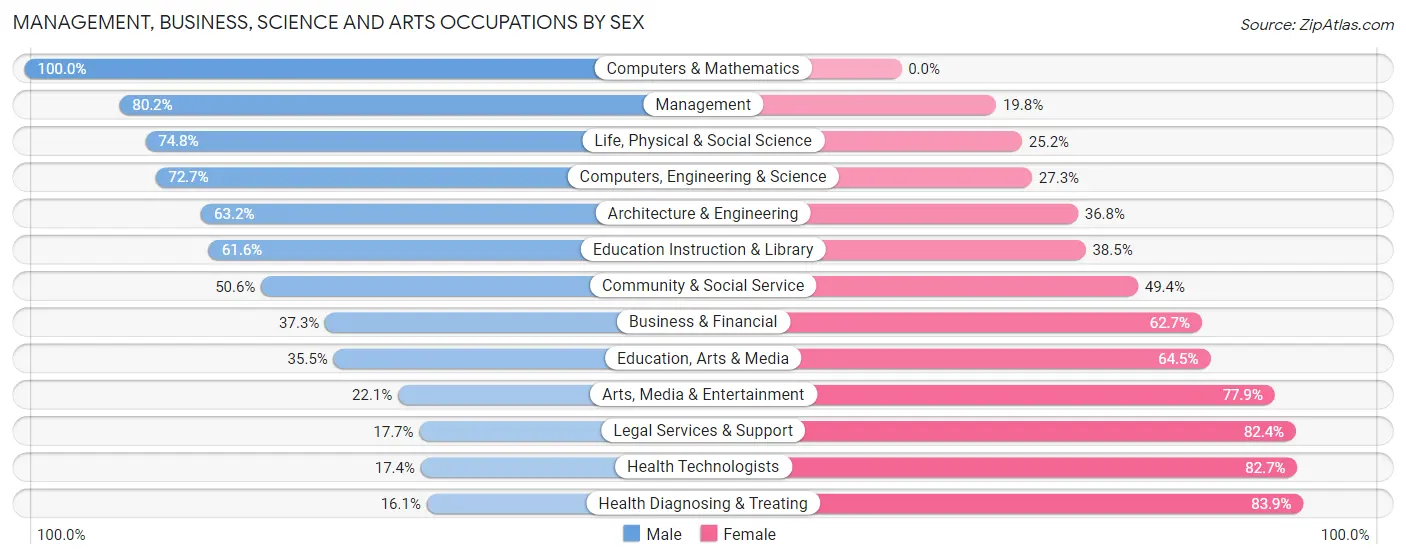
Management, Business, Science and Arts Occupations by Sex
Within the Management, Business, Science and Arts occupations in College Place, the most male-oriented occupations are Computers & Mathematics (100.0%), Management (80.2%), and Life, Physical & Social Science (74.8%), while the most female-oriented occupations are Health Diagnosing & Treating (83.9%), Health Technologists (82.7%), and Legal Services & Support (82.4%).
| Occupation | Male | Female |
| Management | 223 (80.2%) | 55 (19.8%) |
| Business & Financial | 47 (37.3%) | 79 (62.7%) |
| Computers, Engineering & Science | 144 (72.7%) | 54 (27.3%) |
| Computers & Mathematics | 10 (100.0%) | 0 (0.0%) |
| Architecture & Engineering | 36 (63.2%) | 21 (36.8%) |
| Life, Physical & Social Science | 98 (74.8%) | 33 (25.2%) |
| Community & Social Service | 394 (50.6%) | 384 (49.4%) |
| Education, Arts & Media | 54 (35.5%) | 98 (64.5%) |
| Legal Services & Support | 6 (17.6%) | 28 (82.4%) |
| Education Instruction & Library | 317 (61.6%) | 198 (38.5%) |
| Arts, Media & Entertainment | 17 (22.1%) | 60 (77.9%) |
| Health Diagnosing & Treating | 53 (16.1%) | 276 (83.9%) |
| Health Technologists | 34 (17.3%) | 162 (82.7%) |
| Total (Category) | 861 (50.4%) | 848 (49.6%) |
| Total (Overall) | 2,252 (51.2%) | 2,148 (48.8%) |
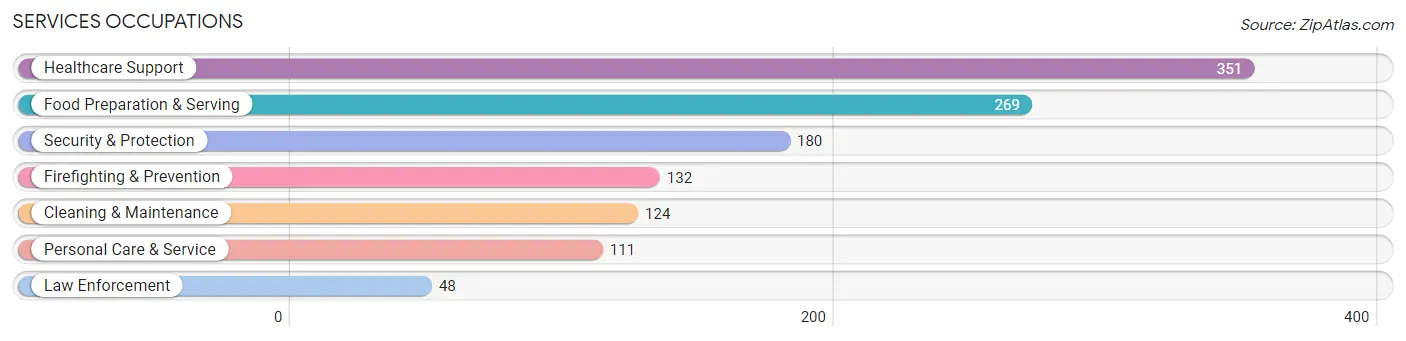
Services Occupations
The most common Services occupations in College Place are Healthcare Support (351 | 8.0%), Food Preparation & Serving (269 | 6.1%), Security & Protection (180 | 4.1%), Firefighting & Prevention (132 | 3.0%), and Cleaning & Maintenance (124 | 2.8%).
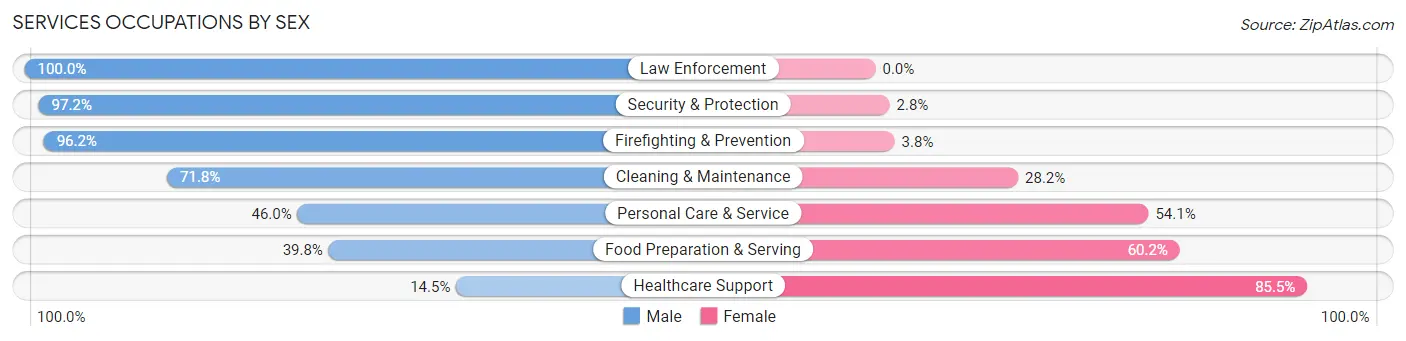
Services Occupations by Sex
Within the Services occupations in College Place, the most male-oriented occupations are Law Enforcement (100.0%), Security & Protection (97.2%), and Firefighting & Prevention (96.2%), while the most female-oriented occupations are Healthcare Support (85.5%), Food Preparation & Serving (60.2%), and Personal Care & Service (54.0%).
| Occupation | Male | Female |
| Healthcare Support | 51 (14.5%) | 300 (85.5%) |
| Security & Protection | 175 (97.2%) | 5 (2.8%) |
| Firefighting & Prevention | 127 (96.2%) | 5 (3.8%) |
| Law Enforcement | 48 (100.0%) | 0 (0.0%) |
| Food Preparation & Serving | 107 (39.8%) | 162 (60.2%) |
| Cleaning & Maintenance | 89 (71.8%) | 35 (28.2%) |
| Personal Care & Service | 51 (46.0%) | 60 (54.0%) |
| Total (Category) | 473 (45.7%) | 562 (54.3%) |
| Total (Overall) | 2,252 (51.2%) | 2,148 (48.8%) |
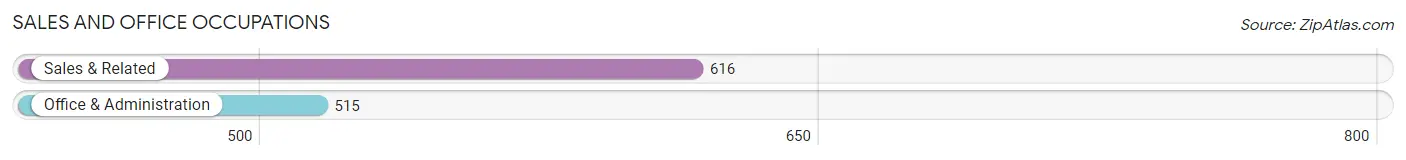
Sales and Office Occupations
The most common Sales and Office occupations in College Place are Sales & Related (616 | 14.0%), and Office & Administration (515 | 11.7%).
Sales and Office Occupations by Sex
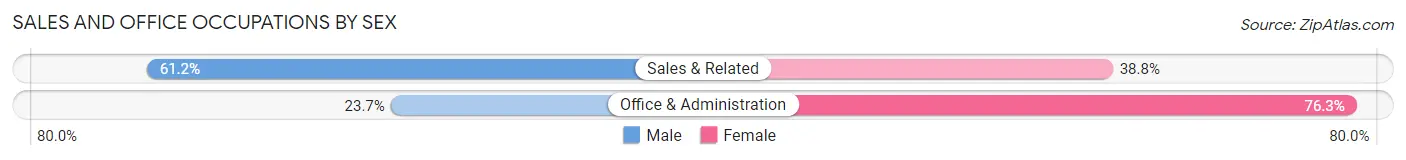
| Occupation | Male | Female |
| Sales & Related | 377 (61.2%) | 239 (38.8%) |
| Office & Administration | 122 (23.7%) | 393 (76.3%) |
| Total (Category) | 499 (44.1%) | 632 (55.9%) |
| Total (Overall) | 2,252 (51.2%) | 2,148 (48.8%) |
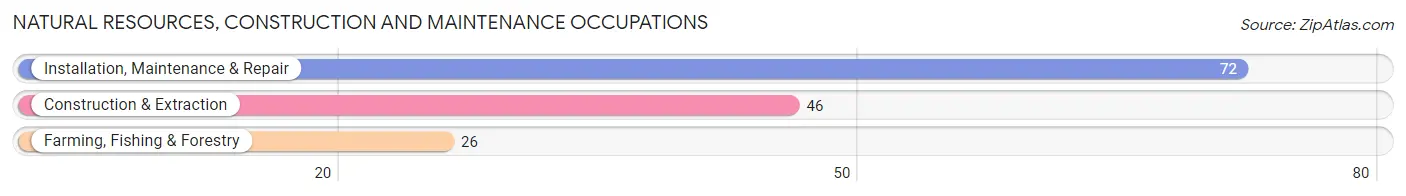
Natural Resources, Construction and Maintenance Occupations
The most common Natural Resources, Construction and Maintenance occupations in College Place are Installation, Maintenance & Repair (72 | 1.6%), Construction & Extraction (46 | 1.1%), and Farming, Fishing & Forestry (26 | 0.6%).
Natural Resources, Construction and Maintenance Occupations by Sex
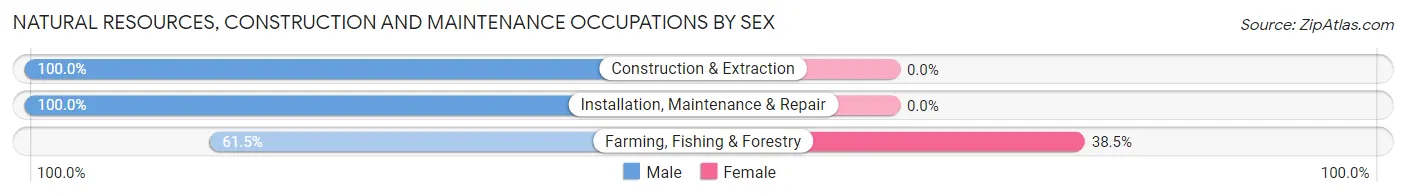
| Occupation | Male | Female |
| Farming, Fishing & Forestry | 16 (61.5%) | 10 (38.5%) |
| Construction & Extraction | 46 (100.0%) | 0 (0.0%) |
| Installation, Maintenance & Repair | 72 (100.0%) | 0 (0.0%) |
| Total (Category) | 134 (93.1%) | 10 (6.9%) |
| Total (Overall) | 2,252 (51.2%) | 2,148 (48.8%) |
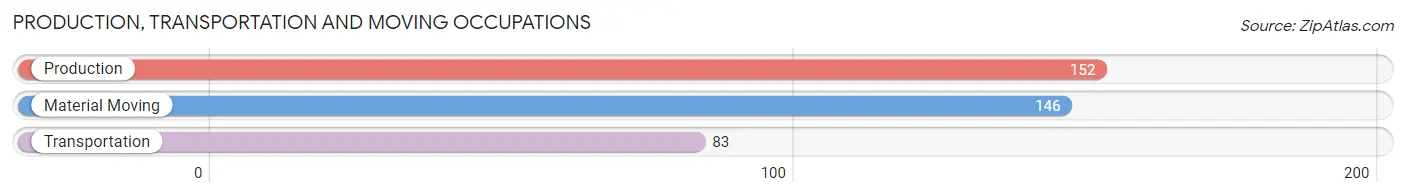
Production, Transportation and Moving Occupations
The most common Production, Transportation and Moving occupations in College Place are Production (152 | 3.5%), Material Moving (146 | 3.3%), and Transportation (83 | 1.9%).
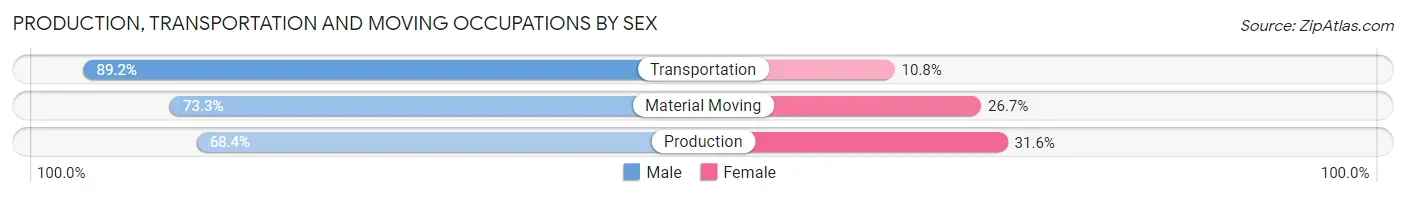
Production, Transportation and Moving Occupations by Sex
| Occupation | Male | Female |
| Production | 104 (68.4%) | 48 (31.6%) |
| Transportation | 74 (89.2%) | 9 (10.8%) |
| Material Moving | 107 (73.3%) | 39 (26.7%) |
| Total (Category) | 285 (74.8%) | 96 (25.2%) |
| Total (Overall) | 2,252 (51.2%) | 2,148 (48.8%) |
Employment Industries by Sex in College Place
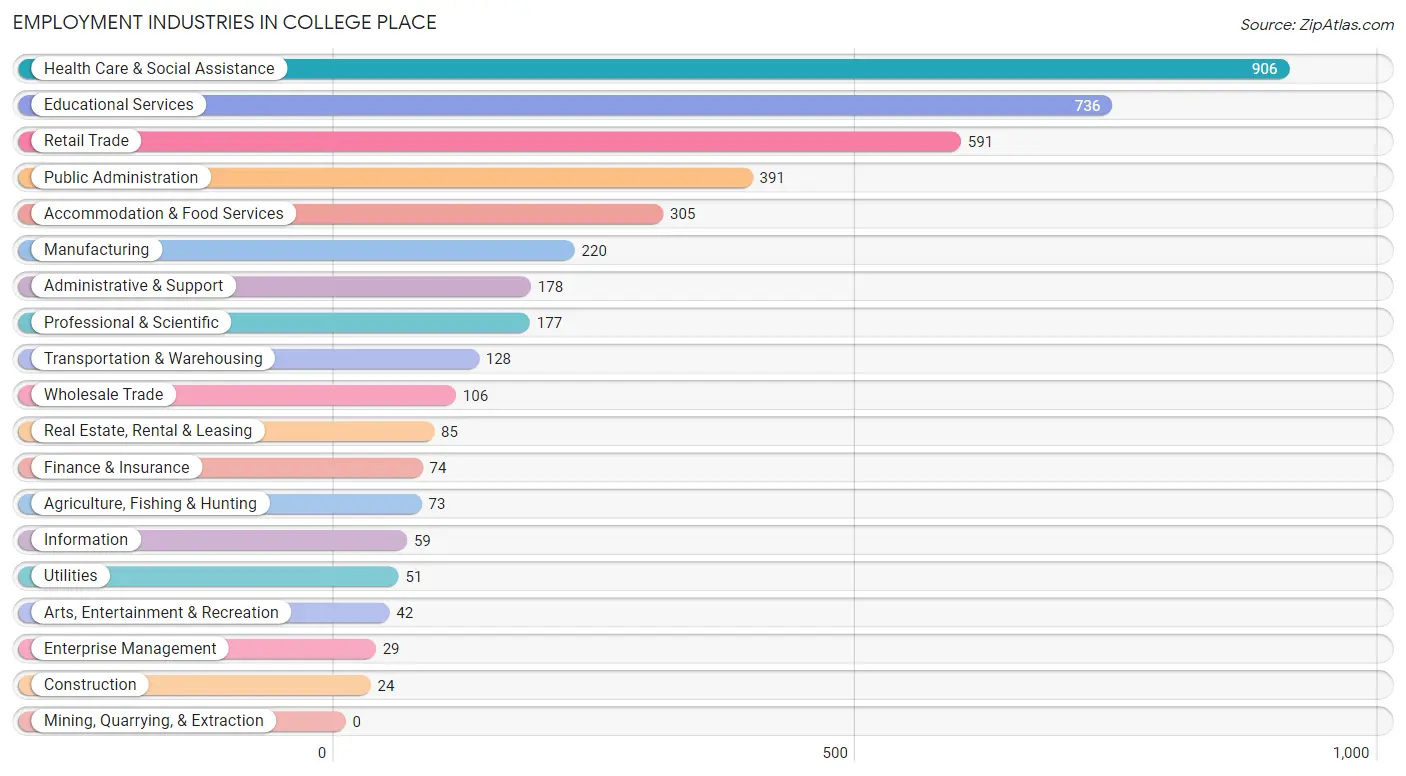
Employment Industries in College Place
The major employment industries in College Place include Health Care & Social Assistance (906 | 20.6%), Educational Services (736 | 16.7%), Retail Trade (591 | 13.4%), Public Administration (391 | 8.9%), and Accommodation & Food Services (305 | 6.9%).
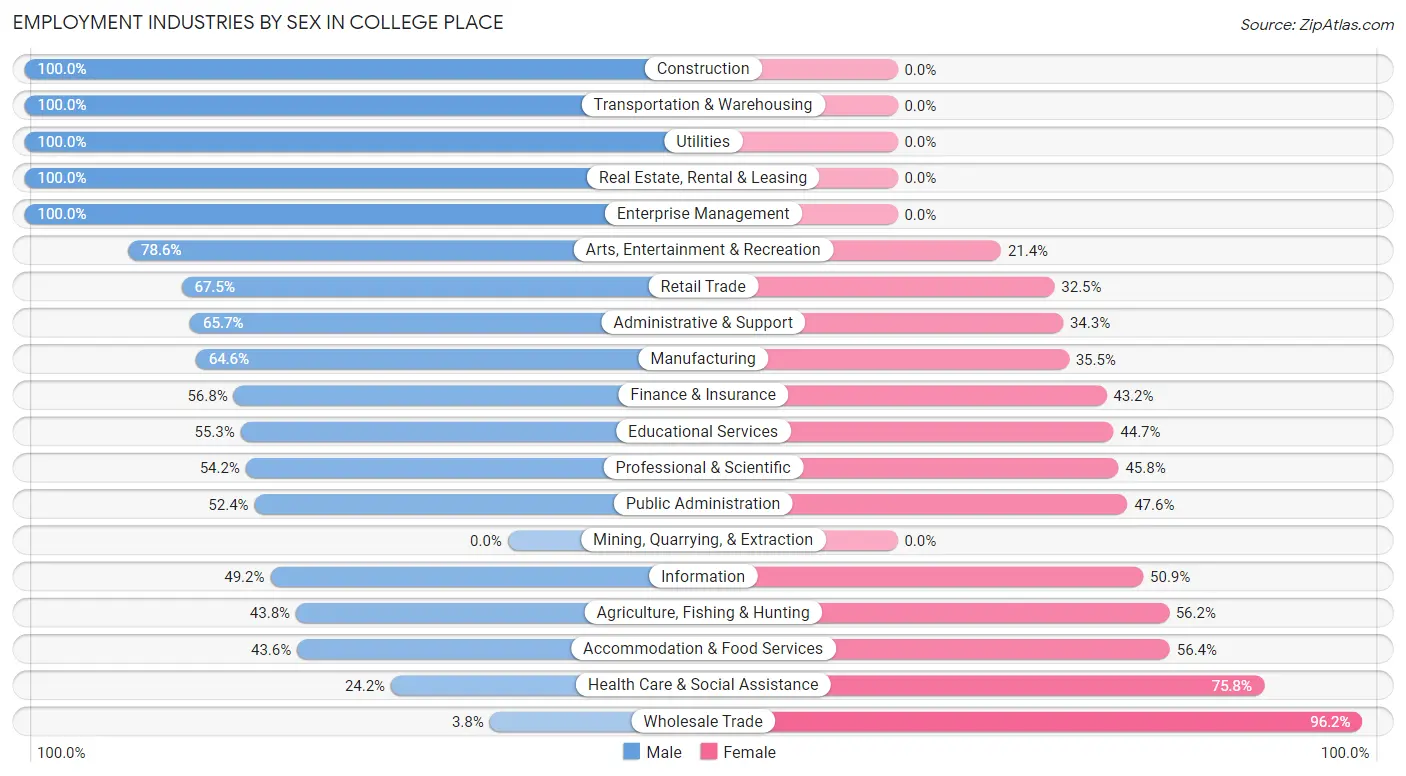
Employment Industries by Sex in College Place
The College Place industries that see more men than women are Construction (100.0%), Transportation & Warehousing (100.0%), and Utilities (100.0%), whereas the industries that tend to have a higher number of women are Wholesale Trade (96.2%), Health Care & Social Assistance (75.8%), and Accommodation & Food Services (56.4%).
| Industry | Male | Female |
| Agriculture, Fishing & Hunting | 32 (43.8%) | 41 (56.2%) |
| Mining, Quarrying, & Extraction | 0 (0.0%) | 0 (0.0%) |
| Construction | 24 (100.0%) | 0 (0.0%) |
| Manufacturing | 142 (64.5%) | 78 (35.4%) |
| Wholesale Trade | 4 (3.8%) | 102 (96.2%) |
| Retail Trade | 399 (67.5%) | 192 (32.5%) |
| Transportation & Warehousing | 128 (100.0%) | 0 (0.0%) |
| Utilities | 51 (100.0%) | 0 (0.0%) |
| Information | 29 (49.1%) | 30 (50.8%) |
| Finance & Insurance | 42 (56.8%) | 32 (43.2%) |
| Real Estate, Rental & Leasing | 85 (100.0%) | 0 (0.0%) |
| Professional & Scientific | 96 (54.2%) | 81 (45.8%) |
| Enterprise Management | 29 (100.0%) | 0 (0.0%) |
| Administrative & Support | 117 (65.7%) | 61 (34.3%) |
| Educational Services | 407 (55.3%) | 329 (44.7%) |
| Health Care & Social Assistance | 219 (24.2%) | 687 (75.8%) |
| Arts, Entertainment & Recreation | 33 (78.6%) | 9 (21.4%) |
| Accommodation & Food Services | 133 (43.6%) | 172 (56.4%) |
| Public Administration | 205 (52.4%) | 186 (47.6%) |
| Total | 2,252 (51.2%) | 2,148 (48.8%) |
Education in College Place
School Enrollment in College Place
The most common levels of schooling among the 3,228 students in College Place are college / undergraduate (1,511 | 46.8%), elementary school (494 | 15.3%), and high school (481 | 14.9%).
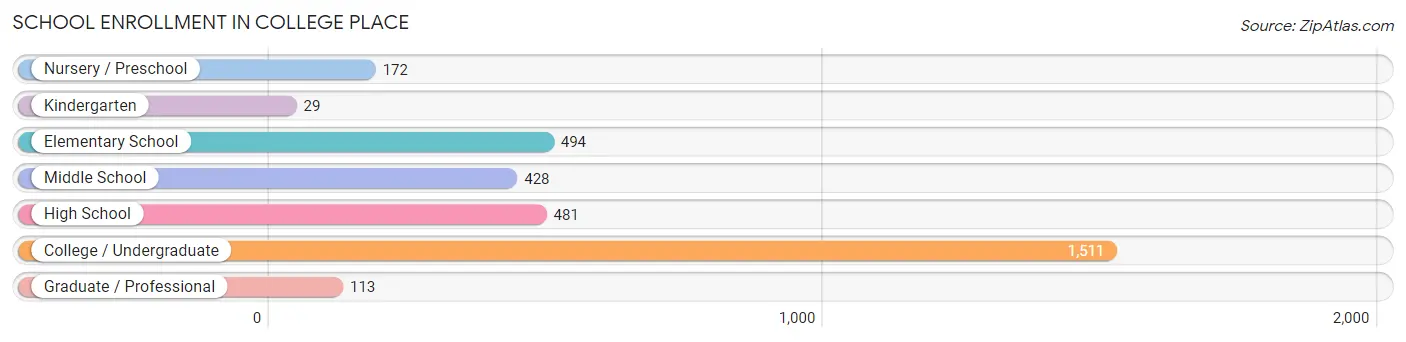
| School Level | # Students | % Students |
| Nursery / Preschool | 172 | 5.3% |
| Kindergarten | 29 | 0.9% |
| Elementary School | 494 | 15.3% |
| Middle School | 428 | 13.3% |
| High School | 481 | 14.9% |
| College / Undergraduate | 1,511 | 46.8% |
| Graduate / Professional | 113 | 3.5% |
| Total | 3,228 | 100.0% |
School Enrollment by Age by Funding Source in College Place
Out of a total of 3,228 students who are enrolled in schools in College Place, 1,537 (47.6%) attend a private institution, while the remaining 1,691 (52.4%) are enrolled in public schools. The age group of 3 to 4 year olds has the highest likelihood of being enrolled in private schools, with 132 (95.0% in the age bracket) enrolled. Conversely, the age group of 35 years and over has the lowest likelihood of being enrolled in a private school, with 87 (100.0% in the age bracket) attending a public institution.
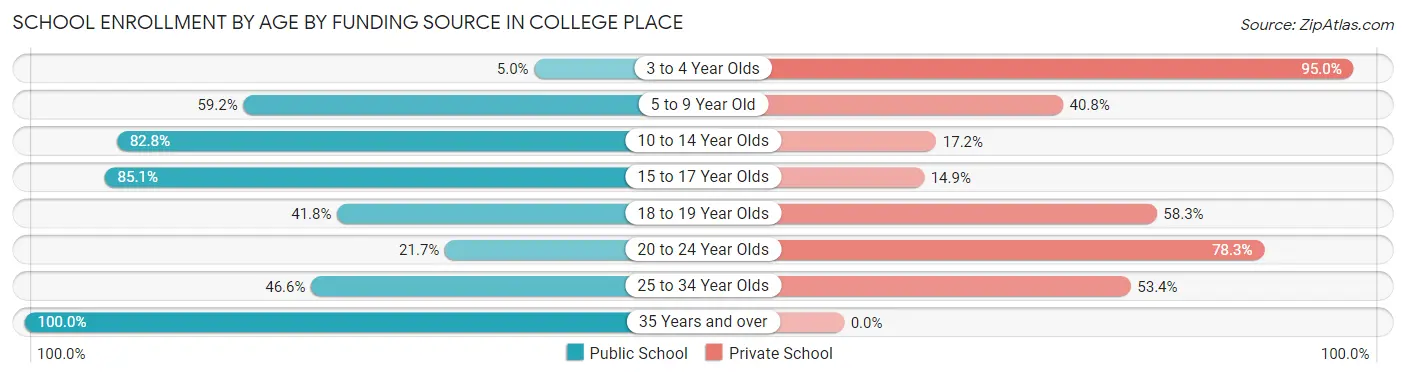
| Age Bracket | Public School | Private School |
| 3 to 4 Year Olds | 7 (5.0%) | 132 (95.0%) |
| 5 to 9 Year Old | 292 (59.2%) | 201 (40.8%) |
| 10 to 14 Year Olds | 415 (82.8%) | 86 (17.2%) |
| 15 to 17 Year Olds | 411 (85.1%) | 72 (14.9%) |
| 18 to 19 Year Olds | 200 (41.7%) | 279 (58.3%) |
| 20 to 24 Year Olds | 182 (21.7%) | 658 (78.3%) |
| 25 to 34 Year Olds | 96 (46.6%) | 110 (53.4%) |
| 35 Years and over | 87 (100.0%) | 0 (0.0%) |
| Total | 1,691 (52.4%) | 1,537 (47.6%) |
Educational Attainment by Field of Study in College Place
Science & technology (386 | 16.1%), business (385 | 16.1%), education (312 | 13.0%), bio, nature & agricultural (256 | 10.7%), and liberal arts & history (180 | 7.5%) are the most common fields of study among 2,398 individuals in College Place who have obtained a bachelor's degree or higher.
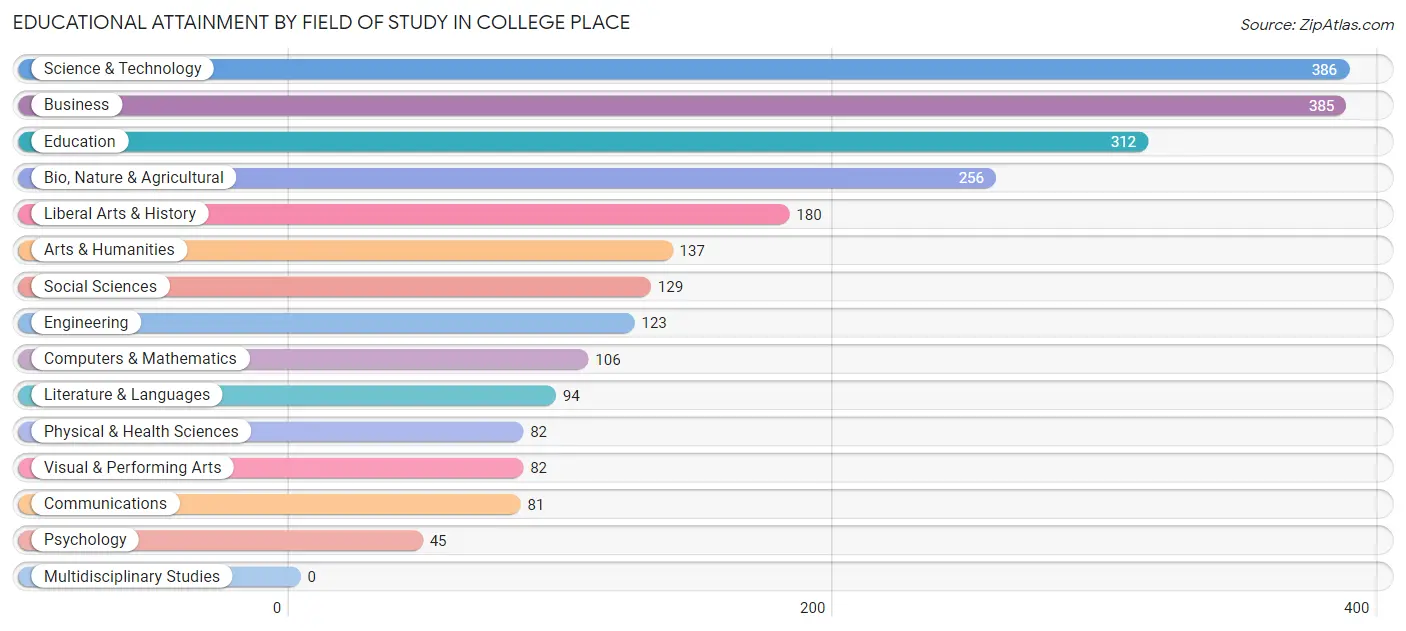
| Field of Study | # Graduates | % Graduates |
| Computers & Mathematics | 106 | 4.4% |
| Bio, Nature & Agricultural | 256 | 10.7% |
| Physical & Health Sciences | 82 | 3.4% |
| Psychology | 45 | 1.9% |
| Social Sciences | 129 | 5.4% |
| Engineering | 123 | 5.1% |
| Multidisciplinary Studies | 0 | 0.0% |
| Science & Technology | 386 | 16.1% |
| Business | 385 | 16.1% |
| Education | 312 | 13.0% |
| Literature & Languages | 94 | 3.9% |
| Liberal Arts & History | 180 | 7.5% |
| Visual & Performing Arts | 82 | 3.4% |
| Communications | 81 | 3.4% |
| Arts & Humanities | 137 | 5.7% |
| Total | 2,398 | 100.0% |
Transportation & Commute in College Place
Vehicle Availability by Sex in College Place
The most prevalent vehicle ownership categories in College Place are males with 2 vehicles (855, accounting for 43.1%) and females with 2 vehicles (597, making up 49.2%).
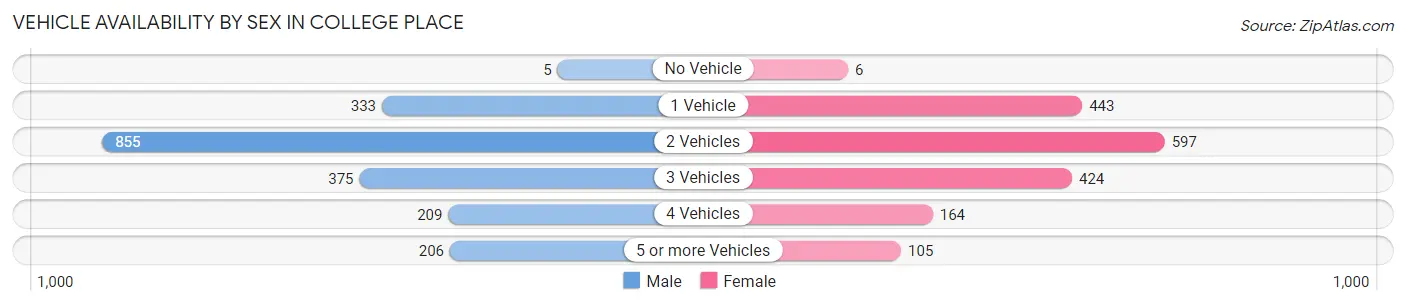
| Vehicles Available | Male | Female |
| No Vehicle | 5 (0.3%) | 6 (0.4%) |
| 1 Vehicle | 333 (16.8%) | 443 (25.5%) |
| 2 Vehicles | 855 (43.1%) | 597 (34.3%) |
| 3 Vehicles | 375 (18.9%) | 424 (24.4%) |
| 4 Vehicles | 209 (10.5%) | 164 (9.4%) |
| 5 or more Vehicles | 206 (10.4%) | 105 (6.0%) |
| Total | 1,983 (100.0%) | 1,739 (100.0%) |
Commute Time in College Place
The most frequently occuring commute durations in College Place are 10 to 14 minutes (1,163 commuters, 30.4%), 5 to 9 minutes (1,061 commuters, 27.8%), and 15 to 19 minutes (950 commuters, 24.9%).
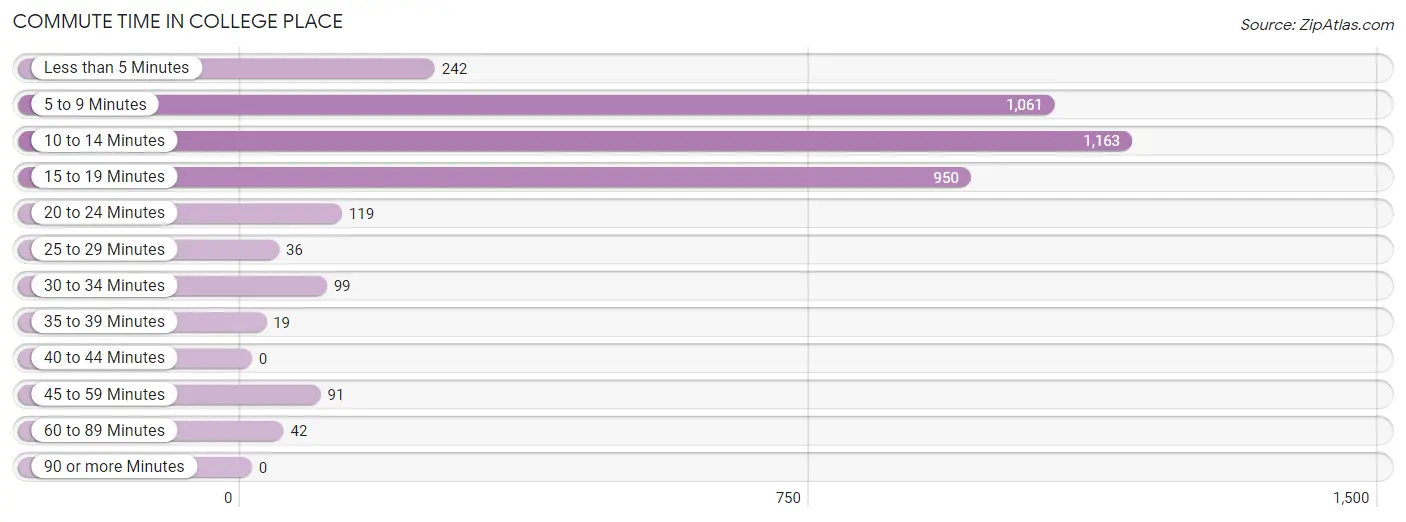
| Commute Time | # Commuters | % Commuters |
| Less than 5 Minutes | 242 | 6.3% |
| 5 to 9 Minutes | 1,061 | 27.8% |
| 10 to 14 Minutes | 1,163 | 30.4% |
| 15 to 19 Minutes | 950 | 24.9% |
| 20 to 24 Minutes | 119 | 3.1% |
| 25 to 29 Minutes | 36 | 0.9% |
| 30 to 34 Minutes | 99 | 2.6% |
| 35 to 39 Minutes | 19 | 0.5% |
| 40 to 44 Minutes | 0 | 0.0% |
| 45 to 59 Minutes | 91 | 2.4% |
| 60 to 89 Minutes | 42 | 1.1% |
| 90 or more Minutes | 0 | 0.0% |
Commute Time by Sex in College Place
The most common commute times in College Place are 10 to 14 minutes (638 commuters, 31.1%) for males and 10 to 14 minutes (525 commuters, 29.7%) for females.
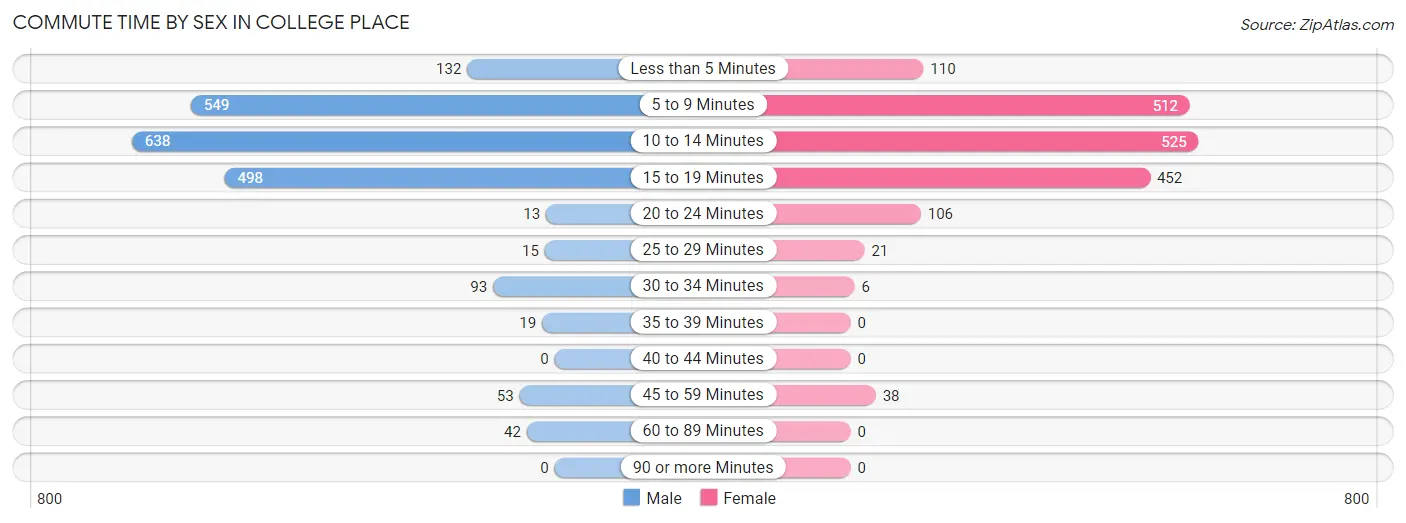
| Commute Time | Male | Female |
| Less than 5 Minutes | 132 (6.4%) | 110 (6.2%) |
| 5 to 9 Minutes | 549 (26.8%) | 512 (28.9%) |
| 10 to 14 Minutes | 638 (31.1%) | 525 (29.7%) |
| 15 to 19 Minutes | 498 (24.3%) | 452 (25.5%) |
| 20 to 24 Minutes | 13 (0.6%) | 106 (6.0%) |
| 25 to 29 Minutes | 15 (0.7%) | 21 (1.2%) |
| 30 to 34 Minutes | 93 (4.5%) | 6 (0.3%) |
| 35 to 39 Minutes | 19 (0.9%) | 0 (0.0%) |
| 40 to 44 Minutes | 0 (0.0%) | 0 (0.0%) |
| 45 to 59 Minutes | 53 (2.6%) | 38 (2.1%) |
| 60 to 89 Minutes | 42 (2.1%) | 0 (0.0%) |
| 90 or more Minutes | 0 (0.0%) | 0 (0.0%) |
Time of Departure to Work by Sex in College Place
The most frequent times of departure to work in College Place are 6:30 AM to 6:59 AM (446, 21.7%) for males and 7:30 AM to 7:59 AM (354, 20.0%) for females.
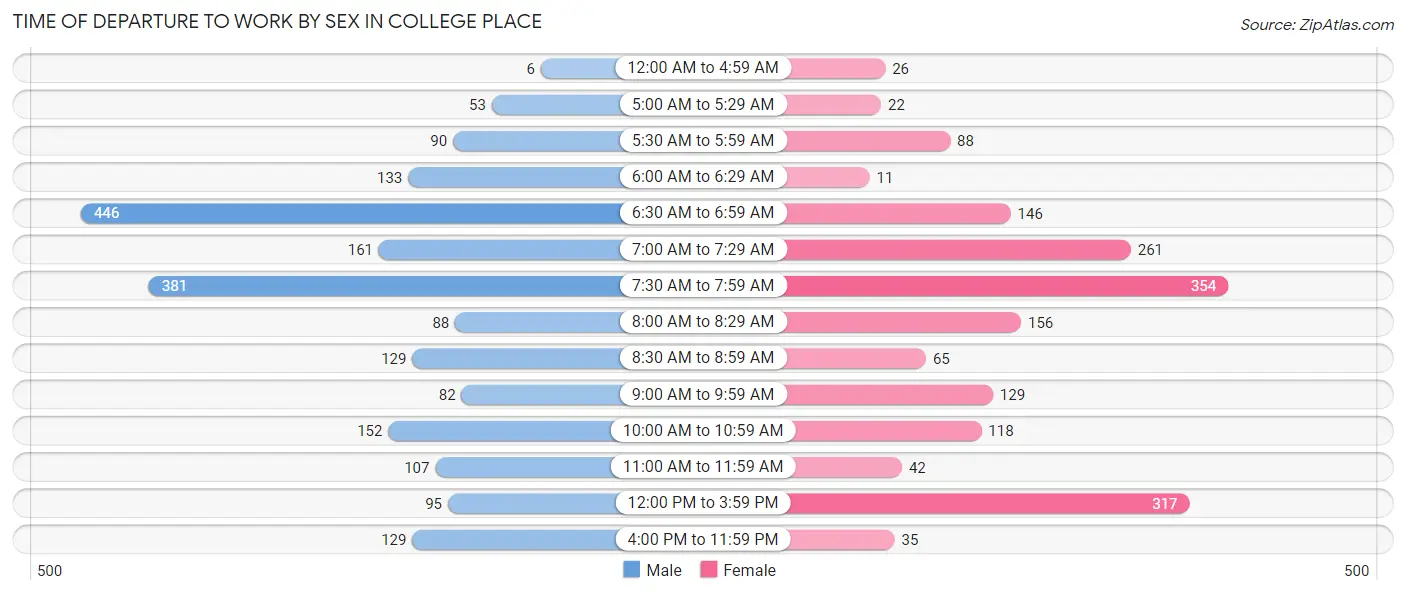
| Time of Departure | Male | Female |
| 12:00 AM to 4:59 AM | 6 (0.3%) | 26 (1.5%) |
| 5:00 AM to 5:29 AM | 53 (2.6%) | 22 (1.2%) |
| 5:30 AM to 5:59 AM | 90 (4.4%) | 88 (5.0%) |
| 6:00 AM to 6:29 AM | 133 (6.5%) | 11 (0.6%) |
| 6:30 AM to 6:59 AM | 446 (21.7%) | 146 (8.3%) |
| 7:00 AM to 7:29 AM | 161 (7.9%) | 261 (14.7%) |
| 7:30 AM to 7:59 AM | 381 (18.6%) | 354 (20.0%) |
| 8:00 AM to 8:29 AM | 88 (4.3%) | 156 (8.8%) |
| 8:30 AM to 8:59 AM | 129 (6.3%) | 65 (3.7%) |
| 9:00 AM to 9:59 AM | 82 (4.0%) | 129 (7.3%) |
| 10:00 AM to 10:59 AM | 152 (7.4%) | 118 (6.7%) |
| 11:00 AM to 11:59 AM | 107 (5.2%) | 42 (2.4%) |
| 12:00 PM to 3:59 PM | 95 (4.6%) | 317 (17.9%) |
| 4:00 PM to 11:59 PM | 129 (6.3%) | 35 (2.0%) |
| Total | 2,052 (100.0%) | 1,770 (100.0%) |
Housing Occupancy in College Place
Occupancy by Ownership in College Place
Of the total 3,347 dwellings in College Place, owner-occupied units account for 2,193 (65.5%), while renter-occupied units make up 1,154 (34.5%).
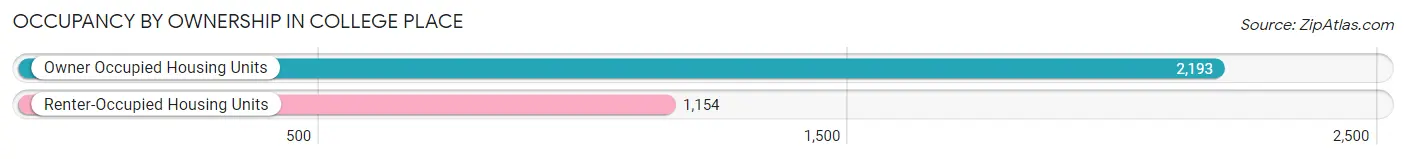
| Occupancy | # Housing Units | % Housing Units |
| Owner Occupied Housing Units | 2,193 | 65.5% |
| Renter-Occupied Housing Units | 1,154 | 34.5% |
| Total Occupied Housing Units | 3,347 | 100.0% |
Occupancy by Household Size in College Place
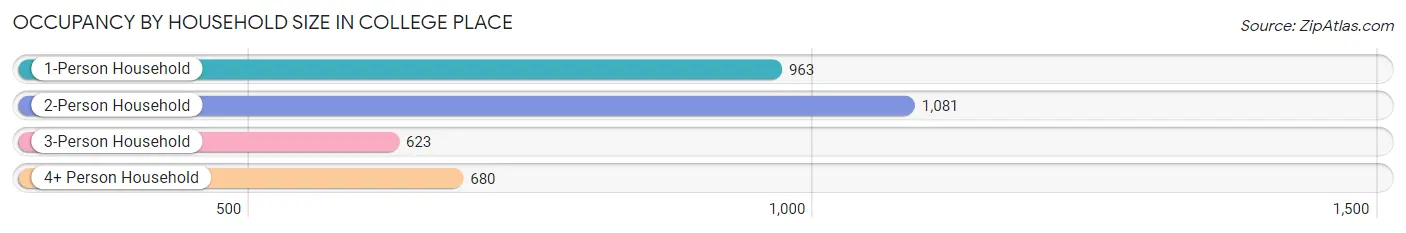
| Household Size | # Housing Units | % Housing Units |
| 1-Person Household | 963 | 28.8% |
| 2-Person Household | 1,081 | 32.3% |
| 3-Person Household | 623 | 18.6% |
| 4+ Person Household | 680 | 20.3% |
| Total Housing Units | 3,347 | 100.0% |
Occupancy by Ownership by Household Size in College Place
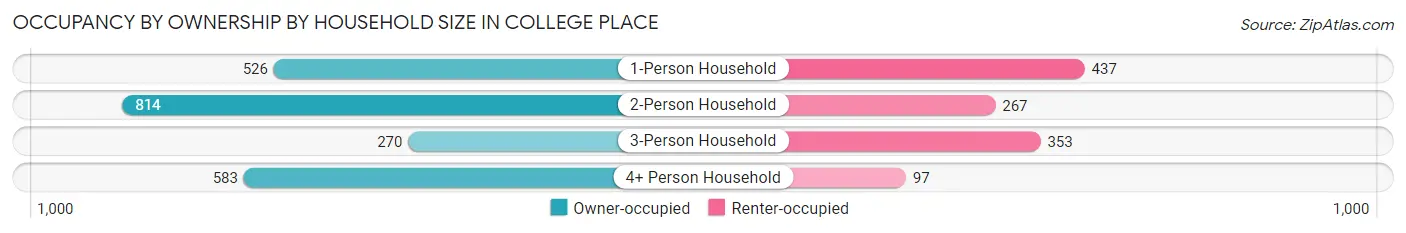
| Household Size | Owner-occupied | Renter-occupied |
| 1-Person Household | 526 (54.6%) | 437 (45.4%) |
| 2-Person Household | 814 (75.3%) | 267 (24.7%) |
| 3-Person Household | 270 (43.3%) | 353 (56.7%) |
| 4+ Person Household | 583 (85.7%) | 97 (14.3%) |
| Total Housing Units | 2,193 (65.5%) | 1,154 (34.5%) |
Occupancy by Educational Attainment in College Place
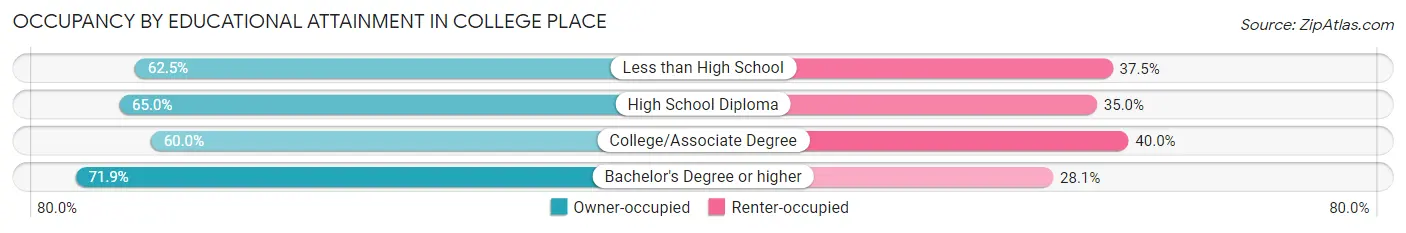
| Household Size | Owner-occupied | Renter-occupied |
| Less than High School | 115 (62.5%) | 69 (37.5%) |
| High School Diploma | 156 (65.0%) | 84 (35.0%) |
| College/Associate Degree | 907 (60.0%) | 605 (40.0%) |
| Bachelor's Degree or higher | 1,015 (71.9%) | 396 (28.1%) |
Occupancy by Age of Householder in College Place
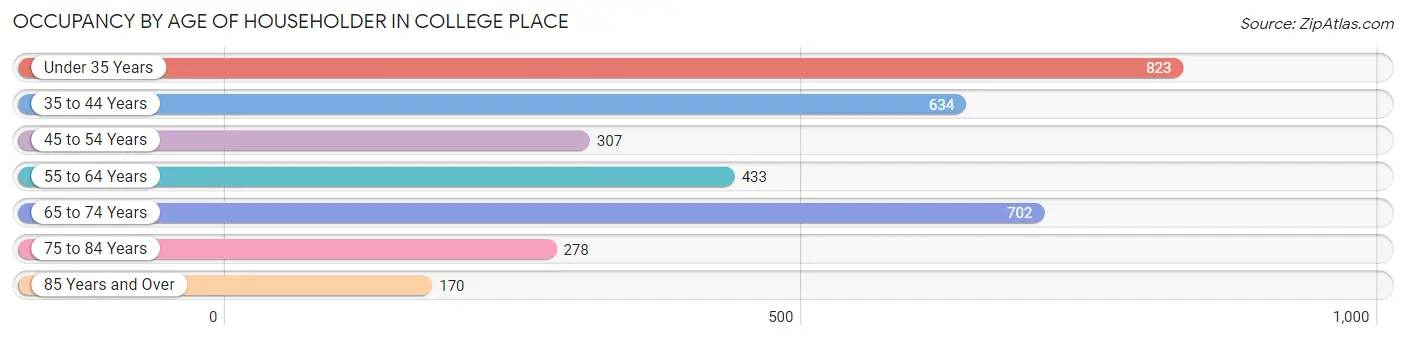
| Age Bracket | # Households | % Households |
| Under 35 Years | 823 | 24.6% |
| 35 to 44 Years | 634 | 18.9% |
| 45 to 54 Years | 307 | 9.2% |
| 55 to 64 Years | 433 | 12.9% |
| 65 to 74 Years | 702 | 21.0% |
| 75 to 84 Years | 278 | 8.3% |
| 85 Years and Over | 170 | 5.1% |
| Total | 3,347 | 100.0% |
Housing Finances in College Place
Median Income by Occupancy in College Place
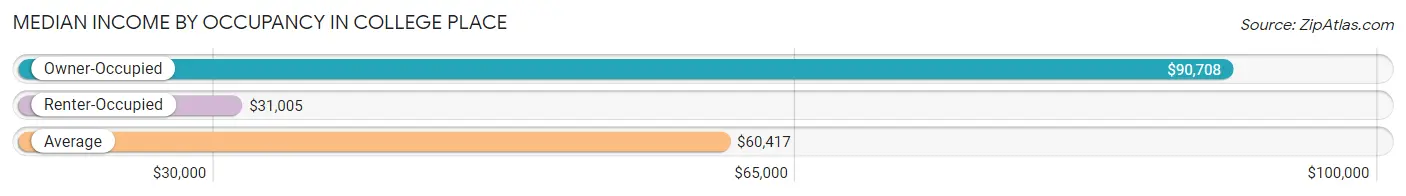
| Occupancy Type | # Households | Median Income |
| Owner-Occupied | 2,193 (65.5%) | $90,708 |
| Renter-Occupied | 1,154 (34.5%) | $31,005 |
| Average | 3,347 (100.0%) | $60,417 |
Occupancy by Householder Income Bracket in College Place
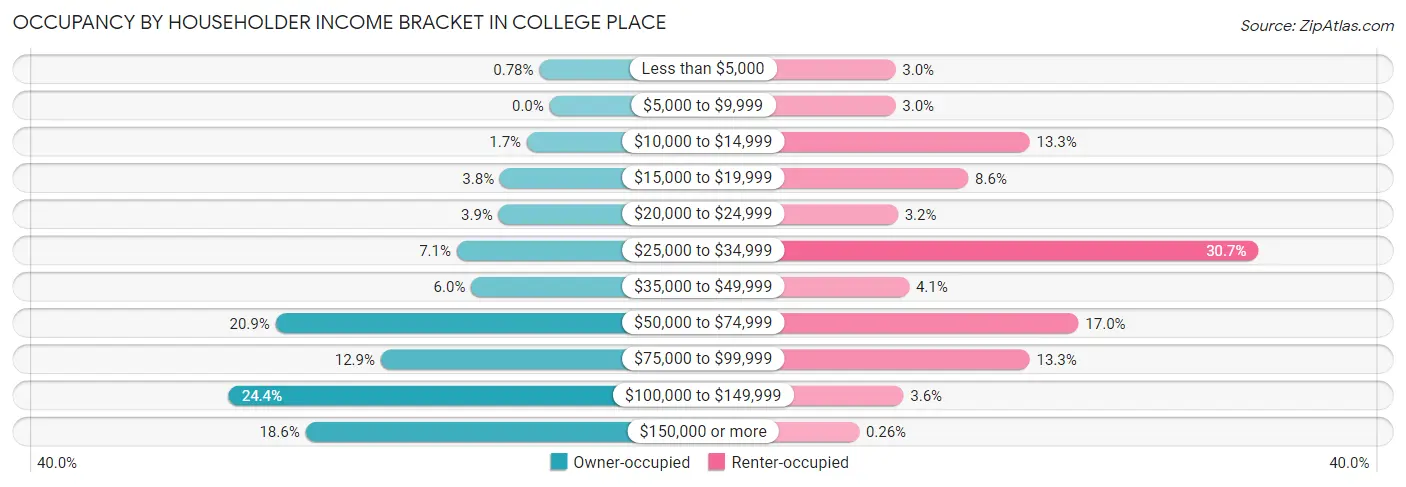
| Income Bracket | Owner-occupied | Renter-occupied |
| Less than $5,000 | 17 (0.8%) | 35 (3.0%) |
| $5,000 to $9,999 | 0 (0.0%) | 35 (3.0%) |
| $10,000 to $14,999 | 38 (1.7%) | 153 (13.3%) |
| $15,000 to $19,999 | 83 (3.8%) | 99 (8.6%) |
| $20,000 to $24,999 | 85 (3.9%) | 37 (3.2%) |
| $25,000 to $34,999 | 155 (7.1%) | 354 (30.7%) |
| $35,000 to $49,999 | 131 (6.0%) | 47 (4.1%) |
| $50,000 to $74,999 | 458 (20.9%) | 196 (17.0%) |
| $75,000 to $99,999 | 282 (12.9%) | 153 (13.3%) |
| $100,000 to $149,999 | 536 (24.4%) | 42 (3.6%) |
| $150,000 or more | 408 (18.6%) | 3 (0.3%) |
| Total | 2,193 (100.0%) | 1,154 (100.0%) |
Monthly Housing Cost Tiers in College Place
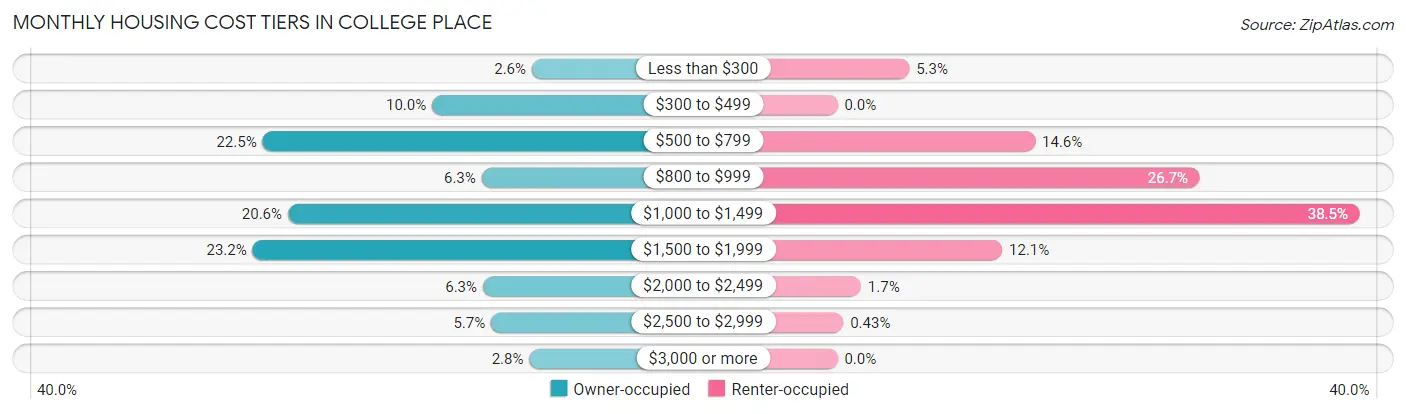
| Monthly Cost | Owner-occupied | Renter-occupied |
| Less than $300 | 58 (2.6%) | 61 (5.3%) |
| $300 to $499 | 219 (10.0%) | 0 (0.0%) |
| $500 to $799 | 493 (22.5%) | 168 (14.6%) |
| $800 to $999 | 139 (6.3%) | 308 (26.7%) |
| $1,000 to $1,499 | 452 (20.6%) | 444 (38.5%) |
| $1,500 to $1,999 | 509 (23.2%) | 140 (12.1%) |
| $2,000 to $2,499 | 137 (6.2%) | 20 (1.7%) |
| $2,500 to $2,999 | 124 (5.7%) | 5 (0.4%) |
| $3,000 or more | 62 (2.8%) | 0 (0.0%) |
| Total | 2,193 (100.0%) | 1,154 (100.0%) |
Physical Housing Characteristics in College Place
Housing Structures in College Place
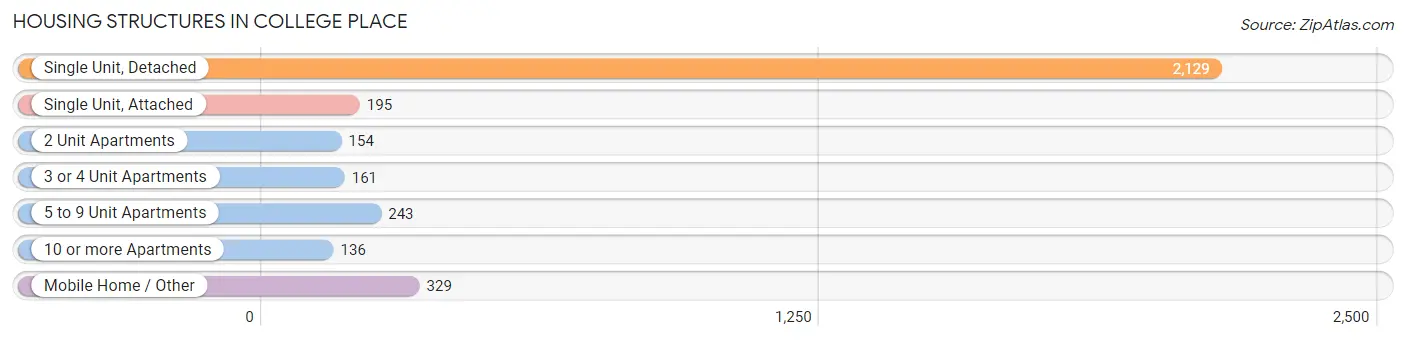
| Structure Type | # Housing Units | % Housing Units |
| Single Unit, Detached | 2,129 | 63.6% |
| Single Unit, Attached | 195 | 5.8% |
| 2 Unit Apartments | 154 | 4.6% |
| 3 or 4 Unit Apartments | 161 | 4.8% |
| 5 to 9 Unit Apartments | 243 | 7.3% |
| 10 or more Apartments | 136 | 4.1% |
| Mobile Home / Other | 329 | 9.8% |
| Total | 3,347 | 100.0% |
Housing Structures by Occupancy in College Place
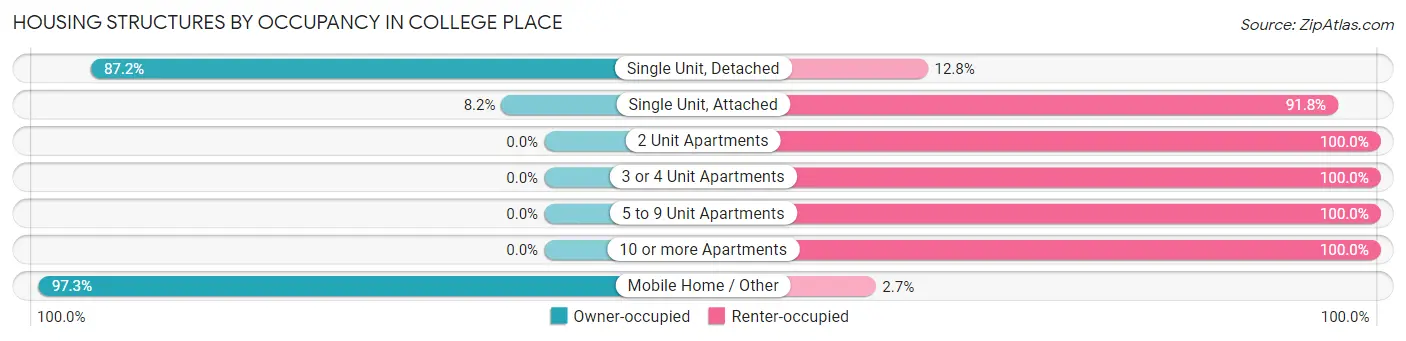
| Structure Type | Owner-occupied | Renter-occupied |
| Single Unit, Detached | 1,857 (87.2%) | 272 (12.8%) |
| Single Unit, Attached | 16 (8.2%) | 179 (91.8%) |
| 2 Unit Apartments | 0 (0.0%) | 154 (100.0%) |
| 3 or 4 Unit Apartments | 0 (0.0%) | 161 (100.0%) |
| 5 to 9 Unit Apartments | 0 (0.0%) | 243 (100.0%) |
| 10 or more Apartments | 0 (0.0%) | 136 (100.0%) |
| Mobile Home / Other | 320 (97.3%) | 9 (2.7%) |
| Total | 2,193 (65.5%) | 1,154 (34.5%) |
Housing Structures by Number of Rooms in College Place
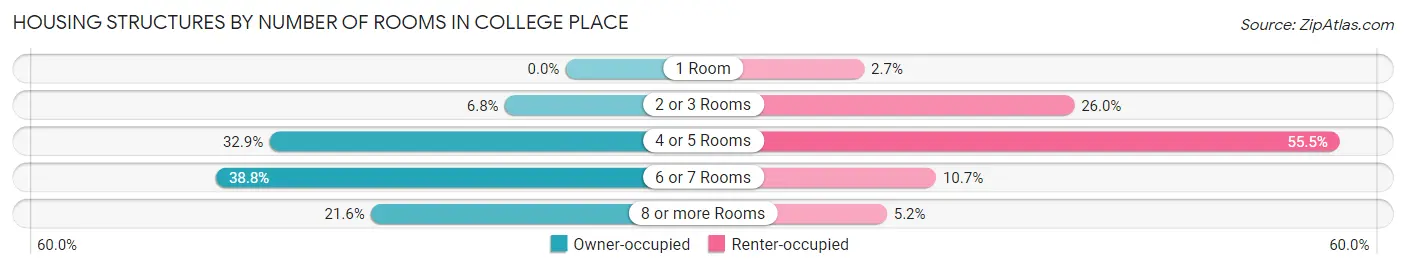
| Number of Rooms | Owner-occupied | Renter-occupied |
| 1 Room | 0 (0.0%) | 31 (2.7%) |
| 2 or 3 Rooms | 148 (6.8%) | 300 (26.0%) |
| 4 or 5 Rooms | 721 (32.9%) | 640 (55.5%) |
| 6 or 7 Rooms | 850 (38.8%) | 123 (10.7%) |
| 8 or more Rooms | 474 (21.6%) | 60 (5.2%) |
| Total | 2,193 (100.0%) | 1,154 (100.0%) |
Housing Structure by Heating Type in College Place
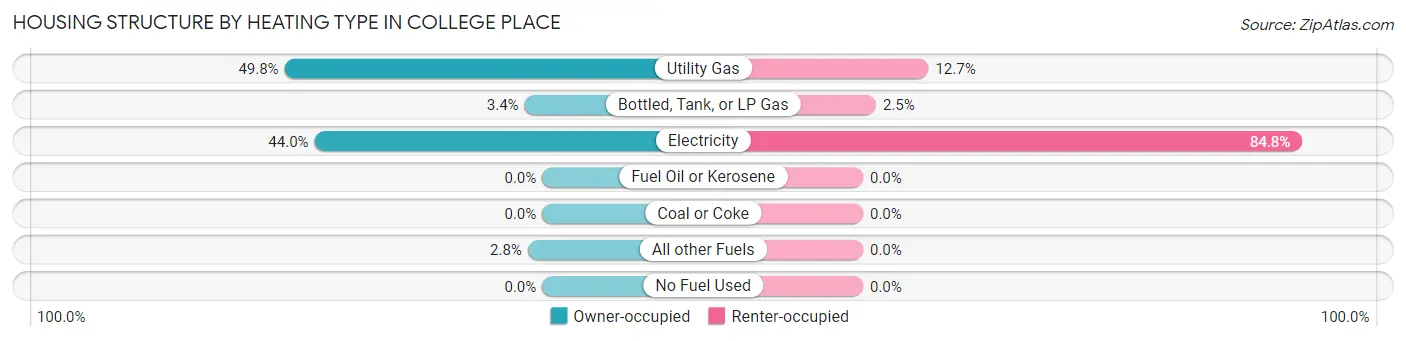
| Heating Type | Owner-occupied | Renter-occupied |
| Utility Gas | 1,092 (49.8%) | 146 (12.7%) |
| Bottled, Tank, or LP Gas | 75 (3.4%) | 29 (2.5%) |
| Electricity | 965 (44.0%) | 979 (84.8%) |
| Fuel Oil or Kerosene | 0 (0.0%) | 0 (0.0%) |
| Coal or Coke | 0 (0.0%) | 0 (0.0%) |
| All other Fuels | 61 (2.8%) | 0 (0.0%) |
| No Fuel Used | 0 (0.0%) | 0 (0.0%) |
| Total | 2,193 (100.0%) | 1,154 (100.0%) |
Household Vehicle Usage in College Place
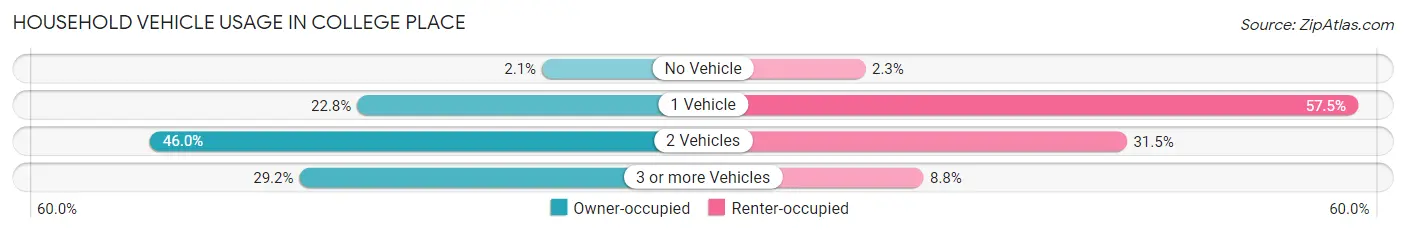
| Vehicles per Household | Owner-occupied | Renter-occupied |
| No Vehicle | 45 (2.1%) | 26 (2.2%) |
| 1 Vehicle | 499 (22.8%) | 663 (57.5%) |
| 2 Vehicles | 1,008 (46.0%) | 364 (31.5%) |
| 3 or more Vehicles | 641 (29.2%) | 101 (8.7%) |
| Total | 2,193 (100.0%) | 1,154 (100.0%) |
Real Estate & Mortgages in College Place
Real Estate and Mortgage Overview in College Place
| Characteristic | Without Mortgage | With Mortgage |
| Housing Units | 865 | 1,328 |
| Median Property Value | $223,400 | $334,700 |
| Median Household Income | $51,679 | $337 |
| Monthly Housing Costs | $560 | $62 |
| Real Estate Taxes | $2,437 | $8 |
Property Value by Mortgage Status in College Place
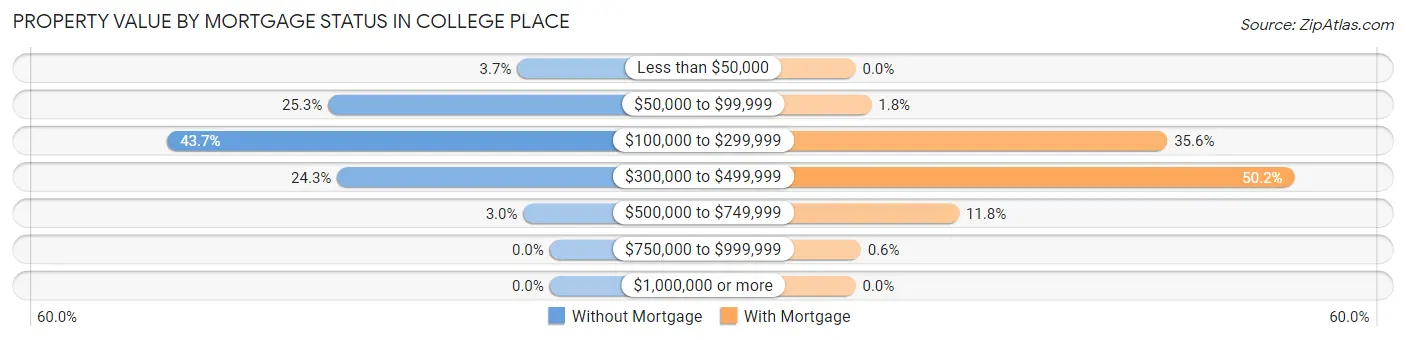
| Property Value | Without Mortgage | With Mortgage |
| Less than $50,000 | 32 (3.7%) | 0 (0.0%) |
| $50,000 to $99,999 | 219 (25.3%) | 24 (1.8%) |
| $100,000 to $299,999 | 378 (43.7%) | 473 (35.6%) |
| $300,000 to $499,999 | 210 (24.3%) | 666 (50.1%) |
| $500,000 to $749,999 | 26 (3.0%) | 157 (11.8%) |
| $750,000 to $999,999 | 0 (0.0%) | 8 (0.6%) |
| $1,000,000 or more | 0 (0.0%) | 0 (0.0%) |
| Total | 865 (100.0%) | 1,328 (100.0%) |
Household Income by Mortgage Status in College Place
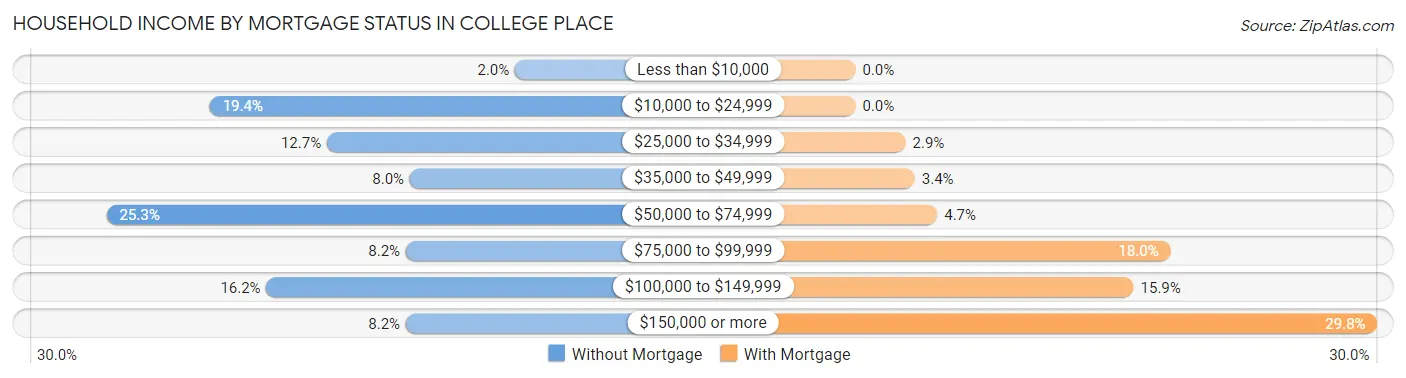
| Household Income | Without Mortgage | With Mortgage |
| Less than $10,000 | 17 (2.0%) | 0 (0.0%) |
| $10,000 to $24,999 | 168 (19.4%) | 0 (0.0%) |
| $25,000 to $34,999 | 110 (12.7%) | 38 (2.9%) |
| $35,000 to $49,999 | 69 (8.0%) | 45 (3.4%) |
| $50,000 to $74,999 | 219 (25.3%) | 62 (4.7%) |
| $75,000 to $99,999 | 71 (8.2%) | 239 (18.0%) |
| $100,000 to $149,999 | 140 (16.2%) | 211 (15.9%) |
| $150,000 or more | 71 (8.2%) | 396 (29.8%) |
| Total | 865 (100.0%) | 1,328 (100.0%) |
Property Value to Household Income Ratio in College Place
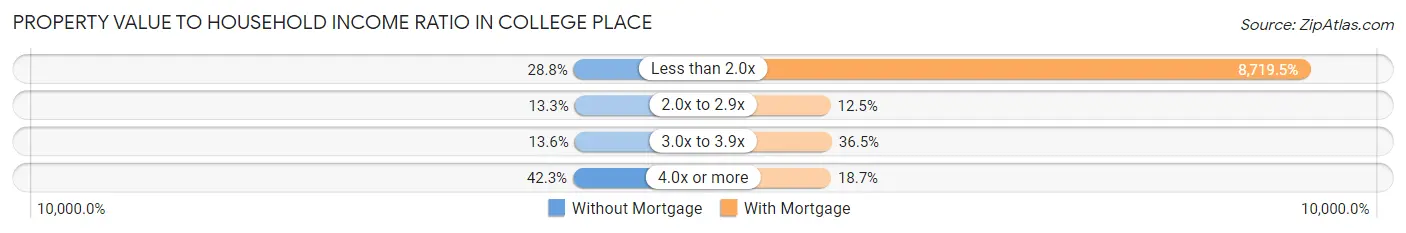
| Value-to-Income Ratio | Without Mortgage | With Mortgage |
| Less than 2.0x | 249 (28.8%) | 115,795 (8,719.5%) |
| 2.0x to 2.9x | 115 (13.3%) | 166 (12.5%) |
| 3.0x to 3.9x | 118 (13.6%) | 485 (36.5%) |
| 4.0x or more | 366 (42.3%) | 248 (18.7%) |
| Total | 865 (100.0%) | 1,328 (100.0%) |
Real Estate Taxes by Mortgage Status in College Place
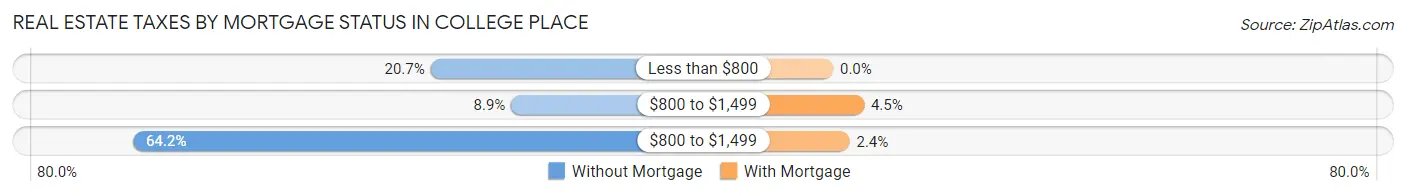
| Property Taxes | Without Mortgage | With Mortgage |
| Less than $800 | 179 (20.7%) | 0 (0.0%) |
| $800 to $1,499 | 77 (8.9%) | 60 (4.5%) |
| $800 to $1,499 | 555 (64.2%) | 32 (2.4%) |
| Total | 865 (100.0%) | 1,328 (100.0%) |
Health & Disability in College Place
Health Insurance Coverage by Age in College Place
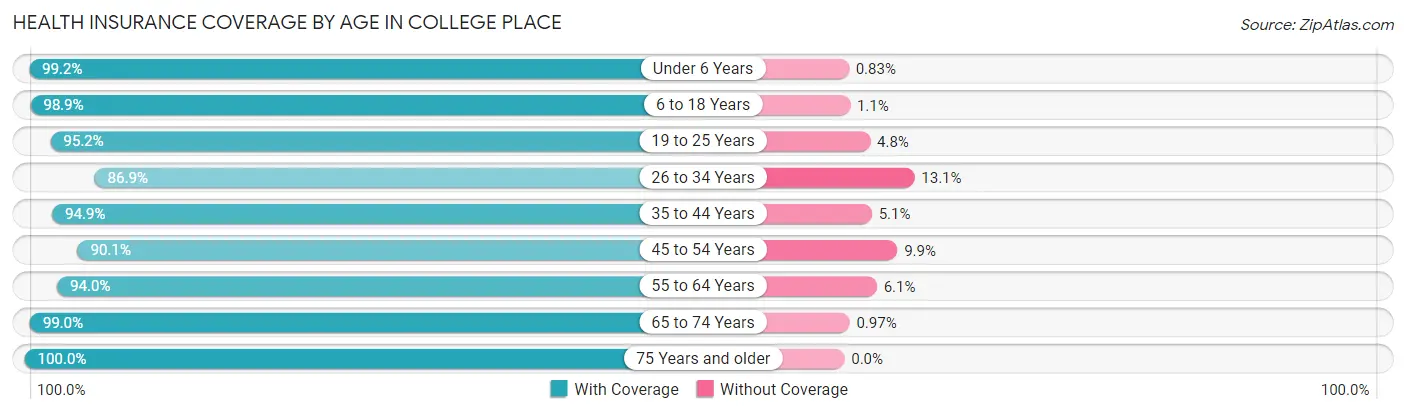
| Age Bracket | With Coverage | Without Coverage |
| Under 6 Years | 717 (99.2%) | 6 (0.8%) |
| 6 to 18 Years | 1,675 (98.9%) | 18 (1.1%) |
| 19 to 25 Years | 1,723 (95.2%) | 87 (4.8%) |
| 26 to 34 Years | 838 (86.9%) | 126 (13.1%) |
| 35 to 44 Years | 1,093 (94.9%) | 59 (5.1%) |
| 45 to 54 Years | 612 (90.1%) | 67 (9.9%) |
| 55 to 64 Years | 776 (94.0%) | 50 (6.0%) |
| 65 to 74 Years | 1,121 (99.0%) | 11 (1.0%) |
| 75 Years and older | 688 (100.0%) | 0 (0.0%) |
| Total | 9,243 (95.6%) | 424 (4.4%) |
Health Insurance Coverage by Citizenship Status in College Place
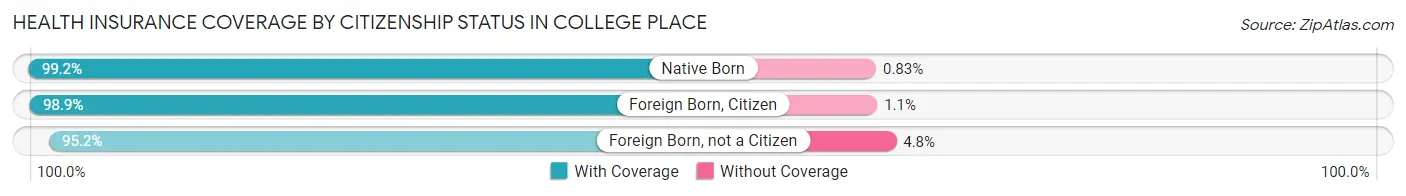
| Citizenship Status | With Coverage | Without Coverage |
| Native Born | 717 (99.2%) | 6 (0.8%) |
| Foreign Born, Citizen | 1,675 (98.9%) | 18 (1.1%) |
| Foreign Born, not a Citizen | 1,723 (95.2%) | 87 (4.8%) |
Health Insurance Coverage by Household Income in College Place
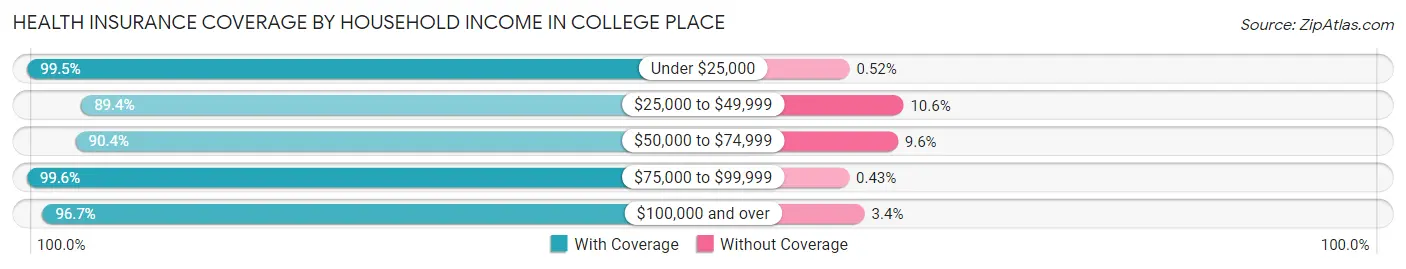
| Household Income | With Coverage | Without Coverage |
| Under $25,000 | 1,155 (99.5%) | 6 (0.5%) |
| $25,000 to $49,999 | 1,094 (89.4%) | 130 (10.6%) |
| $50,000 to $74,999 | 1,257 (90.4%) | 133 (9.6%) |
| $75,000 to $99,999 | 1,387 (99.6%) | 6 (0.4%) |
| $100,000 and over | 3,349 (96.7%) | 116 (3.4%) |
Public vs Private Health Insurance Coverage by Age in College Place
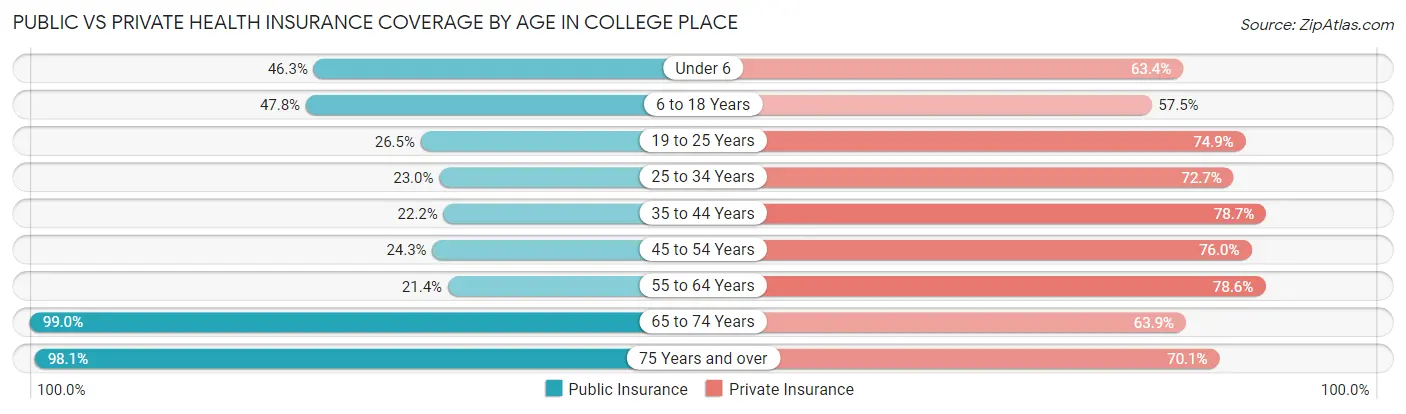
| Age Bracket | Public Insurance | Private Insurance |
| Under 6 | 335 (46.3%) | 458 (63.3%) |
| 6 to 18 Years | 809 (47.8%) | 973 (57.5%) |
| 19 to 25 Years | 479 (26.5%) | 1,356 (74.9%) |
| 25 to 34 Years | 222 (23.0%) | 701 (72.7%) |
| 35 to 44 Years | 256 (22.2%) | 907 (78.7%) |
| 45 to 54 Years | 165 (24.3%) | 516 (76.0%) |
| 55 to 64 Years | 177 (21.4%) | 649 (78.6%) |
| 65 to 74 Years | 1,121 (99.0%) | 723 (63.9%) |
| 75 Years and over | 675 (98.1%) | 482 (70.1%) |
| Total | 4,239 (43.9%) | 6,765 (70.0%) |
Disability Status by Sex by Age in College Place
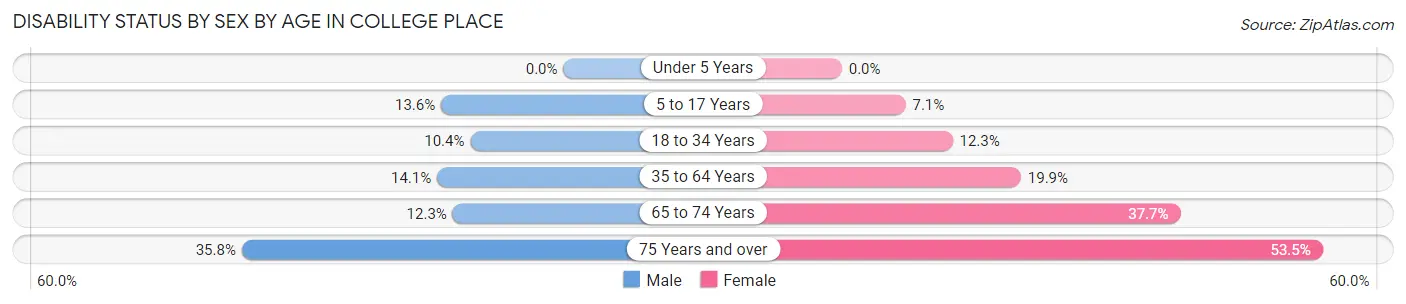
| Age Bracket | Male | Female |
| Under 5 Years | 0 (0.0%) | 0 (0.0%) |
| 5 to 17 Years | 85 (13.6%) | 65 (7.1%) |
| 18 to 34 Years | 158 (10.4%) | 185 (12.3%) |
| 35 to 64 Years | 177 (14.1%) | 279 (19.9%) |
| 65 to 74 Years | 65 (12.3%) | 228 (37.7%) |
| 75 Years and over | 120 (35.8%) | 189 (53.5%) |
Disability Class by Sex by Age in College Place
Disability Class: Hearing Difficulty
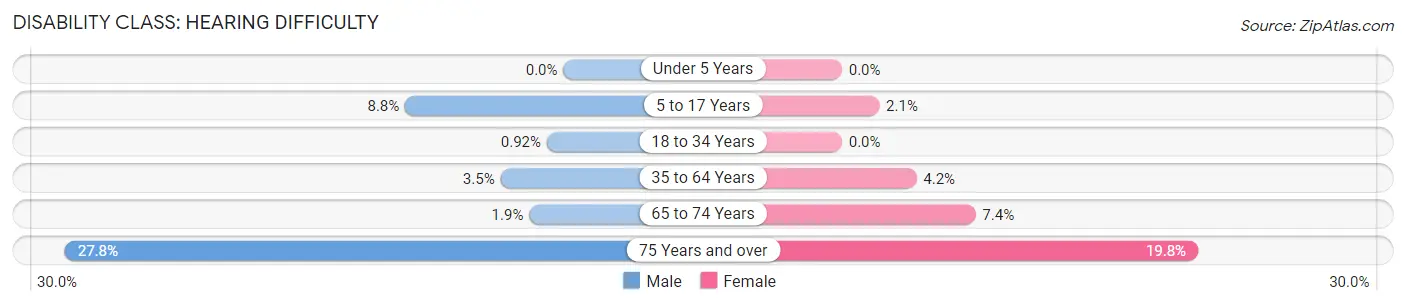
| Age Bracket | Male | Female |
| Under 5 Years | 0 (0.0%) | 0 (0.0%) |
| 5 to 17 Years | 55 (8.8%) | 19 (2.1%) |
| 18 to 34 Years | 14 (0.9%) | 0 (0.0%) |
| 35 to 64 Years | 44 (3.5%) | 58 (4.2%) |
| 65 to 74 Years | 10 (1.9%) | 45 (7.4%) |
| 75 Years and over | 93 (27.8%) | 70 (19.8%) |
Disability Class: Vision Difficulty
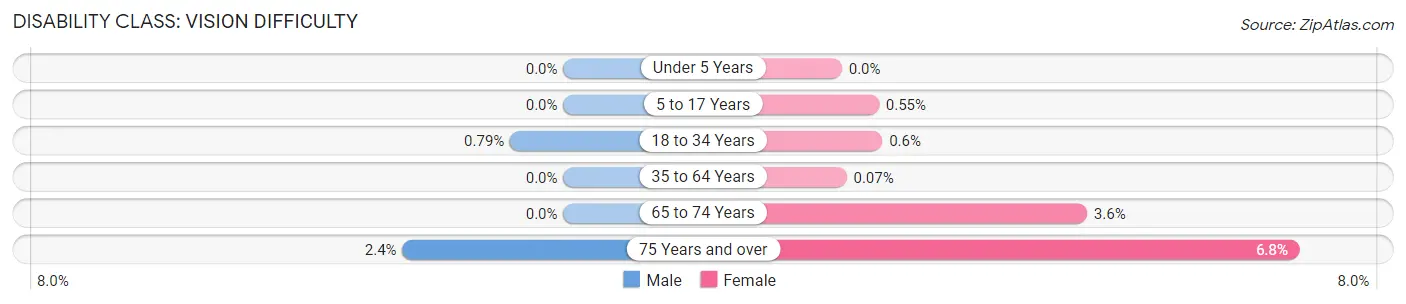
| Age Bracket | Male | Female |
| Under 5 Years | 0 (0.0%) | 0 (0.0%) |
| 5 to 17 Years | 0 (0.0%) | 5 (0.5%) |
| 18 to 34 Years | 12 (0.8%) | 9 (0.6%) |
| 35 to 64 Years | 0 (0.0%) | 1 (0.1%) |
| 65 to 74 Years | 0 (0.0%) | 22 (3.6%) |
| 75 Years and over | 8 (2.4%) | 24 (6.8%) |
Disability Class: Cognitive Difficulty
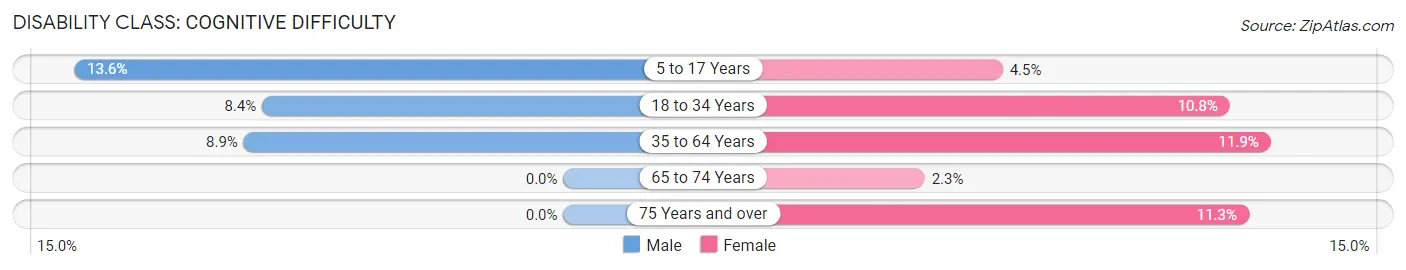
| Age Bracket | Male | Female |
| 5 to 17 Years | 85 (13.6%) | 41 (4.5%) |
| 18 to 34 Years | 128 (8.4%) | 162 (10.8%) |
| 35 to 64 Years | 112 (8.9%) | 167 (11.9%) |
| 65 to 74 Years | 0 (0.0%) | 14 (2.3%) |
| 75 Years and over | 0 (0.0%) | 40 (11.3%) |
Disability Class: Ambulatory Difficulty
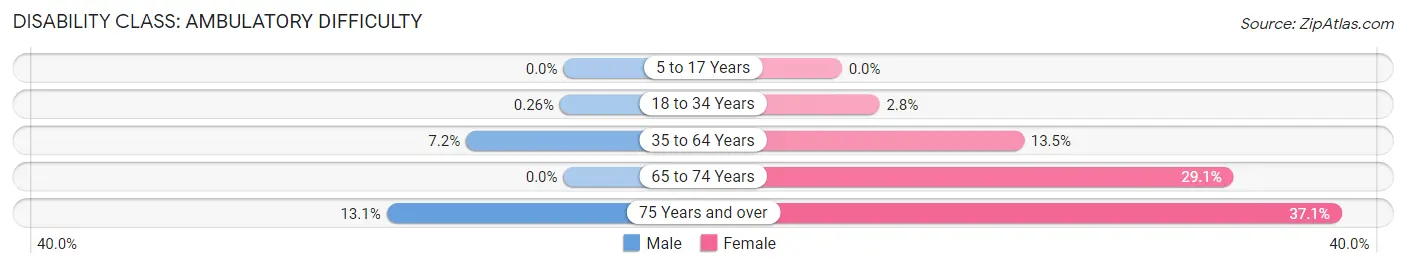
| Age Bracket | Male | Female |
| 5 to 17 Years | 0 (0.0%) | 0 (0.0%) |
| 18 to 34 Years | 4 (0.3%) | 42 (2.8%) |
| 35 to 64 Years | 91 (7.2%) | 189 (13.5%) |
| 65 to 74 Years | 0 (0.0%) | 176 (29.1%) |
| 75 Years and over | 44 (13.1%) | 131 (37.1%) |
Disability Class: Self-Care Difficulty
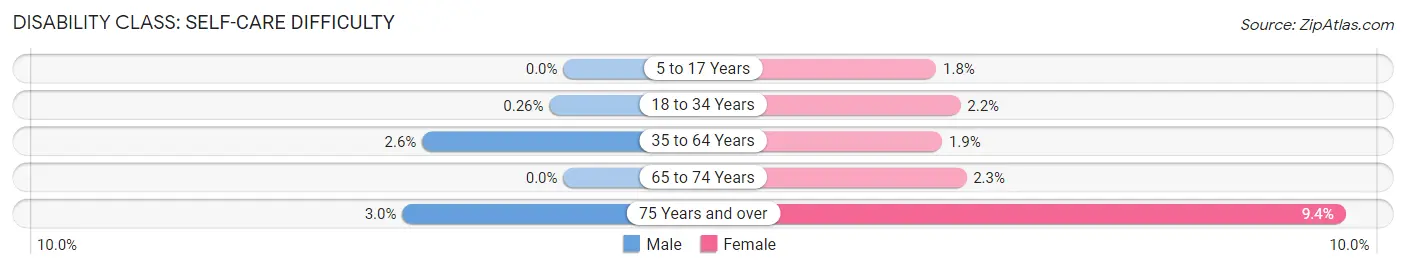
| Age Bracket | Male | Female |
| 5 to 17 Years | 0 (0.0%) | 16 (1.8%) |
| 18 to 34 Years | 4 (0.3%) | 33 (2.2%) |
| 35 to 64 Years | 33 (2.6%) | 26 (1.9%) |
| 65 to 74 Years | 0 (0.0%) | 14 (2.3%) |
| 75 Years and over | 10 (3.0%) | 33 (9.3%) |
Technology Access in College Place
Computing Device Access in College Place
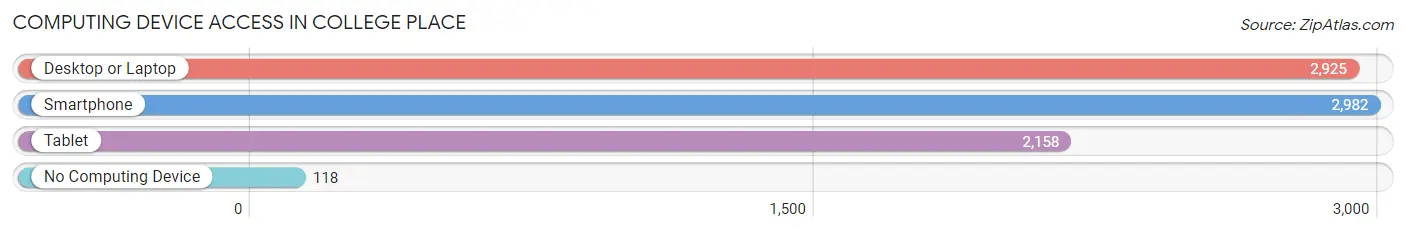
| Device Type | # Households | % Households |
| Desktop or Laptop | 2,925 | 87.4% |
| Smartphone | 2,982 | 89.1% |
| Tablet | 2,158 | 64.5% |
| No Computing Device | 118 | 3.5% |
| Total | 3,347 | 100.0% |
Internet Access in College Place
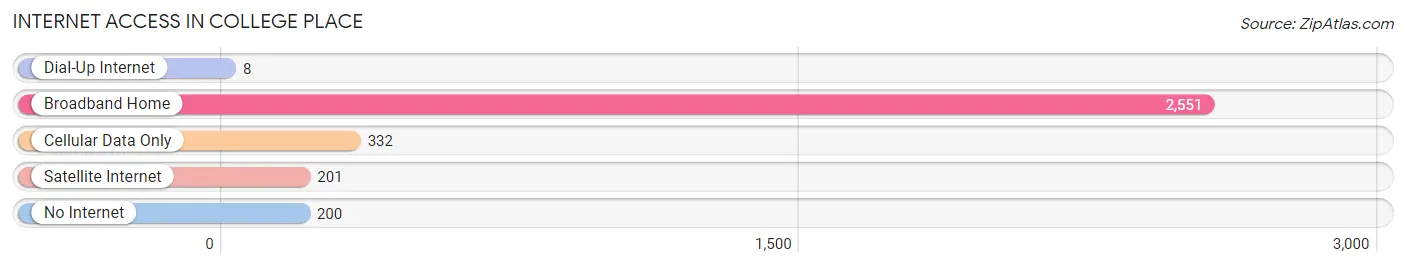
| Internet Type | # Households | % Households |
| Dial-Up Internet | 8 | 0.2% |
| Broadband Home | 2,551 | 76.2% |
| Cellular Data Only | 332 | 9.9% |
| Satellite Internet | 201 | 6.0% |
| No Internet | 200 | 6.0% |
| Total | 3,347 | 100.0% |
College Place Summary
Place History
College Place is a city located in Walla Walla County, Washington, United States. It is part of the Walla Walla metropolitan area. The population was 8,717 at the 2010 census.
The city was founded in 1883 by the College Place Land Company, which was formed by a group of investors from the East Coast. The city was named after the college that was planned to be built in the area. The college never materialized, but the name stuck.
The city was incorporated in 1891 and has since grown to become a thriving community. It is home to Walla Walla University, a private, four-year liberal arts college affiliated with the Seventh-day Adventist Church. The university was founded in 1892 and is the oldest university in the state of Washington.
The city is also home to Walla Walla Community College, a two-year college offering associate degrees and certificates. The college was founded in 1967 and is part of the Washington State Community College system.
Geography
College Place is located at 46°3′25″N 118°17′17″W (46.056944, -118.288333). According to the United States Census Bureau, the city has a total area of 4.2 square miles (10.8 km2), all of it land.
The city is located in the Walla Walla Valley, which is part of the Columbia Plateau. The valley is surrounded by the Blue Mountains to the east and the Wallowa Mountains to the west. The valley is known for its mild climate and fertile soil, which makes it ideal for growing grapes and other crops.
Economy
College Place is a small city with a diverse economy. The city is home to a variety of businesses, including retail stores, restaurants, and professional services. The city is also home to Walla Walla University and Walla Walla Community College, which provide educational opportunities for students.
The city is also home to a number of agricultural businesses, including vineyards, wineries, and farms. The city is known for its wine production, and is home to several wineries and tasting rooms.
Demographics
As of the 2010 census, there were 8,717 people, 3,093 households, and 2,072 families residing in the city. The population density was 2,092.3 people per square mile (806.3/km2). There were 3,309 housing units at an average density of 794.3 per square mile (306.7/km2). The racial makeup of the city was 81.2% White, 0.7% African American, 0.9% Native American, 0.7% Asian, 0.1% Pacific Islander, 14.2% from other races, and 2.2% from two or more races. Hispanic or Latino of any race were 24.2% of the population.
There were 3,093 households, out of which 33.2% had children under the age of 18 living with them, 48.2% were married couples living together, 13.2% had a female householder with no husband present, and 32.2% were non-families. 25.7% of all households were made up of individuals, and 10.2% had someone living alone who was 65 years of age or older. The average household size was 2.71 and the average family size was 3.25.
In the city, the population was spread out, with 27.2% under the age of 18, 15.2% from 18 to 24, 25.2% from 25 to 44, 19.7% from 45 to 64, and 12.7% who were 65 years of age or older. The median age was 32 years. For every 100 females, there were 95.2 males. For every 100 females age 18 and over, there were 91.3 males.
The median income for a household in the city was $35,938, and the median income for a family was $41,944. Males had a median income of $31,944 versus $25,000 for females. The per capita income for the city was $16,945. About 11.2% of families and 15.2% of the population were below the poverty line, including 19.2% of those under age 18 and 8.2% of those age 65 or over.
Common Questions
What is Per Capita Income in College Place?
Per Capita income in College Place is $31,101.
What is the Median Family Income in College Place?
Median Family Income in College Place is $79,884.
What is the Median Household income in College Place?
Median Household Income in College Place is $60,417.
What is Income or Wage Gap in College Place?
Income or Wage Gap in College Place is 45.7%.
Women in College Place earn 54.3 cents for every dollar earned by a man.
What is Family Income Deficit in College Place?
Family Income Deficit in College Place is $9,097.
Families that are below poverty line in College Place earn $9,097 less on average than the poverty threshold level.
What is Inequality or Gini Index in College Place?
Inequality or Gini Index in College Place is 0.45.
What is the Total Population of College Place?
Total Population of College Place is 9,796.
What is the Total Male Population of College Place?
Total Male Population of College Place is 4,546.
What is the Total Female Population of College Place?
Total Female Population of College Place is 5,250.
What is the Ratio of Males per 100 Females in College Place?
There are 86.59 Males per 100 Females in College Place.
What is the Ratio of Females per 100 Males in College Place?
There are 115.49 Females per 100 Males in College Place.
What is the Median Population Age in College Place?
Median Population Age in College Place is 32.2 Years.
What is the Average Family Size in College Place
Average Family Size in College Place is 3.2 People.
What is the Average Household Size in College Place
Average Household Size in College Place is 2.6 People.
How Large is the Labor Force in College Place?
There are 4,666 People in the Labor Forcein in College Place.
What is the Percentage of People in the Labor Force in College Place?
58.9% of People are in the Labor Force in College Place.
What is the Unemployment Rate in College Place?
Unemployment Rate in College Place is 5.6%.