Buckley, WA Map & Demographics
Buckley Map
Buckley Overview
$51,606
PER CAPITA INCOME
$122,011
AVG FAMILY INCOME
$120,707
AVG HOUSEHOLD INCOME
27.3%
WAGE / INCOME GAP [ % ]
72.7¢/ $1
WAGE / INCOME GAP [ $ ]
0.37
INEQUALITY / GINI INDEX
5,191
TOTAL POPULATION
2,481
MALE POPULATION
2,710
FEMALE POPULATION
91.55
MALES / 100 FEMALES
109.23
FEMALES / 100 MALES
41.7
MEDIAN AGE
3.0
AVG FAMILY SIZE
2.6
AVG HOUSEHOLD SIZE
2,568
LABOR FORCE [ PEOPLE ]
61.6%
PERCENT IN LABOR FORCE
2.8%
UNEMPLOYMENT RATE
Buckley Zip Codes
Buckley Area Codes
Income in Buckley
Income Overview in Buckley
Per Capita Income in Buckley is $51,606, while median incomes of families and households are $122,011 and $120,707 respectively.
| Characteristic | Number | Measure |
| Per Capita Income | 5,191 | $51,606 |
| Median Family Income | 1,360 | $122,011 |
| Mean Family Income | 1,360 | $150,111 |
| Median Household Income | 1,896 | $120,707 |
| Mean Household Income | 1,896 | $138,983 |
| Income Deficit | 1,360 | $0 |
| Wage / Income Gap (%) | 5,191 | 27.26% |
| Wage / Income Gap ($) | 5,191 | 72.74¢ per $1 |
| Gini / Inequality Index | 5,191 | 0.37 |
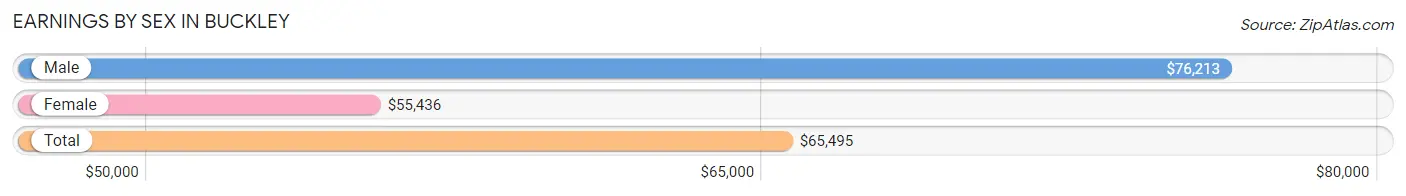
Earnings by Sex in Buckley
Average Earnings in Buckley are $65,495, $76,213 for men and $55,436 for women, a difference of 27.3%.
| Sex | Number | Average Earnings |
| Male | 1,253 (49.2%) | $76,213 |
| Female | 1,295 (50.8%) | $55,436 |
| Total | 2,548 (100.0%) | $65,495 |
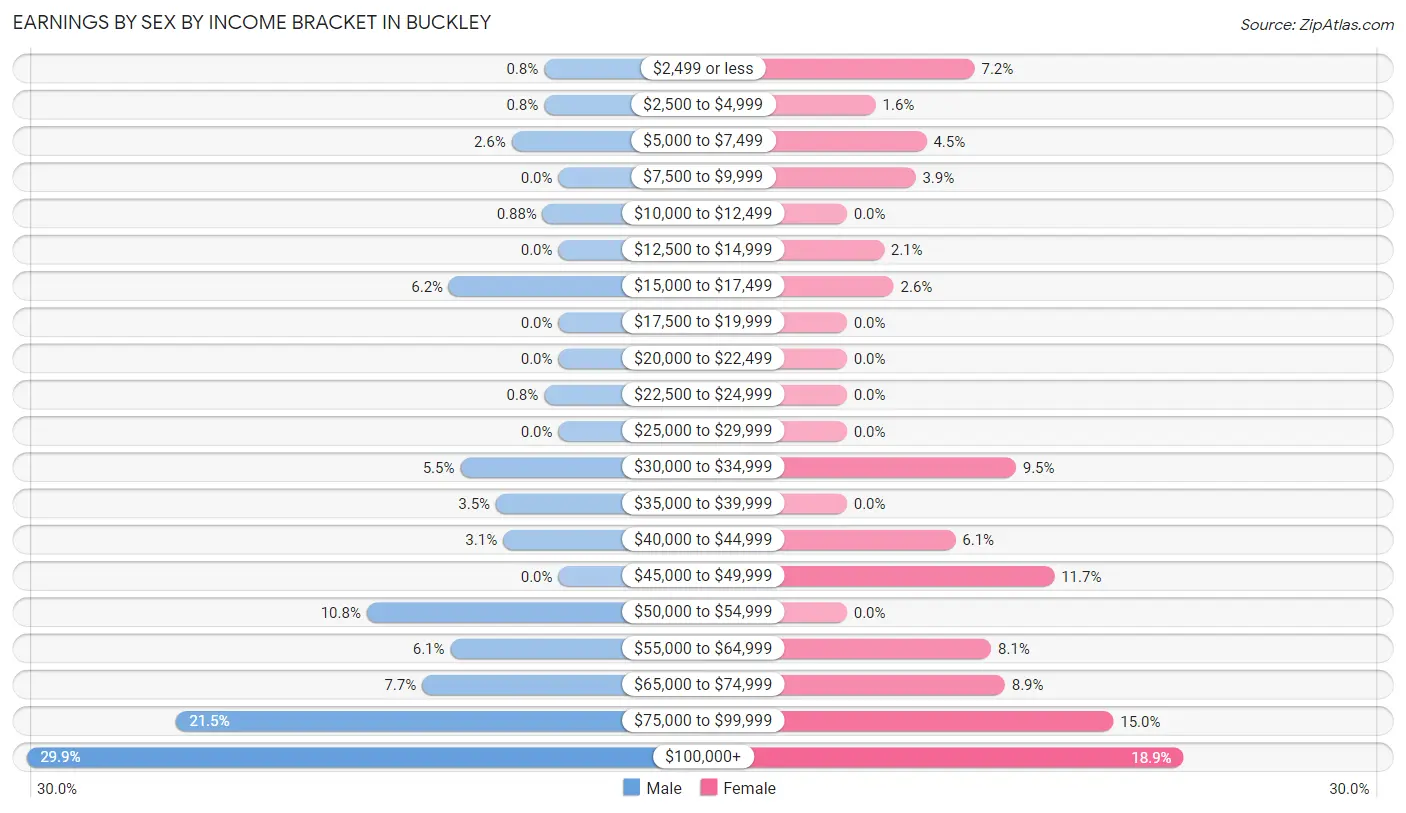
Earnings by Sex by Income Bracket in Buckley
The most common earnings brackets in Buckley are $100,000+ for men (374 | 29.8%) and $100,000+ for women (245 | 18.9%).
| Income | Male | Female |
| $2,499 or less | 10 (0.8%) | 93 (7.2%) |
| $2,500 to $4,999 | 10 (0.8%) | 21 (1.6%) |
| $5,000 to $7,499 | 33 (2.6%) | 58 (4.5%) |
| $7,500 to $9,999 | 0 (0.0%) | 50 (3.9%) |
| $10,000 to $12,499 | 11 (0.9%) | 0 (0.0%) |
| $12,500 to $14,999 | 0 (0.0%) | 27 (2.1%) |
| $15,000 to $17,499 | 77 (6.1%) | 34 (2.6%) |
| $17,500 to $19,999 | 0 (0.0%) | 0 (0.0%) |
| $20,000 to $22,499 | 0 (0.0%) | 0 (0.0%) |
| $22,500 to $24,999 | 10 (0.8%) | 0 (0.0%) |
| $25,000 to $29,999 | 0 (0.0%) | 0 (0.0%) |
| $30,000 to $34,999 | 69 (5.5%) | 123 (9.5%) |
| $35,000 to $39,999 | 44 (3.5%) | 0 (0.0%) |
| $40,000 to $44,999 | 39 (3.1%) | 79 (6.1%) |
| $45,000 to $49,999 | 0 (0.0%) | 151 (11.7%) |
| $50,000 to $54,999 | 135 (10.8%) | 0 (0.0%) |
| $55,000 to $64,999 | 76 (6.1%) | 105 (8.1%) |
| $65,000 to $74,999 | 96 (7.7%) | 115 (8.9%) |
| $75,000 to $99,999 | 269 (21.5%) | 194 (15.0%) |
| $100,000+ | 374 (29.8%) | 245 (18.9%) |
| Total | 1,253 (100.0%) | 1,295 (100.0%) |
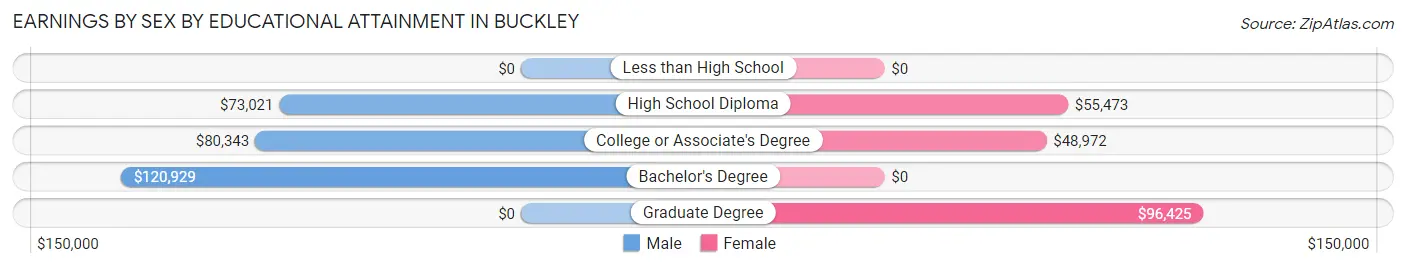
Earnings by Sex by Educational Attainment in Buckley
Average earnings in Buckley are $82,377 for men and $64,352 for women, a difference of 21.9%. Men with an educational attainment of bachelor's degree enjoy the highest average annual earnings of $120,929, while those with high school diploma education earn the least with $73,021. Women with an educational attainment of graduate degree earn the most with the average annual earnings of $96,425, while those with college or associate's degree education have the smallest earnings of $48,972.
| Educational Attainment | Male Income | Female Income |
| Less than High School | - | - |
| High School Diploma | $73,021 | $55,473 |
| College or Associate's Degree | $80,343 | $48,972 |
| Bachelor's Degree | $120,929 | $0 |
| Graduate Degree | - | - |
| Total | $82,377 | $64,352 |
Family Income in Buckley
Family Income Brackets in Buckley
According to the Buckley family income data, there are 441 families falling into the $100,000 to $149,999 income range, which is the most common income bracket and makes up 32.4% of all families.
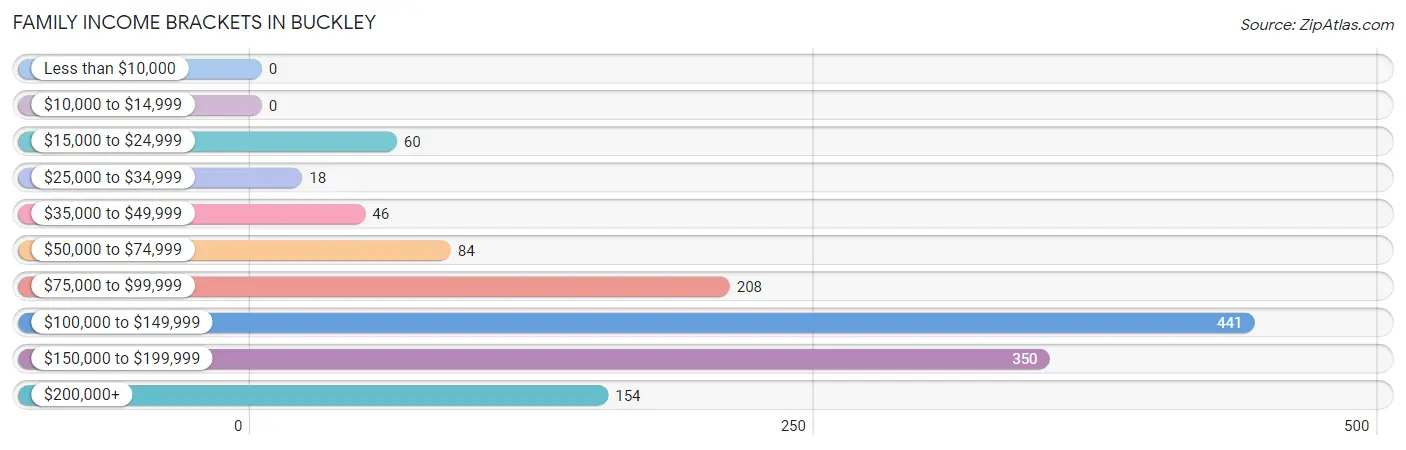
| Income Bracket | # Families | % Families |
| Less than $10,000 | 0 | 0.0% |
| $10,000 to $14,999 | 0 | 0.0% |
| $15,000 to $24,999 | 60 | 4.4% |
| $25,000 to $34,999 | 18 | 1.3% |
| $35,000 to $49,999 | 46 | 3.4% |
| $50,000 to $74,999 | 84 | 6.2% |
| $75,000 to $99,999 | 208 | 15.3% |
| $100,000 to $149,999 | 441 | 32.4% |
| $150,000 to $199,999 | 350 | 25.7% |
| $200,000+ | 154 | 11.3% |
Family Income by Famaliy Size in Buckley
5-person families (174 | 12.8%) account for the highest median family income in Buckley with $197,993 per family, while 2-person families (605 | 44.5%) have the highest median income of $60,632 per family member.
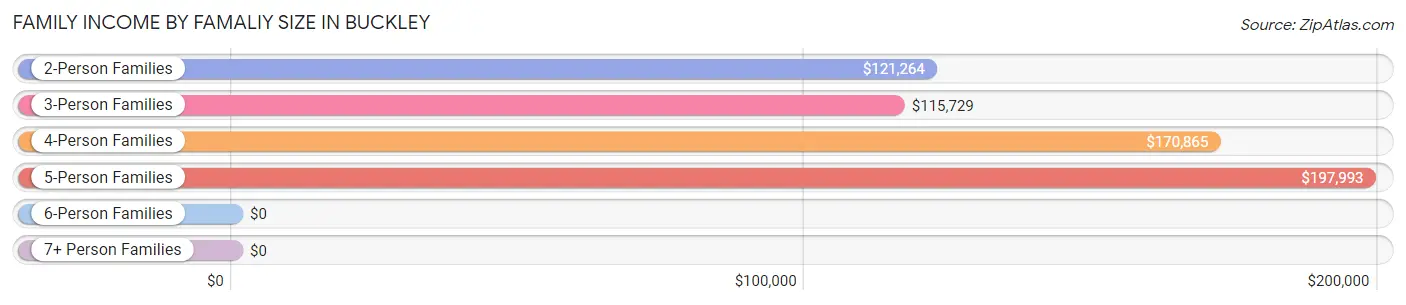
| Income Bracket | # Families | Median Income |
| 2-Person Families | 605 (44.5%) | $121,264 |
| 3-Person Families | 366 (26.9%) | $115,729 |
| 4-Person Families | 190 (14.0%) | $170,865 |
| 5-Person Families | 174 (12.8%) | $197,993 |
| 6-Person Families | 25 (1.8%) | $0 |
| 7+ Person Families | 0 (0.0%) | $0 |
| Total | 1,360 (100.0%) | $122,011 |
Family Income by Number of Earners in Buckley
The median family income in Buckley is $122,011, with families comprising 2 earners (588) having the highest median family income of $156,750, while families with no earners (234) have the lowest median family income of $81,806, accounting for 43.2% and 17.2% of families, respectively.
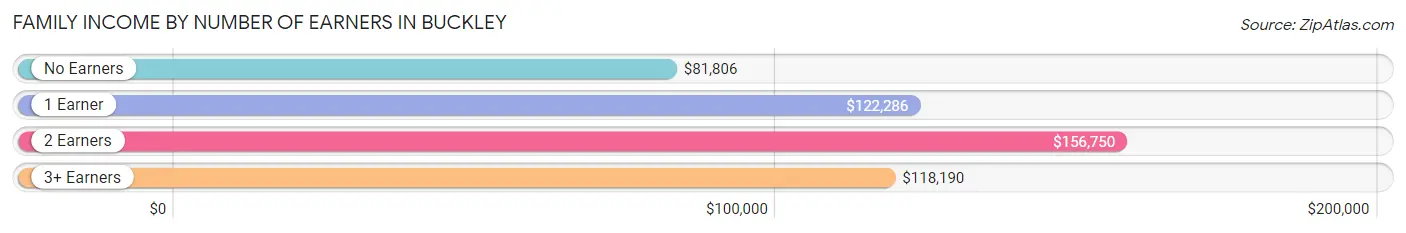
| Number of Earners | # Families | Median Income |
| No Earners | 234 (17.2%) | $81,806 |
| 1 Earner | 378 (27.8%) | $122,286 |
| 2 Earners | 588 (43.2%) | $156,750 |
| 3+ Earners | 160 (11.8%) | $118,190 |
| Total | 1,360 (100.0%) | $122,011 |
Household Income in Buckley
Household Income Brackets in Buckley
With 523 households falling in the category, the $100,000 to $149,999 income range is the most frequent in Buckley, accounting for 27.6% of all households.
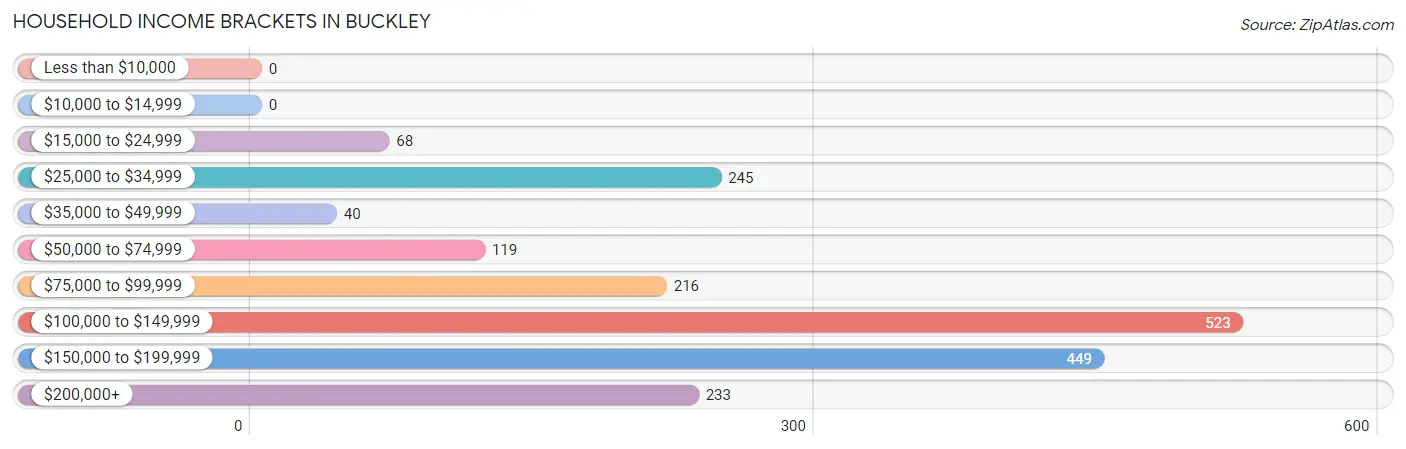
| Income Bracket | # Households | % Households |
| Less than $10,000 | 0 | 0.0% |
| $10,000 to $14,999 | 0 | 0.0% |
| $15,000 to $24,999 | 68 | 3.6% |
| $25,000 to $34,999 | 245 | 12.9% |
| $35,000 to $49,999 | 40 | 2.1% |
| $50,000 to $74,999 | 119 | 6.3% |
| $75,000 to $99,999 | 216 | 11.4% |
| $100,000 to $149,999 | 523 | 27.6% |
| $150,000 to $199,999 | 449 | 23.7% |
| $200,000+ | 233 | 12.3% |
Household Income by Householder Age in Buckley
The median household income in Buckley is $120,707, with the highest median household income of $144,667 found in the 45 to 64 years age bracket for the primary householder. A total of 486 households (25.6%) fall into this category. Meanwhile, the 15 to 24 years age bracket for the primary householder has the lowest median household income of $0, with 44 households (2.3%) in this group.
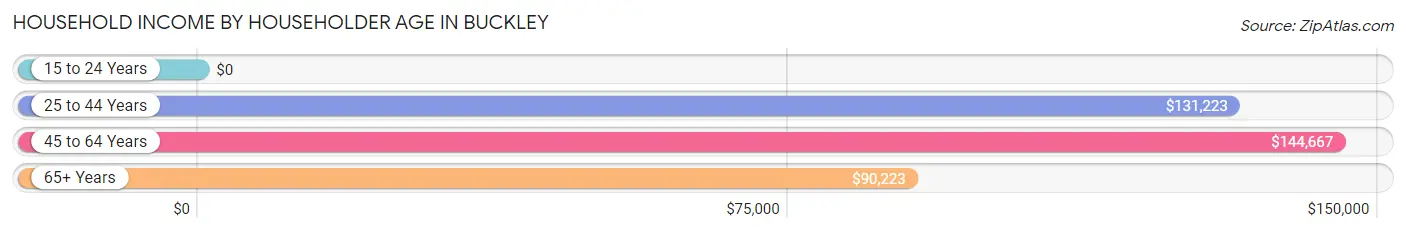
| Income Bracket | # Households | Median Income |
| 15 to 24 Years | 44 (2.3%) | $0 |
| 25 to 44 Years | 735 (38.8%) | $131,223 |
| 45 to 64 Years | 486 (25.6%) | $144,667 |
| 65+ Years | 631 (33.3%) | $90,223 |
| Total | 1,896 (100.0%) | $120,707 |
Poverty in Buckley
Income Below Poverty by Sex and Age in Buckley
With 5.4% poverty level for males and 3.3% for females among the residents of Buckley, 25 to 34 year old males and 18 to 24 year old females are the most vulnerable to poverty, with 39 males (22.4%) and 50 females (20.5%) in their respective age groups living below the poverty level.
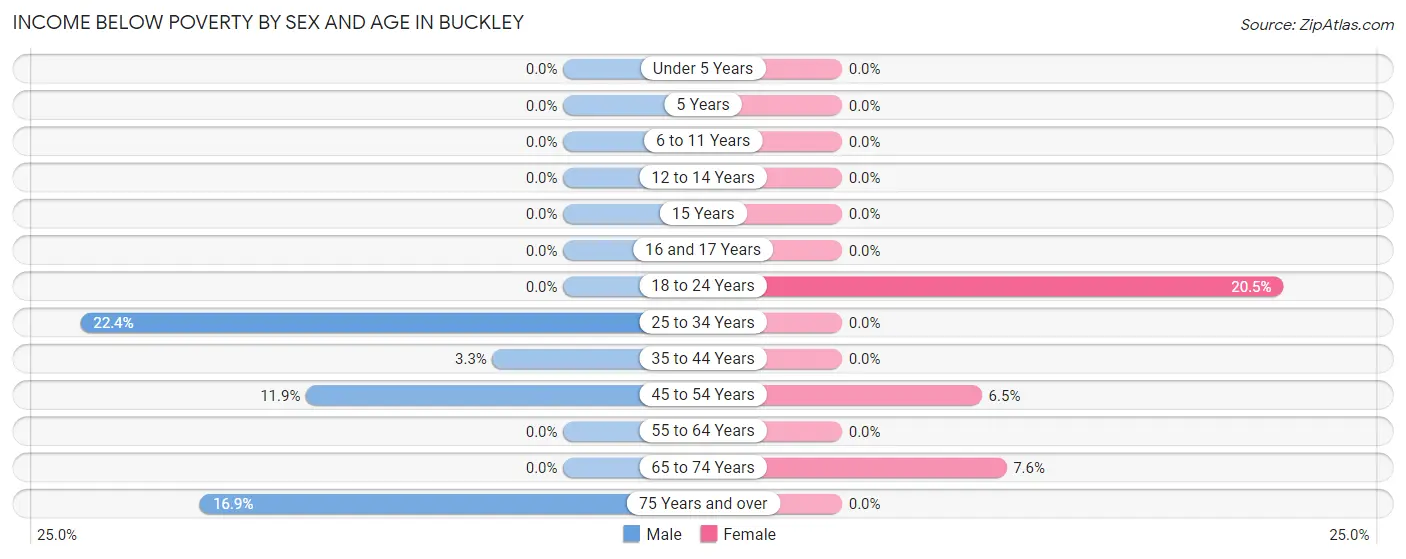
| Age Bracket | Male | Female |
| Under 5 Years | 0 (0.0%) | 0 (0.0%) |
| 5 Years | 0 (0.0%) | 0 (0.0%) |
| 6 to 11 Years | 0 (0.0%) | 0 (0.0%) |
| 12 to 14 Years | 0 (0.0%) | 0 (0.0%) |
| 15 Years | 0 (0.0%) | 0 (0.0%) |
| 16 and 17 Years | 0 (0.0%) | 0 (0.0%) |
| 18 to 24 Years | 0 (0.0%) | 50 (20.5%) |
| 25 to 34 Years | 39 (22.4%) | 0 (0.0%) |
| 35 to 44 Years | 20 (3.3%) | 0 (0.0%) |
| 45 to 54 Years | 29 (11.9%) | 20 (6.5%) |
| 55 to 64 Years | 0 (0.0%) | 0 (0.0%) |
| 65 to 74 Years | 0 (0.0%) | 20 (7.6%) |
| 75 Years and over | 44 (16.9%) | 0 (0.0%) |
| Total | 132 (5.4%) | 90 (3.3%) |
Income Above Poverty by Sex and Age in Buckley
According to the poverty statistics in Buckley, males aged under 5 years and females aged under 5 years are the age groups that are most secure financially, with 100.0% of males and 100.0% of females in these age groups living above the poverty line.
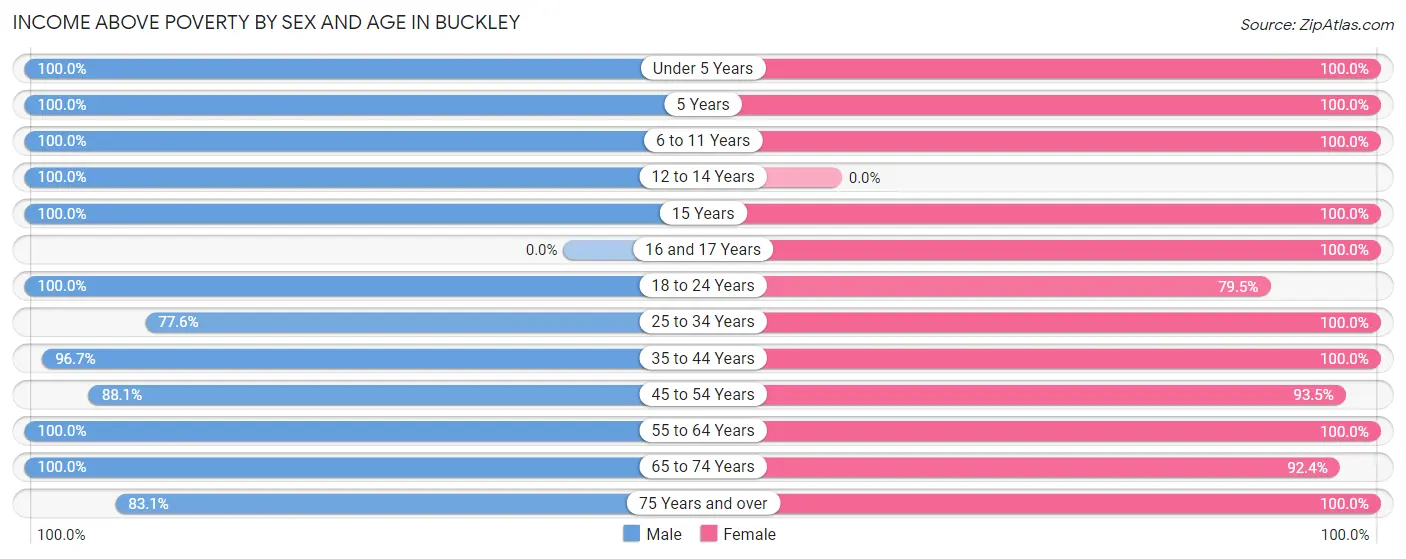
| Age Bracket | Male | Female |
| Under 5 Years | 79 (100.0%) | 184 (100.0%) |
| 5 Years | 25 (100.0%) | 42 (100.0%) |
| 6 to 11 Years | 224 (100.0%) | 183 (100.0%) |
| 12 to 14 Years | 192 (100.0%) | 0 (0.0%) |
| 15 Years | 28 (100.0%) | 65 (100.0%) |
| 16 and 17 Years | 0 (0.0%) | 20 (100.0%) |
| 18 to 24 Years | 147 (100.0%) | 194 (79.5%) |
| 25 to 34 Years | 135 (77.6%) | 307 (100.0%) |
| 35 to 44 Years | 589 (96.7%) | 417 (100.0%) |
| 45 to 54 Years | 214 (88.1%) | 288 (93.5%) |
| 55 to 64 Years | 218 (100.0%) | 329 (100.0%) |
| 65 to 74 Years | 249 (100.0%) | 242 (92.4%) |
| 75 Years and over | 217 (83.1%) | 339 (100.0%) |
| Total | 2,317 (94.6%) | 2,610 (96.7%) |
Income Below Poverty Among Married-Couple Families in Buckley
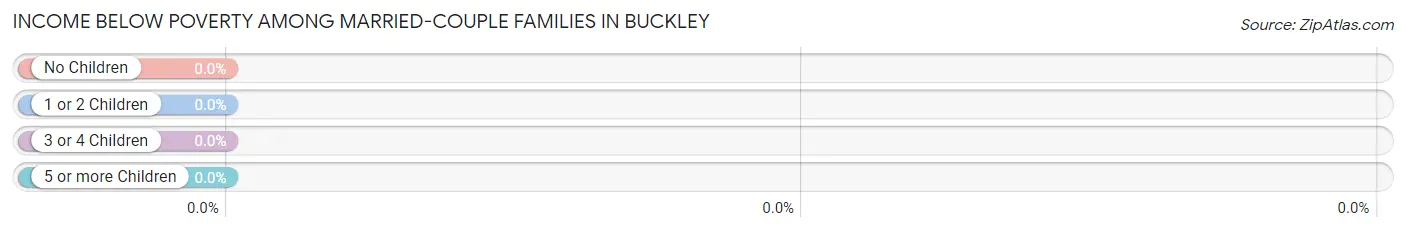
| Children | Above Poverty | Below Poverty |
| No Children | 674 (100.0%) | 0 (0.0%) |
| 1 or 2 Children | 369 (100.0%) | 0 (0.0%) |
| 3 or 4 Children | 112 (100.0%) | 0 (0.0%) |
| 5 or more Children | 0 (0.0%) | 0 (0.0%) |
| Total | 1,155 (100.0%) | 0 (0.0%) |
Income Below Poverty Among Single-Parent Households in Buckley
| Children | Single Father | Single Mother |
| No Children | 0 (0.0%) | 0 (0.0%) |
| 1 or 2 Children | 0 (0.0%) | 0 (0.0%) |
| 3 or 4 Children | 0 (0.0%) | 0 (0.0%) |
| 5 or more Children | 0 (0.0%) | 0 (0.0%) |
| Total | 0 (0.0%) | 0 (0.0%) |
Income Below Poverty Among Married-Couple vs Single-Parent Households in Buckley
| Children | Married-Couple Families | Single-Parent Households |
| No Children | 0 (0.0%) | 0 (0.0%) |
| 1 or 2 Children | 0 (0.0%) | 0 (0.0%) |
| 3 or 4 Children | 0 (0.0%) | 0 (0.0%) |
| 5 or more Children | 0 (0.0%) | 0 (0.0%) |
| Total | 0 (0.0%) | 0 (0.0%) |
Race in Buckley
The most populous races in Buckley are White / Caucasian (4,829 | 93.0%), Two or more Races (229 | 4.4%), and Hispanic or Latino (224 | 4.3%).
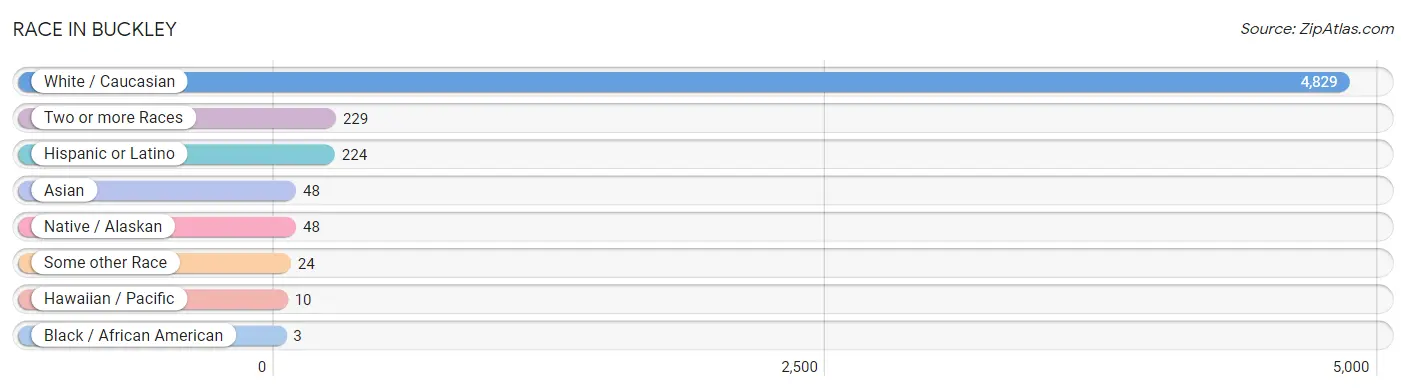
| Race | # Population | % Population |
| Asian | 48 | 0.9% |
| Black / African American | 3 | 0.1% |
| Hawaiian / Pacific | 10 | 0.2% |
| Hispanic or Latino | 224 | 4.3% |
| Native / Alaskan | 48 | 0.9% |
| White / Caucasian | 4,829 | 93.0% |
| Two or more Races | 229 | 4.4% |
| Some other Race | 24 | 0.5% |
| Total | 5,191 | 100.0% |
Ancestry in Buckley
The most populous ancestries reported in Buckley are German (634 | 12.2%), English (516 | 9.9%), Irish (472 | 9.1%), French (210 | 4.1%), and Norwegian (210 | 4.1%), together accounting for 39.3% of all Buckley residents.
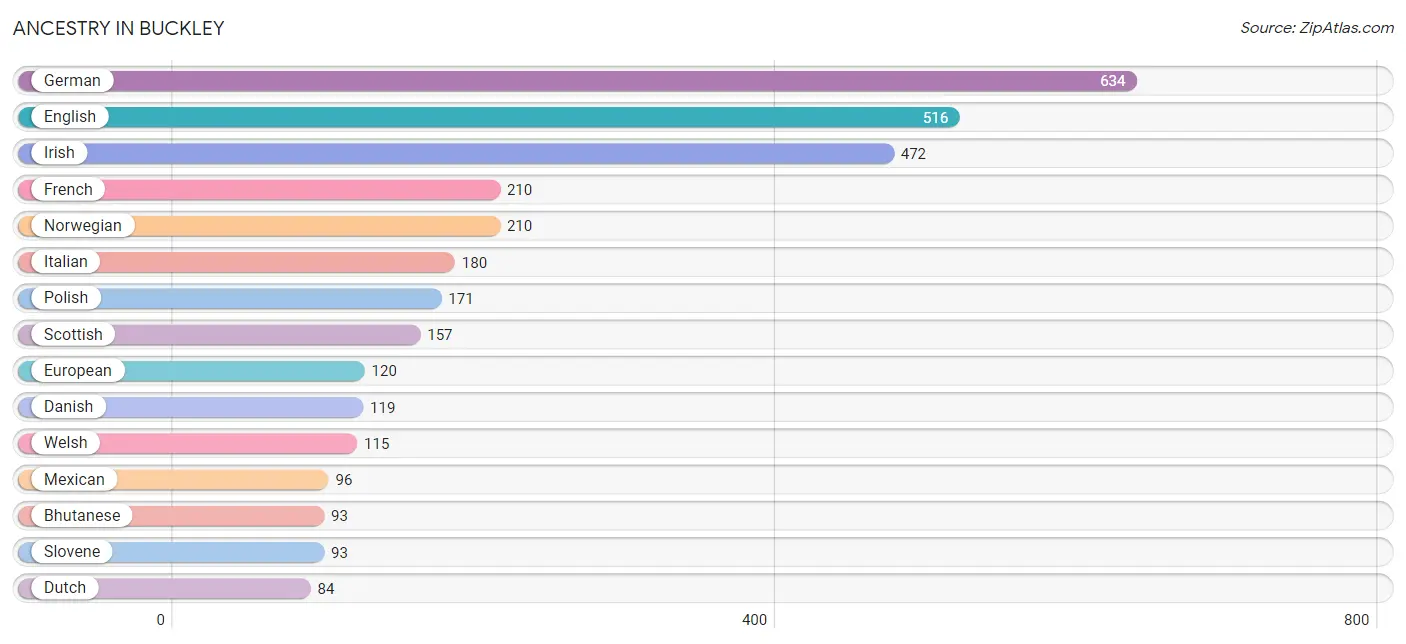
| Ancestry | # Population | % Population |
| American | 11 | 0.2% |
| Austrian | 9 | 0.2% |
| Belgian | 30 | 0.6% |
| Bhutanese | 93 | 1.8% |
| British | 20 | 0.4% |
| Central American | 17 | 0.3% |
| Central American Indian | 17 | 0.3% |
| Danish | 119 | 2.3% |
| Dutch | 84 | 1.6% |
| English | 516 | 9.9% |
| European | 120 | 2.3% |
| Finnish | 25 | 0.5% |
| French | 210 | 4.1% |
| French Canadian | 29 | 0.6% |
| German | 634 | 12.2% |
| Icelander | 28 | 0.5% |
| Irish | 472 | 9.1% |
| Italian | 180 | 3.5% |
| Korean | 29 | 0.6% |
| Mexican | 96 | 1.8% |
| Northern European | 31 | 0.6% |
| Norwegian | 210 | 4.1% |
| Pakistani | 29 | 0.6% |
| Polish | 171 | 3.3% |
| Portuguese | 16 | 0.3% |
| Salvadoran | 17 | 0.3% |
| Scandinavian | 25 | 0.5% |
| Scotch-Irish | 16 | 0.3% |
| Scottish | 157 | 3.0% |
| Slovene | 93 | 1.8% |
| Spaniard | 71 | 1.4% |
| Sri Lankan | 4 | 0.1% |
| Swedish | 28 | 0.5% |
| Swiss | 65 | 1.3% |
| Tongan | 25 | 0.5% |
| Ukrainian | 9 | 0.2% |
| Welsh | 115 | 2.2% | View All 37 Rows |
Immigrants in Buckley
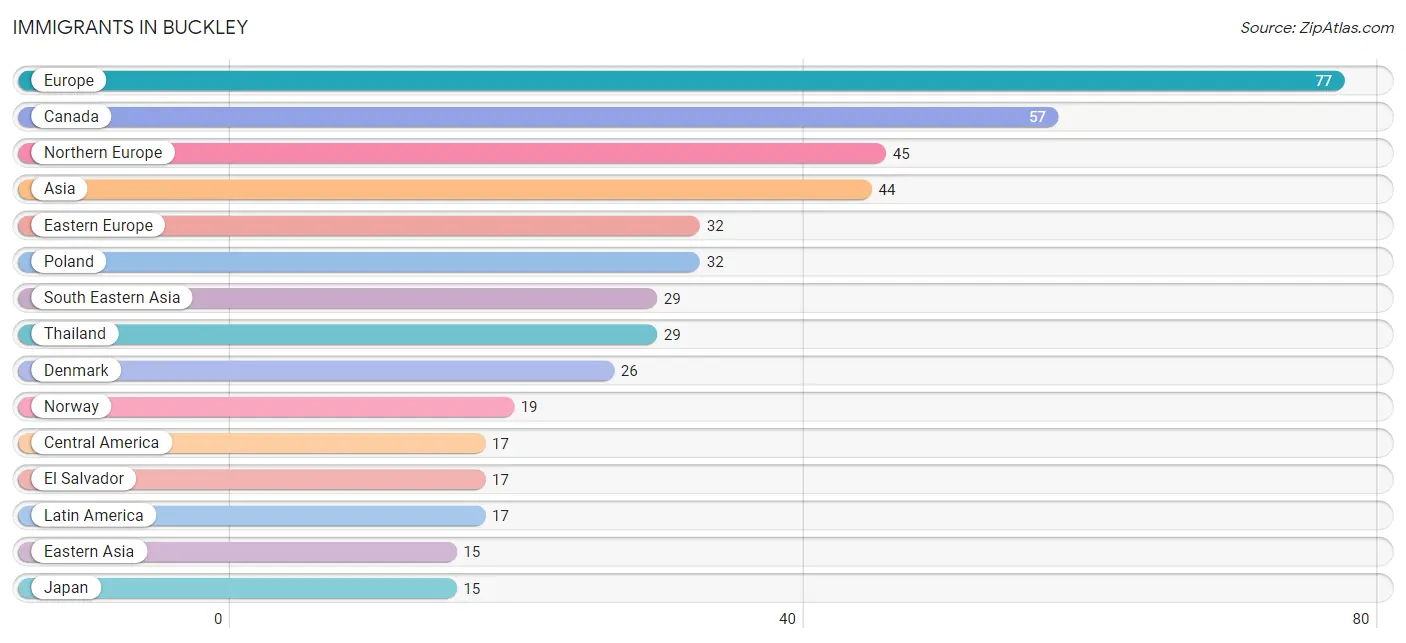
The most numerous immigrant groups reported in Buckley came from Europe (77 | 1.5%), Canada (57 | 1.1%), Northern Europe (45 | 0.9%), Asia (44 | 0.9%), and Eastern Europe (32 | 0.6%), together accounting for 4.9% of all Buckley residents.
| Immigration Origin | # Population | % Population |
| Asia | 44 | 0.9% |
| Canada | 57 | 1.1% |
| Central America | 17 | 0.3% |
| Denmark | 26 | 0.5% |
| Eastern Asia | 15 | 0.3% |
| Eastern Europe | 32 | 0.6% |
| El Salvador | 17 | 0.3% |
| Europe | 77 | 1.5% |
| Japan | 15 | 0.3% |
| Latin America | 17 | 0.3% |
| Northern Europe | 45 | 0.9% |
| Norway | 19 | 0.4% |
| Poland | 32 | 0.6% |
| South Eastern Asia | 29 | 0.6% |
| Thailand | 29 | 0.6% | View All 15 Rows |
Sex and Age in Buckley
Sex and Age in Buckley
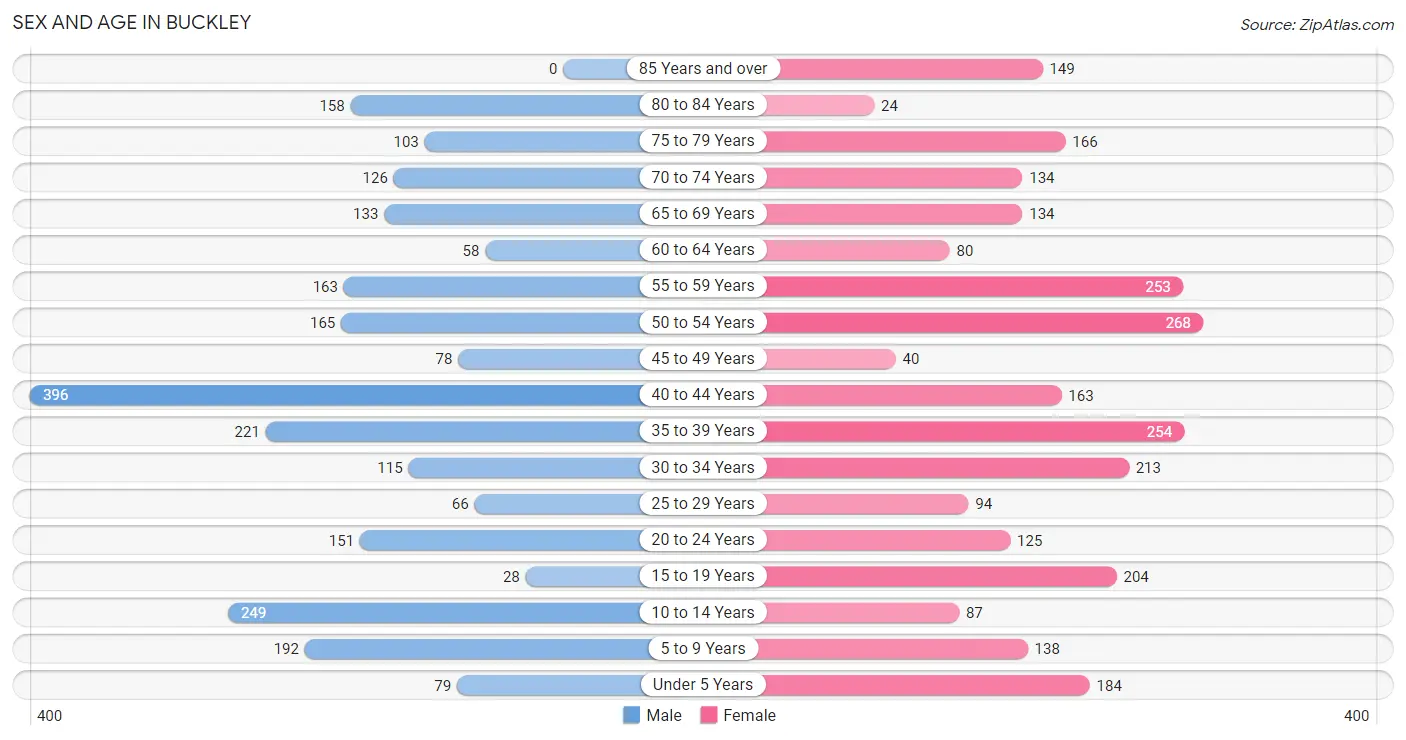
The most populous age groups in Buckley are 40 to 44 Years (396 | 16.0%) for men and 50 to 54 Years (268 | 9.9%) for women.
| Age Bracket | Male | Female |
| Under 5 Years | 79 (3.2%) | 184 (6.8%) |
| 5 to 9 Years | 192 (7.7%) | 138 (5.1%) |
| 10 to 14 Years | 249 (10.0%) | 87 (3.2%) |
| 15 to 19 Years | 28 (1.1%) | 204 (7.5%) |
| 20 to 24 Years | 151 (6.1%) | 125 (4.6%) |
| 25 to 29 Years | 66 (2.7%) | 94 (3.5%) |
| 30 to 34 Years | 115 (4.6%) | 213 (7.9%) |
| 35 to 39 Years | 221 (8.9%) | 254 (9.4%) |
| 40 to 44 Years | 396 (16.0%) | 163 (6.0%) |
| 45 to 49 Years | 78 (3.1%) | 40 (1.5%) |
| 50 to 54 Years | 165 (6.7%) | 268 (9.9%) |
| 55 to 59 Years | 163 (6.6%) | 253 (9.3%) |
| 60 to 64 Years | 58 (2.3%) | 80 (2.9%) |
| 65 to 69 Years | 133 (5.4%) | 134 (4.9%) |
| 70 to 74 Years | 126 (5.1%) | 134 (4.9%) |
| 75 to 79 Years | 103 (4.2%) | 166 (6.1%) |
| 80 to 84 Years | 158 (6.4%) | 24 (0.9%) |
| 85 Years and over | 0 (0.0%) | 149 (5.5%) |
| Total | 2,481 (100.0%) | 2,710 (100.0%) |
Families and Households in Buckley
Median Family Size in Buckley
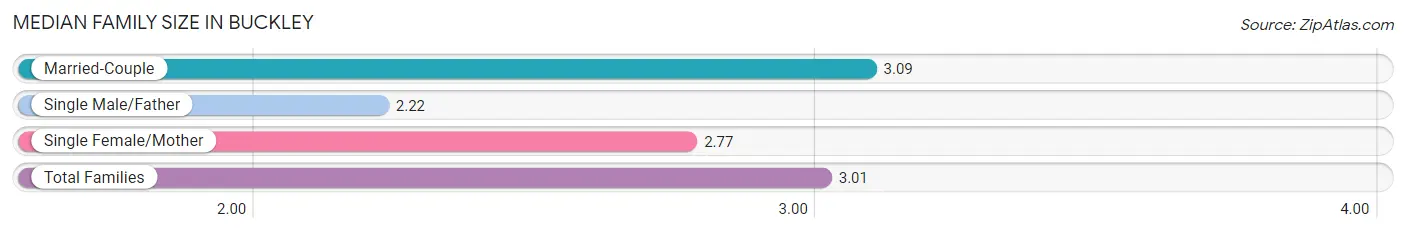
The median family size in Buckley is 3.01 persons per family, with married-couple families (1,155 | 84.9%) accounting for the largest median family size of 3.09 persons per family. On the other hand, single male/father families (83 | 6.1%) represent the smallest median family size with 2.22 persons per family.
| Family Type | # Families | Family Size |
| Married-Couple | 1,155 (84.9%) | 3.09 |
| Single Male/Father | 83 (6.1%) | 2.22 |
| Single Female/Mother | 122 (9.0%) | 2.77 |
| Total Families | 1,360 (100.0%) | 3.01 |
Median Household Size in Buckley
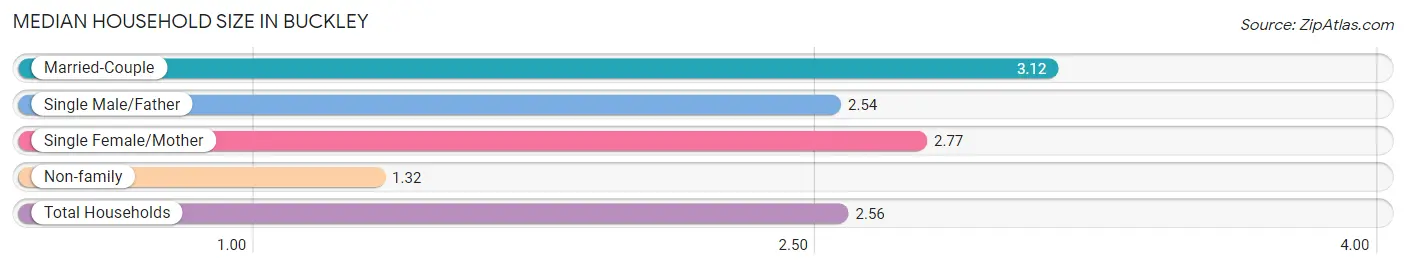
The median household size in Buckley is 2.56 persons per household, with married-couple households (1,155 | 60.9%) accounting for the largest median household size of 3.12 persons per household. non-family households (536 | 28.3%) represent the smallest median household size with 1.32 persons per household.
| Household Type | # Households | Household Size |
| Married-Couple | 1,155 (60.9%) | 3.12 |
| Single Male/Father | 83 (4.4%) | 2.54 |
| Single Female/Mother | 122 (6.4%) | 2.77 |
| Non-family | 536 (28.3%) | 1.32 |
| Total Households | 1,896 (100.0%) | 2.56 |
Household Size by Marriage Status in Buckley
Out of a total of 1,896 households in Buckley, 1,360 (71.7%) are family households, while 536 (28.3%) are nonfamily households. The most numerous type of family households are 2-person households, comprising 548, and the most common type of nonfamily households are 1-person households, comprising 369.
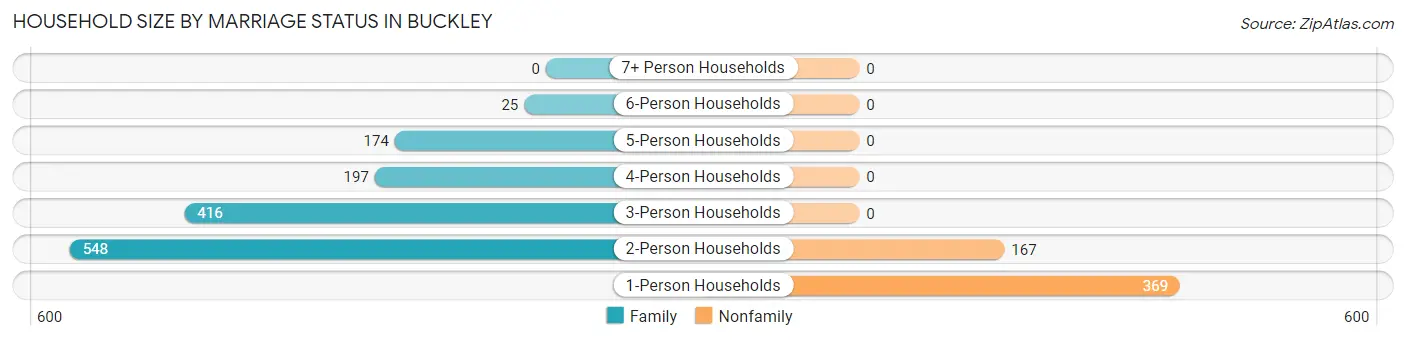
| Household Size | Family Households | Nonfamily Households |
| 1-Person Households | - | 369 (19.5%) |
| 2-Person Households | 548 (28.9%) | 167 (8.8%) |
| 3-Person Households | 416 (21.9%) | 0 (0.0%) |
| 4-Person Households | 197 (10.4%) | 0 (0.0%) |
| 5-Person Households | 174 (9.2%) | 0 (0.0%) |
| 6-Person Households | 25 (1.3%) | 0 (0.0%) |
| 7+ Person Households | 0 (0.0%) | 0 (0.0%) |
| Total | 1,360 (71.7%) | 536 (28.3%) |
Female Fertility in Buckley
Fertility by Age in Buckley
Average fertility rate in Buckley is 41.0 births per 1,000 women. Women in the age bracket of 20 to 34 years have the highest fertility rate with 106.0 births per 1,000 women. Women in the age bracket of 20 to 34 years acount for 100.0% of all women with births.
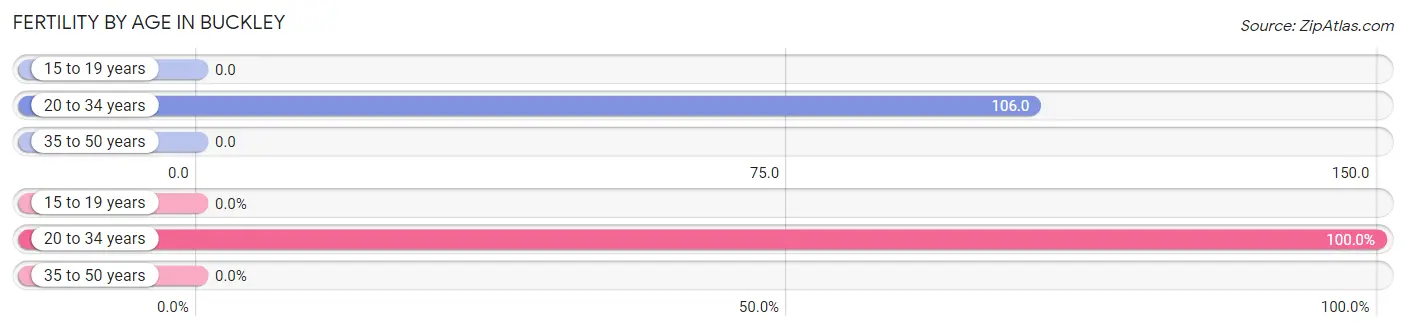
| Age Bracket | Women with Births | Births / 1,000 Women |
| 15 to 19 years | 0 (0.0%) | 0.0 |
| 20 to 34 years | 46 (100.0%) | 106.0 |
| 35 to 50 years | 0 (0.0%) | 0.0 |
| Total | 46 (100.0%) | 41.0 |
Fertility by Age by Marriage Status in Buckley
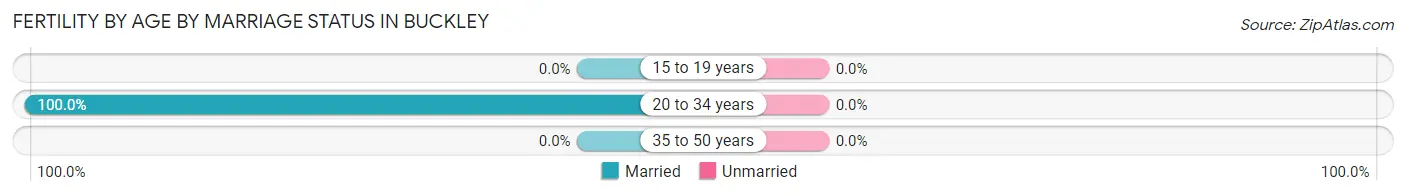
| Age Bracket | Married | Unmarried |
| 15 to 19 years | 0 (0.0%) | 0 (0.0%) |
| 20 to 34 years | 46 (100.0%) | 0 (0.0%) |
| 35 to 50 years | 0 (0.0%) | 0 (0.0%) |
| Total | 46 (100.0%) | 0 (0.0%) |
Fertility by Education in Buckley
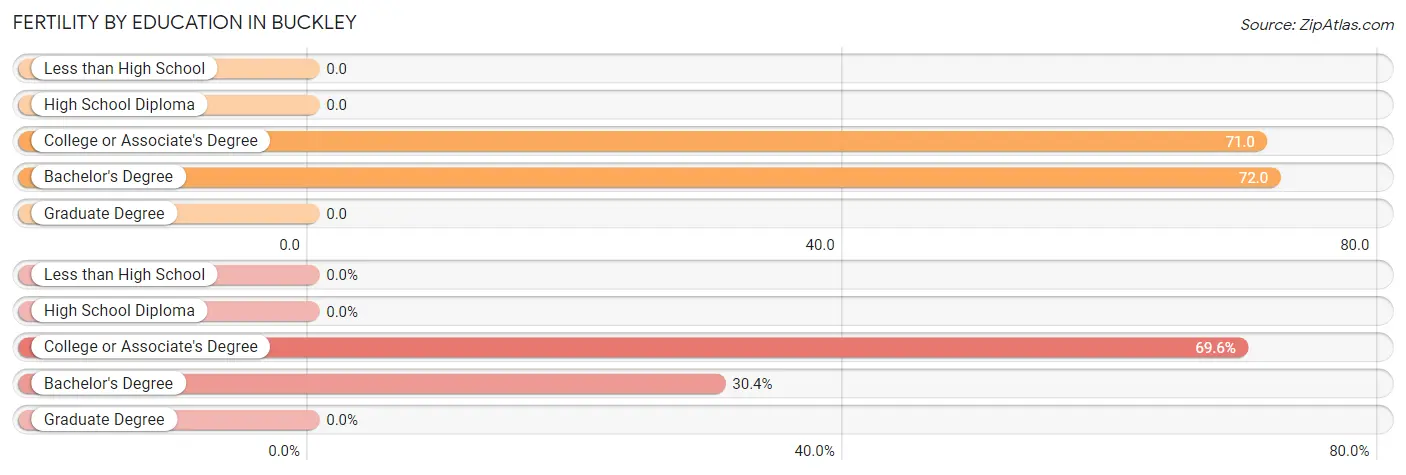
| Educational Attainment | Women with Births | Births / 1,000 Women |
| Less than High School | 0 (0.0%) | 0.0 |
| High School Diploma | 0 (0.0%) | 0.0 |
| College or Associate's Degree | 32 (69.6%) | 71.0 |
| Bachelor's Degree | 14 (30.4%) | 72.0 |
| Graduate Degree | 0 (0.0%) | 0.0 |
| Total | 46 (100.0%) | 41.0 |
Fertility by Education by Marriage Status in Buckley
| Educational Attainment | Married | Unmarried |
| Less than High School | 0 (0.0%) | 0 (0.0%) |
| High School Diploma | 0 (0.0%) | 0 (0.0%) |
| College or Associate's Degree | 32 (100.0%) | 0 (0.0%) |
| Bachelor's Degree | 14 (100.0%) | 0 (0.0%) |
| Graduate Degree | 0 (0.0%) | 0 (0.0%) |
| Total | 46 (100.0%) | 0 (0.0%) |
Employment Characteristics in Buckley
Employment by Class of Employer in Buckley
Among the 2,457 employed individuals in Buckley, private company employees (1,886 | 76.8%), self-employed (not incorporated) (214 | 8.7%), and local government employees (137 | 5.6%) make up the most common classes of employment.
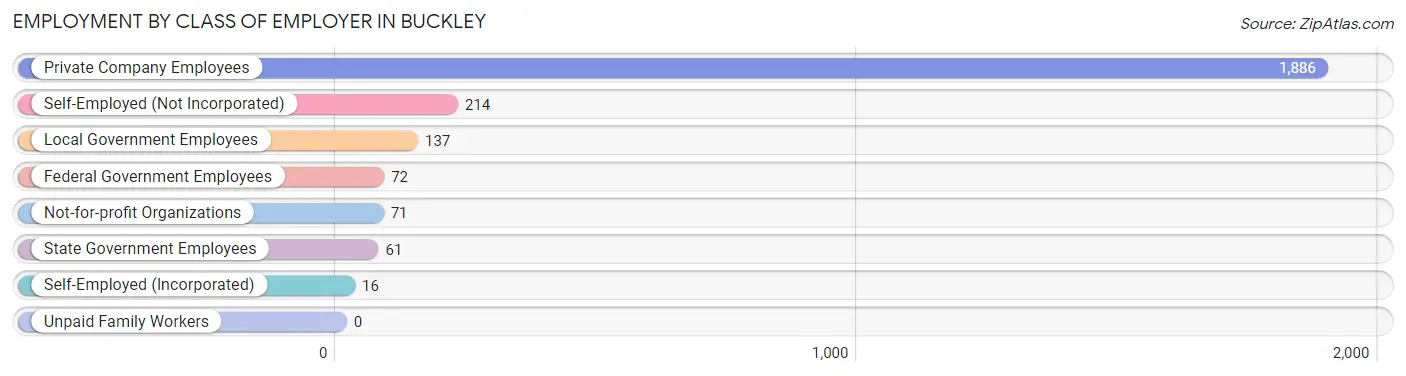
| Employer Class | # Employees | % Employees |
| Private Company Employees | 1,886 | 76.8% |
| Self-Employed (Incorporated) | 16 | 0.6% |
| Self-Employed (Not Incorporated) | 214 | 8.7% |
| Not-for-profit Organizations | 71 | 2.9% |
| Local Government Employees | 137 | 5.6% |
| State Government Employees | 61 | 2.5% |
| Federal Government Employees | 72 | 2.9% |
| Unpaid Family Workers | 0 | 0.0% |
| Total | 2,457 | 100.0% |
Employment Status by Age in Buckley
According to the labor force statistics for Buckley, out of the total population over 16 years of age (4,169), 61.6% or 2,568 individuals are in the labor force, with 2.8% or 72 of them unemployed. The age group with the highest labor force participation rate is 16 to 19 years, with 92.8% or 129 individuals in the labor force. Within the labor force, the 25 to 29 years age range has the highest percentage of unemployed individuals, with 18.4% or 18 of them being unemployed.
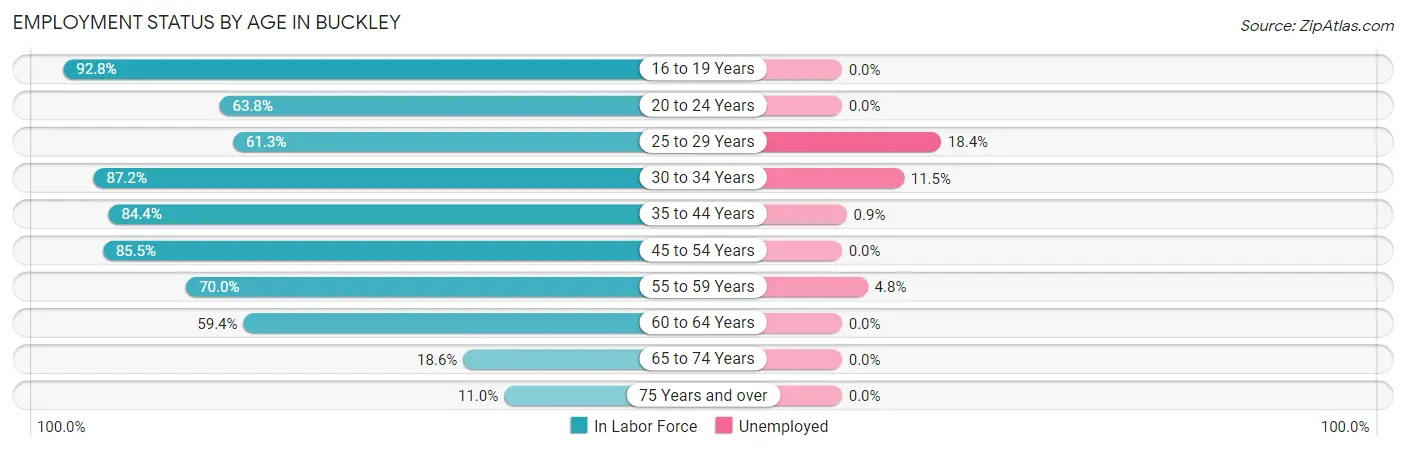
| Age Bracket | In Labor Force | Unemployed |
| 16 to 19 Years | 129 (92.8%) | 0 (0.0%) |
| 20 to 24 Years | 176 (63.8%) | 0 (0.0%) |
| 25 to 29 Years | 98 (61.3%) | 18 (18.4%) |
| 30 to 34 Years | 286 (87.2%) | 33 (11.5%) |
| 35 to 44 Years | 873 (84.4%) | 8 (0.9%) |
| 45 to 54 Years | 471 (85.5%) | 0 (0.0%) |
| 55 to 59 Years | 291 (70.0%) | 14 (4.8%) |
| 60 to 64 Years | 82 (59.4%) | 0 (0.0%) |
| 65 to 74 Years | 98 (18.6%) | 0 (0.0%) |
| 75 Years and over | 66 (11.0%) | 0 (0.0%) |
| Total | 2,568 (61.6%) | 72 (2.8%) |
Employment Status by Educational Attainment in Buckley
According to labor force statistics for Buckley, 80.0% of individuals (2,102) out of the total population between 25 and 64 years of age (2,627) are in the labor force, with 3.5% or 74 of them being unemployed. The group with the highest labor force participation rate are those with the educational attainment of bachelor's degree or higher, with 91.7% or 621 individuals in the labor force. Within the labor force, individuals with high school diploma education have the highest percentage of unemployment, with 10.3% or 51 of them being unemployed.
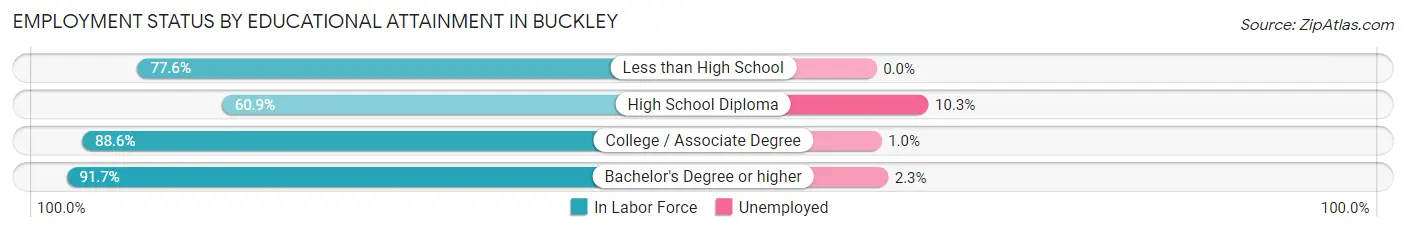
| Educational Attainment | In Labor Force | Unemployed |
| Less than High School | 163 (77.6%) | 0 (0.0%) |
| High School Diploma | 494 (60.9%) | 84 (10.3%) |
| College / Associate Degree | 823 (88.6%) | 9 (1.0%) |
| Bachelor's Degree or higher | 621 (91.7%) | 16 (2.3%) |
| Total | 2,102 (80.0%) | 92 (3.5%) |
Employment Occupations by Sex in Buckley
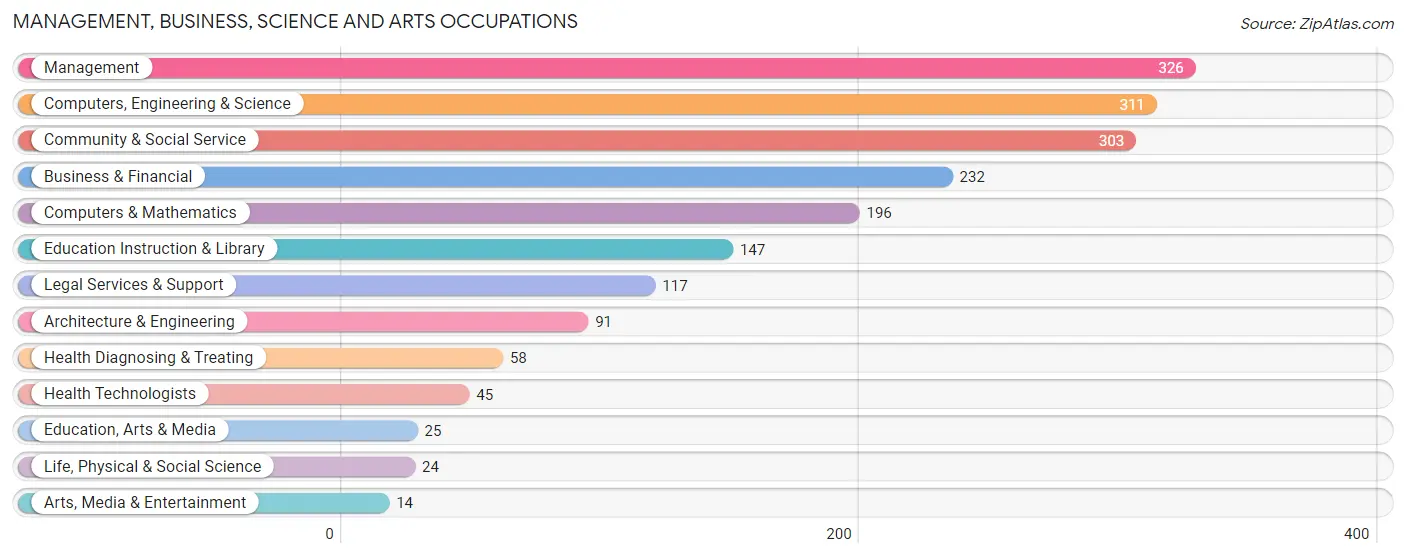
Management, Business, Science and Arts Occupations
The most common Management, Business, Science and Arts occupations in Buckley are Management (326 | 13.1%), Computers, Engineering & Science (311 | 12.4%), Community & Social Service (303 | 12.1%), Business & Financial (232 | 9.3%), and Computers & Mathematics (196 | 7.9%).
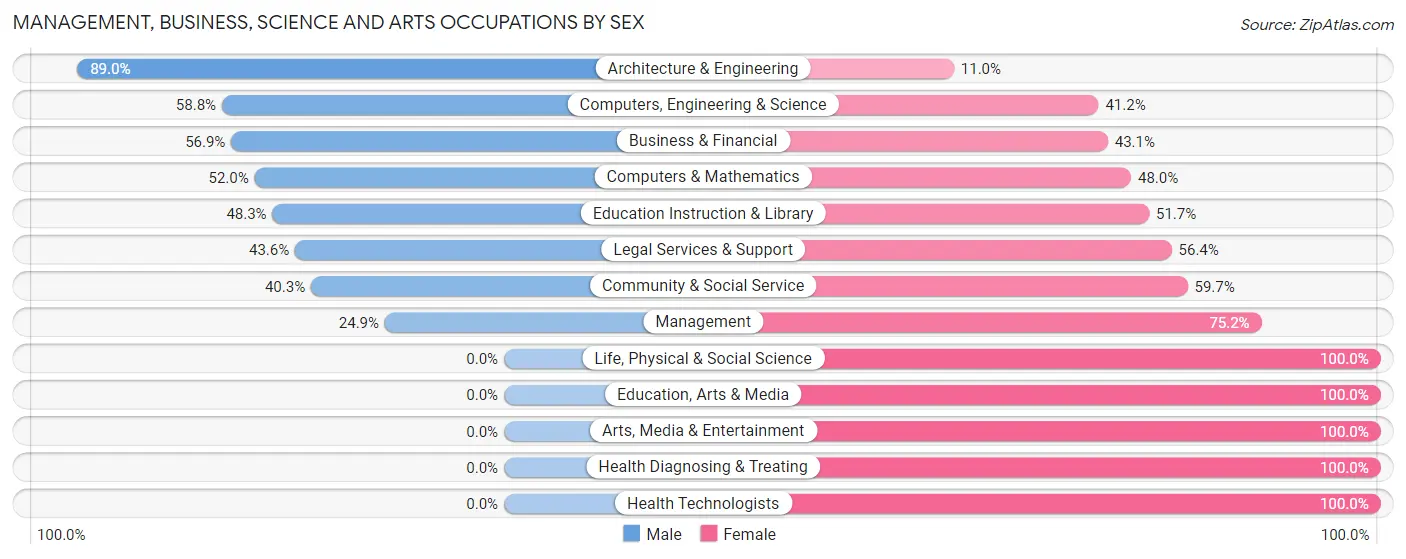
Management, Business, Science and Arts Occupations by Sex
Within the Management, Business, Science and Arts occupations in Buckley, the most male-oriented occupations are Architecture & Engineering (89.0%), Computers, Engineering & Science (58.8%), and Business & Financial (56.9%), while the most female-oriented occupations are Life, Physical & Social Science (100.0%), Education, Arts & Media (100.0%), and Arts, Media & Entertainment (100.0%).
| Occupation | Male | Female |
| Management | 81 (24.8%) | 245 (75.1%) |
| Business & Financial | 132 (56.9%) | 100 (43.1%) |
| Computers, Engineering & Science | 183 (58.8%) | 128 (41.2%) |
| Computers & Mathematics | 102 (52.0%) | 94 (48.0%) |
| Architecture & Engineering | 81 (89.0%) | 10 (11.0%) |
| Life, Physical & Social Science | 0 (0.0%) | 24 (100.0%) |
| Community & Social Service | 122 (40.3%) | 181 (59.7%) |
| Education, Arts & Media | 0 (0.0%) | 25 (100.0%) |
| Legal Services & Support | 51 (43.6%) | 66 (56.4%) |
| Education Instruction & Library | 71 (48.3%) | 76 (51.7%) |
| Arts, Media & Entertainment | 0 (0.0%) | 14 (100.0%) |
| Health Diagnosing & Treating | 0 (0.0%) | 58 (100.0%) |
| Health Technologists | 0 (0.0%) | 45 (100.0%) |
| Total (Category) | 518 (42.1%) | 712 (57.9%) |
| Total (Overall) | 1,202 (48.1%) | 1,295 (51.9%) |
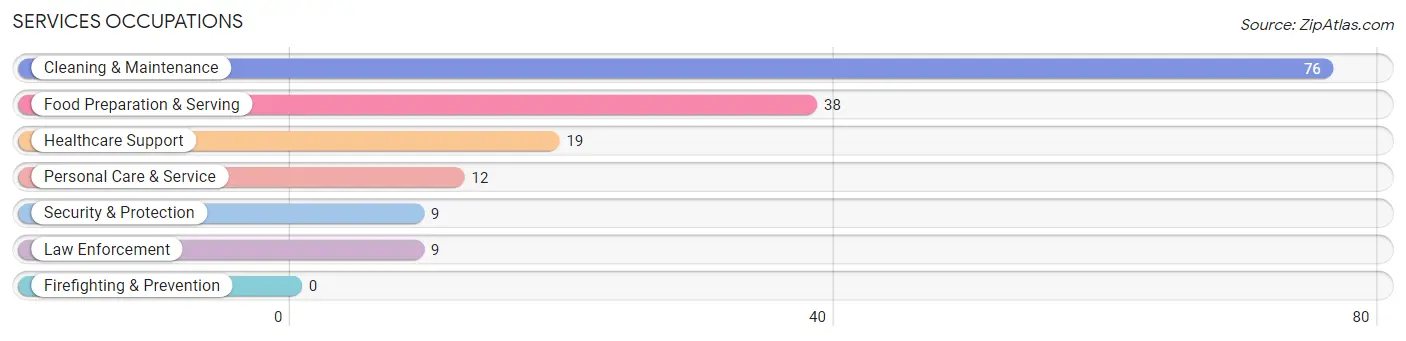
Services Occupations
The most common Services occupations in Buckley are Cleaning & Maintenance (76 | 3.0%), Food Preparation & Serving (38 | 1.5%), Healthcare Support (19 | 0.8%), Personal Care & Service (12 | 0.5%), and Security & Protection (9 | 0.4%).
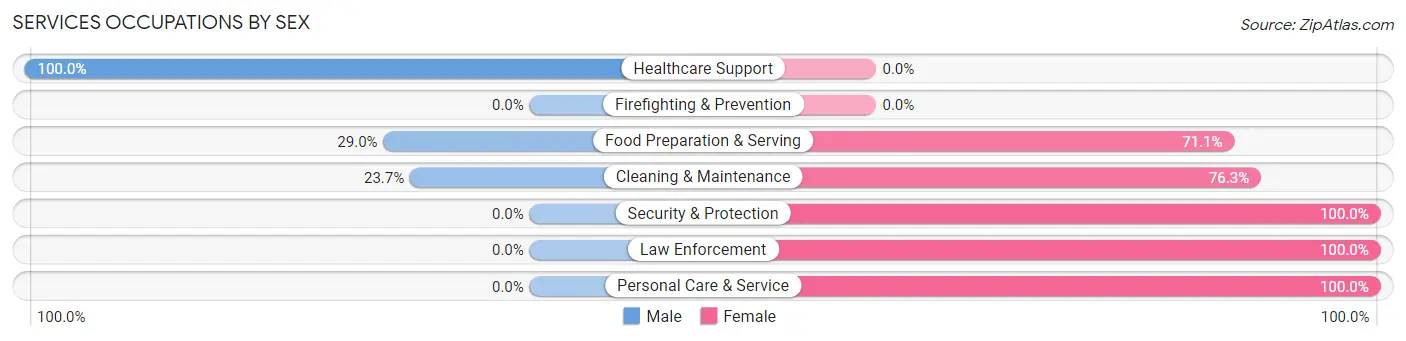
Services Occupations by Sex
Within the Services occupations in Buckley, the most male-oriented occupations are Healthcare Support (100.0%), Food Preparation & Serving (28.9%), and Cleaning & Maintenance (23.7%), while the most female-oriented occupations are Security & Protection (100.0%), Law Enforcement (100.0%), and Personal Care & Service (100.0%).
| Occupation | Male | Female |
| Healthcare Support | 19 (100.0%) | 0 (0.0%) |
| Security & Protection | 0 (0.0%) | 9 (100.0%) |
| Firefighting & Prevention | 0 (0.0%) | 0 (0.0%) |
| Law Enforcement | 0 (0.0%) | 9 (100.0%) |
| Food Preparation & Serving | 11 (28.9%) | 27 (71.1%) |
| Cleaning & Maintenance | 18 (23.7%) | 58 (76.3%) |
| Personal Care & Service | 0 (0.0%) | 12 (100.0%) |
| Total (Category) | 48 (31.2%) | 106 (68.8%) |
| Total (Overall) | 1,202 (48.1%) | 1,295 (51.9%) |
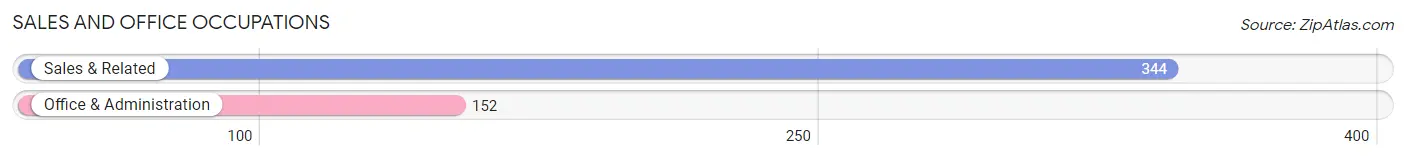
Sales and Office Occupations
The most common Sales and Office occupations in Buckley are Sales & Related (344 | 13.8%), and Office & Administration (152 | 6.1%).
Sales and Office Occupations by Sex
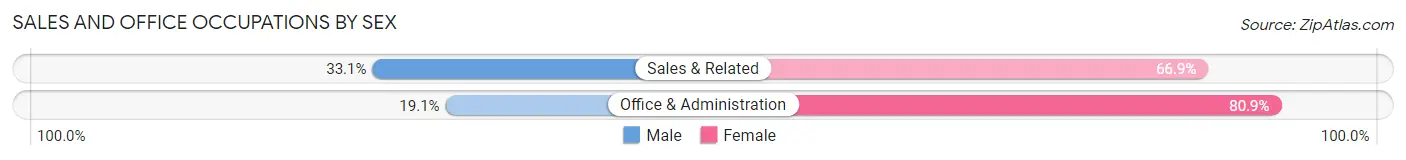
| Occupation | Male | Female |
| Sales & Related | 114 (33.1%) | 230 (66.9%) |
| Office & Administration | 29 (19.1%) | 123 (80.9%) |
| Total (Category) | 143 (28.8%) | 353 (71.2%) |
| Total (Overall) | 1,202 (48.1%) | 1,295 (51.9%) |
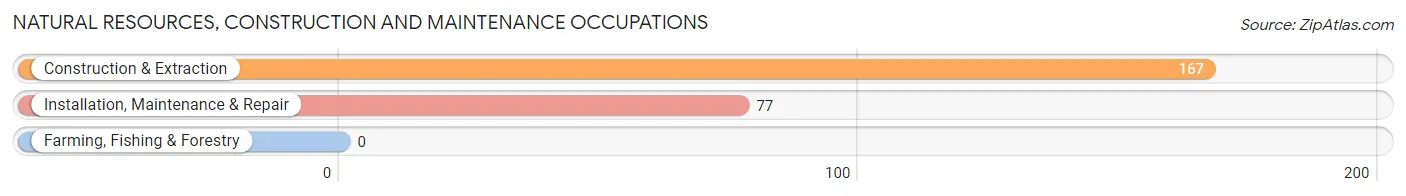
Natural Resources, Construction and Maintenance Occupations
The most common Natural Resources, Construction and Maintenance occupations in Buckley are Construction & Extraction (167 | 6.7%), and Installation, Maintenance & Repair (77 | 3.1%).
Natural Resources, Construction and Maintenance Occupations by Sex
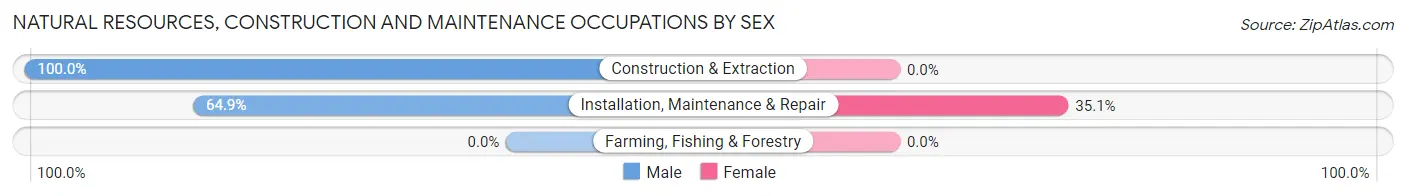
| Occupation | Male | Female |
| Farming, Fishing & Forestry | 0 (0.0%) | 0 (0.0%) |
| Construction & Extraction | 167 (100.0%) | 0 (0.0%) |
| Installation, Maintenance & Repair | 50 (64.9%) | 27 (35.1%) |
| Total (Category) | 217 (88.9%) | 27 (11.1%) |
| Total (Overall) | 1,202 (48.1%) | 1,295 (51.9%) |
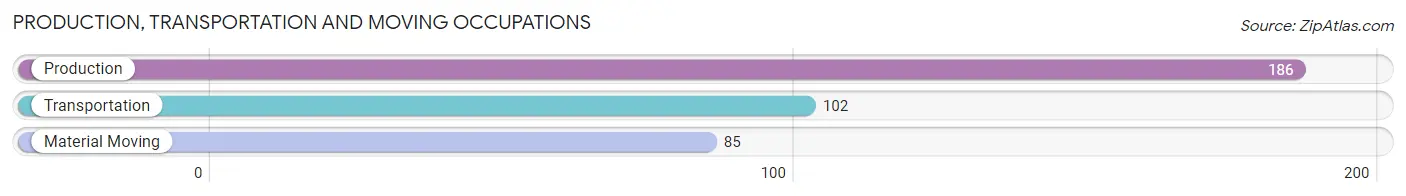
Production, Transportation and Moving Occupations
The most common Production, Transportation and Moving occupations in Buckley are Production (186 | 7.4%), Transportation (102 | 4.1%), and Material Moving (85 | 3.4%).
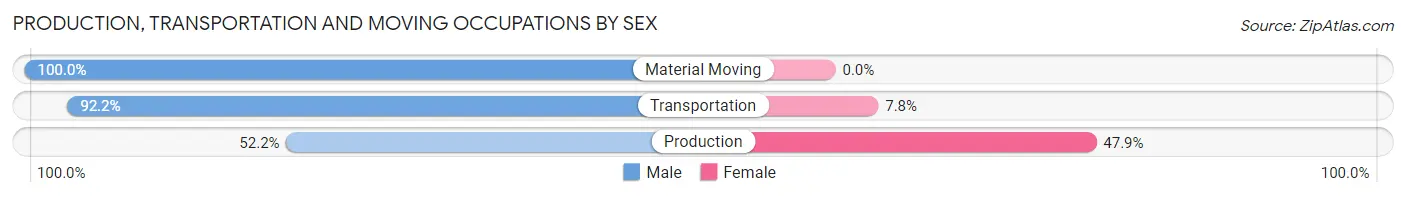
Production, Transportation and Moving Occupations by Sex
| Occupation | Male | Female |
| Production | 97 (52.1%) | 89 (47.8%) |
| Transportation | 94 (92.2%) | 8 (7.8%) |
| Material Moving | 85 (100.0%) | 0 (0.0%) |
| Total (Category) | 276 (74.0%) | 97 (26.0%) |
| Total (Overall) | 1,202 (48.1%) | 1,295 (51.9%) |
Employment Industries by Sex in Buckley
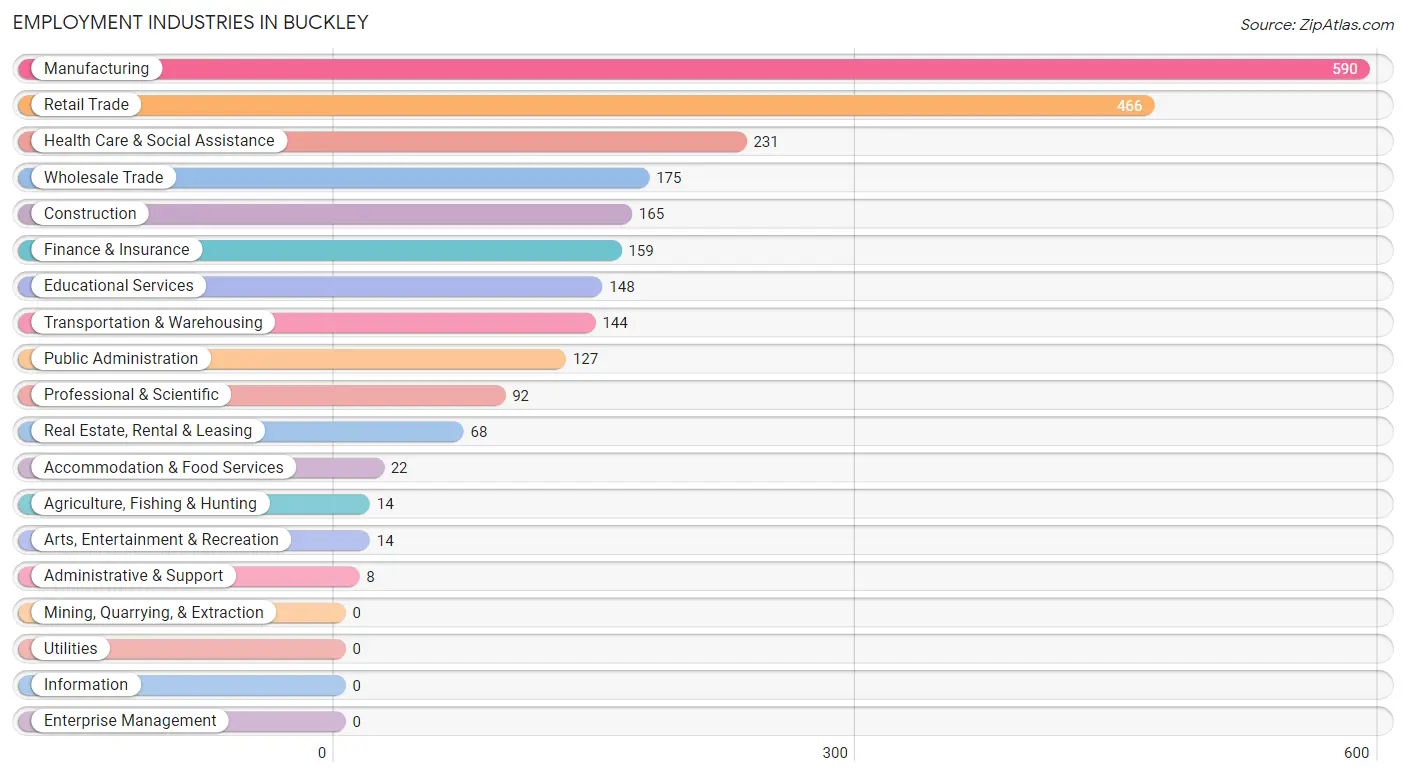
Employment Industries in Buckley
The major employment industries in Buckley include Manufacturing (590 | 23.6%), Retail Trade (466 | 18.7%), Health Care & Social Assistance (231 | 9.2%), Wholesale Trade (175 | 7.0%), and Construction (165 | 6.6%).
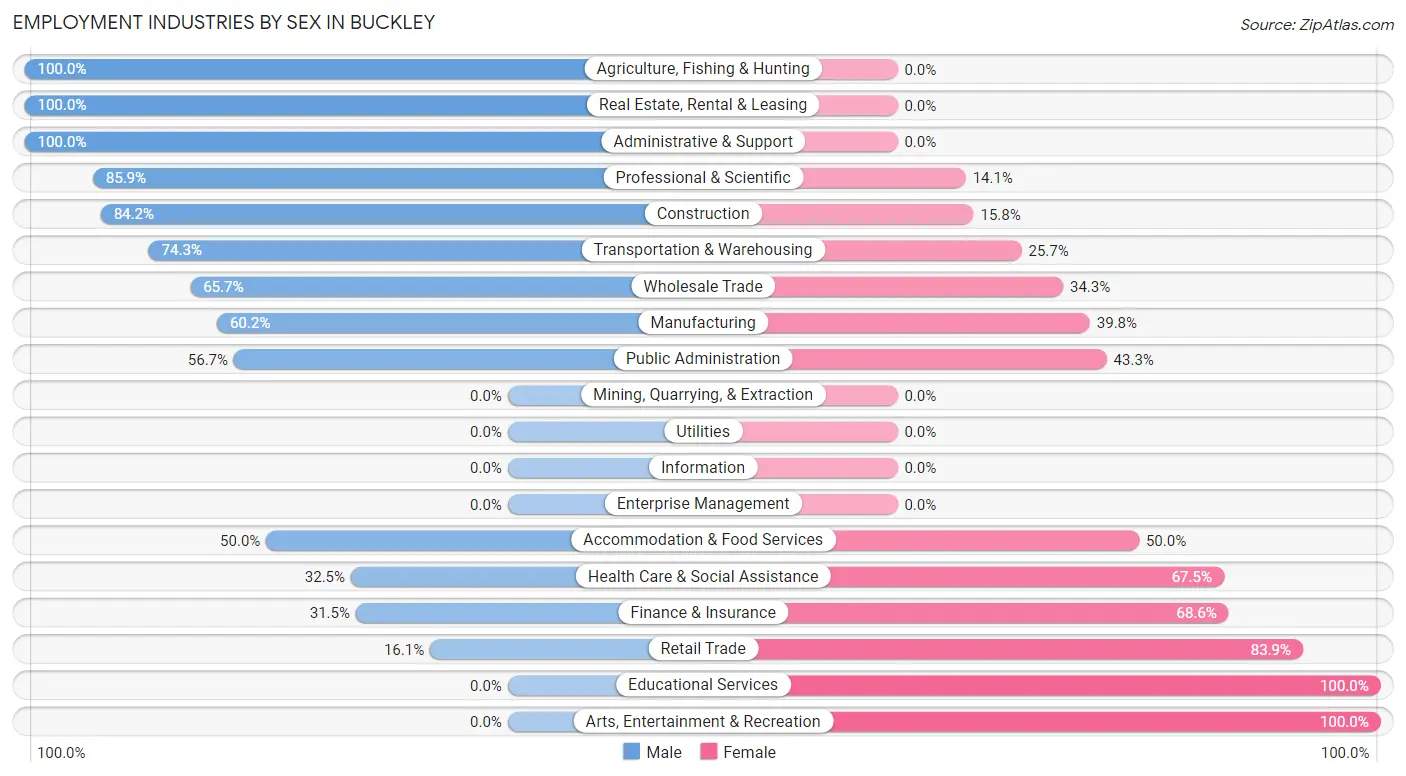
Employment Industries by Sex in Buckley
The Buckley industries that see more men than women are Agriculture, Fishing & Hunting (100.0%), Real Estate, Rental & Leasing (100.0%), and Administrative & Support (100.0%), whereas the industries that tend to have a higher number of women are Educational Services (100.0%), Arts, Entertainment & Recreation (100.0%), and Retail Trade (83.9%).
| Industry | Male | Female |
| Agriculture, Fishing & Hunting | 14 (100.0%) | 0 (0.0%) |
| Mining, Quarrying, & Extraction | 0 (0.0%) | 0 (0.0%) |
| Construction | 139 (84.2%) | 26 (15.8%) |
| Manufacturing | 355 (60.2%) | 235 (39.8%) |
| Wholesale Trade | 115 (65.7%) | 60 (34.3%) |
| Retail Trade | 75 (16.1%) | 391 (83.9%) |
| Transportation & Warehousing | 107 (74.3%) | 37 (25.7%) |
| Utilities | 0 (0.0%) | 0 (0.0%) |
| Information | 0 (0.0%) | 0 (0.0%) |
| Finance & Insurance | 50 (31.5%) | 109 (68.5%) |
| Real Estate, Rental & Leasing | 68 (100.0%) | 0 (0.0%) |
| Professional & Scientific | 79 (85.9%) | 13 (14.1%) |
| Enterprise Management | 0 (0.0%) | 0 (0.0%) |
| Administrative & Support | 8 (100.0%) | 0 (0.0%) |
| Educational Services | 0 (0.0%) | 148 (100.0%) |
| Health Care & Social Assistance | 75 (32.5%) | 156 (67.5%) |
| Arts, Entertainment & Recreation | 0 (0.0%) | 14 (100.0%) |
| Accommodation & Food Services | 11 (50.0%) | 11 (50.0%) |
| Public Administration | 72 (56.7%) | 55 (43.3%) |
| Total | 1,202 (48.1%) | 1,295 (51.9%) |
Education in Buckley
School Enrollment in Buckley
The most common levels of schooling among the 988 students in Buckley are elementary school (285 | 28.8%), middle school (173 | 17.5%), and high school (171 | 17.3%).
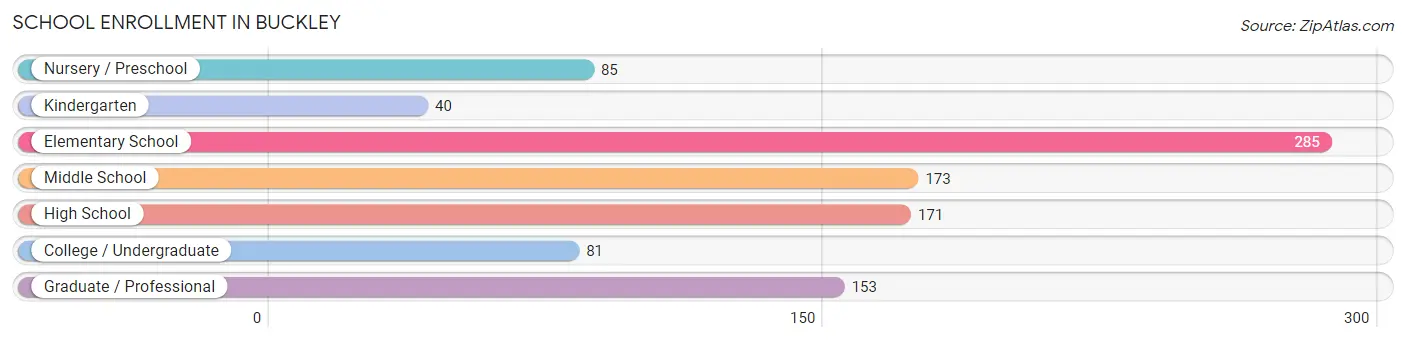
| School Level | # Students | % Students |
| Nursery / Preschool | 85 | 8.6% |
| Kindergarten | 40 | 4.1% |
| Elementary School | 285 | 28.8% |
| Middle School | 173 | 17.5% |
| High School | 171 | 17.3% |
| College / Undergraduate | 81 | 8.2% |
| Graduate / Professional | 153 | 15.5% |
| Total | 988 | 100.0% |
School Enrollment by Age by Funding Source in Buckley
Out of a total of 988 students who are enrolled in schools in Buckley, 225 (22.8%) attend a private institution, while the remaining 763 (77.2%) are enrolled in public schools. The age group of 35 years and over has the highest likelihood of being enrolled in private schools, with 147 (78.2% in the age bracket) enrolled. Conversely, the age group of 10 to 14 year olds has the lowest likelihood of being enrolled in a private school, with 336 (100.0% in the age bracket) attending a public institution.
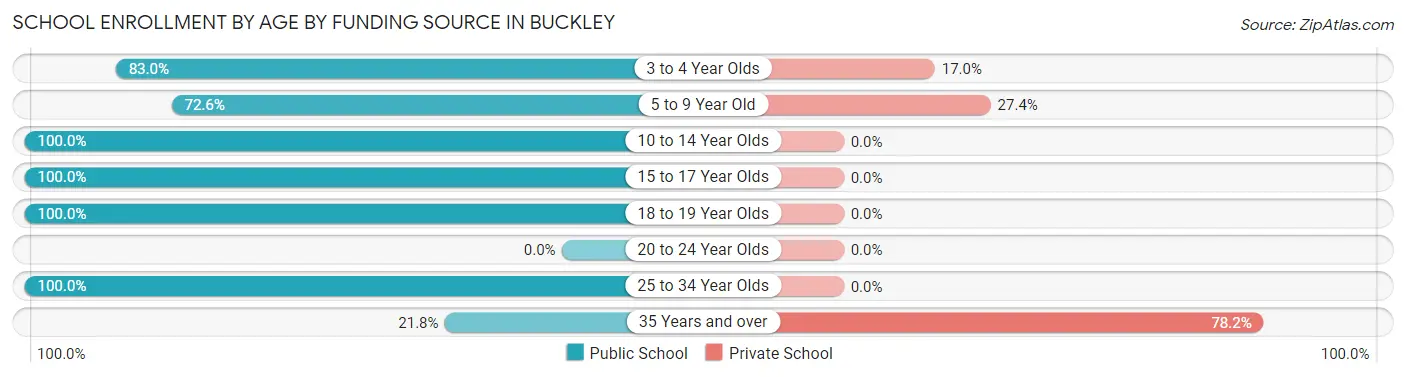
| Age Bracket | Public School | Private School |
| 3 to 4 Year Olds | 44 (83.0%) | 9 (17.0%) |
| 5 to 9 Year Old | 183 (72.6%) | 69 (27.4%) |
| 10 to 14 Year Olds | 336 (100.0%) | 0 (0.0%) |
| 15 to 17 Year Olds | 113 (100.0%) | 0 (0.0%) |
| 18 to 19 Year Olds | 26 (100.0%) | 0 (0.0%) |
| 20 to 24 Year Olds | 0 (0.0%) | 0 (0.0%) |
| 25 to 34 Year Olds | 20 (100.0%) | 0 (0.0%) |
| 35 Years and over | 41 (21.8%) | 147 (78.2%) |
| Total | 763 (77.2%) | 225 (22.8%) |
Educational Attainment by Field of Study in Buckley
Business (332 | 36.0%), education (160 | 17.3%), computers & mathematics (106 | 11.5%), arts & humanities (98 | 10.6%), and social sciences (76 | 8.2%) are the most common fields of study among 922 individuals in Buckley who have obtained a bachelor's degree or higher.
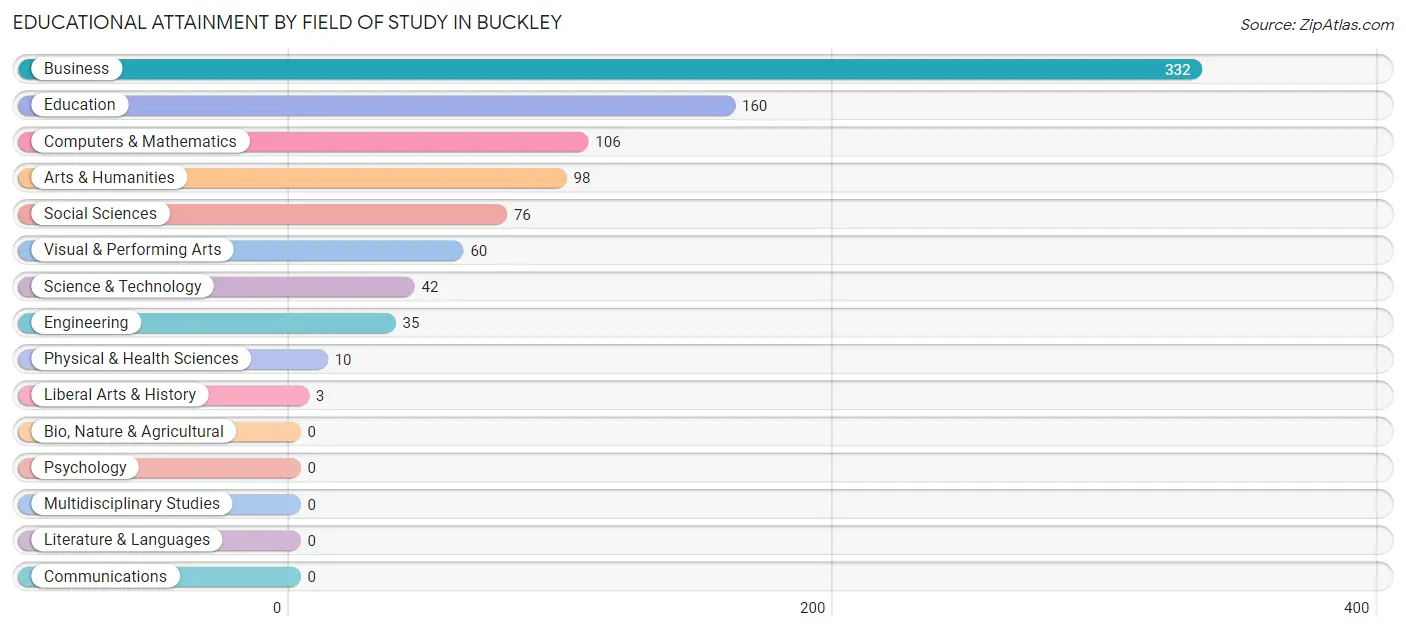
| Field of Study | # Graduates | % Graduates |
| Computers & Mathematics | 106 | 11.5% |
| Bio, Nature & Agricultural | 0 | 0.0% |
| Physical & Health Sciences | 10 | 1.1% |
| Psychology | 0 | 0.0% |
| Social Sciences | 76 | 8.2% |
| Engineering | 35 | 3.8% |
| Multidisciplinary Studies | 0 | 0.0% |
| Science & Technology | 42 | 4.6% |
| Business | 332 | 36.0% |
| Education | 160 | 17.3% |
| Literature & Languages | 0 | 0.0% |
| Liberal Arts & History | 3 | 0.3% |
| Visual & Performing Arts | 60 | 6.5% |
| Communications | 0 | 0.0% |
| Arts & Humanities | 98 | 10.6% |
| Total | 922 | 100.0% |
Transportation & Commute in Buckley
Vehicle Availability by Sex in Buckley
The most prevalent vehicle ownership categories in Buckley are males with 3 vehicles (410, accounting for 35.7%) and females with 3 vehicles (531, making up 32.5%).
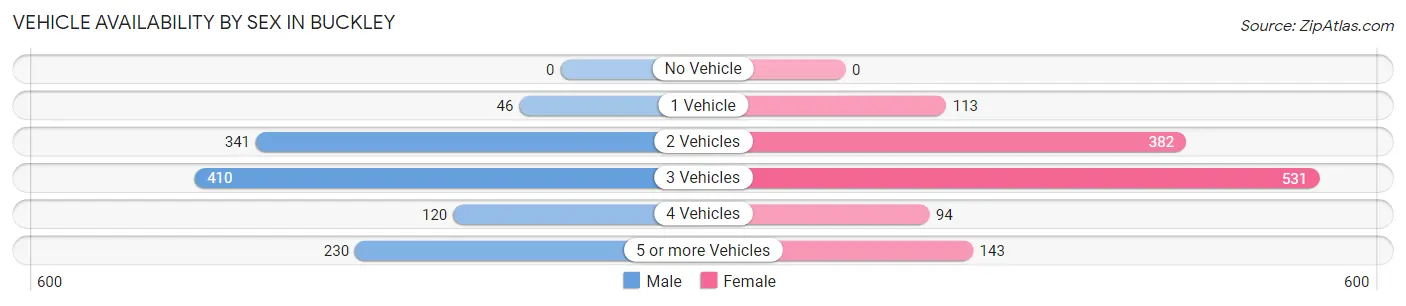
| Vehicles Available | Male | Female |
| No Vehicle | 0 (0.0%) | 0 (0.0%) |
| 1 Vehicle | 46 (4.0%) | 113 (8.9%) |
| 2 Vehicles | 341 (29.7%) | 382 (30.2%) |
| 3 Vehicles | 410 (35.7%) | 531 (42.0%) |
| 4 Vehicles | 120 (10.5%) | 94 (7.4%) |
| 5 or more Vehicles | 230 (20.1%) | 143 (11.3%) |
| Total | 1,147 (100.0%) | 1,263 (100.0%) |
Commute Time in Buckley
The most frequently occuring commute durations in Buckley are 45 to 59 minutes (371 commuters, 18.0%), 30 to 34 minutes (354 commuters, 17.2%), and 5 to 9 minutes (265 commuters, 12.9%).
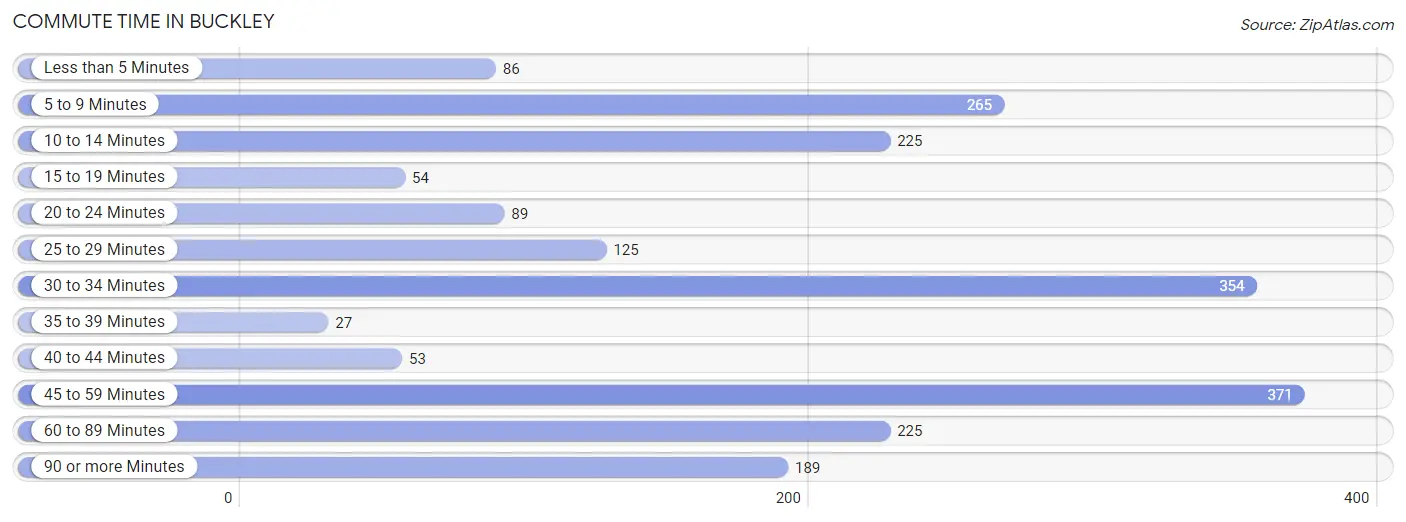
| Commute Time | # Commuters | % Commuters |
| Less than 5 Minutes | 86 | 4.2% |
| 5 to 9 Minutes | 265 | 12.9% |
| 10 to 14 Minutes | 225 | 10.9% |
| 15 to 19 Minutes | 54 | 2.6% |
| 20 to 24 Minutes | 89 | 4.3% |
| 25 to 29 Minutes | 125 | 6.1% |
| 30 to 34 Minutes | 354 | 17.2% |
| 35 to 39 Minutes | 27 | 1.3% |
| 40 to 44 Minutes | 53 | 2.6% |
| 45 to 59 Minutes | 371 | 18.0% |
| 60 to 89 Minutes | 225 | 10.9% |
| 90 or more Minutes | 189 | 9.2% |
Commute Time by Sex in Buckley
The most common commute times in Buckley are 90 or more minutes (165 commuters, 18.0%) for males and 45 to 59 minutes (220 commuters, 19.2%) for females.
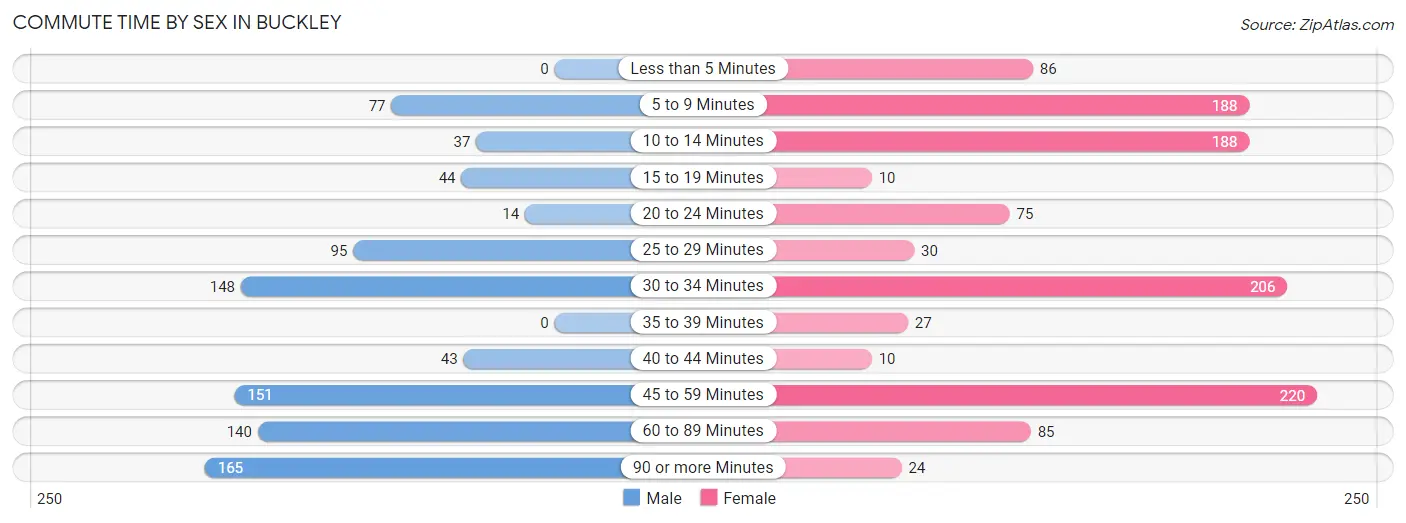
| Commute Time | Male | Female |
| Less than 5 Minutes | 0 (0.0%) | 86 (7.5%) |
| 5 to 9 Minutes | 77 (8.4%) | 188 (16.4%) |
| 10 to 14 Minutes | 37 (4.1%) | 188 (16.4%) |
| 15 to 19 Minutes | 44 (4.8%) | 10 (0.9%) |
| 20 to 24 Minutes | 14 (1.5%) | 75 (6.5%) |
| 25 to 29 Minutes | 95 (10.4%) | 30 (2.6%) |
| 30 to 34 Minutes | 148 (16.2%) | 206 (17.9%) |
| 35 to 39 Minutes | 0 (0.0%) | 27 (2.4%) |
| 40 to 44 Minutes | 43 (4.7%) | 10 (0.9%) |
| 45 to 59 Minutes | 151 (16.5%) | 220 (19.2%) |
| 60 to 89 Minutes | 140 (15.3%) | 85 (7.4%) |
| 90 or more Minutes | 165 (18.0%) | 24 (2.1%) |
Time of Departure to Work by Sex in Buckley
The most frequent times of departure to work in Buckley are 12:00 AM to 4:59 AM (334, 36.5%) for males and 12:00 PM to 3:59 PM (274, 23.8%) for females.
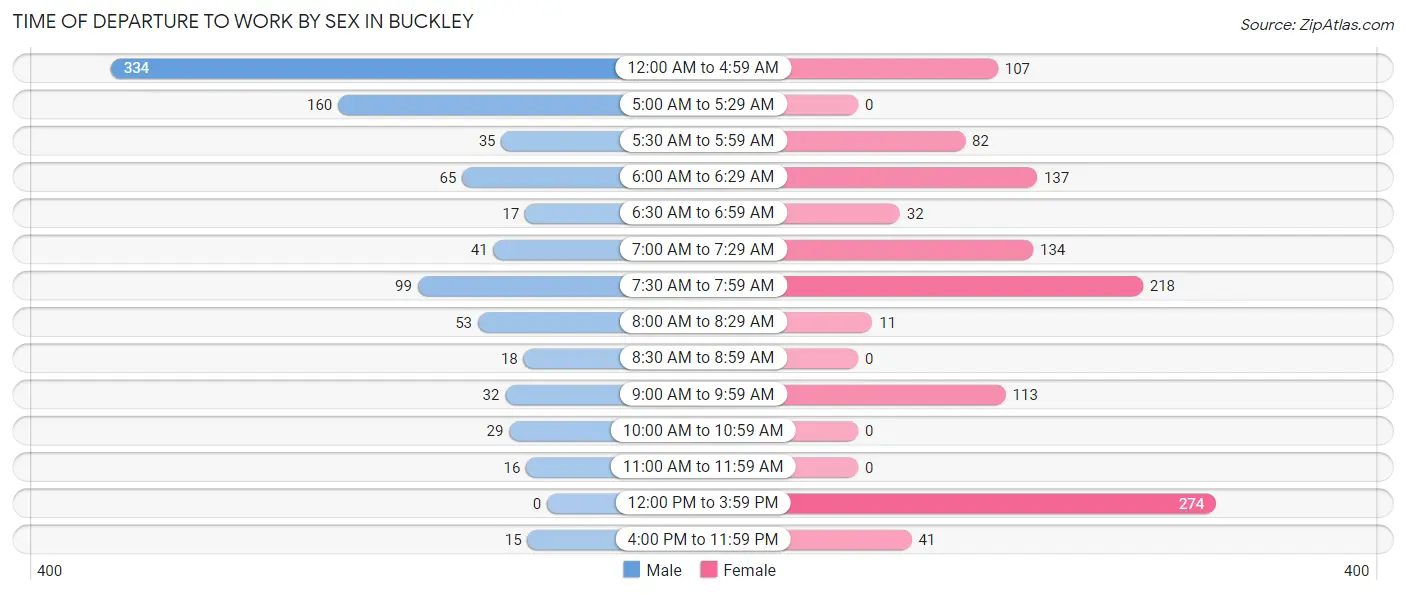
| Time of Departure | Male | Female |
| 12:00 AM to 4:59 AM | 334 (36.5%) | 107 (9.3%) |
| 5:00 AM to 5:29 AM | 160 (17.5%) | 0 (0.0%) |
| 5:30 AM to 5:59 AM | 35 (3.8%) | 82 (7.1%) |
| 6:00 AM to 6:29 AM | 65 (7.1%) | 137 (11.9%) |
| 6:30 AM to 6:59 AM | 17 (1.9%) | 32 (2.8%) |
| 7:00 AM to 7:29 AM | 41 (4.5%) | 134 (11.7%) |
| 7:30 AM to 7:59 AM | 99 (10.8%) | 218 (19.0%) |
| 8:00 AM to 8:29 AM | 53 (5.8%) | 11 (1.0%) |
| 8:30 AM to 8:59 AM | 18 (2.0%) | 0 (0.0%) |
| 9:00 AM to 9:59 AM | 32 (3.5%) | 113 (9.8%) |
| 10:00 AM to 10:59 AM | 29 (3.2%) | 0 (0.0%) |
| 11:00 AM to 11:59 AM | 16 (1.8%) | 0 (0.0%) |
| 12:00 PM to 3:59 PM | 0 (0.0%) | 274 (23.8%) |
| 4:00 PM to 11:59 PM | 15 (1.6%) | 41 (3.6%) |
| Total | 914 (100.0%) | 1,149 (100.0%) |
Housing Occupancy in Buckley
Occupancy by Ownership in Buckley
Of the total 1,896 dwellings in Buckley, owner-occupied units account for 1,333 (70.3%), while renter-occupied units make up 563 (29.7%).
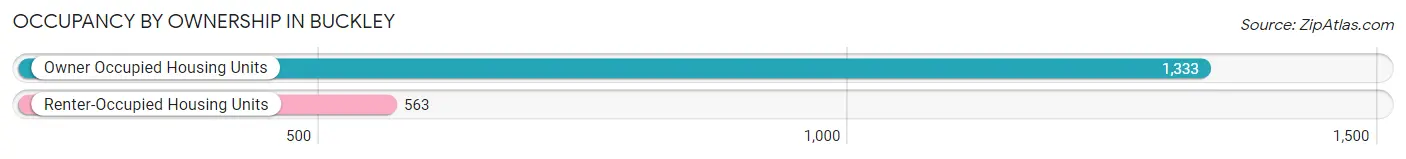
| Occupancy | # Housing Units | % Housing Units |
| Owner Occupied Housing Units | 1,333 | 70.3% |
| Renter-Occupied Housing Units | 563 | 29.7% |
| Total Occupied Housing Units | 1,896 | 100.0% |
Occupancy by Household Size in Buckley
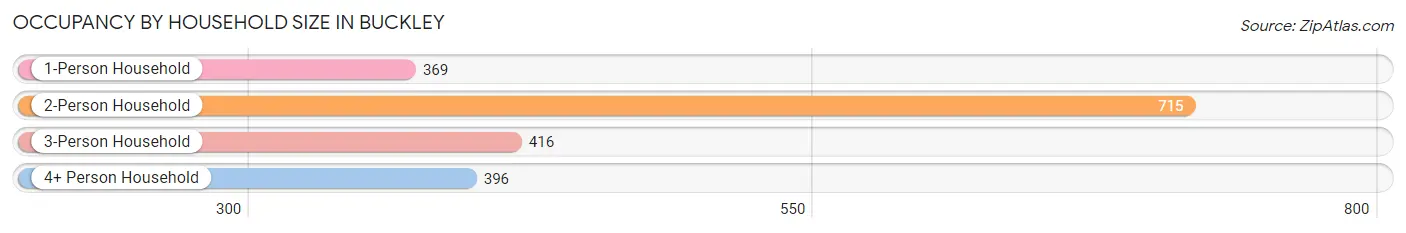
| Household Size | # Housing Units | % Housing Units |
| 1-Person Household | 369 | 19.5% |
| 2-Person Household | 715 | 37.7% |
| 3-Person Household | 416 | 21.9% |
| 4+ Person Household | 396 | 20.9% |
| Total Housing Units | 1,896 | 100.0% |
Occupancy by Ownership by Household Size in Buckley
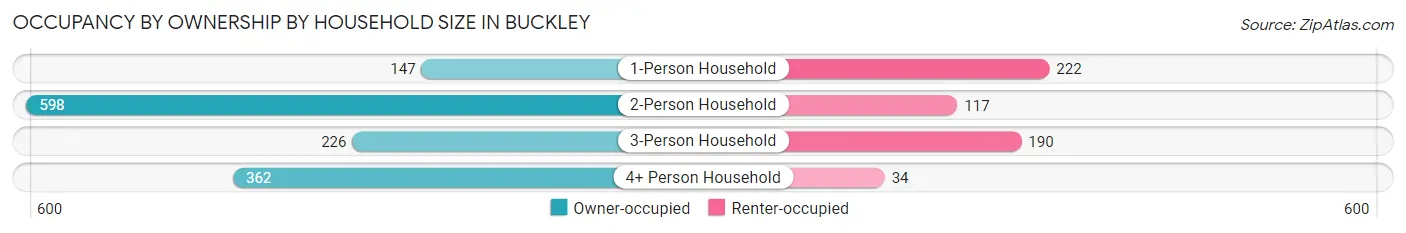
| Household Size | Owner-occupied | Renter-occupied |
| 1-Person Household | 147 (39.8%) | 222 (60.2%) |
| 2-Person Household | 598 (83.6%) | 117 (16.4%) |
| 3-Person Household | 226 (54.3%) | 190 (45.7%) |
| 4+ Person Household | 362 (91.4%) | 34 (8.6%) |
| Total Housing Units | 1,333 (70.3%) | 563 (29.7%) |
Occupancy by Educational Attainment in Buckley
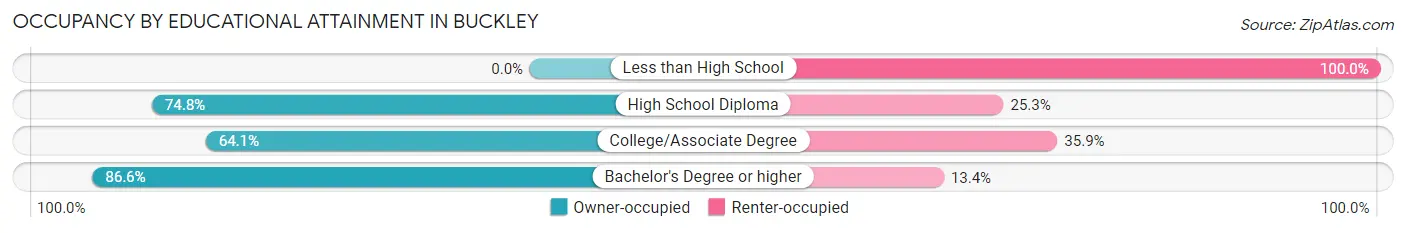
| Household Size | Owner-occupied | Renter-occupied |
| Less than High School | 0 (0.0%) | 77 (100.0%) |
| High School Diploma | 376 (74.8%) | 127 (25.3%) |
| College/Associate Degree | 519 (64.1%) | 291 (35.9%) |
| Bachelor's Degree or higher | 438 (86.6%) | 68 (13.4%) |
Occupancy by Age of Householder in Buckley
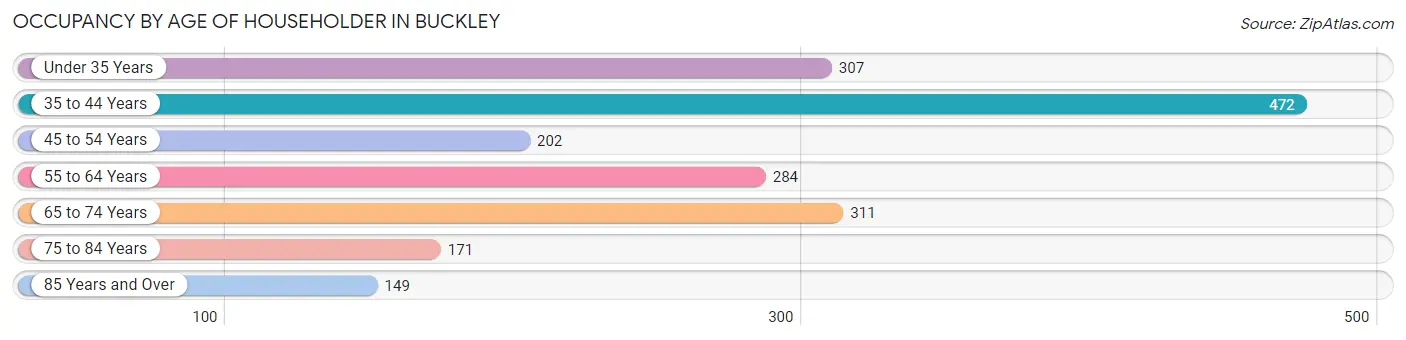
| Age Bracket | # Households | % Households |
| Under 35 Years | 307 | 16.2% |
| 35 to 44 Years | 472 | 24.9% |
| 45 to 54 Years | 202 | 10.6% |
| 55 to 64 Years | 284 | 15.0% |
| 65 to 74 Years | 311 | 16.4% |
| 75 to 84 Years | 171 | 9.0% |
| 85 Years and Over | 149 | 7.9% |
| Total | 1,896 | 100.0% |
Housing Finances in Buckley
Median Income by Occupancy in Buckley
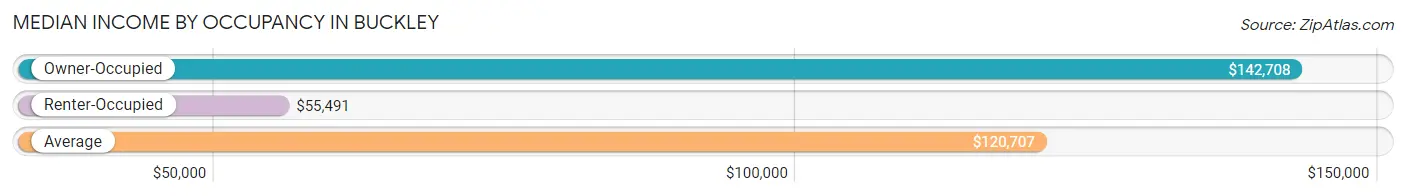
| Occupancy Type | # Households | Median Income |
| Owner-Occupied | 1,333 (70.3%) | $142,708 |
| Renter-Occupied | 563 (29.7%) | $55,491 |
| Average | 1,896 (100.0%) | $120,707 |
Occupancy by Householder Income Bracket in Buckley
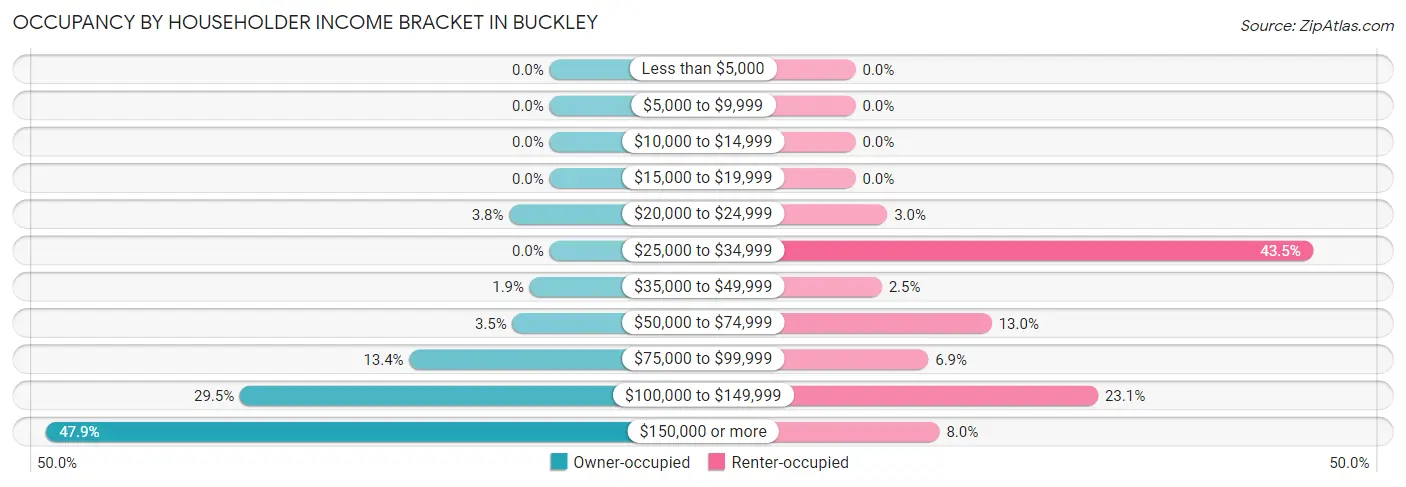
| Income Bracket | Owner-occupied | Renter-occupied |
| Less than $5,000 | 0 (0.0%) | 0 (0.0%) |
| $5,000 to $9,999 | 0 (0.0%) | 0 (0.0%) |
| $10,000 to $14,999 | 0 (0.0%) | 0 (0.0%) |
| $15,000 to $19,999 | 0 (0.0%) | 0 (0.0%) |
| $20,000 to $24,999 | 51 (3.8%) | 17 (3.0%) |
| $25,000 to $34,999 | 0 (0.0%) | 245 (43.5%) |
| $35,000 to $49,999 | 25 (1.9%) | 14 (2.5%) |
| $50,000 to $74,999 | 47 (3.5%) | 73 (13.0%) |
| $75,000 to $99,999 | 178 (13.4%) | 39 (6.9%) |
| $100,000 to $149,999 | 393 (29.5%) | 130 (23.1%) |
| $150,000 or more | 639 (47.9%) | 45 (8.0%) |
| Total | 1,333 (100.0%) | 563 (100.0%) |
Monthly Housing Cost Tiers in Buckley
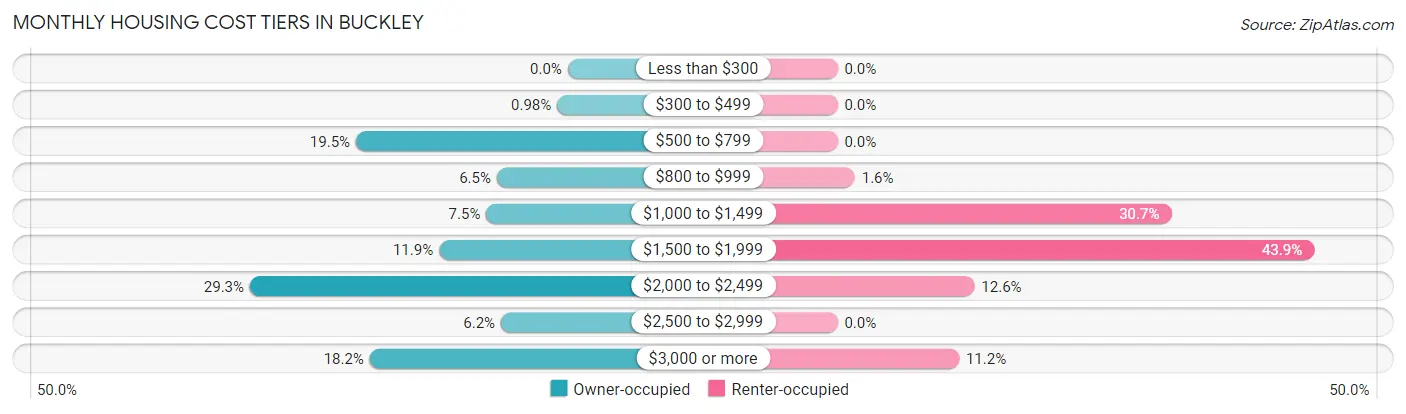
| Monthly Cost | Owner-occupied | Renter-occupied |
| Less than $300 | 0 (0.0%) | 0 (0.0%) |
| $300 to $499 | 13 (1.0%) | 0 (0.0%) |
| $500 to $799 | 260 (19.5%) | 0 (0.0%) |
| $800 to $999 | 87 (6.5%) | 9 (1.6%) |
| $1,000 to $1,499 | 100 (7.5%) | 173 (30.7%) |
| $1,500 to $1,999 | 158 (11.8%) | 247 (43.9%) |
| $2,000 to $2,499 | 390 (29.3%) | 71 (12.6%) |
| $2,500 to $2,999 | 82 (6.1%) | 0 (0.0%) |
| $3,000 or more | 243 (18.2%) | 63 (11.2%) |
| Total | 1,333 (100.0%) | 563 (100.0%) |
Physical Housing Characteristics in Buckley
Housing Structures in Buckley
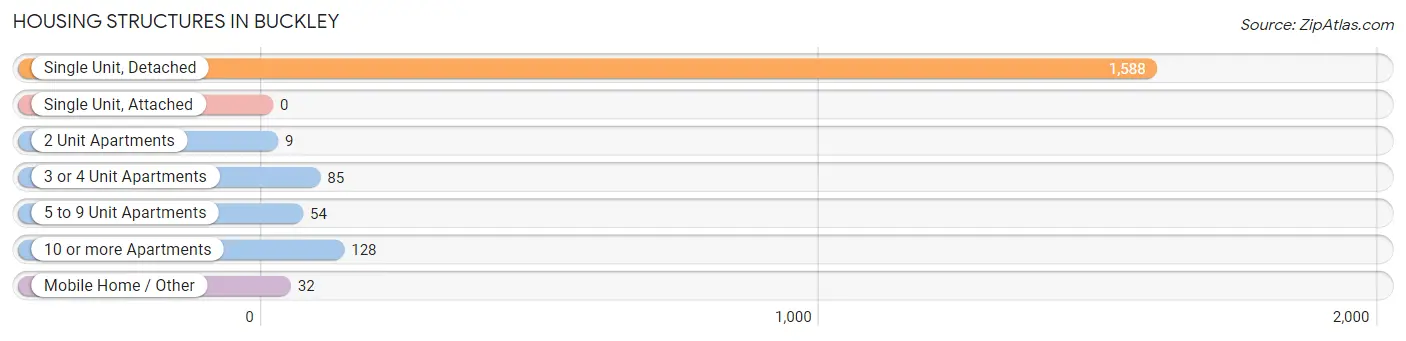
| Structure Type | # Housing Units | % Housing Units |
| Single Unit, Detached | 1,588 | 83.8% |
| Single Unit, Attached | 0 | 0.0% |
| 2 Unit Apartments | 9 | 0.5% |
| 3 or 4 Unit Apartments | 85 | 4.5% |
| 5 to 9 Unit Apartments | 54 | 2.9% |
| 10 or more Apartments | 128 | 6.8% |
| Mobile Home / Other | 32 | 1.7% |
| Total | 1,896 | 100.0% |
Housing Structures by Occupancy in Buckley
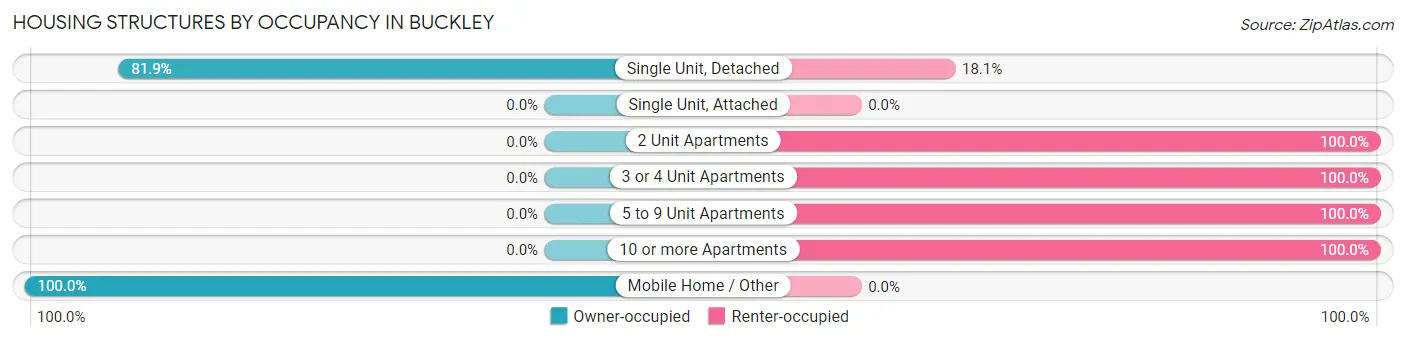
| Structure Type | Owner-occupied | Renter-occupied |
| Single Unit, Detached | 1,301 (81.9%) | 287 (18.1%) |
| Single Unit, Attached | 0 (0.0%) | 0 (0.0%) |
| 2 Unit Apartments | 0 (0.0%) | 9 (100.0%) |
| 3 or 4 Unit Apartments | 0 (0.0%) | 85 (100.0%) |
| 5 to 9 Unit Apartments | 0 (0.0%) | 54 (100.0%) |
| 10 or more Apartments | 0 (0.0%) | 128 (100.0%) |
| Mobile Home / Other | 32 (100.0%) | 0 (0.0%) |
| Total | 1,333 (70.3%) | 563 (29.7%) |
Housing Structures by Number of Rooms in Buckley
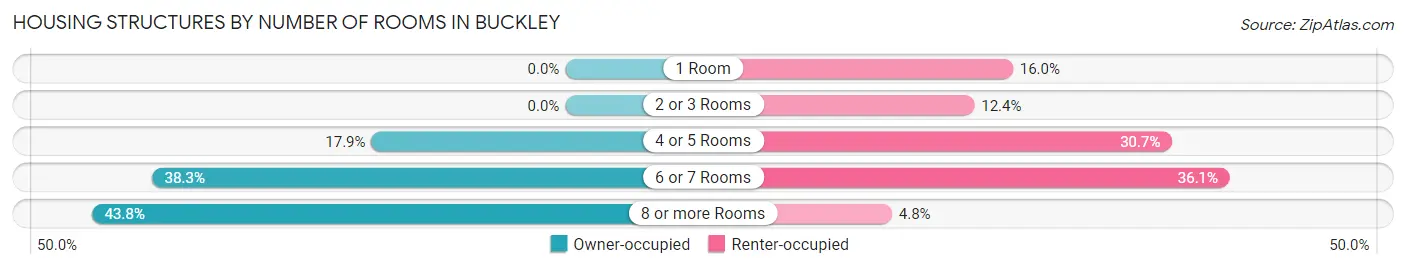
| Number of Rooms | Owner-occupied | Renter-occupied |
| 1 Room | 0 (0.0%) | 90 (16.0%) |
| 2 or 3 Rooms | 0 (0.0%) | 70 (12.4%) |
| 4 or 5 Rooms | 239 (17.9%) | 173 (30.7%) |
| 6 or 7 Rooms | 510 (38.3%) | 203 (36.1%) |
| 8 or more Rooms | 584 (43.8%) | 27 (4.8%) |
| Total | 1,333 (100.0%) | 563 (100.0%) |
Housing Structure by Heating Type in Buckley
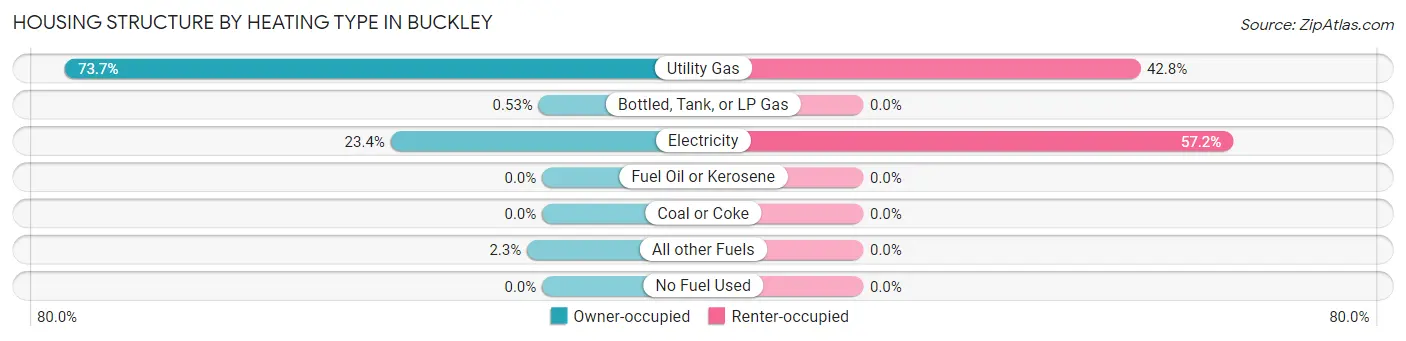
| Heating Type | Owner-occupied | Renter-occupied |
| Utility Gas | 983 (73.7%) | 241 (42.8%) |
| Bottled, Tank, or LP Gas | 7 (0.5%) | 0 (0.0%) |
| Electricity | 312 (23.4%) | 322 (57.2%) |
| Fuel Oil or Kerosene | 0 (0.0%) | 0 (0.0%) |
| Coal or Coke | 0 (0.0%) | 0 (0.0%) |
| All other Fuels | 31 (2.3%) | 0 (0.0%) |
| No Fuel Used | 0 (0.0%) | 0 (0.0%) |
| Total | 1,333 (100.0%) | 563 (100.0%) |
Household Vehicle Usage in Buckley
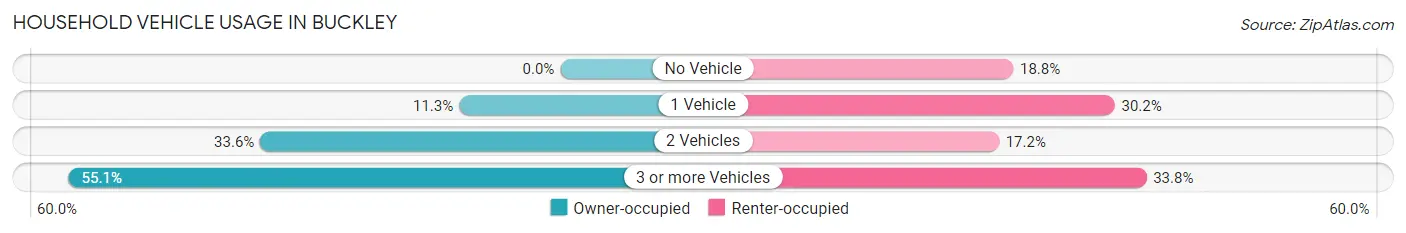
| Vehicles per Household | Owner-occupied | Renter-occupied |
| No Vehicle | 0 (0.0%) | 106 (18.8%) |
| 1 Vehicle | 151 (11.3%) | 170 (30.2%) |
| 2 Vehicles | 448 (33.6%) | 97 (17.2%) |
| 3 or more Vehicles | 734 (55.1%) | 190 (33.8%) |
| Total | 1,333 (100.0%) | 563 (100.0%) |
Real Estate & Mortgages in Buckley
Real Estate and Mortgage Overview in Buckley
| Characteristic | Without Mortgage | With Mortgage |
| Housing Units | 390 | 943 |
| Median Property Value | $421,700 | $544,300 |
| Median Household Income | $120,395 | $525 |
| Monthly Housing Costs | $770 | $243 |
| Real Estate Taxes | $4,411 | $0 |
Property Value by Mortgage Status in Buckley
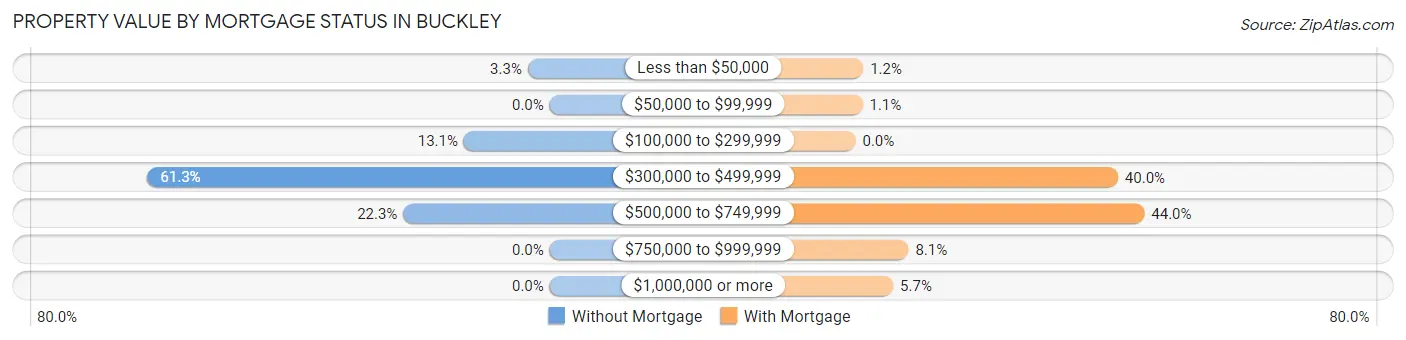
| Property Value | Without Mortgage | With Mortgage |
| Less than $50,000 | 13 (3.3%) | 11 (1.2%) |
| $50,000 to $99,999 | 0 (0.0%) | 10 (1.1%) |
| $100,000 to $299,999 | 51 (13.1%) | 0 (0.0%) |
| $300,000 to $499,999 | 239 (61.3%) | 377 (40.0%) |
| $500,000 to $749,999 | 87 (22.3%) | 415 (44.0%) |
| $750,000 to $999,999 | 0 (0.0%) | 76 (8.1%) |
| $1,000,000 or more | 0 (0.0%) | 54 (5.7%) |
| Total | 390 (100.0%) | 943 (100.0%) |
Household Income by Mortgage Status in Buckley
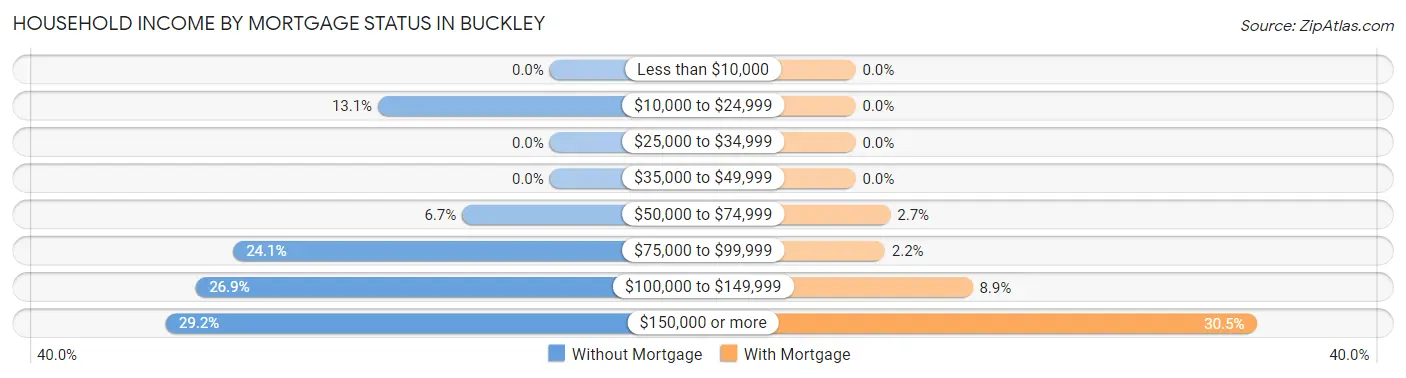
| Household Income | Without Mortgage | With Mortgage |
| Less than $10,000 | 0 (0.0%) | 0 (0.0%) |
| $10,000 to $24,999 | 51 (13.1%) | 0 (0.0%) |
| $25,000 to $34,999 | 0 (0.0%) | 0 (0.0%) |
| $35,000 to $49,999 | 0 (0.0%) | 0 (0.0%) |
| $50,000 to $74,999 | 26 (6.7%) | 25 (2.6%) |
| $75,000 to $99,999 | 94 (24.1%) | 21 (2.2%) |
| $100,000 to $149,999 | 105 (26.9%) | 84 (8.9%) |
| $150,000 or more | 114 (29.2%) | 288 (30.5%) |
| Total | 390 (100.0%) | 943 (100.0%) |
Property Value to Household Income Ratio in Buckley
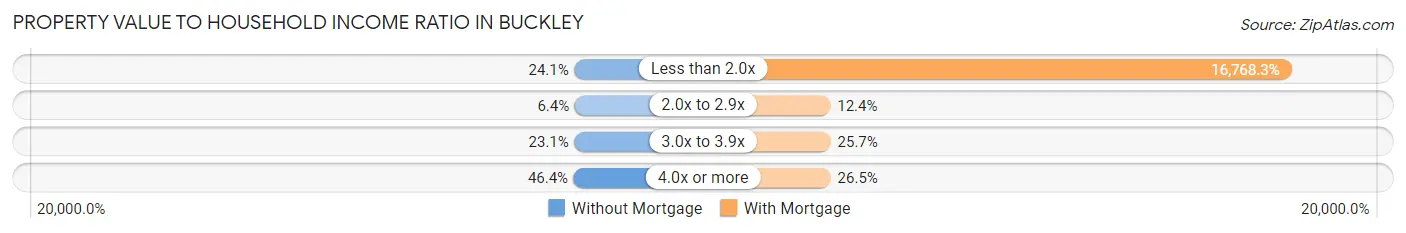
| Value-to-Income Ratio | Without Mortgage | With Mortgage |
| Less than 2.0x | 94 (24.1%) | 158,125 (16,768.3%) |
| 2.0x to 2.9x | 25 (6.4%) | 117 (12.4%) |
| 3.0x to 3.9x | 90 (23.1%) | 242 (25.7%) |
| 4.0x or more | 181 (46.4%) | 250 (26.5%) |
| Total | 390 (100.0%) | 943 (100.0%) |
Real Estate Taxes by Mortgage Status in Buckley
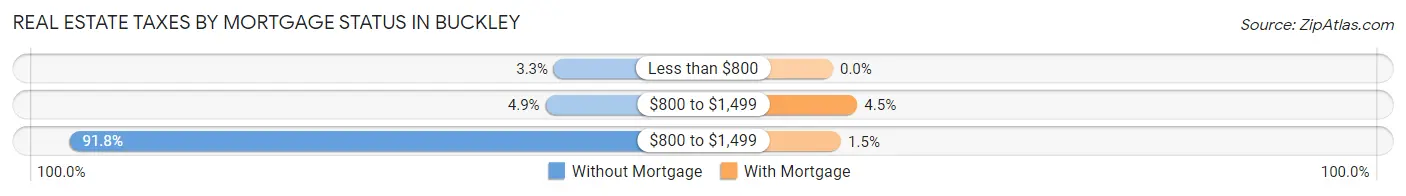
| Property Taxes | Without Mortgage | With Mortgage |
| Less than $800 | 13 (3.3%) | 0 (0.0%) |
| $800 to $1,499 | 19 (4.9%) | 42 (4.4%) |
| $800 to $1,499 | 358 (91.8%) | 14 (1.5%) |
| Total | 390 (100.0%) | 943 (100.0%) |
Health & Disability in Buckley
Health Insurance Coverage by Age in Buckley
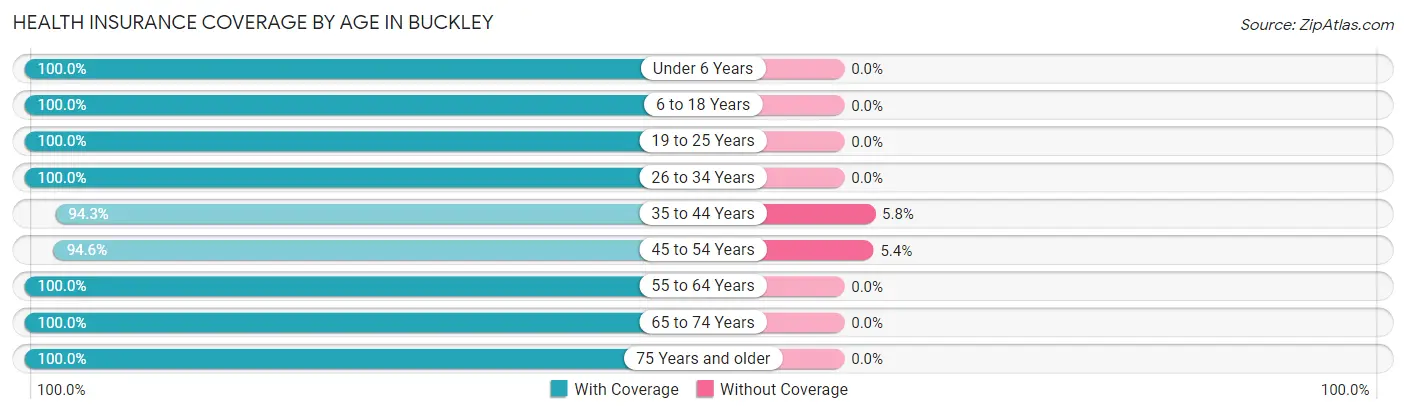
| Age Bracket | With Coverage | Without Coverage |
| Under 6 Years | 330 (100.0%) | 0 (0.0%) |
| 6 to 18 Years | 712 (100.0%) | 0 (0.0%) |
| 19 to 25 Years | 391 (100.0%) | 0 (0.0%) |
| 26 to 34 Years | 481 (100.0%) | 0 (0.0%) |
| 35 to 44 Years | 967 (94.3%) | 59 (5.8%) |
| 45 to 54 Years | 521 (94.6%) | 30 (5.4%) |
| 55 to 64 Years | 547 (100.0%) | 0 (0.0%) |
| 65 to 74 Years | 511 (100.0%) | 0 (0.0%) |
| 75 Years and older | 600 (100.0%) | 0 (0.0%) |
| Total | 5,060 (98.3%) | 89 (1.7%) |
Health Insurance Coverage by Citizenship Status in Buckley
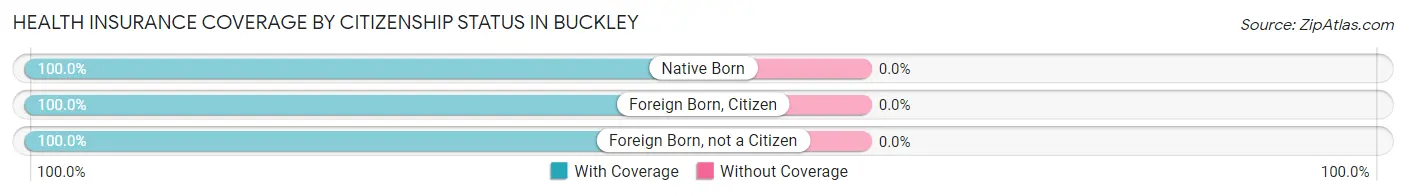
| Citizenship Status | With Coverage | Without Coverage |
| Native Born | 330 (100.0%) | 0 (0.0%) |
| Foreign Born, Citizen | 712 (100.0%) | 0 (0.0%) |
| Foreign Born, not a Citizen | 391 (100.0%) | 0 (0.0%) |
Health Insurance Coverage by Household Income in Buckley
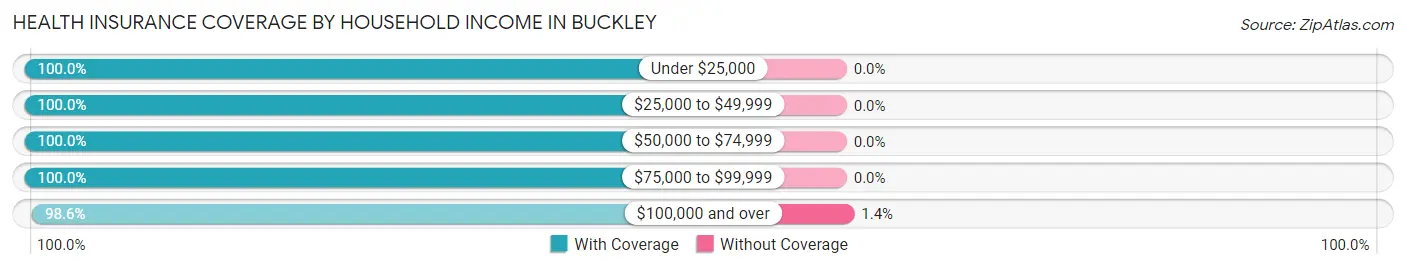
| Household Income | With Coverage | Without Coverage |
| Under $25,000 | 132 (100.0%) | 0 (0.0%) |
| $25,000 to $49,999 | 480 (100.0%) | 0 (0.0%) |
| $50,000 to $74,999 | 272 (100.0%) | 0 (0.0%) |
| $75,000 to $99,999 | 537 (100.0%) | 0 (0.0%) |
| $100,000 and over | 3,390 (98.6%) | 49 (1.4%) |
Public vs Private Health Insurance Coverage by Age in Buckley
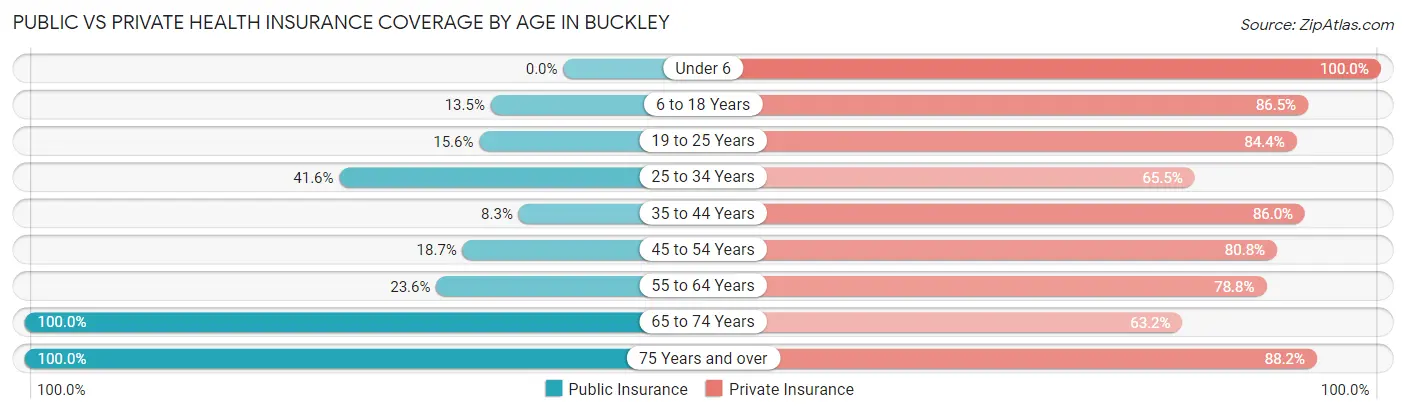
| Age Bracket | Public Insurance | Private Insurance |
| Under 6 | 0 (0.0%) | 330 (100.0%) |
| 6 to 18 Years | 96 (13.5%) | 616 (86.5%) |
| 19 to 25 Years | 61 (15.6%) | 330 (84.4%) |
| 25 to 34 Years | 200 (41.6%) | 315 (65.5%) |
| 35 to 44 Years | 85 (8.3%) | 882 (86.0%) |
| 45 to 54 Years | 103 (18.7%) | 445 (80.8%) |
| 55 to 64 Years | 129 (23.6%) | 431 (78.8%) |
| 65 to 74 Years | 511 (100.0%) | 323 (63.2%) |
| 75 Years and over | 600 (100.0%) | 529 (88.2%) |
| Total | 1,785 (34.7%) | 4,201 (81.6%) |
Disability Status by Sex by Age in Buckley
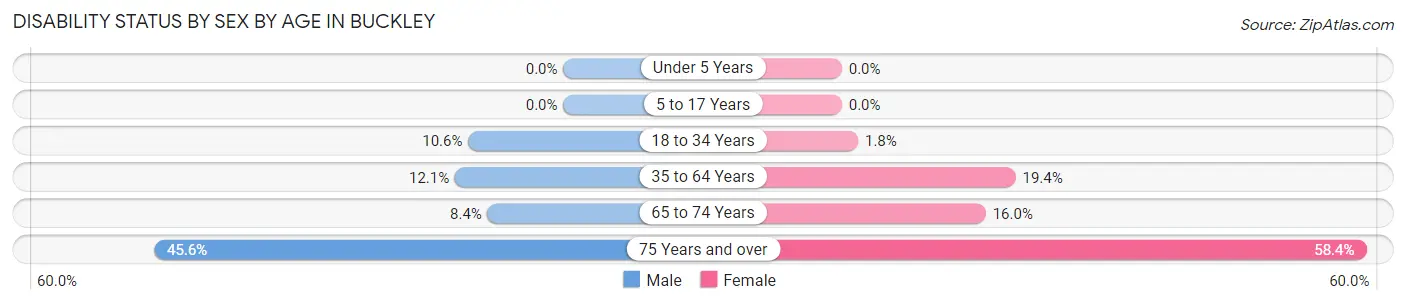
| Age Bracket | Male | Female |
| Under 5 Years | 0 (0.0%) | 0 (0.0%) |
| 5 to 17 Years | 0 (0.0%) | 0 (0.0%) |
| 18 to 34 Years | 34 (10.6%) | 10 (1.8%) |
| 35 to 64 Years | 129 (12.1%) | 204 (19.4%) |
| 65 to 74 Years | 21 (8.4%) | 42 (16.0%) |
| 75 Years and over | 119 (45.6%) | 198 (58.4%) |
Disability Class by Sex by Age in Buckley
Disability Class: Hearing Difficulty
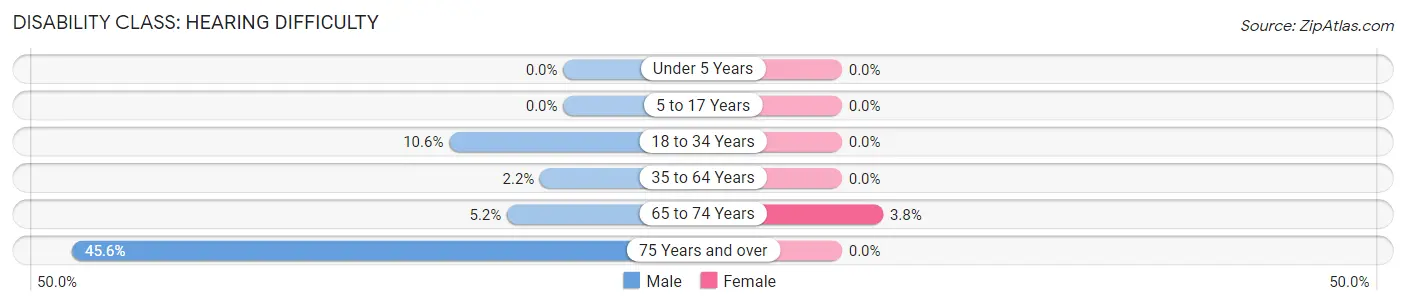
| Age Bracket | Male | Female |
| Under 5 Years | 0 (0.0%) | 0 (0.0%) |
| 5 to 17 Years | 0 (0.0%) | 0 (0.0%) |
| 18 to 34 Years | 34 (10.6%) | 0 (0.0%) |
| 35 to 64 Years | 23 (2.1%) | 0 (0.0%) |
| 65 to 74 Years | 13 (5.2%) | 10 (3.8%) |
| 75 Years and over | 119 (45.6%) | 0 (0.0%) |
Disability Class: Vision Difficulty
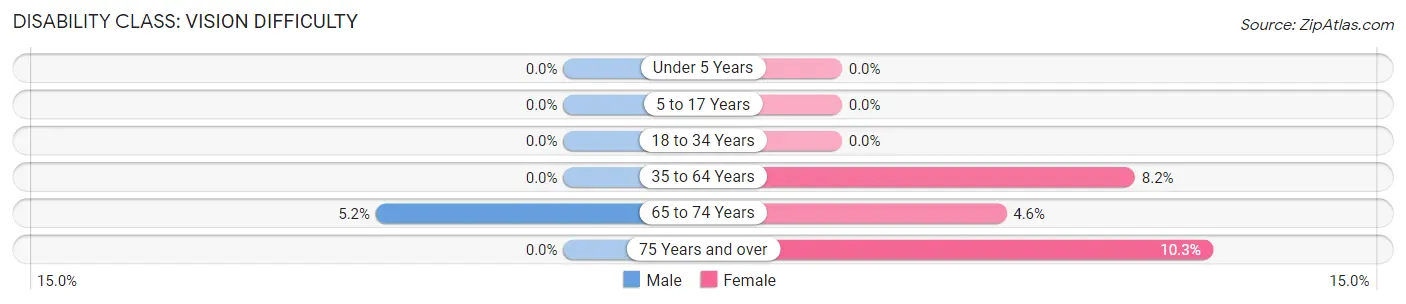
| Age Bracket | Male | Female |
| Under 5 Years | 0 (0.0%) | 0 (0.0%) |
| 5 to 17 Years | 0 (0.0%) | 0 (0.0%) |
| 18 to 34 Years | 0 (0.0%) | 0 (0.0%) |
| 35 to 64 Years | 0 (0.0%) | 86 (8.2%) |
| 65 to 74 Years | 13 (5.2%) | 12 (4.6%) |
| 75 Years and over | 0 (0.0%) | 35 (10.3%) |
Disability Class: Cognitive Difficulty
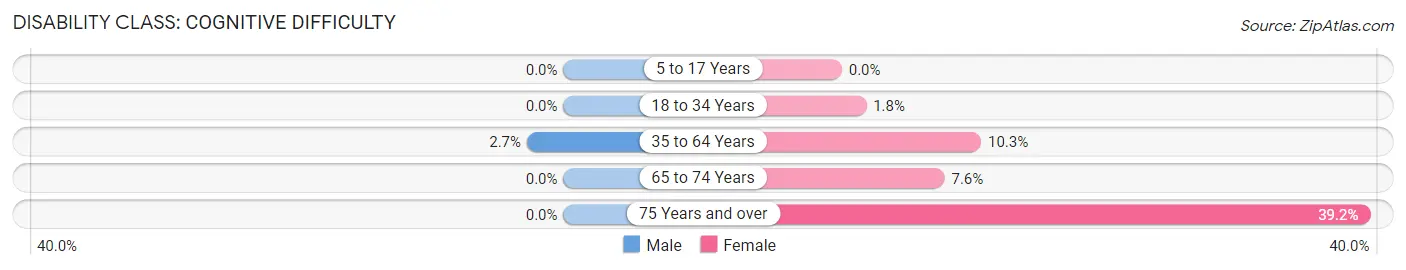
| Age Bracket | Male | Female |
| 5 to 17 Years | 0 (0.0%) | 0 (0.0%) |
| 18 to 34 Years | 0 (0.0%) | 10 (1.8%) |
| 35 to 64 Years | 29 (2.7%) | 109 (10.3%) |
| 65 to 74 Years | 0 (0.0%) | 20 (7.6%) |
| 75 Years and over | 0 (0.0%) | 133 (39.2%) |
Disability Class: Ambulatory Difficulty
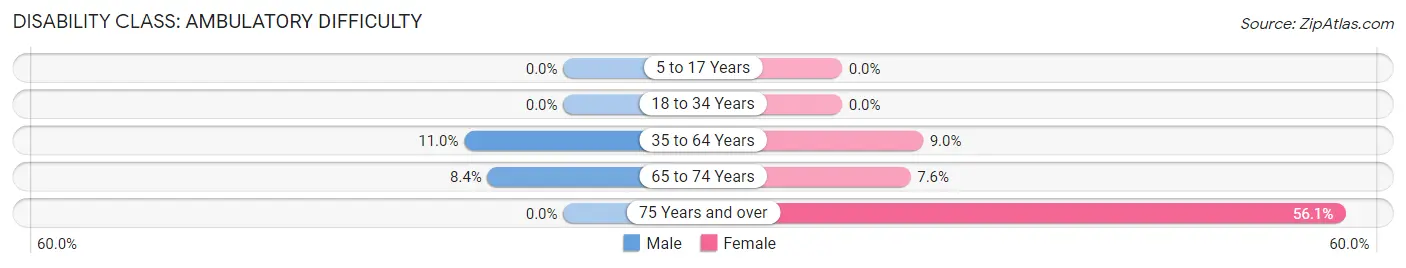
| Age Bracket | Male | Female |
| 5 to 17 Years | 0 (0.0%) | 0 (0.0%) |
| 18 to 34 Years | 0 (0.0%) | 0 (0.0%) |
| 35 to 64 Years | 118 (11.0%) | 95 (9.0%) |
| 65 to 74 Years | 21 (8.4%) | 20 (7.6%) |
| 75 Years and over | 0 (0.0%) | 190 (56.0%) |
Disability Class: Self-Care Difficulty
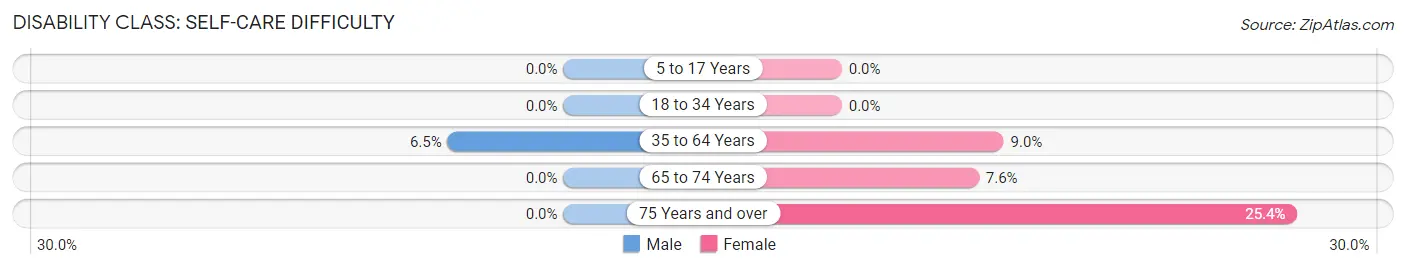
| Age Bracket | Male | Female |
| 5 to 17 Years | 0 (0.0%) | 0 (0.0%) |
| 18 to 34 Years | 0 (0.0%) | 0 (0.0%) |
| 35 to 64 Years | 69 (6.5%) | 95 (9.0%) |
| 65 to 74 Years | 0 (0.0%) | 20 (7.6%) |
| 75 Years and over | 0 (0.0%) | 86 (25.4%) |
Technology Access in Buckley
Computing Device Access in Buckley
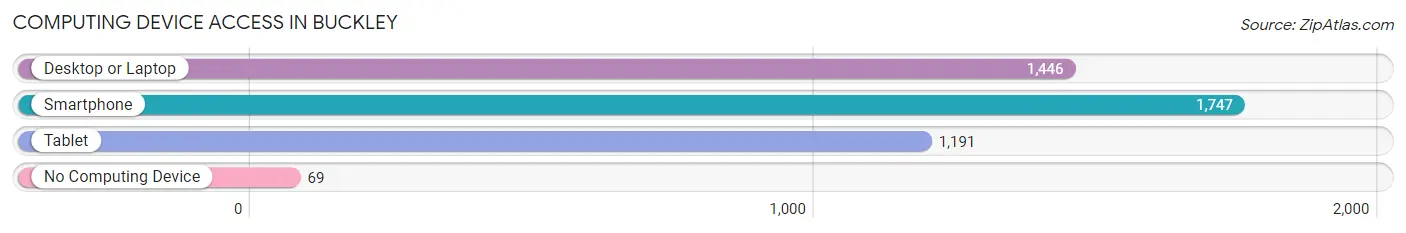
| Device Type | # Households | % Households |
| Desktop or Laptop | 1,446 | 76.3% |
| Smartphone | 1,747 | 92.1% |
| Tablet | 1,191 | 62.8% |
| No Computing Device | 69 | 3.6% |
| Total | 1,896 | 100.0% |
Internet Access in Buckley
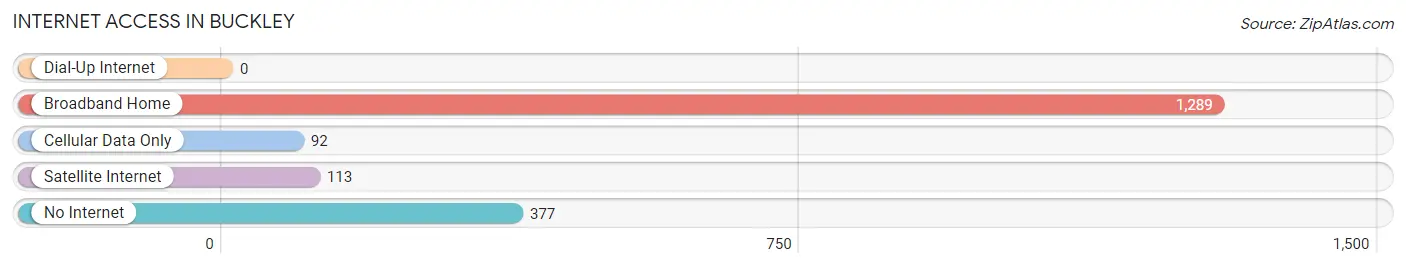
| Internet Type | # Households | % Households |
| Dial-Up Internet | 0 | 0.0% |
| Broadband Home | 1,289 | 68.0% |
| Cellular Data Only | 92 | 4.9% |
| Satellite Internet | 113 | 6.0% |
| No Internet | 377 | 19.9% |
| Total | 1,896 | 100.0% |
Buckley Summary
Buckley, Washington is a small city located in Pierce County, Washington, United States. It is situated in the foothills of the Cascade Mountains, approximately 25 miles southeast of Tacoma and 40 miles south of Seattle. The city has a population of 4,845 as of the 2010 census, and is part of the Seattle metropolitan area.
History
The area that is now Buckley was first settled in the late 1800s by homesteaders. The town was officially incorporated in 1890 and named after John Buckley, a local settler. The town was initially a logging and farming community, but in the early 1900s, the economy shifted to coal mining. The coal industry was the primary source of employment in the area until the 1950s, when the mines began to close.
In the 1960s, Buckley began to experience a period of growth and development. The city was connected to the Seattle metropolitan area by the completion of State Route 410 in 1965, and the population began to increase. In the 1970s, Buckley began to experience a period of economic decline, as the coal industry declined and the city’s population began to decline.
Geography
Buckley is located in the foothills of the Cascade Mountains, approximately 25 miles southeast of Tacoma and 40 miles south of Seattle. The city is situated at an elevation of 1,000 feet above sea level. The city is located in a valley surrounded by hills and mountains, and is bordered by the White River to the north and the Carbon River to the south.
The climate in Buckley is mild and temperate, with warm summers and cool winters. The average annual temperature is around 50 degrees Fahrenheit, and the average annual precipitation is around 40 inches.
Economy
The economy of Buckley is largely based on the service industry. The city is home to several retail stores, restaurants, and other businesses. The city is also home to several manufacturing companies, including a paper mill and a wood products plant.
The city is also home to several government agencies, including the Buckley Fire Department, Buckley Police Department, and Buckley Public Works. The city is also home to several schools, including Buckley Elementary School, Buckley Middle School, and Buckley High School.
Demographics
As of the 2010 census, the population of Buckley was 4,845. The racial makeup of the city was 87.3% White, 4.2% Hispanic or Latino, 2.2% Asian, 1.7% African American, 0.7% Native American, and 0.1% Pacific Islander. The median household income in Buckley was $50,945, and the median family income was $60,945.
Conclusion
Buckley, Washington is a small city located in Pierce County, Washington, United States. It is situated in the foothills of the Cascade Mountains, approximately 25 miles southeast of Tacoma and 40 miles south of Seattle. The city has a population of 4,845 as of the 2010 census, and is part of the Seattle metropolitan area. The economy of Buckley is largely based on the service industry, and the city is home to several government agencies, retail stores, restaurants, and other businesses. The racial makeup of the city is 87.3% White, 4.2% Hispanic or Latino, 2.2% Asian, 1.7% African American, 0.7% Native American, and 0.1% Pacific Islander. The median household income in Buckley was $50,945, and the median family income was $60,945.
Common Questions
What is Per Capita Income in Buckley?
Per Capita income in Buckley is $51,606.
What is the Median Family Income in Buckley?
Median Family Income in Buckley is $122,011.
What is the Median Household income in Buckley?
Median Household Income in Buckley is $120,707.
What is Income or Wage Gap in Buckley?
Income or Wage Gap in Buckley is 27.3%.
Women in Buckley earn 72.7 cents for every dollar earned by a man.
What is Inequality or Gini Index in Buckley?
Inequality or Gini Index in Buckley is 0.37.
What is the Total Population of Buckley?
Total Population of Buckley is 5,191.
What is the Total Male Population of Buckley?
Total Male Population of Buckley is 2,481.
What is the Total Female Population of Buckley?
Total Female Population of Buckley is 2,710.
What is the Ratio of Males per 100 Females in Buckley?
There are 91.55 Males per 100 Females in Buckley.
What is the Ratio of Females per 100 Males in Buckley?
There are 109.23 Females per 100 Males in Buckley.
What is the Median Population Age in Buckley?
Median Population Age in Buckley is 41.7 Years.
What is the Average Family Size in Buckley
Average Family Size in Buckley is 3.0 People.
What is the Average Household Size in Buckley
Average Household Size in Buckley is 2.6 People.
How Large is the Labor Force in Buckley?
There are 2,568 People in the Labor Forcein in Buckley.
What is the Percentage of People in the Labor Force in Buckley?
61.6% of People are in the Labor Force in Buckley.
What is the Unemployment Rate in Buckley?
Unemployment Rate in Buckley is 2.8%.