Bay Center, WA Map & Demographics
Bay Center Map
Bay Center Overview
$79,339
PER CAPITA INCOME
$66,250
AVG HOUSEHOLD INCOME
0.59
INEQUALITY / GINI INDEX
180
TOTAL POPULATION
86
MALE POPULATION
94
FEMALE POPULATION
91.49
MALES / 100 FEMALES
109.30
FEMALES / 100 MALES
61.3
MEDIAN AGE
2.3
AVG FAMILY SIZE
1.7
AVG HOUSEHOLD SIZE
76
LABOR FORCE [ PEOPLE ]
44.2%
PERCENT IN LABOR FORCE
9.2%
UNEMPLOYMENT RATE
Bay Center Zip Codes
Bay Center Area Codes
Income in Bay Center
Income Overview in Bay Center
| Characteristic | Number | Measure |
| Per Capita Income | 180 | $79,339 |
| Median Family Income | 47 | $0 |
| Mean Family Income | 47 | $229,011 |
| Median Household Income | 105 | $66,250 |
| Mean Household Income | 105 | $126,476 |
| Income Deficit | 47 | $0 |
| Wage / Income Gap (%) | 180 | 0.00% |
| Wage / Income Gap ($) | 180 | 100.00¢ per $1 |
| Gini / Inequality Index | 180 | 0.59 |
Earnings by Sex in Bay Center
| Sex | Number | Average Earnings |
| Male | 45 (50.6%) | $0 |
| Female | 44 (49.4%) | $0 |
| Total | 89 (100.0%) | $0 |
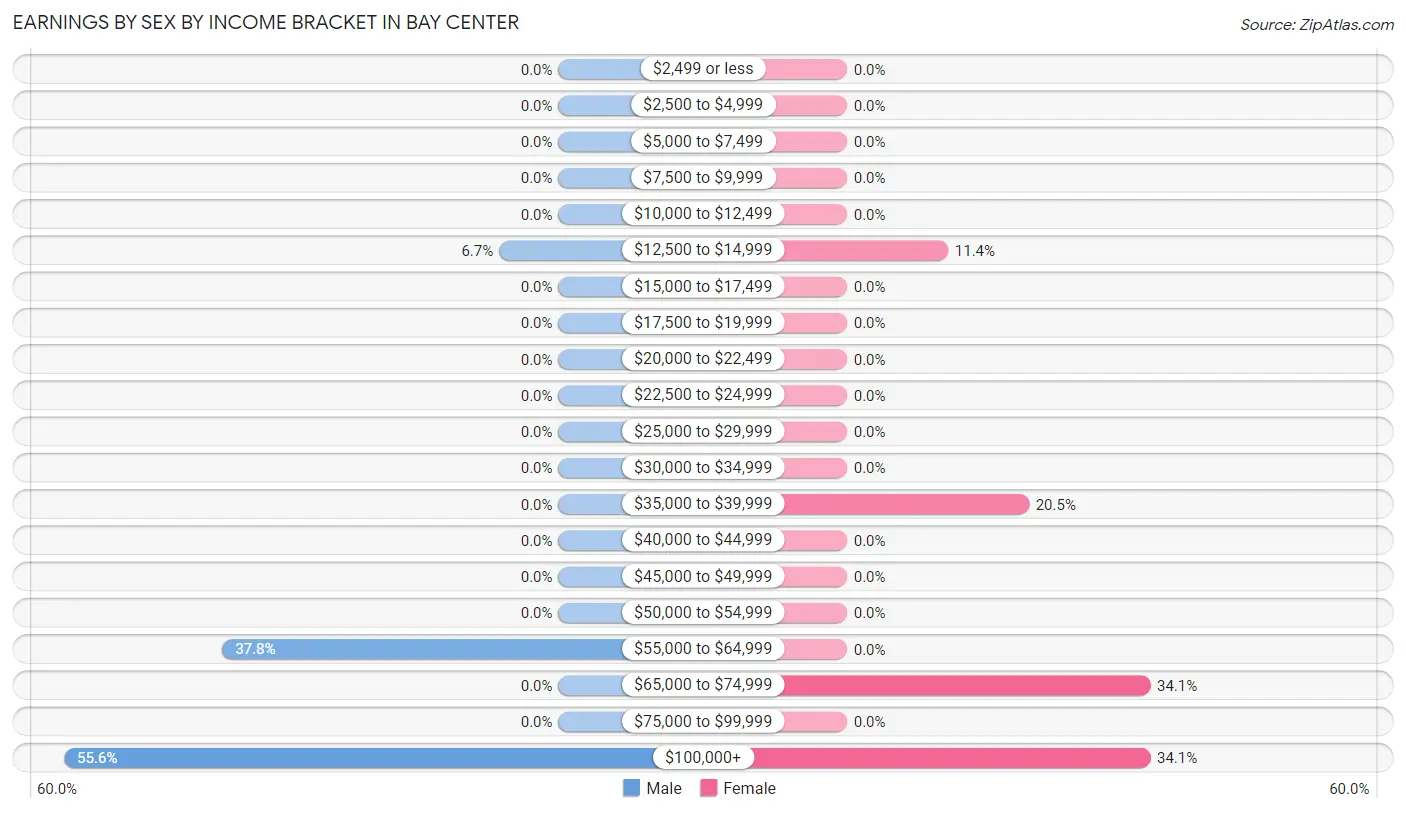
Earnings by Sex by Income Bracket in Bay Center
The most common earnings brackets in Bay Center are $100,000+ for men (25 | 55.6%) and $65,000 to $74,999 for women (15 | 34.1%).
| Income | Male | Female |
| $2,499 or less | 0 (0.0%) | 0 (0.0%) |
| $2,500 to $4,999 | 0 (0.0%) | 0 (0.0%) |
| $5,000 to $7,499 | 0 (0.0%) | 0 (0.0%) |
| $7,500 to $9,999 | 0 (0.0%) | 0 (0.0%) |
| $10,000 to $12,499 | 0 (0.0%) | 0 (0.0%) |
| $12,500 to $14,999 | 3 (6.7%) | 5 (11.4%) |
| $15,000 to $17,499 | 0 (0.0%) | 0 (0.0%) |
| $17,500 to $19,999 | 0 (0.0%) | 0 (0.0%) |
| $20,000 to $22,499 | 0 (0.0%) | 0 (0.0%) |
| $22,500 to $24,999 | 0 (0.0%) | 0 (0.0%) |
| $25,000 to $29,999 | 0 (0.0%) | 0 (0.0%) |
| $30,000 to $34,999 | 0 (0.0%) | 0 (0.0%) |
| $35,000 to $39,999 | 0 (0.0%) | 9 (20.4%) |
| $40,000 to $44,999 | 0 (0.0%) | 0 (0.0%) |
| $45,000 to $49,999 | 0 (0.0%) | 0 (0.0%) |
| $50,000 to $54,999 | 0 (0.0%) | 0 (0.0%) |
| $55,000 to $64,999 | 17 (37.8%) | 0 (0.0%) |
| $65,000 to $74,999 | 0 (0.0%) | 15 (34.1%) |
| $75,000 to $99,999 | 0 (0.0%) | 0 (0.0%) |
| $100,000+ | 25 (55.6%) | 15 (34.1%) |
| Total | 45 (100.0%) | 44 (100.0%) |
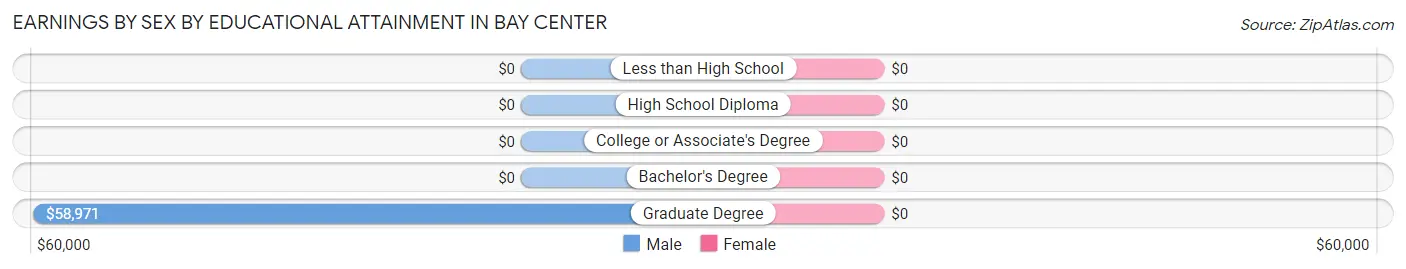
Earnings by Sex by Educational Attainment in Bay Center
| Educational Attainment | Male Income | Female Income |
| Less than High School | - | - |
| High School Diploma | - | - |
| College or Associate's Degree | - | - |
| Bachelor's Degree | - | - |
| Graduate Degree | $58,971 | $0 |
| Total | - | - |
Family Income in Bay Center
Family Income Brackets in Bay Center
According to the Bay Center family income data, there are 19 families falling into the $75,000 to $99,999 income range, which is the most common income bracket and makes up 40.4% of all families.
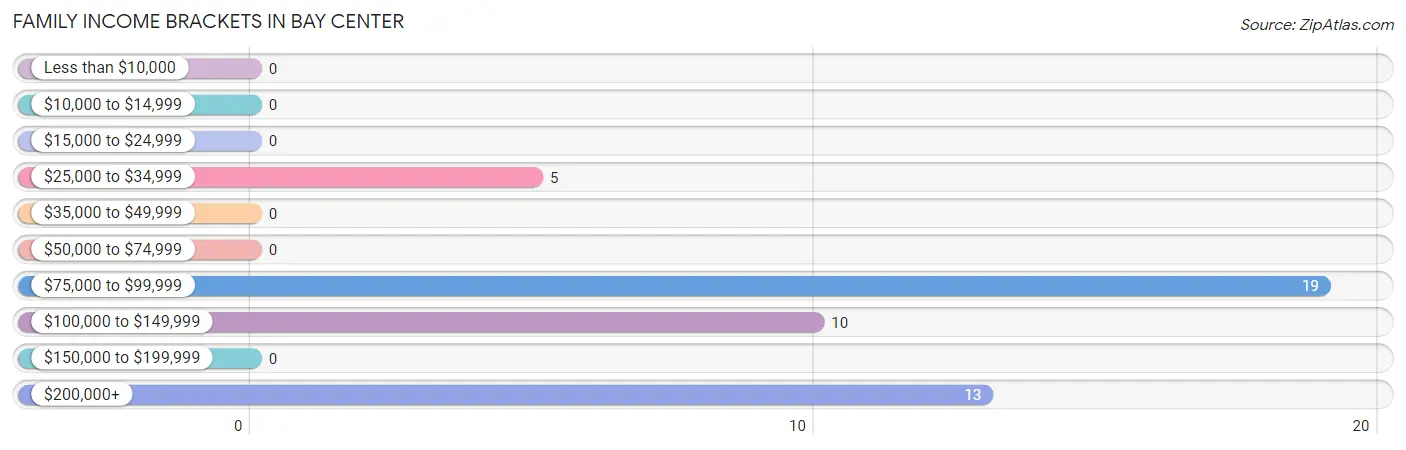
| Income Bracket | # Families | % Families |
| Less than $10,000 | 0 | 0.0% |
| $10,000 to $14,999 | 0 | 0.0% |
| $15,000 to $24,999 | 0 | 0.0% |
| $25,000 to $34,999 | 5 | 10.6% |
| $35,000 to $49,999 | 0 | 0.0% |
| $50,000 to $74,999 | 0 | 0.0% |
| $75,000 to $99,999 | 19 | 40.4% |
| $100,000 to $149,999 | 10 | 21.3% |
| $150,000 to $199,999 | 0 | 0.0% |
| $200,000+ | 13 | 27.7% |
Family Income by Famaliy Size in Bay Center
| Income Bracket | # Families | Median Income |
| 2-Person Families | 41 (87.2%) | $0 |
| 3-Person Families | 0 (0.0%) | $0 |
| 4-Person Families | 6 (12.8%) | $0 |
| 5-Person Families | 0 (0.0%) | $0 |
| 6-Person Families | 0 (0.0%) | $0 |
| 7+ Person Families | 0 (0.0%) | $0 |
| Total | 47 (100.0%) | $0 |
Family Income by Number of Earners in Bay Center
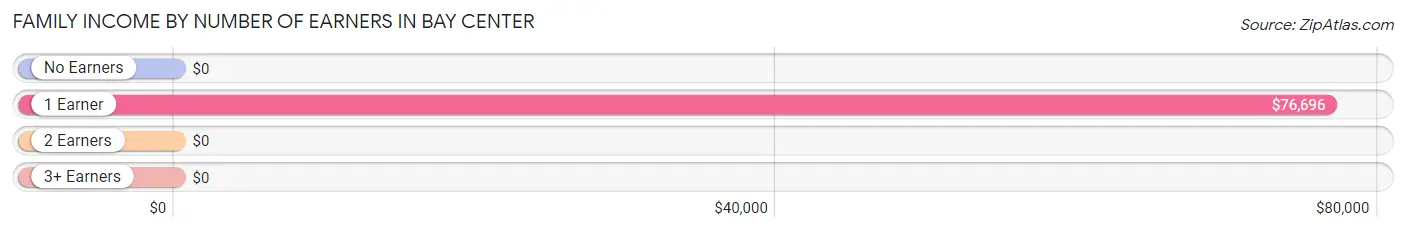
| Number of Earners | # Families | Median Income |
| No Earners | 5 (10.6%) | $0 |
| 1 Earner | 29 (61.7%) | $76,696 |
| 2 Earners | 13 (27.7%) | $0 |
| 3+ Earners | 0 (0.0%) | $0 |
| Total | 47 (100.0%) | $0 |
Household Income in Bay Center
Household Income Brackets in Bay Center
With 21 households falling in the category, the $50,000 to $74,999 income range is the most frequent in Bay Center, accounting for 20.0% of all households.
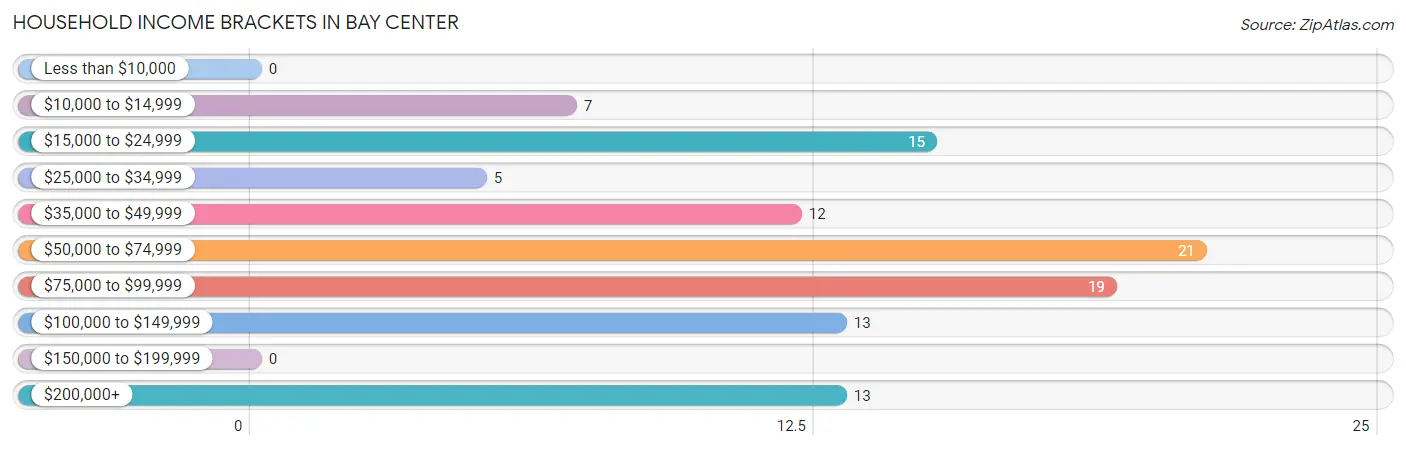
| Income Bracket | # Households | % Households |
| Less than $10,000 | 0 | 0.0% |
| $10,000 to $14,999 | 7 | 6.7% |
| $15,000 to $24,999 | 15 | 14.3% |
| $25,000 to $34,999 | 5 | 4.8% |
| $35,000 to $49,999 | 12 | 11.4% |
| $50,000 to $74,999 | 21 | 20.0% |
| $75,000 to $99,999 | 19 | 18.1% |
| $100,000 to $149,999 | 13 | 12.4% |
| $150,000 to $199,999 | 0 | 0.0% |
| $200,000+ | 13 | 12.4% |
Household Income by Householder Age in Bay Center
The median household income in Bay Center is $66,250, with the highest median household income of $67,417 found in the 45 to 64 years age bracket for the primary householder. A total of 63 households (60.0%) fall into this category.
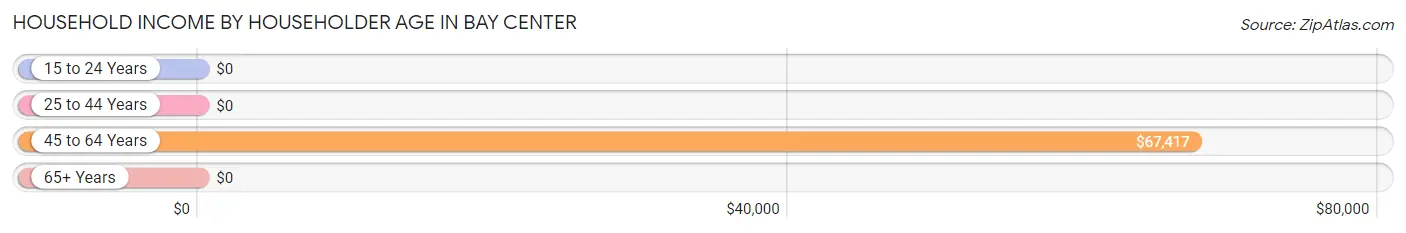
| Income Bracket | # Households | Median Income |
| 15 to 24 Years | 0 (0.0%) | $0 |
| 25 to 44 Years | 6 (5.7%) | $0 |
| 45 to 64 Years | 63 (60.0%) | $67,417 |
| 65+ Years | 36 (34.3%) | $0 |
| Total | 105 (100.0%) | $66,250 |
Poverty in Bay Center
Income Below Poverty by Sex and Age in Bay Center
With 8.1% poverty level for males and 5.3% for females among the residents of Bay Center, 55 to 64 year old males and 55 to 64 year old females are the most vulnerable to poverty, with 7 males (23.3%) and 5 females (13.5%) in their respective age groups living below the poverty level.
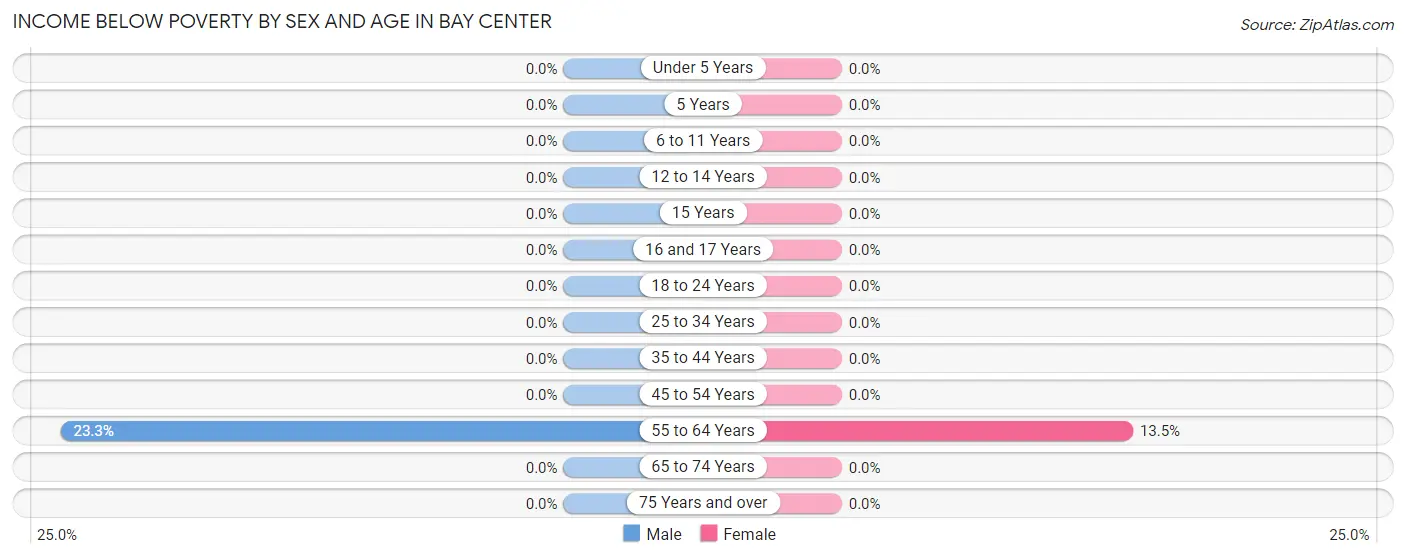
| Age Bracket | Male | Female |
| Under 5 Years | 0 (0.0%) | 0 (0.0%) |
| 5 Years | 0 (0.0%) | 0 (0.0%) |
| 6 to 11 Years | 0 (0.0%) | 0 (0.0%) |
| 12 to 14 Years | 0 (0.0%) | 0 (0.0%) |
| 15 Years | 0 (0.0%) | 0 (0.0%) |
| 16 and 17 Years | 0 (0.0%) | 0 (0.0%) |
| 18 to 24 Years | 0 (0.0%) | 0 (0.0%) |
| 25 to 34 Years | 0 (0.0%) | 0 (0.0%) |
| 35 to 44 Years | 0 (0.0%) | 0 (0.0%) |
| 45 to 54 Years | 0 (0.0%) | 0 (0.0%) |
| 55 to 64 Years | 7 (23.3%) | 5 (13.5%) |
| 65 to 74 Years | 0 (0.0%) | 0 (0.0%) |
| 75 Years and over | 0 (0.0%) | 0 (0.0%) |
| Total | 7 (8.1%) | 5 (5.3%) |
Income Above Poverty by Sex and Age in Bay Center
According to the poverty statistics in Bay Center, males aged under 5 years and females aged 25 to 34 years are the age groups that are most secure financially, with 100.0% of males and 100.0% of females in these age groups living above the poverty line.
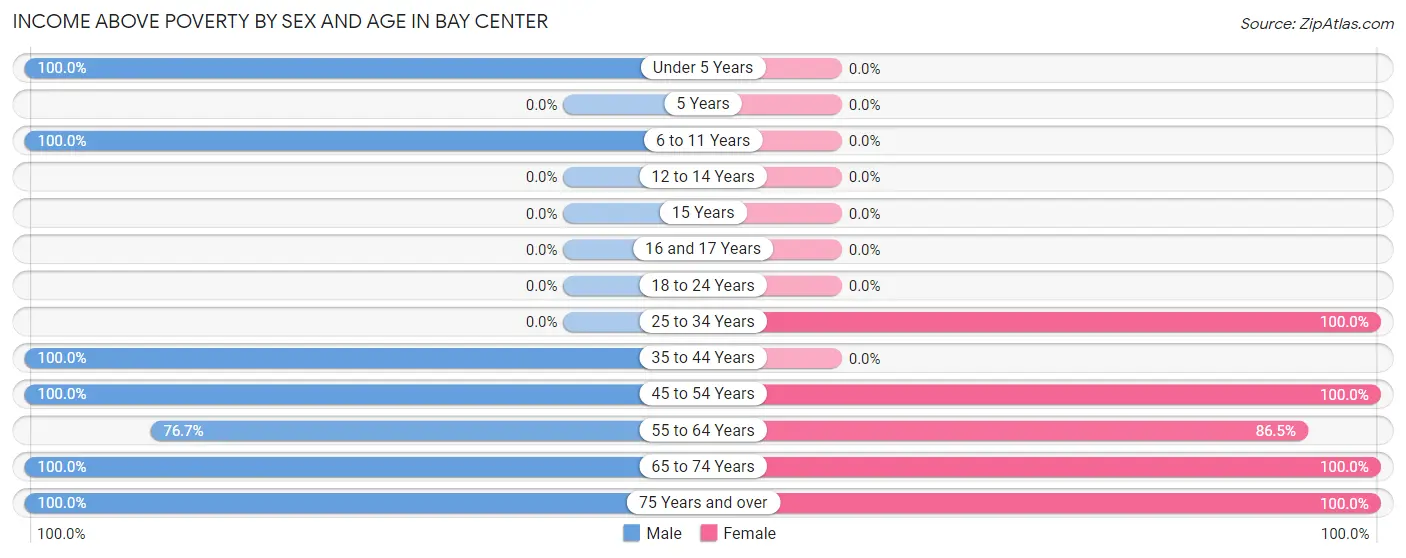
| Age Bracket | Male | Female |
| Under 5 Years | 4 (100.0%) | 0 (0.0%) |
| 5 Years | 0 (0.0%) | 0 (0.0%) |
| 6 to 11 Years | 4 (100.0%) | 0 (0.0%) |
| 12 to 14 Years | 0 (0.0%) | 0 (0.0%) |
| 15 Years | 0 (0.0%) | 0 (0.0%) |
| 16 and 17 Years | 0 (0.0%) | 0 (0.0%) |
| 18 to 24 Years | 0 (0.0%) | 0 (0.0%) |
| 25 to 34 Years | 0 (0.0%) | 7 (100.0%) |
| 35 to 44 Years | 6 (100.0%) | 0 (0.0%) |
| 45 to 54 Years | 13 (100.0%) | 30 (100.0%) |
| 55 to 64 Years | 23 (76.7%) | 32 (86.5%) |
| 65 to 74 Years | 24 (100.0%) | 5 (100.0%) |
| 75 Years and over | 5 (100.0%) | 15 (100.0%) |
| Total | 79 (91.9%) | 89 (94.7%) |
Income Below Poverty Among Married-Couple Families in Bay Center
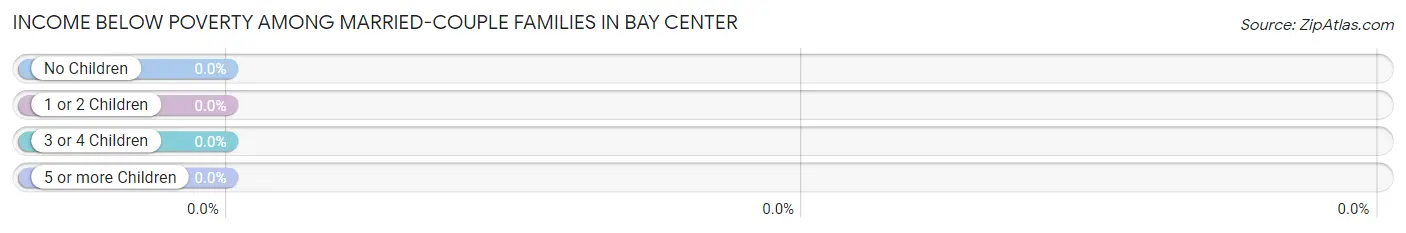
| Children | Above Poverty | Below Poverty |
| No Children | 36 (100.0%) | 0 (0.0%) |
| 1 or 2 Children | 6 (100.0%) | 0 (0.0%) |
| 3 or 4 Children | 0 (0.0%) | 0 (0.0%) |
| 5 or more Children | 0 (0.0%) | 0 (0.0%) |
| Total | 42 (100.0%) | 0 (0.0%) |
Income Below Poverty Among Single-Parent Households in Bay Center
| Children | Single Father | Single Mother |
| No Children | 0 (0.0%) | 0 (0.0%) |
| 1 or 2 Children | 0 (0.0%) | 0 (0.0%) |
| 3 or 4 Children | 0 (0.0%) | 0 (0.0%) |
| 5 or more Children | 0 (0.0%) | 0 (0.0%) |
| Total | 0 (0.0%) | 0 (0.0%) |
Income Below Poverty Among Married-Couple vs Single-Parent Households in Bay Center
| Children | Married-Couple Families | Single-Parent Households |
| No Children | 0 (0.0%) | 0 (0.0%) |
| 1 or 2 Children | 0 (0.0%) | 0 (0.0%) |
| 3 or 4 Children | 0 (0.0%) | 0 (0.0%) |
| 5 or more Children | 0 (0.0%) | 0 (0.0%) |
| Total | 0 (0.0%) | 0 (0.0%) |
Race in Bay Center
The most populous races in Bay Center are White / Caucasian (169 | 93.9%), and Native / Alaskan (11 | 6.1%).
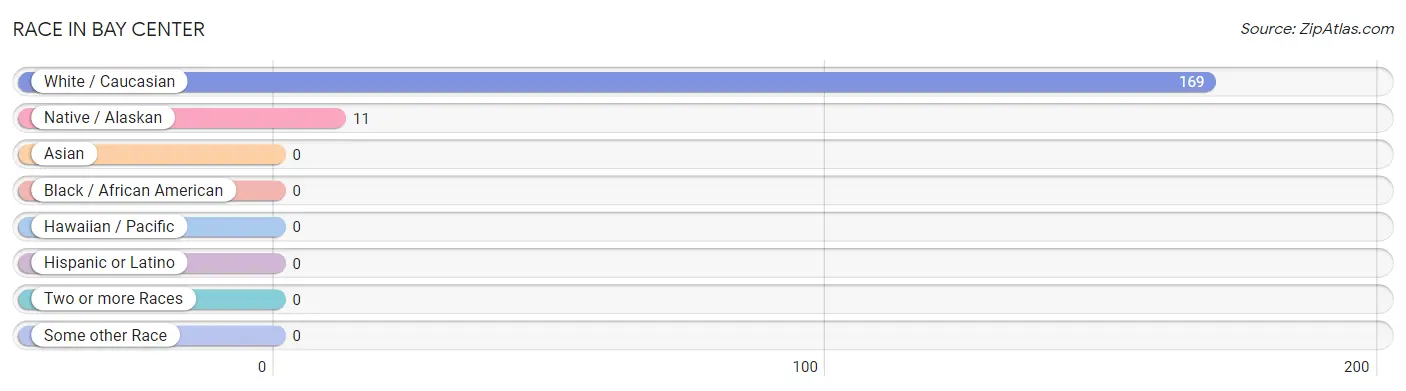
| Race | # Population | % Population |
| Asian | 0 | 0.0% |
| Black / African American | 0 | 0.0% |
| Hawaiian / Pacific | 0 | 0.0% |
| Hispanic or Latino | 0 | 0.0% |
| Native / Alaskan | 11 | 6.1% |
| White / Caucasian | 169 | 93.9% |
| Two or more Races | 0 | 0.0% |
| Some other Race | 0 | 0.0% |
| Total | 180 | 100.0% |
Ancestry in Bay Center
The most populous ancestries reported in Bay Center are English (47 | 26.1%), Irish (30 | 16.7%), German (21 | 11.7%), Norwegian (13 | 7.2%), and British (10 | 5.6%), together accounting for 67.2% of all Bay Center residents.
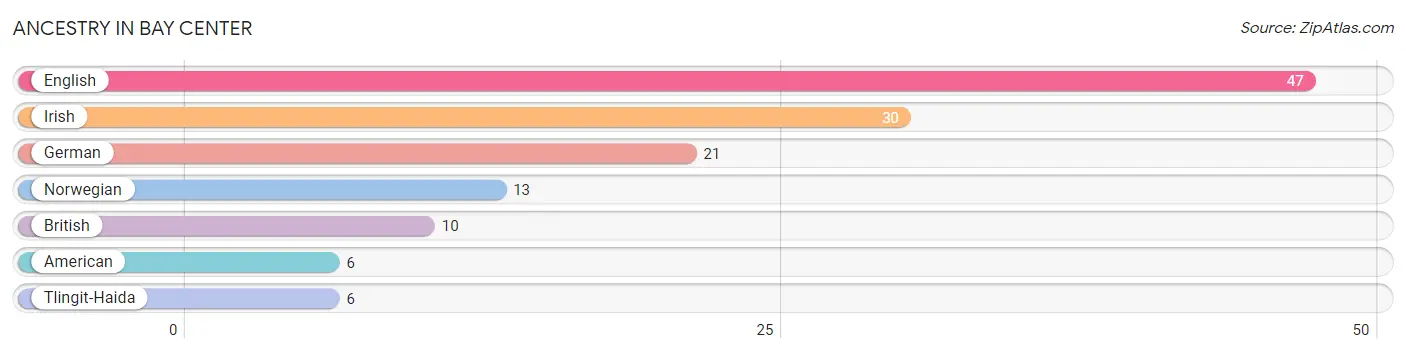
| Ancestry | # Population | % Population |
| American | 6 | 3.3% |
| British | 10 | 5.6% |
| English | 47 | 26.1% |
| German | 21 | 11.7% |
| Irish | 30 | 16.7% |
| Norwegian | 13 | 7.2% |
| Tlingit-Haida | 6 | 3.3% | View All 7 Rows |
Immigrants in Bay Center

| Immigration Origin | # Population | % Population | View All 0 Rows |
Sex and Age in Bay Center
Sex and Age in Bay Center
The most populous age groups in Bay Center are 60 to 64 Years (23 | 26.7%) for men and 60 to 64 Years (23 | 24.5%) for women.
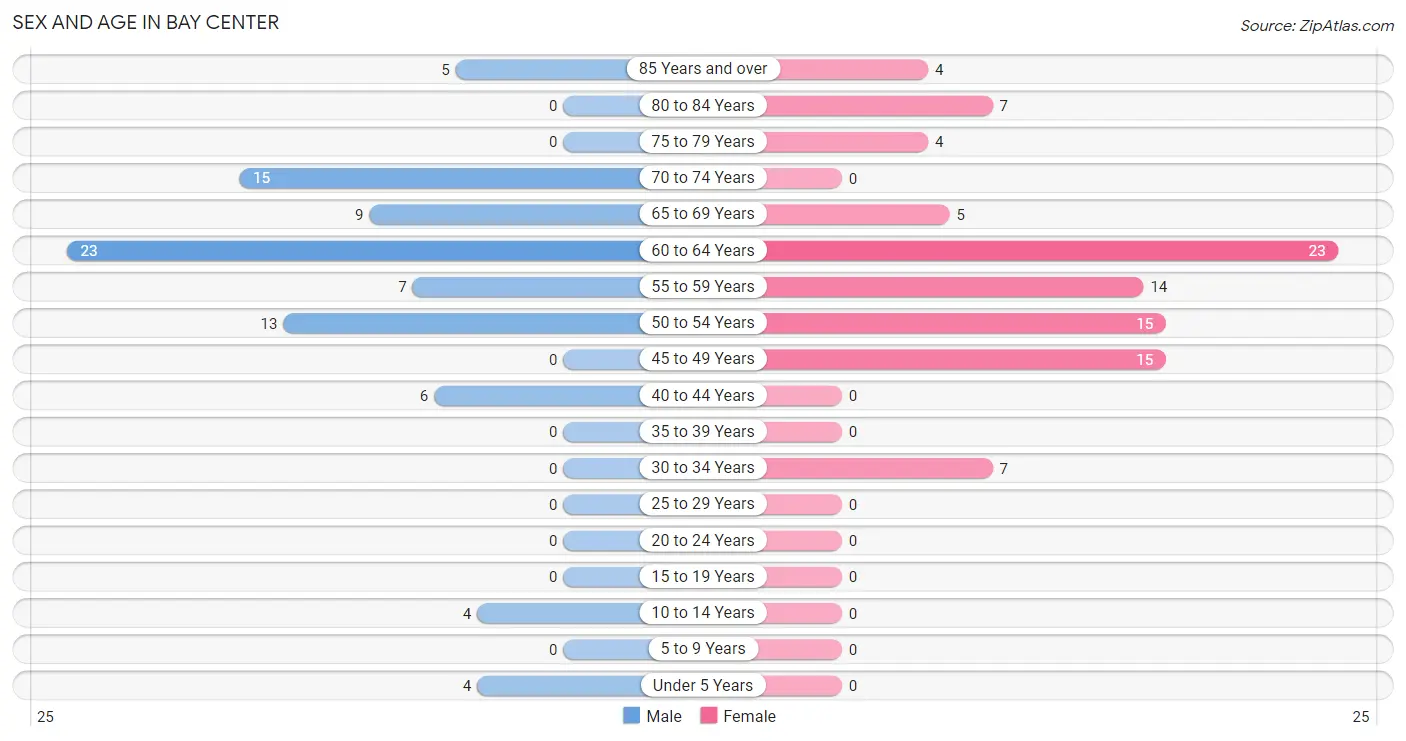
| Age Bracket | Male | Female |
| Under 5 Years | 4 (4.6%) | 0 (0.0%) |
| 5 to 9 Years | 0 (0.0%) | 0 (0.0%) |
| 10 to 14 Years | 4 (4.6%) | 0 (0.0%) |
| 15 to 19 Years | 0 (0.0%) | 0 (0.0%) |
| 20 to 24 Years | 0 (0.0%) | 0 (0.0%) |
| 25 to 29 Years | 0 (0.0%) | 0 (0.0%) |
| 30 to 34 Years | 0 (0.0%) | 7 (7.4%) |
| 35 to 39 Years | 0 (0.0%) | 0 (0.0%) |
| 40 to 44 Years | 6 (7.0%) | 0 (0.0%) |
| 45 to 49 Years | 0 (0.0%) | 15 (16.0%) |
| 50 to 54 Years | 13 (15.1%) | 15 (16.0%) |
| 55 to 59 Years | 7 (8.1%) | 14 (14.9%) |
| 60 to 64 Years | 23 (26.7%) | 23 (24.5%) |
| 65 to 69 Years | 9 (10.5%) | 5 (5.3%) |
| 70 to 74 Years | 15 (17.4%) | 0 (0.0%) |
| 75 to 79 Years | 0 (0.0%) | 4 (4.3%) |
| 80 to 84 Years | 0 (0.0%) | 7 (7.4%) |
| 85 Years and over | 5 (5.8%) | 4 (4.3%) |
| Total | 86 (100.0%) | 94 (100.0%) |
Families and Households in Bay Center
Median Family Size in Bay Center
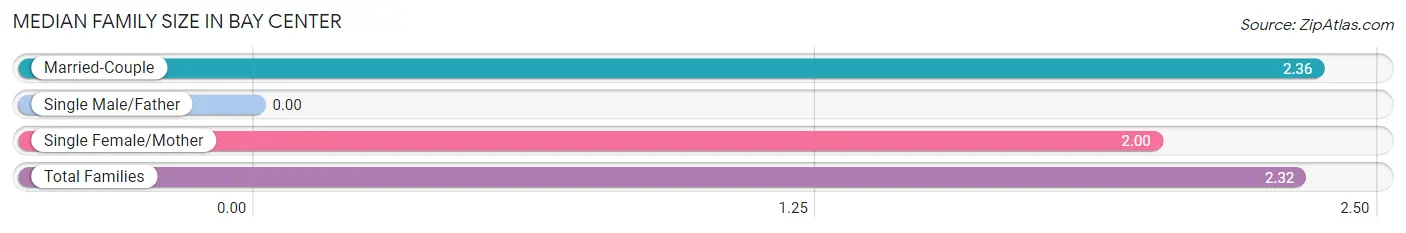
| Family Type | # Families | Family Size |
| Married-Couple | 42 (89.4%) | 2.36 |
| Single Male/Father | 0 (0.0%) | - |
| Single Female/Mother | 5 (10.6%) | 2.00 |
| Total Families | 47 (100.0%) | 2.32 |
Median Household Size in Bay Center
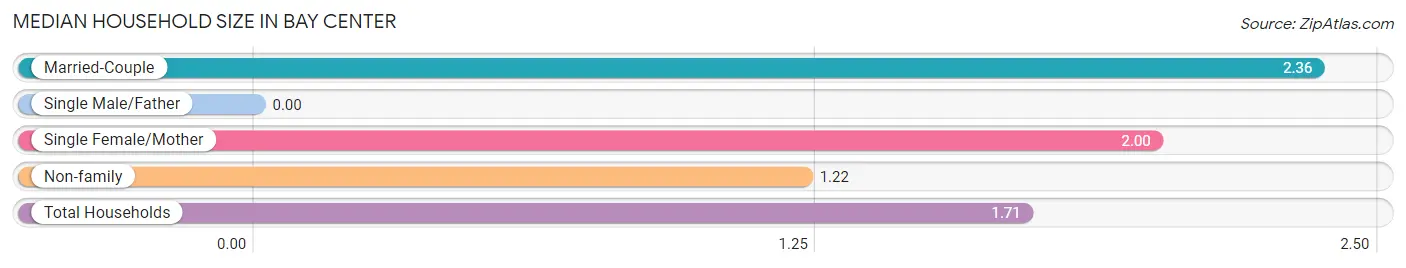
| Household Type | # Households | Household Size |
| Married-Couple | 42 (40.0%) | 2.36 |
| Single Male/Father | 0 (0.0%) | - |
| Single Female/Mother | 5 (4.8%) | 2.00 |
| Non-family | 58 (55.2%) | 1.22 |
| Total Households | 105 (100.0%) | 1.71 |
Household Size by Marriage Status in Bay Center
Out of a total of 105 households in Bay Center, 47 (44.8%) are family households, while 58 (55.2%) are nonfamily households. The most numerous type of family households are 2-person households, comprising 41, and the most common type of nonfamily households are 1-person households, comprising 50.
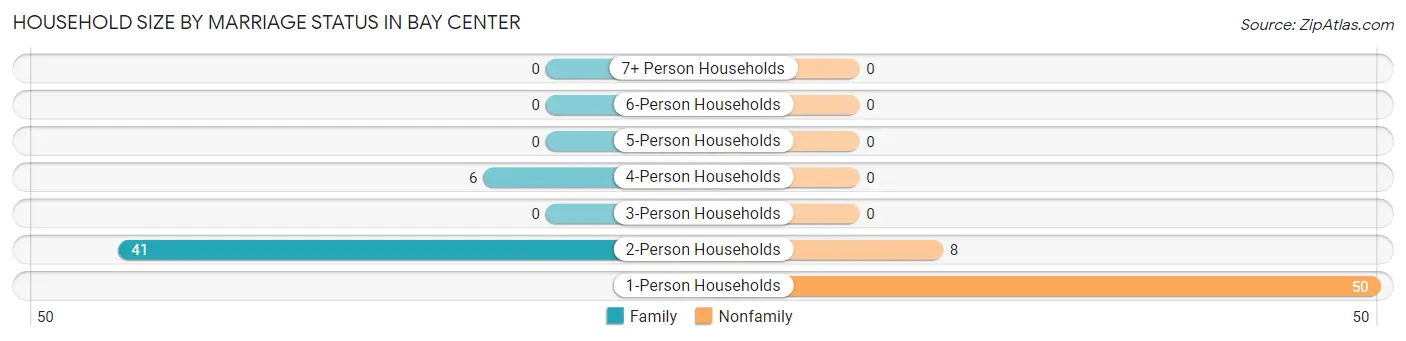
| Household Size | Family Households | Nonfamily Households |
| 1-Person Households | - | 50 (47.6%) |
| 2-Person Households | 41 (39.1%) | 8 (7.6%) |
| 3-Person Households | 0 (0.0%) | 0 (0.0%) |
| 4-Person Households | 6 (5.7%) | 0 (0.0%) |
| 5-Person Households | 0 (0.0%) | 0 (0.0%) |
| 6-Person Households | 0 (0.0%) | 0 (0.0%) |
| 7+ Person Households | 0 (0.0%) | 0 (0.0%) |
| Total | 47 (44.8%) | 58 (55.2%) |
Female Fertility in Bay Center
Fertility by Age in Bay Center
| Age Bracket | Women with Births | Births / 1,000 Women |
| 15 to 19 years | 0 (0.0%) | 0.0 |
| 20 to 34 years | 0 (0.0%) | 0.0 |
| 35 to 50 years | 0 (0.0%) | 0.0 |
| Total | 0 (0.0%) | 0.0 |
Fertility by Age by Marriage Status in Bay Center
| Age Bracket | Married | Unmarried |
| 15 to 19 years | 0 (0.0%) | 0 (0.0%) |
| 20 to 34 years | 0 (0.0%) | 0 (0.0%) |
| 35 to 50 years | 0 (0.0%) | 0 (0.0%) |
| Total | 0 (0.0%) | 0 (0.0%) |
Fertility by Education in Bay Center
| Educational Attainment | Women with Births | Births / 1,000 Women |
| Less than High School | 0 (0.0%) | 0.0 |
| High School Diploma | 0 (0.0%) | 0.0 |
| College or Associate's Degree | 0 (0.0%) | 0.0 |
| Bachelor's Degree | 0 (0.0%) | 0.0 |
| Graduate Degree | 0 (0.0%) | 0.0 |
| Total | 0 (0.0%) | 0.0 |
Fertility by Education by Marriage Status in Bay Center
| Educational Attainment | Married | Unmarried |
| Less than High School | 0 (0.0%) | 0 (0.0%) |
| High School Diploma | 0 (0.0%) | 0 (0.0%) |
| College or Associate's Degree | 0 (0.0%) | 0 (0.0%) |
| Bachelor's Degree | 0 (0.0%) | 0 (0.0%) |
| Graduate Degree | 0 (0.0%) | 0 (0.0%) |
| Total | 0 (0.0%) | 0 (0.0%) |
Employment Characteristics in Bay Center
Employment by Class of Employer in Bay Center
Among the 69 employed individuals in Bay Center, private company employees (15 | 21.7%), not-for-profit organizations (15 | 21.7%), and local government employees (15 | 21.7%) make up the most common classes of employment.
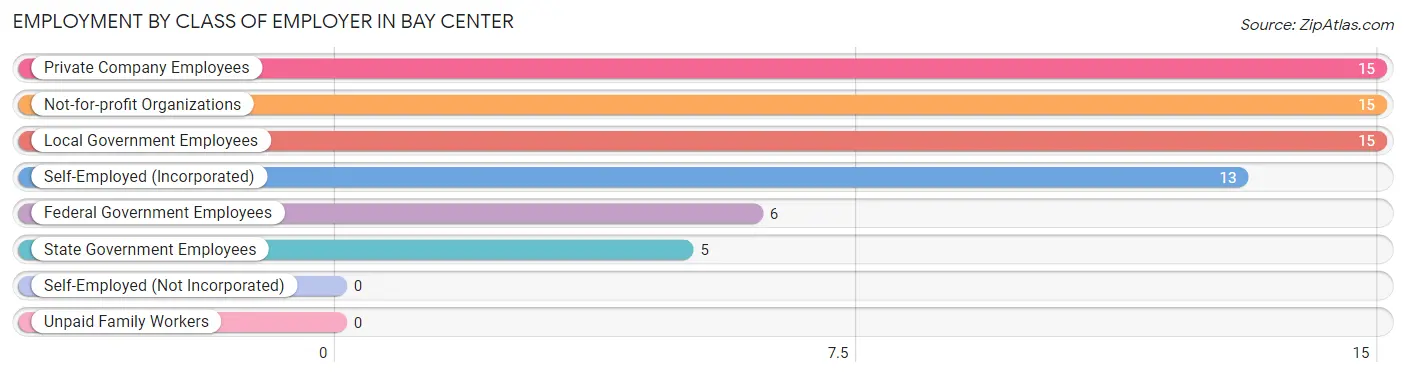
| Employer Class | # Employees | % Employees |
| Private Company Employees | 15 | 21.7% |
| Self-Employed (Incorporated) | 13 | 18.8% |
| Self-Employed (Not Incorporated) | 0 | 0.0% |
| Not-for-profit Organizations | 15 | 21.7% |
| Local Government Employees | 15 | 21.7% |
| State Government Employees | 5 | 7.2% |
| Federal Government Employees | 6 | 8.7% |
| Unpaid Family Workers | 0 | 0.0% |
| Total | 69 | 100.0% |
Employment Status by Age in Bay Center
According to the labor force statistics for Bay Center, out of the total population over 16 years of age (172), 44.2% or 76 individuals are in the labor force, with 9.2% or 7 of them unemployed. The age group with the highest labor force participation rate is 35 to 44 years, with 100.0% or 6 individuals in the labor force. Within the labor force, the 55 to 59 years age range has the highest percentage of unemployed individuals, with 33.3% or 7 of them being unemployed.
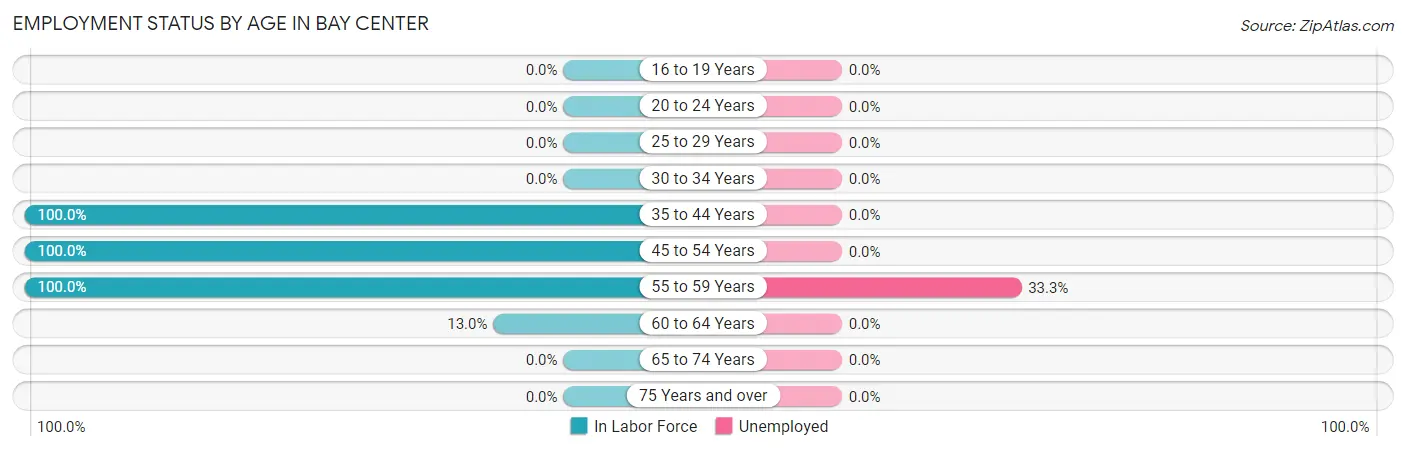
| Age Bracket | In Labor Force | Unemployed |
| 16 to 19 Years | 0 (0.0%) | 0 (0.0%) |
| 20 to 24 Years | 0 (0.0%) | 0 (0.0%) |
| 25 to 29 Years | 0 (0.0%) | 0 (0.0%) |
| 30 to 34 Years | 0 (0.0%) | 0 (0.0%) |
| 35 to 44 Years | 6 (100.0%) | 0 (0.0%) |
| 45 to 54 Years | 43 (100.0%) | 0 (0.0%) |
| 55 to 59 Years | 21 (100.0%) | 7 (33.3%) |
| 60 to 64 Years | 6 (13.0%) | 0 (0.0%) |
| 65 to 74 Years | 0 (0.0%) | 0 (0.0%) |
| 75 Years and over | 0 (0.0%) | 0 (0.0%) |
| Total | 76 (44.2%) | 7 (9.2%) |
Employment Status by Educational Attainment in Bay Center
According to labor force statistics for Bay Center, 61.8% of individuals (76) out of the total population between 25 and 64 years of age (123) are in the labor force, with 9.2% or 7 of them being unemployed. The group with the highest labor force participation rate are those with the educational attainment of college / associate degree, with 100.0% or 65 individuals in the labor force. Within the labor force, individuals with college / associate degree education have the highest percentage of unemployment, with 10.8% or 7 of them being unemployed.
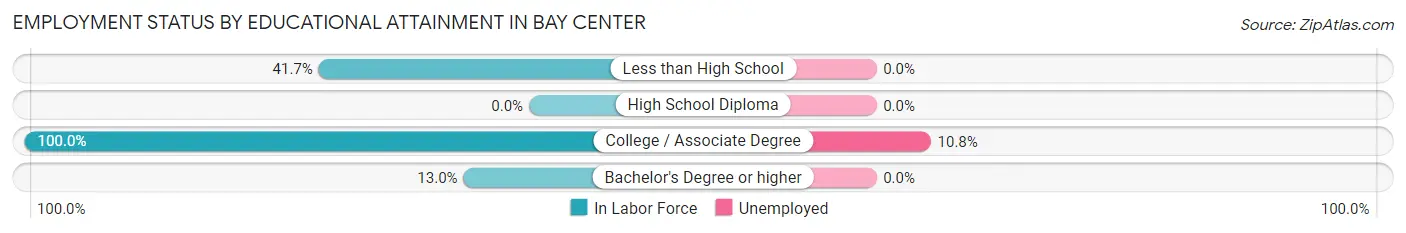
| Educational Attainment | In Labor Force | Unemployed |
| Less than High School | 5 (41.7%) | 0 (0.0%) |
| High School Diploma | 0 (0.0%) | 0 (0.0%) |
| College / Associate Degree | 65 (100.0%) | 7 (10.8%) |
| Bachelor's Degree or higher | 6 (13.0%) | 0 (0.0%) |
| Total | 76 (61.8%) | 11 (9.2%) |
Employment Occupations by Sex in Bay Center
Management, Business, Science and Arts Occupations
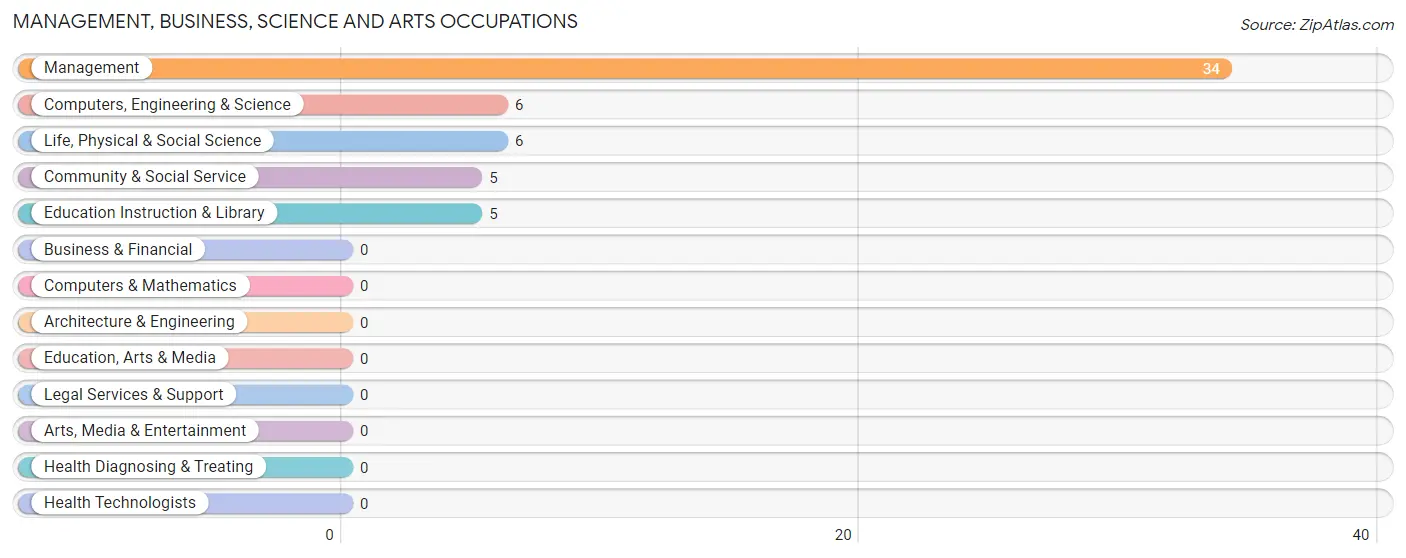
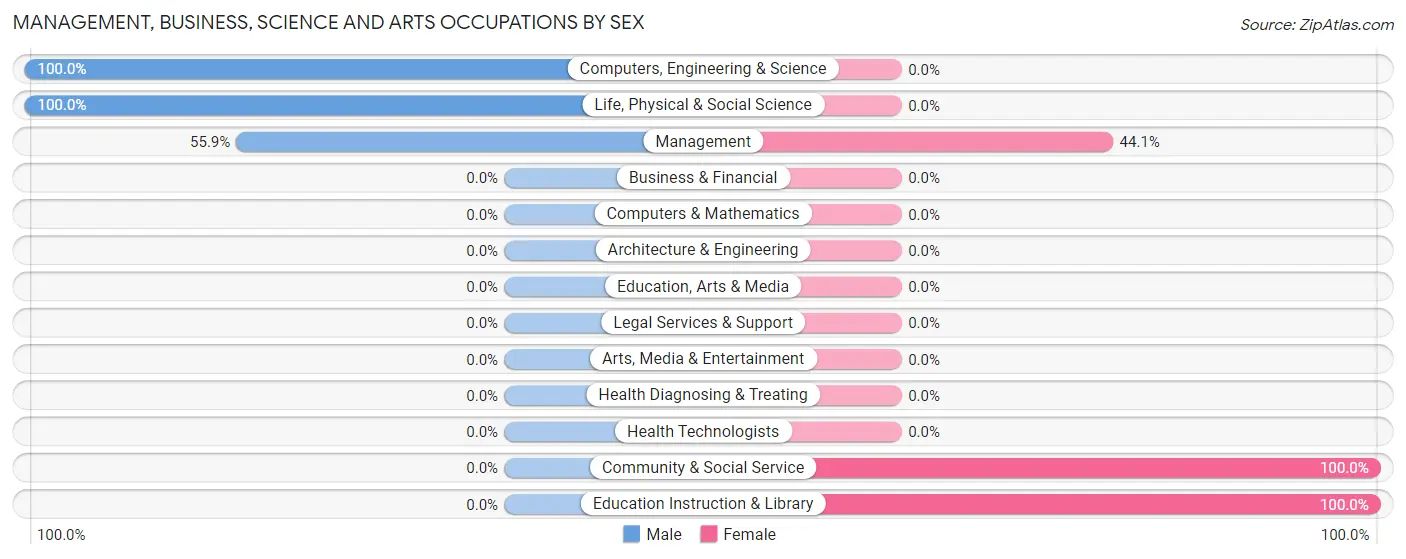
The most common Management, Business, Science and Arts occupations in Bay Center are Management (34 | 49.3%), Computers, Engineering & Science (6 | 8.7%), Life, Physical & Social Science (6 | 8.7%), Community & Social Service (5 | 7.2%), and Education Instruction & Library (5 | 7.2%).
Management, Business, Science and Arts Occupations by Sex
Within the Management, Business, Science and Arts occupations in Bay Center, the most male-oriented occupations are Computers, Engineering & Science (100.0%), Life, Physical & Social Science (100.0%), and Management (55.9%), while the most female-oriented occupations are Community & Social Service (100.0%), Education Instruction & Library (100.0%), and Management (44.1%).
| Occupation | Male | Female |
| Management | 19 (55.9%) | 15 (44.1%) |
| Business & Financial | 0 (0.0%) | 0 (0.0%) |
| Computers, Engineering & Science | 6 (100.0%) | 0 (0.0%) |
| Computers & Mathematics | 0 (0.0%) | 0 (0.0%) |
| Architecture & Engineering | 0 (0.0%) | 0 (0.0%) |
| Life, Physical & Social Science | 6 (100.0%) | 0 (0.0%) |
| Community & Social Service | 0 (0.0%) | 5 (100.0%) |
| Education, Arts & Media | 0 (0.0%) | 0 (0.0%) |
| Legal Services & Support | 0 (0.0%) | 0 (0.0%) |
| Education Instruction & Library | 0 (0.0%) | 5 (100.0%) |
| Arts, Media & Entertainment | 0 (0.0%) | 0 (0.0%) |
| Health Diagnosing & Treating | 0 (0.0%) | 0 (0.0%) |
| Health Technologists | 0 (0.0%) | 0 (0.0%) |
| Total (Category) | 25 (55.6%) | 20 (44.4%) |
| Total (Overall) | 25 (36.2%) | 44 (63.8%) |
Services Occupations
Services Occupations by Sex
| Occupation | Male | Female |
| Healthcare Support | 0 (0.0%) | 0 (0.0%) |
| Security & Protection | 0 (0.0%) | 0 (0.0%) |
| Firefighting & Prevention | 0 (0.0%) | 0 (0.0%) |
| Law Enforcement | 0 (0.0%) | 0 (0.0%) |
| Food Preparation & Serving | 0 (0.0%) | 0 (0.0%) |
| Cleaning & Maintenance | 0 (0.0%) | 0 (0.0%) |
| Personal Care & Service | 0 (0.0%) | 0 (0.0%) |
| Total (Category) | 0 (0.0%) | 0 (0.0%) |
| Total (Overall) | 25 (36.2%) | 44 (63.8%) |
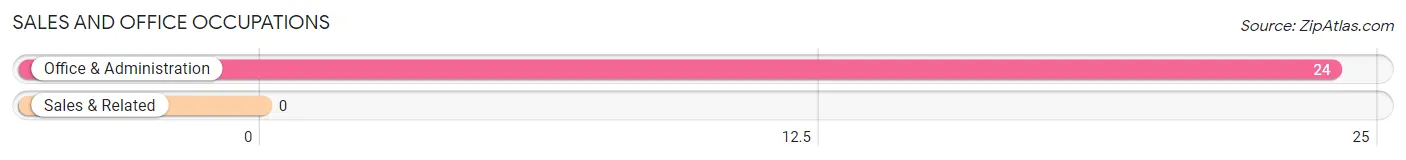
Sales and Office Occupations
The most common Sales and Office occupations in Bay Center are , and Office & Administration (24 | 34.8%).
Sales and Office Occupations by Sex
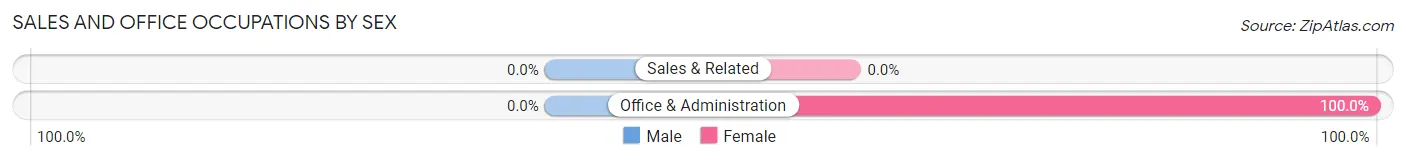
| Occupation | Male | Female |
| Sales & Related | 0 (0.0%) | 0 (0.0%) |
| Office & Administration | 0 (0.0%) | 24 (100.0%) |
| Total (Category) | 0 (0.0%) | 24 (100.0%) |
| Total (Overall) | 25 (36.2%) | 44 (63.8%) |
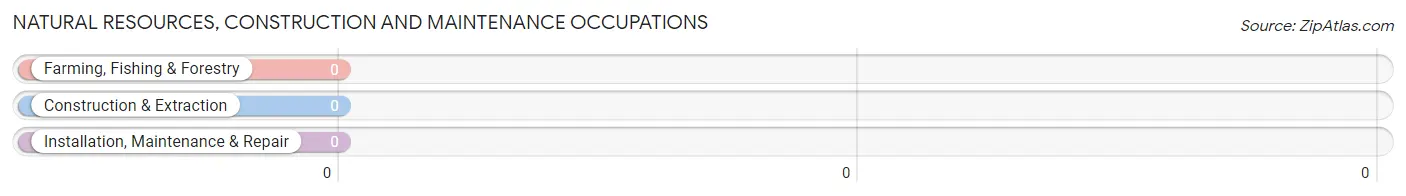
Natural Resources, Construction and Maintenance Occupations
Natural Resources, Construction and Maintenance Occupations by Sex
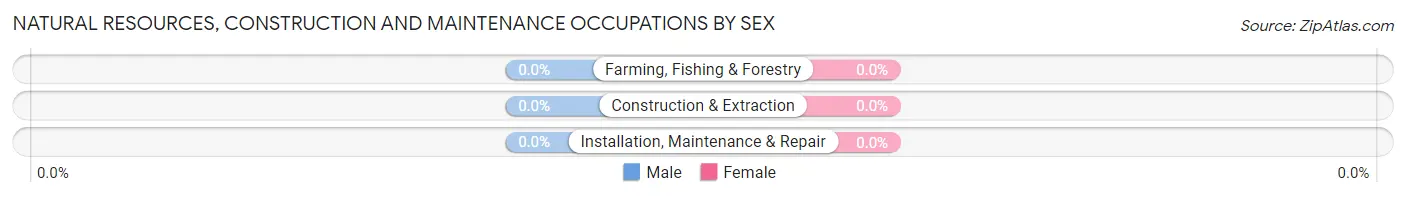
| Occupation | Male | Female |
| Farming, Fishing & Forestry | 0 (0.0%) | 0 (0.0%) |
| Construction & Extraction | 0 (0.0%) | 0 (0.0%) |
| Installation, Maintenance & Repair | 0 (0.0%) | 0 (0.0%) |
| Total (Category) | 0 (0.0%) | 0 (0.0%) |
| Total (Overall) | 25 (36.2%) | 44 (63.8%) |
Production, Transportation and Moving Occupations
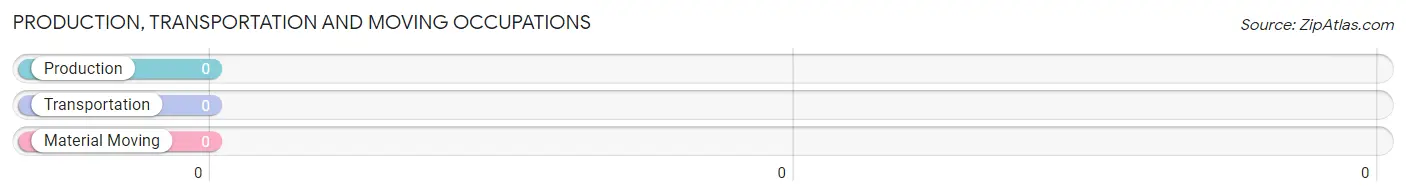
Production, Transportation and Moving Occupations by Sex
| Occupation | Male | Female |
| Production | 0 (0.0%) | 0 (0.0%) |
| Transportation | 0 (0.0%) | 0 (0.0%) |
| Material Moving | 0 (0.0%) | 0 (0.0%) |
| Total (Category) | 0 (0.0%) | 0 (0.0%) |
| Total (Overall) | 25 (36.2%) | 44 (63.8%) |
Employment Industries by Sex in Bay Center
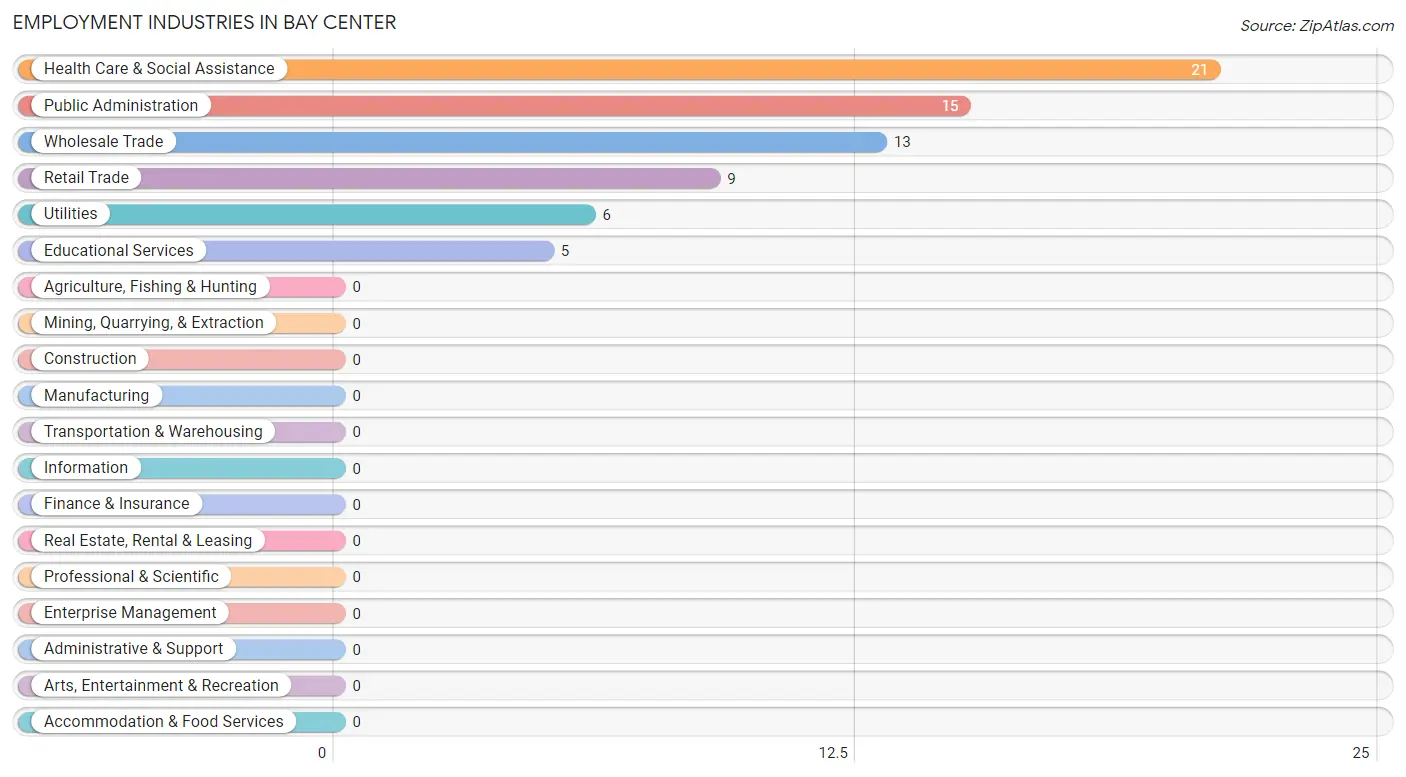
Employment Industries in Bay Center
The major employment industries in Bay Center include Health Care & Social Assistance (21 | 30.4%), Public Administration (15 | 21.7%), Wholesale Trade (13 | 18.8%), Retail Trade (9 | 13.0%), and Utilities (6 | 8.7%).
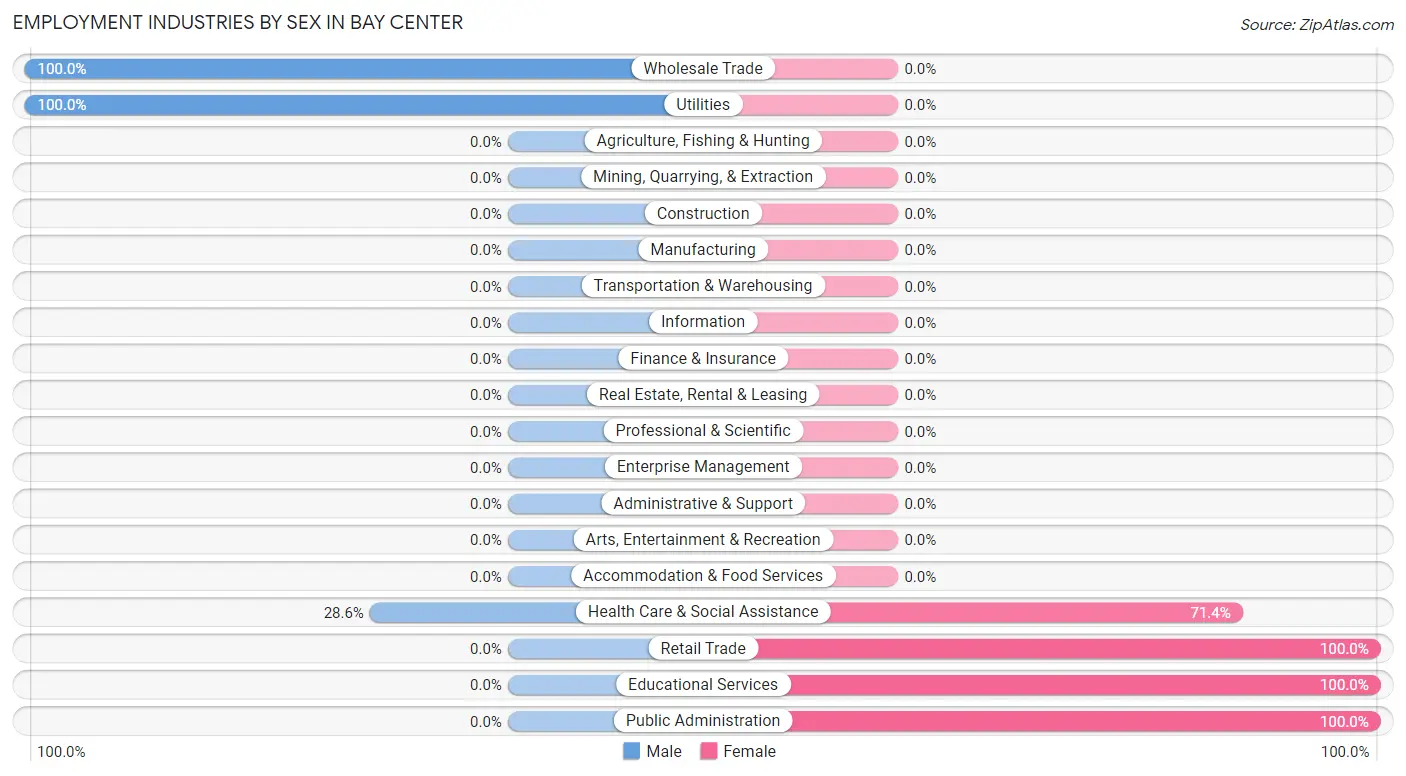
Employment Industries by Sex in Bay Center
The Bay Center industries that see more men than women are Wholesale Trade (100.0%), Utilities (100.0%), and Health Care & Social Assistance (28.6%), whereas the industries that tend to have a higher number of women are Retail Trade (100.0%), Educational Services (100.0%), and Public Administration (100.0%).
| Industry | Male | Female |
| Agriculture, Fishing & Hunting | 0 (0.0%) | 0 (0.0%) |
| Mining, Quarrying, & Extraction | 0 (0.0%) | 0 (0.0%) |
| Construction | 0 (0.0%) | 0 (0.0%) |
| Manufacturing | 0 (0.0%) | 0 (0.0%) |
| Wholesale Trade | 13 (100.0%) | 0 (0.0%) |
| Retail Trade | 0 (0.0%) | 9 (100.0%) |
| Transportation & Warehousing | 0 (0.0%) | 0 (0.0%) |
| Utilities | 6 (100.0%) | 0 (0.0%) |
| Information | 0 (0.0%) | 0 (0.0%) |
| Finance & Insurance | 0 (0.0%) | 0 (0.0%) |
| Real Estate, Rental & Leasing | 0 (0.0%) | 0 (0.0%) |
| Professional & Scientific | 0 (0.0%) | 0 (0.0%) |
| Enterprise Management | 0 (0.0%) | 0 (0.0%) |
| Administrative & Support | 0 (0.0%) | 0 (0.0%) |
| Educational Services | 0 (0.0%) | 5 (100.0%) |
| Health Care & Social Assistance | 6 (28.6%) | 15 (71.4%) |
| Arts, Entertainment & Recreation | 0 (0.0%) | 0 (0.0%) |
| Accommodation & Food Services | 0 (0.0%) | 0 (0.0%) |
| Public Administration | 0 (0.0%) | 15 (100.0%) |
| Total | 25 (36.2%) | 44 (63.8%) |
Education in Bay Center
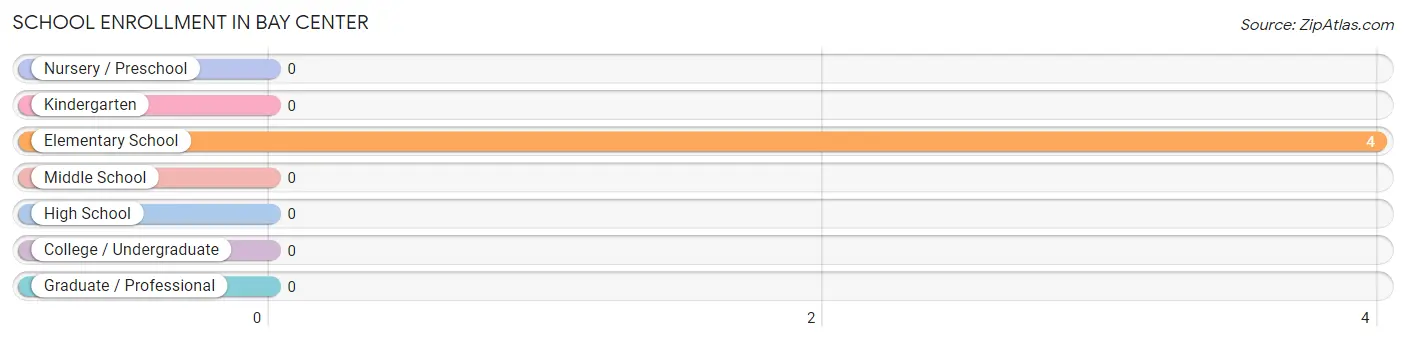
School Enrollment in Bay Center
| School Level | # Students | % Students |
| Nursery / Preschool | 0 | 0.0% |
| Kindergarten | 0 | 0.0% |
| Elementary School | 4 | 100.0% |
| Middle School | 0 | 0.0% |
| High School | 0 | 0.0% |
| College / Undergraduate | 0 | 0.0% |
| Graduate / Professional | 0 | 0.0% |
| Total | 4 | 100.0% |
School Enrollment by Age by Funding Source in Bay Center
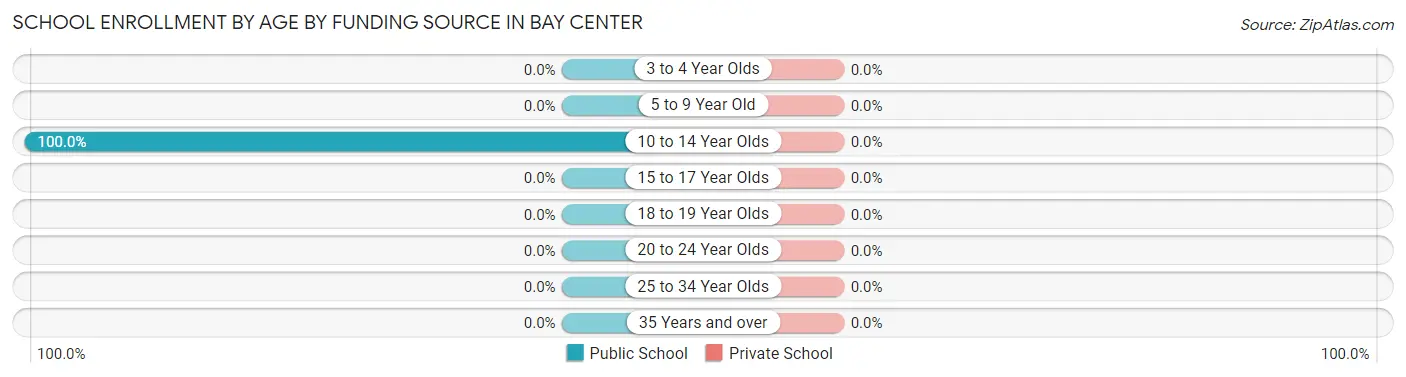
| Age Bracket | Public School | Private School |
| 3 to 4 Year Olds | 0 (0.0%) | 0 (0.0%) |
| 5 to 9 Year Old | 0 (0.0%) | 0 (0.0%) |
| 10 to 14 Year Olds | 4 (100.0%) | 0 (0.0%) |
| 15 to 17 Year Olds | 0 (0.0%) | 0 (0.0%) |
| 18 to 19 Year Olds | 0 (0.0%) | 0 (0.0%) |
| 20 to 24 Year Olds | 0 (0.0%) | 0 (0.0%) |
| 25 to 34 Year Olds | 0 (0.0%) | 0 (0.0%) |
| 35 Years and over | 0 (0.0%) | 0 (0.0%) |
| Total | 4 (100.0%) | 0 (0.0%) |
Educational Attainment by Field of Study in Bay Center
Physical & health sciences (24 | 36.4%), social sciences (20 | 30.3%), education (11 | 16.7%), science & technology (6 | 9.1%), and bio, nature & agricultural (5 | 7.6%) are the most common fields of study among 66 individuals in Bay Center who have obtained a bachelor's degree or higher.
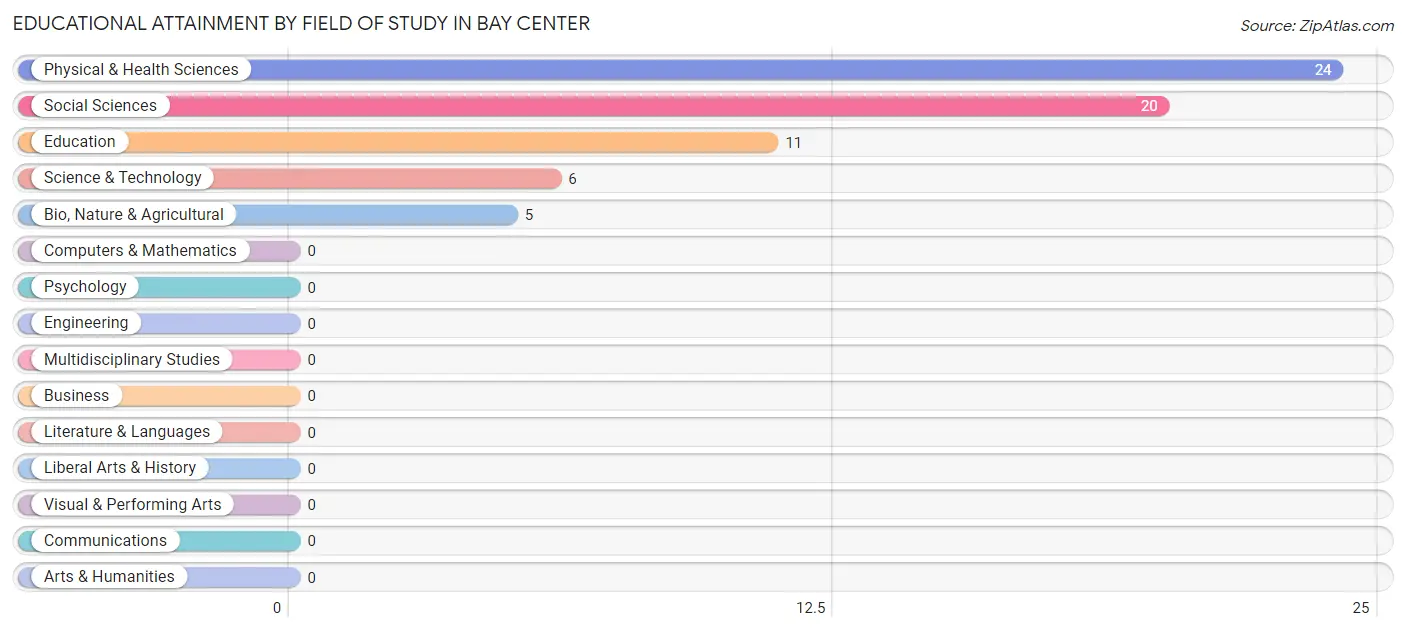
| Field of Study | # Graduates | % Graduates |
| Computers & Mathematics | 0 | 0.0% |
| Bio, Nature & Agricultural | 5 | 7.6% |
| Physical & Health Sciences | 24 | 36.4% |
| Psychology | 0 | 0.0% |
| Social Sciences | 20 | 30.3% |
| Engineering | 0 | 0.0% |
| Multidisciplinary Studies | 0 | 0.0% |
| Science & Technology | 6 | 9.1% |
| Business | 0 | 0.0% |
| Education | 11 | 16.7% |
| Literature & Languages | 0 | 0.0% |
| Liberal Arts & History | 0 | 0.0% |
| Visual & Performing Arts | 0 | 0.0% |
| Communications | 0 | 0.0% |
| Arts & Humanities | 0 | 0.0% |
| Total | 66 | 100.0% |
Transportation & Commute in Bay Center
Vehicle Availability by Sex in Bay Center
The most prevalent vehicle ownership categories in Bay Center are males with 2 vehicles (19, accounting for 76.0%) and females with 2 vehicles (39, making up 43.2%).
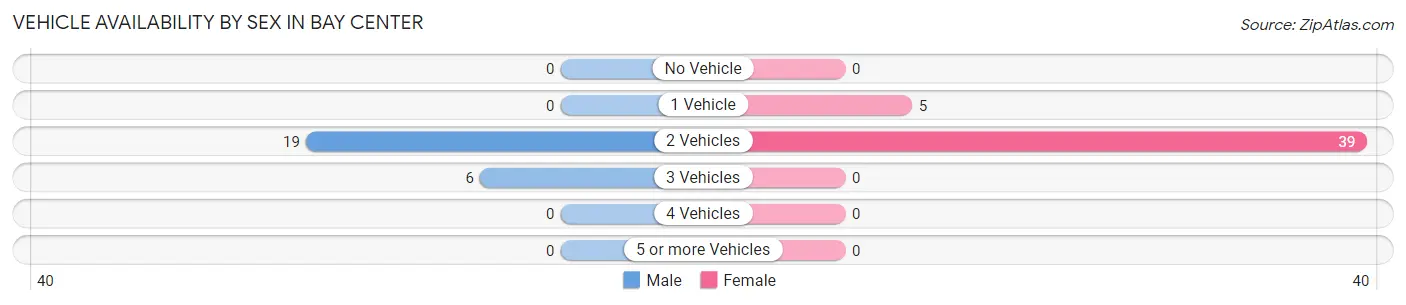
| Vehicles Available | Male | Female |
| No Vehicle | 0 (0.0%) | 0 (0.0%) |
| 1 Vehicle | 0 (0.0%) | 5 (11.4%) |
| 2 Vehicles | 19 (76.0%) | 39 (88.6%) |
| 3 Vehicles | 6 (24.0%) | 0 (0.0%) |
| 4 Vehicles | 0 (0.0%) | 0 (0.0%) |
| 5 or more Vehicles | 0 (0.0%) | 0 (0.0%) |
| Total | 25 (100.0%) | 44 (100.0%) |
Commute Time in Bay Center
The most frequently occuring commute durations in Bay Center are 5 to 9 minutes (20 commuters, 33.3%), 15 to 19 minutes (15 commuters, 25.0%), and 90 or more minutes (13 commuters, 21.7%).
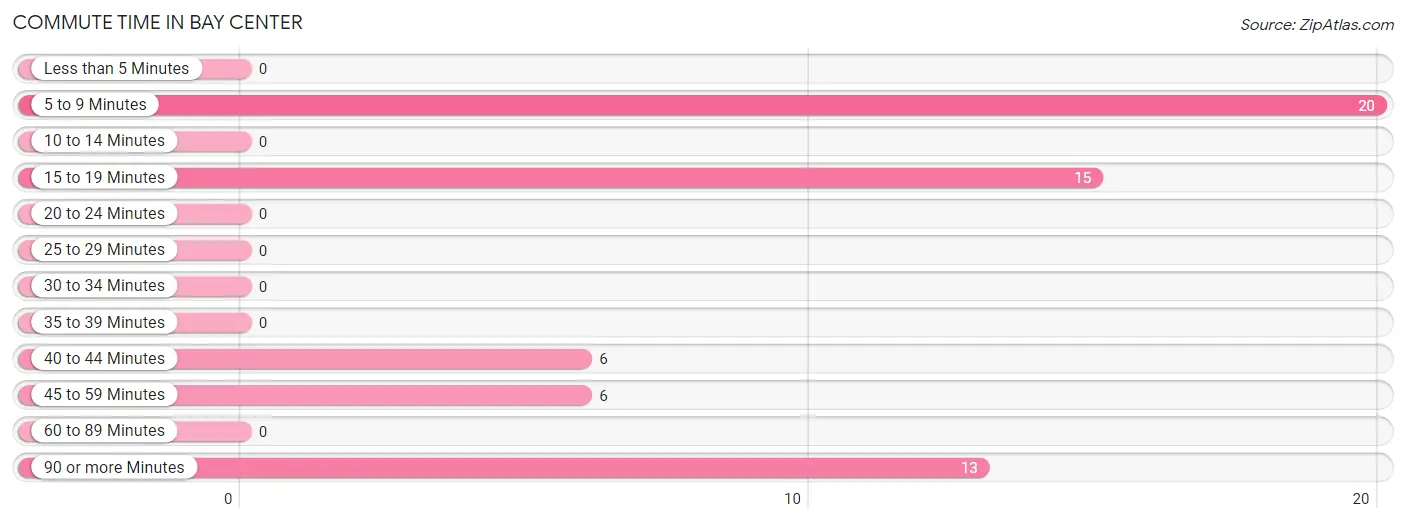
| Commute Time | # Commuters | % Commuters |
| Less than 5 Minutes | 0 | 0.0% |
| 5 to 9 Minutes | 20 | 33.3% |
| 10 to 14 Minutes | 0 | 0.0% |
| 15 to 19 Minutes | 15 | 25.0% |
| 20 to 24 Minutes | 0 | 0.0% |
| 25 to 29 Minutes | 0 | 0.0% |
| 30 to 34 Minutes | 0 | 0.0% |
| 35 to 39 Minutes | 0 | 0.0% |
| 40 to 44 Minutes | 6 | 10.0% |
| 45 to 59 Minutes | 6 | 10.0% |
| 60 to 89 Minutes | 0 | 0.0% |
| 90 or more Minutes | 13 | 21.7% |
Commute Time by Sex in Bay Center
The most common commute times in Bay Center are 90 or more minutes (13 commuters, 52.0%) for males and 5 to 9 minutes (20 commuters, 57.1%) for females.
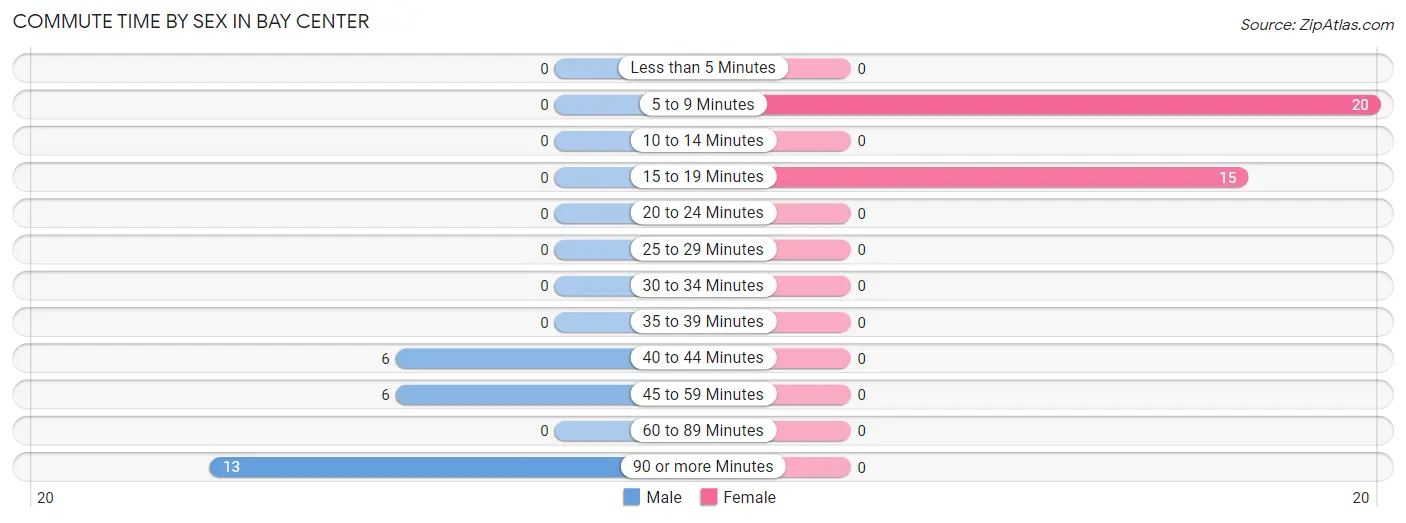
| Commute Time | Male | Female |
| Less than 5 Minutes | 0 (0.0%) | 0 (0.0%) |
| 5 to 9 Minutes | 0 (0.0%) | 20 (57.1%) |
| 10 to 14 Minutes | 0 (0.0%) | 0 (0.0%) |
| 15 to 19 Minutes | 0 (0.0%) | 15 (42.9%) |
| 20 to 24 Minutes | 0 (0.0%) | 0 (0.0%) |
| 25 to 29 Minutes | 0 (0.0%) | 0 (0.0%) |
| 30 to 34 Minutes | 0 (0.0%) | 0 (0.0%) |
| 35 to 39 Minutes | 0 (0.0%) | 0 (0.0%) |
| 40 to 44 Minutes | 6 (24.0%) | 0 (0.0%) |
| 45 to 59 Minutes | 6 (24.0%) | 0 (0.0%) |
| 60 to 89 Minutes | 0 (0.0%) | 0 (0.0%) |
| 90 or more Minutes | 13 (52.0%) | 0 (0.0%) |
Time of Departure to Work by Sex in Bay Center
The most frequent times of departure to work in Bay Center are 6:00 AM to 6:29 AM (13, 52.0%) for males and 7:00 AM to 7:29 AM (15, 42.9%) for females.
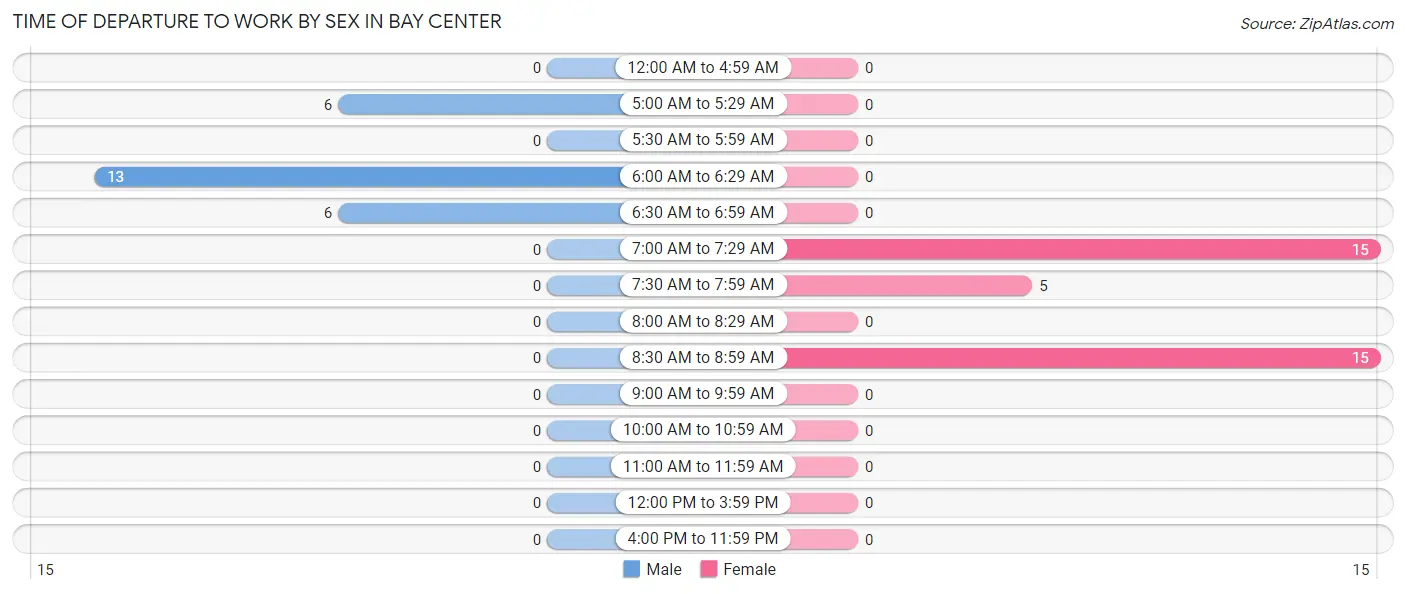
| Time of Departure | Male | Female |
| 12:00 AM to 4:59 AM | 0 (0.0%) | 0 (0.0%) |
| 5:00 AM to 5:29 AM | 6 (24.0%) | 0 (0.0%) |
| 5:30 AM to 5:59 AM | 0 (0.0%) | 0 (0.0%) |
| 6:00 AM to 6:29 AM | 13 (52.0%) | 0 (0.0%) |
| 6:30 AM to 6:59 AM | 6 (24.0%) | 0 (0.0%) |
| 7:00 AM to 7:29 AM | 0 (0.0%) | 15 (42.9%) |
| 7:30 AM to 7:59 AM | 0 (0.0%) | 5 (14.3%) |
| 8:00 AM to 8:29 AM | 0 (0.0%) | 0 (0.0%) |
| 8:30 AM to 8:59 AM | 0 (0.0%) | 15 (42.9%) |
| 9:00 AM to 9:59 AM | 0 (0.0%) | 0 (0.0%) |
| 10:00 AM to 10:59 AM | 0 (0.0%) | 0 (0.0%) |
| 11:00 AM to 11:59 AM | 0 (0.0%) | 0 (0.0%) |
| 12:00 PM to 3:59 PM | 0 (0.0%) | 0 (0.0%) |
| 4:00 PM to 11:59 PM | 0 (0.0%) | 0 (0.0%) |
| Total | 25 (100.0%) | 35 (100.0%) |
Housing Occupancy in Bay Center
Occupancy by Ownership in Bay Center
Of the total 105 dwellings in Bay Center, owner-occupied units account for 99 (94.3%), while renter-occupied units make up 6 (5.7%).
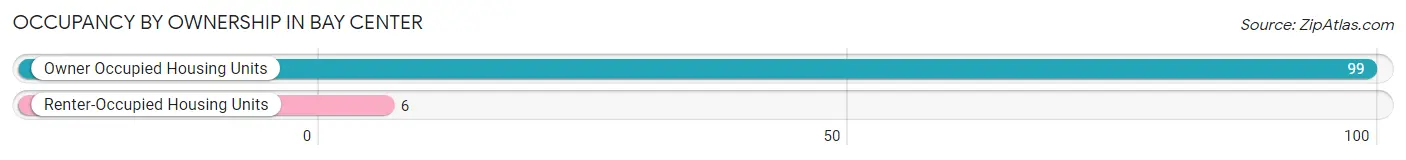
| Occupancy | # Housing Units | % Housing Units |
| Owner Occupied Housing Units | 99 | 94.3% |
| Renter-Occupied Housing Units | 6 | 5.7% |
| Total Occupied Housing Units | 105 | 100.0% |
Occupancy by Household Size in Bay Center
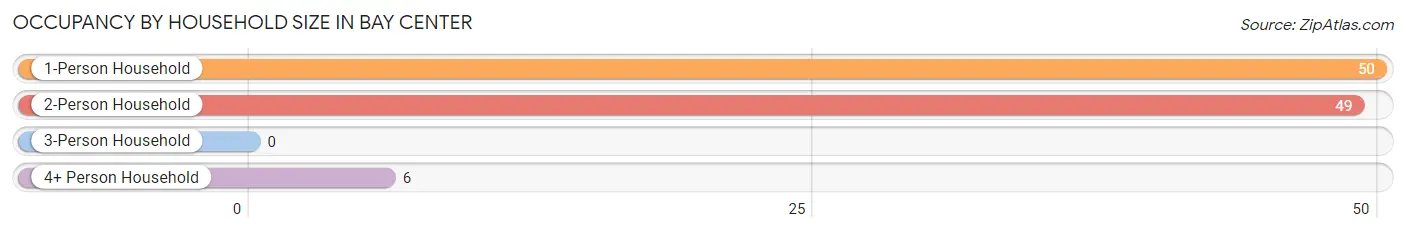
| Household Size | # Housing Units | % Housing Units |
| 1-Person Household | 50 | 47.6% |
| 2-Person Household | 49 | 46.7% |
| 3-Person Household | 0 | 0.0% |
| 4+ Person Household | 6 | 5.7% |
| Total Housing Units | 105 | 100.0% |
Occupancy by Ownership by Household Size in Bay Center
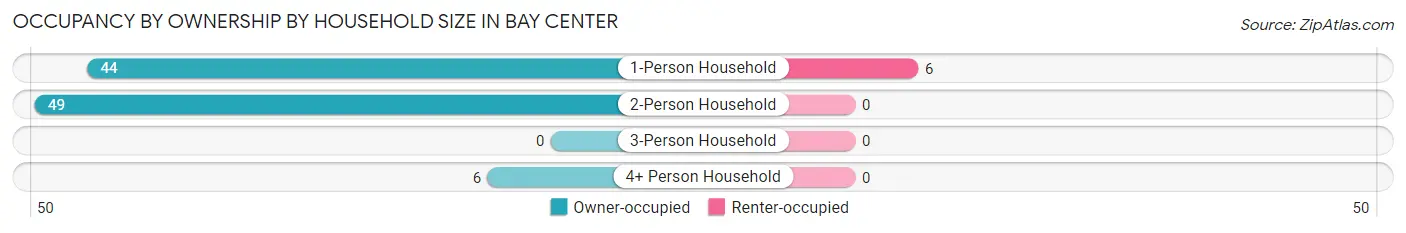
| Household Size | Owner-occupied | Renter-occupied |
| 1-Person Household | 44 (88.0%) | 6 (12.0%) |
| 2-Person Household | 49 (100.0%) | 0 (0.0%) |
| 3-Person Household | 0 (0.0%) | 0 (0.0%) |
| 4+ Person Household | 6 (100.0%) | 0 (0.0%) |
| Total Housing Units | 99 (94.3%) | 6 (5.7%) |
Occupancy by Educational Attainment in Bay Center
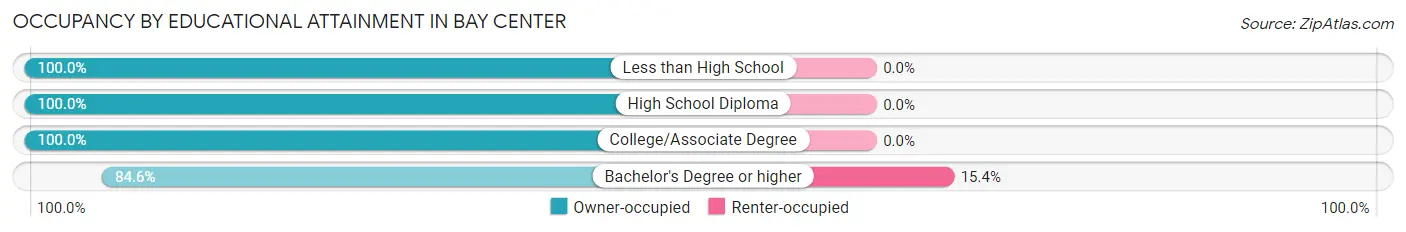
| Household Size | Owner-occupied | Renter-occupied |
| Less than High School | 5 (100.0%) | 0 (0.0%) |
| High School Diploma | 15 (100.0%) | 0 (0.0%) |
| College/Associate Degree | 46 (100.0%) | 0 (0.0%) |
| Bachelor's Degree or higher | 33 (84.6%) | 6 (15.4%) |
Occupancy by Age of Householder in Bay Center
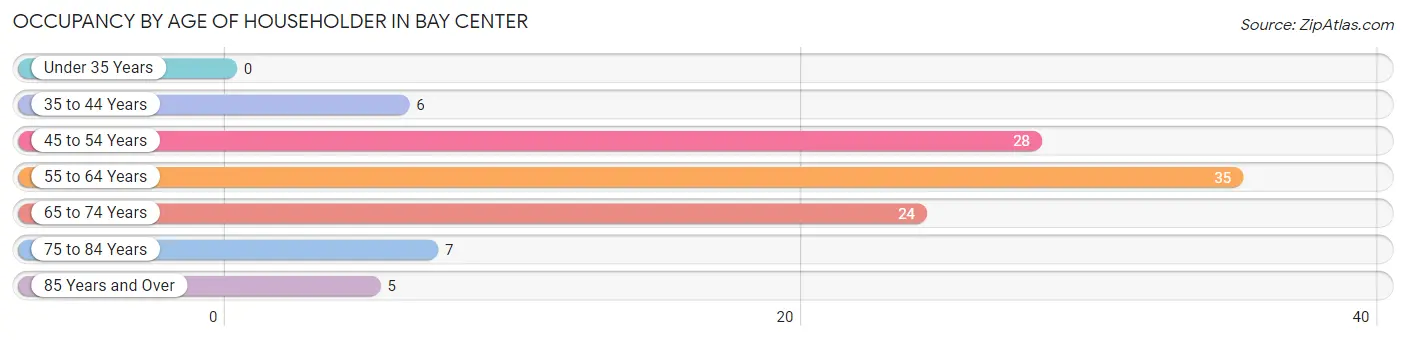
| Age Bracket | # Households | % Households |
| Under 35 Years | 0 | 0.0% |
| 35 to 44 Years | 6 | 5.7% |
| 45 to 54 Years | 28 | 26.7% |
| 55 to 64 Years | 35 | 33.3% |
| 65 to 74 Years | 24 | 22.9% |
| 75 to 84 Years | 7 | 6.7% |
| 85 Years and Over | 5 | 4.8% |
| Total | 105 | 100.0% |
Housing Finances in Bay Center
Median Income by Occupancy in Bay Center
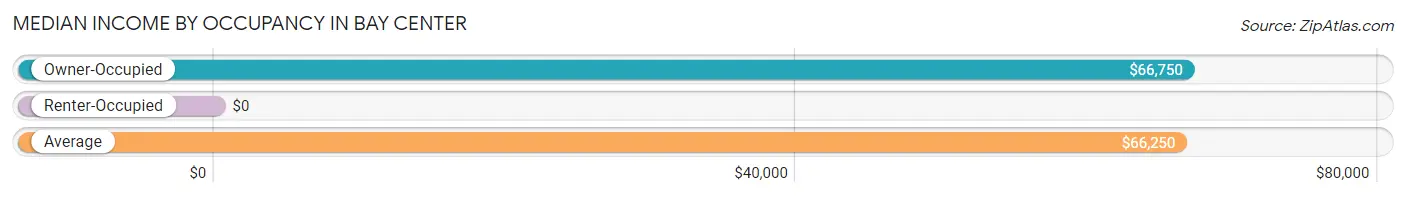
| Occupancy Type | # Households | Median Income |
| Owner-Occupied | 99 (94.3%) | $66,750 |
| Renter-Occupied | 6 (5.7%) | $0 |
| Average | 105 (100.0%) | $66,250 |
Occupancy by Householder Income Bracket in Bay Center
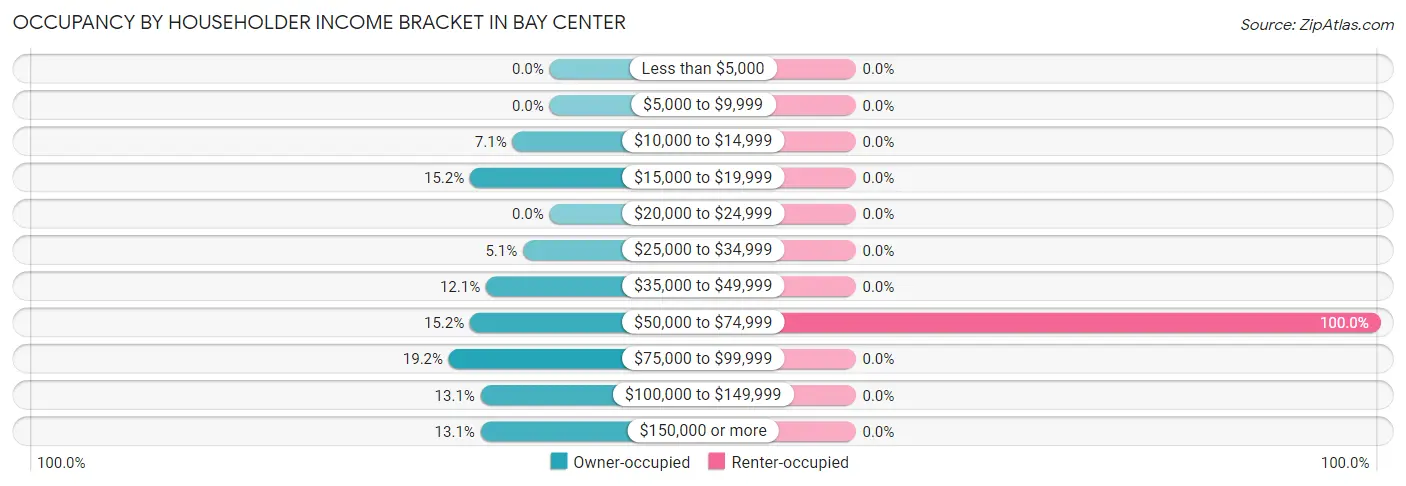
| Income Bracket | Owner-occupied | Renter-occupied |
| Less than $5,000 | 0 (0.0%) | 0 (0.0%) |
| $5,000 to $9,999 | 0 (0.0%) | 0 (0.0%) |
| $10,000 to $14,999 | 7 (7.1%) | 0 (0.0%) |
| $15,000 to $19,999 | 15 (15.1%) | 0 (0.0%) |
| $20,000 to $24,999 | 0 (0.0%) | 0 (0.0%) |
| $25,000 to $34,999 | 5 (5.1%) | 0 (0.0%) |
| $35,000 to $49,999 | 12 (12.1%) | 0 (0.0%) |
| $50,000 to $74,999 | 15 (15.1%) | 6 (100.0%) |
| $75,000 to $99,999 | 19 (19.2%) | 0 (0.0%) |
| $100,000 to $149,999 | 13 (13.1%) | 0 (0.0%) |
| $150,000 or more | 13 (13.1%) | 0 (0.0%) |
| Total | 99 (100.0%) | 6 (100.0%) |
Monthly Housing Cost Tiers in Bay Center
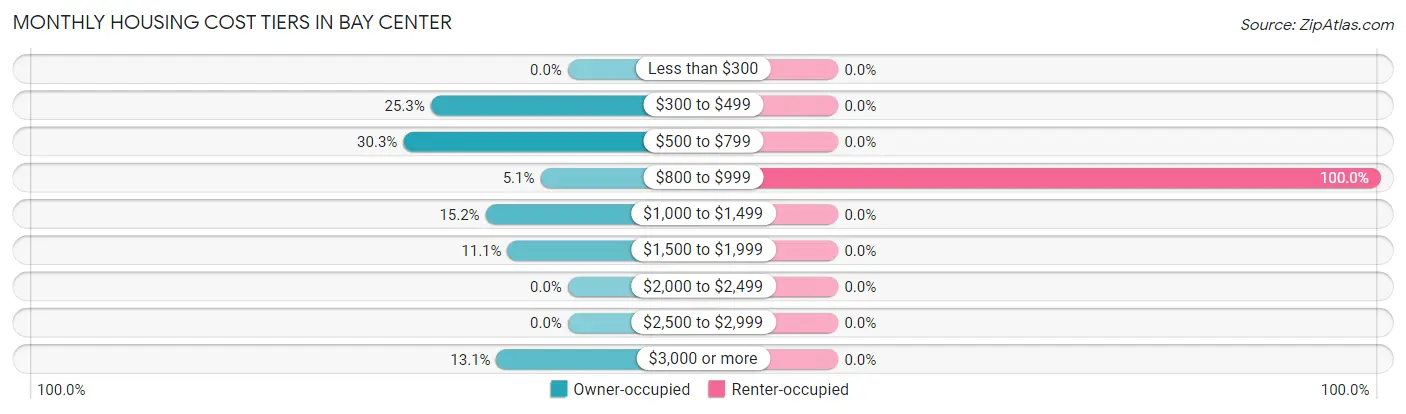
| Monthly Cost | Owner-occupied | Renter-occupied |
| Less than $300 | 0 (0.0%) | 0 (0.0%) |
| $300 to $499 | 25 (25.3%) | 0 (0.0%) |
| $500 to $799 | 30 (30.3%) | 0 (0.0%) |
| $800 to $999 | 5 (5.1%) | 6 (100.0%) |
| $1,000 to $1,499 | 15 (15.1%) | 0 (0.0%) |
| $1,500 to $1,999 | 11 (11.1%) | 0 (0.0%) |
| $2,000 to $2,499 | 0 (0.0%) | 0 (0.0%) |
| $2,500 to $2,999 | 0 (0.0%) | 0 (0.0%) |
| $3,000 or more | 13 (13.1%) | 0 (0.0%) |
| Total | 99 (100.0%) | 6 (100.0%) |
Physical Housing Characteristics in Bay Center
Housing Structures in Bay Center
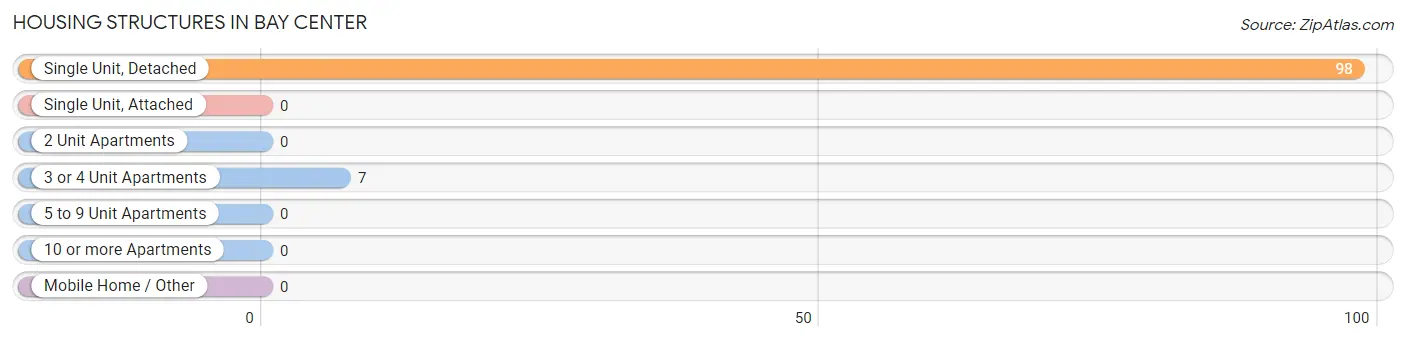
| Structure Type | # Housing Units | % Housing Units |
| Single Unit, Detached | 98 | 93.3% |
| Single Unit, Attached | 0 | 0.0% |
| 2 Unit Apartments | 0 | 0.0% |
| 3 or 4 Unit Apartments | 7 | 6.7% |
| 5 to 9 Unit Apartments | 0 | 0.0% |
| 10 or more Apartments | 0 | 0.0% |
| Mobile Home / Other | 0 | 0.0% |
| Total | 105 | 100.0% |
Housing Structures by Occupancy in Bay Center
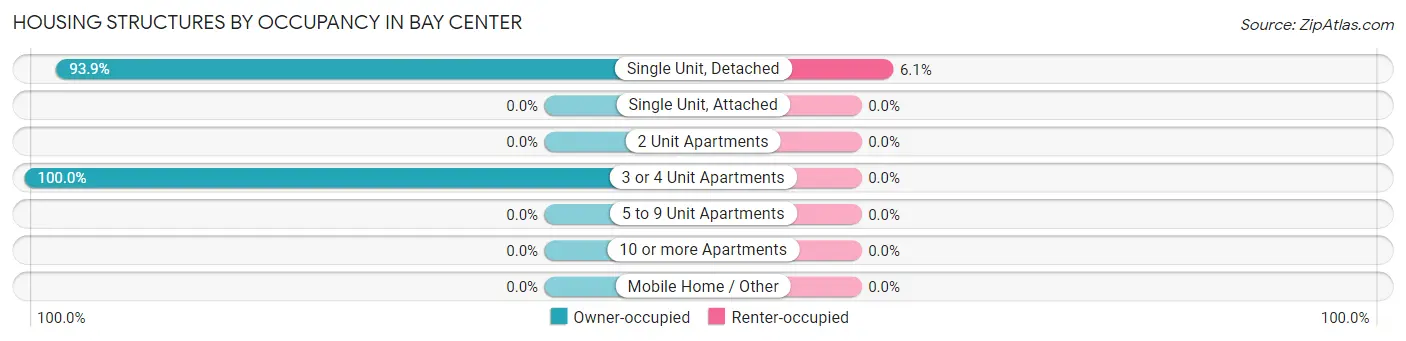
| Structure Type | Owner-occupied | Renter-occupied |
| Single Unit, Detached | 92 (93.9%) | 6 (6.1%) |
| Single Unit, Attached | 0 (0.0%) | 0 (0.0%) |
| 2 Unit Apartments | 0 (0.0%) | 0 (0.0%) |
| 3 or 4 Unit Apartments | 7 (100.0%) | 0 (0.0%) |
| 5 to 9 Unit Apartments | 0 (0.0%) | 0 (0.0%) |
| 10 or more Apartments | 0 (0.0%) | 0 (0.0%) |
| Mobile Home / Other | 0 (0.0%) | 0 (0.0%) |
| Total | 99 (94.3%) | 6 (5.7%) |
Housing Structures by Number of Rooms in Bay Center
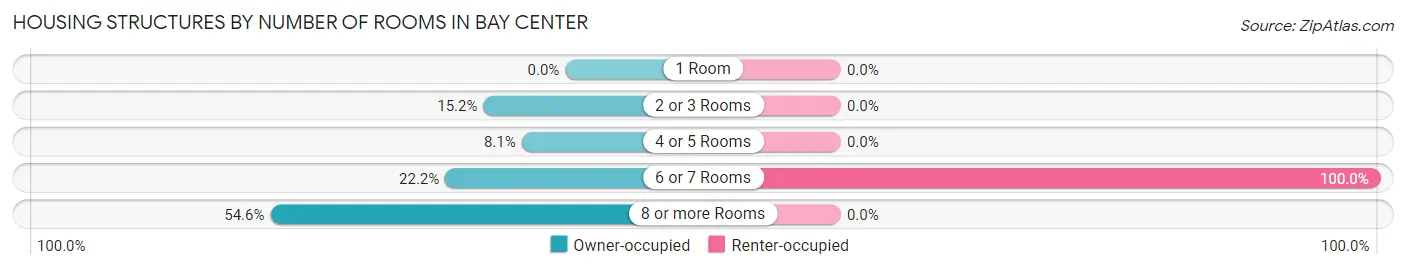
| Number of Rooms | Owner-occupied | Renter-occupied |
| 1 Room | 0 (0.0%) | 0 (0.0%) |
| 2 or 3 Rooms | 15 (15.1%) | 0 (0.0%) |
| 4 or 5 Rooms | 8 (8.1%) | 0 (0.0%) |
| 6 or 7 Rooms | 22 (22.2%) | 6 (100.0%) |
| 8 or more Rooms | 54 (54.5%) | 0 (0.0%) |
| Total | 99 (100.0%) | 6 (100.0%) |
Housing Structure by Heating Type in Bay Center
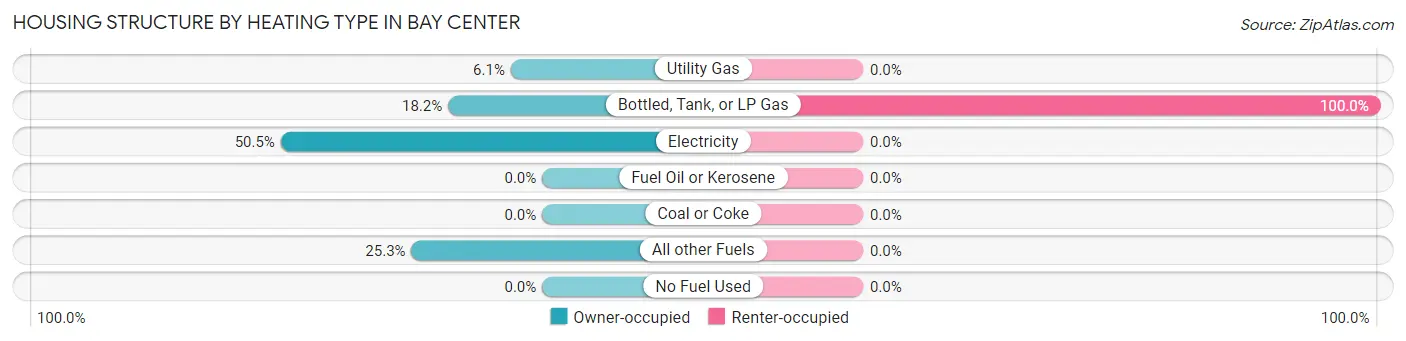
| Heating Type | Owner-occupied | Renter-occupied |
| Utility Gas | 6 (6.1%) | 0 (0.0%) |
| Bottled, Tank, or LP Gas | 18 (18.2%) | 6 (100.0%) |
| Electricity | 50 (50.5%) | 0 (0.0%) |
| Fuel Oil or Kerosene | 0 (0.0%) | 0 (0.0%) |
| Coal or Coke | 0 (0.0%) | 0 (0.0%) |
| All other Fuels | 25 (25.3%) | 0 (0.0%) |
| No Fuel Used | 0 (0.0%) | 0 (0.0%) |
| Total | 99 (100.0%) | 6 (100.0%) |
Household Vehicle Usage in Bay Center
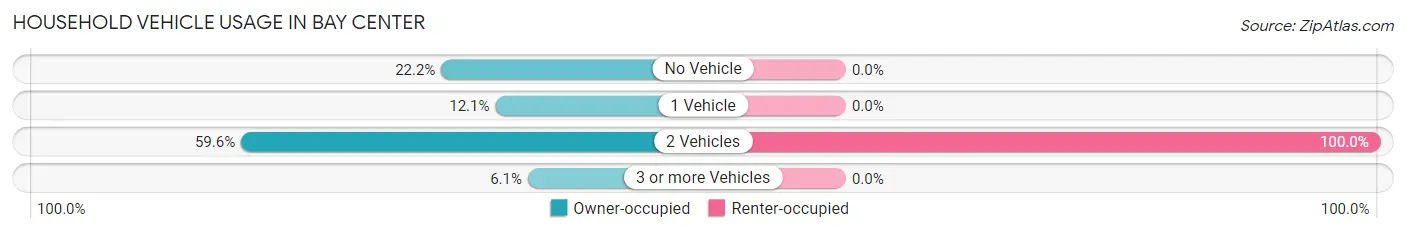
| Vehicles per Household | Owner-occupied | Renter-occupied |
| No Vehicle | 22 (22.2%) | 0 (0.0%) |
| 1 Vehicle | 12 (12.1%) | 0 (0.0%) |
| 2 Vehicles | 59 (59.6%) | 6 (100.0%) |
| 3 or more Vehicles | 6 (6.1%) | 0 (0.0%) |
| Total | 99 (100.0%) | 6 (100.0%) |
Real Estate & Mortgages in Bay Center
Real Estate and Mortgage Overview in Bay Center
| Characteristic | Without Mortgage | With Mortgage |
| Housing Units | 53 | 46 |
| Median Property Value | - | - |
| Median Household Income | - | - |
| Monthly Housing Costs | $614 | $13 |
| Real Estate Taxes | - | - |
Property Value by Mortgage Status in Bay Center
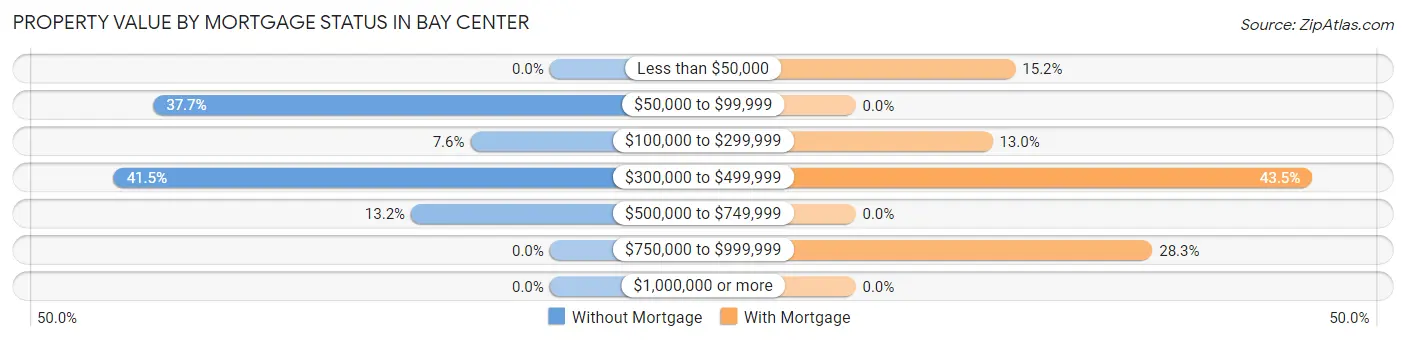
| Property Value | Without Mortgage | With Mortgage |
| Less than $50,000 | 0 (0.0%) | 7 (15.2%) |
| $50,000 to $99,999 | 20 (37.7%) | 0 (0.0%) |
| $100,000 to $299,999 | 4 (7.5%) | 6 (13.0%) |
| $300,000 to $499,999 | 22 (41.5%) | 20 (43.5%) |
| $500,000 to $749,999 | 7 (13.2%) | 0 (0.0%) |
| $750,000 to $999,999 | 0 (0.0%) | 13 (28.3%) |
| $1,000,000 or more | 0 (0.0%) | 0 (0.0%) |
| Total | 53 (100.0%) | 46 (100.0%) |
Household Income by Mortgage Status in Bay Center
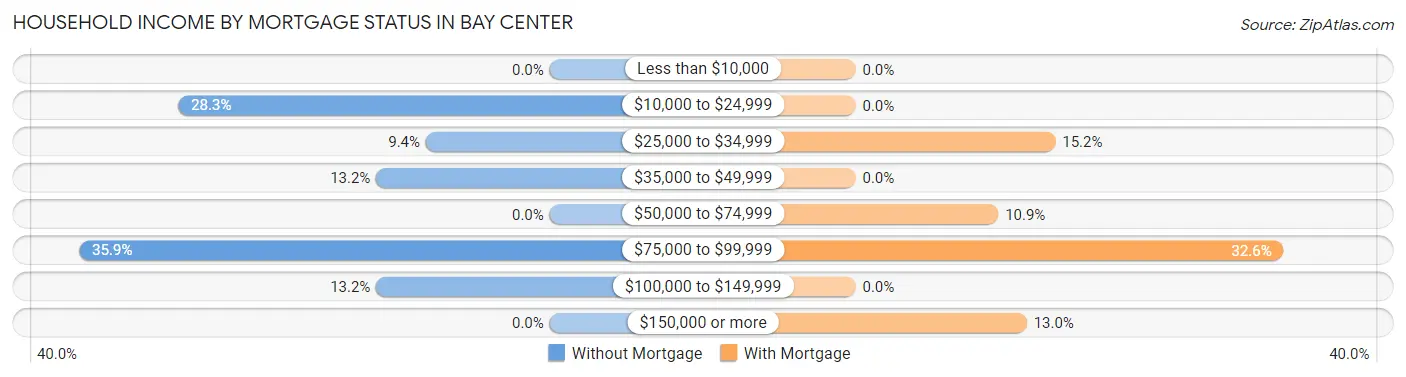
| Household Income | Without Mortgage | With Mortgage |
| Less than $10,000 | 0 (0.0%) | 0 (0.0%) |
| $10,000 to $24,999 | 15 (28.3%) | 0 (0.0%) |
| $25,000 to $34,999 | 5 (9.4%) | 7 (15.2%) |
| $35,000 to $49,999 | 7 (13.2%) | 0 (0.0%) |
| $50,000 to $74,999 | 0 (0.0%) | 5 (10.9%) |
| $75,000 to $99,999 | 19 (35.8%) | 15 (32.6%) |
| $100,000 to $149,999 | 7 (13.2%) | 0 (0.0%) |
| $150,000 or more | 0 (0.0%) | 6 (13.0%) |
| Total | 53 (100.0%) | 46 (100.0%) |
Property Value to Household Income Ratio in Bay Center
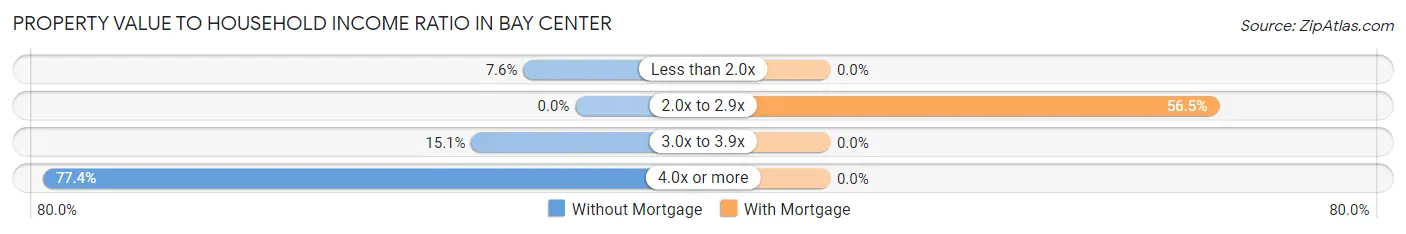
| Value-to-Income Ratio | Without Mortgage | With Mortgage |
| Less than 2.0x | 4 (7.5%) | 0 (0.0%) |
| 2.0x to 2.9x | 0 (0.0%) | 26 (56.5%) |
| 3.0x to 3.9x | 8 (15.1%) | 0 (0.0%) |
| 4.0x or more | 41 (77.4%) | 0 (0.0%) |
| Total | 53 (100.0%) | 46 (100.0%) |
Real Estate Taxes by Mortgage Status in Bay Center
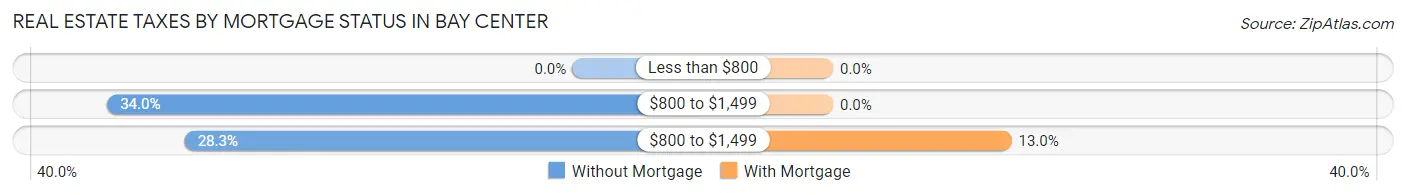
| Property Taxes | Without Mortgage | With Mortgage |
| Less than $800 | 0 (0.0%) | 0 (0.0%) |
| $800 to $1,499 | 18 (34.0%) | 0 (0.0%) |
| $800 to $1,499 | 15 (28.3%) | 6 (13.0%) |
| Total | 53 (100.0%) | 46 (100.0%) |
Health & Disability in Bay Center
Health Insurance Coverage by Age in Bay Center
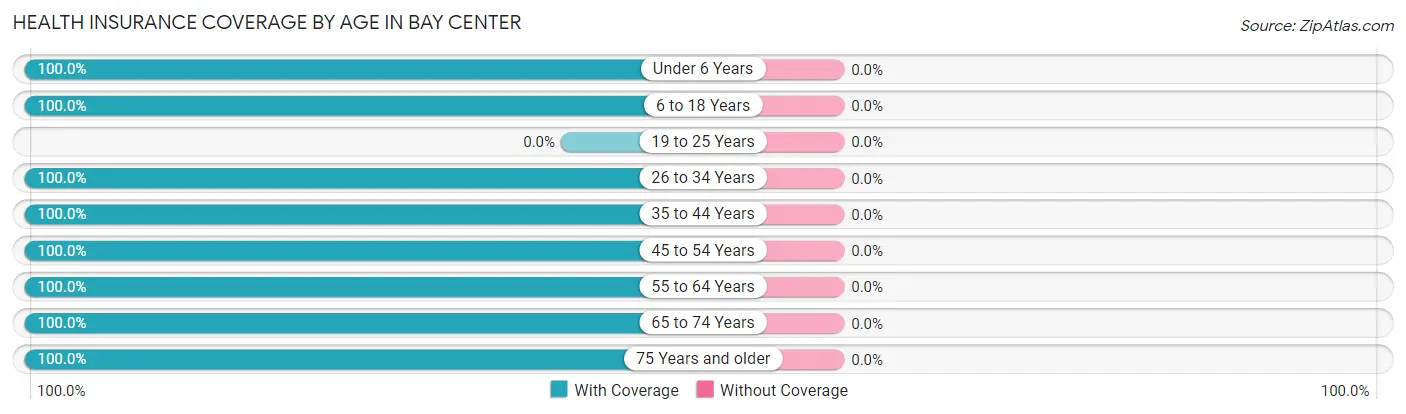
| Age Bracket | With Coverage | Without Coverage |
| Under 6 Years | 4 (100.0%) | 0 (0.0%) |
| 6 to 18 Years | 4 (100.0%) | 0 (0.0%) |
| 19 to 25 Years | 0 (0.0%) | 0 (0.0%) |
| 26 to 34 Years | 7 (100.0%) | 0 (0.0%) |
| 35 to 44 Years | 6 (100.0%) | 0 (0.0%) |
| 45 to 54 Years | 43 (100.0%) | 0 (0.0%) |
| 55 to 64 Years | 67 (100.0%) | 0 (0.0%) |
| 65 to 74 Years | 29 (100.0%) | 0 (0.0%) |
| 75 Years and older | 20 (100.0%) | 0 (0.0%) |
| Total | 180 (100.0%) | 0 (0.0%) |
Health Insurance Coverage by Citizenship Status in Bay Center
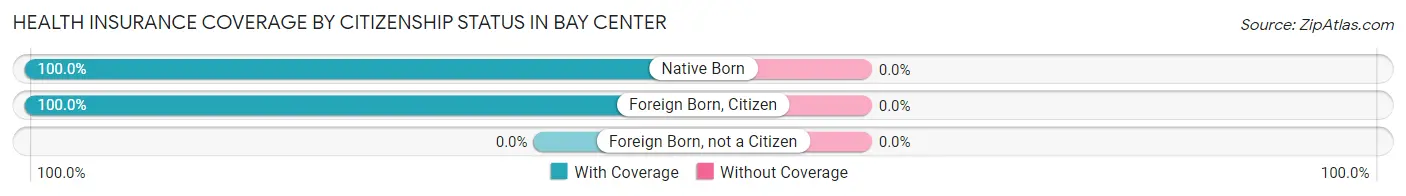
| Citizenship Status | With Coverage | Without Coverage |
| Native Born | 4 (100.0%) | 0 (0.0%) |
| Foreign Born, Citizen | 4 (100.0%) | 0 (0.0%) |
| Foreign Born, not a Citizen | 0 (0.0%) | 0 (0.0%) |
Health Insurance Coverage by Household Income in Bay Center
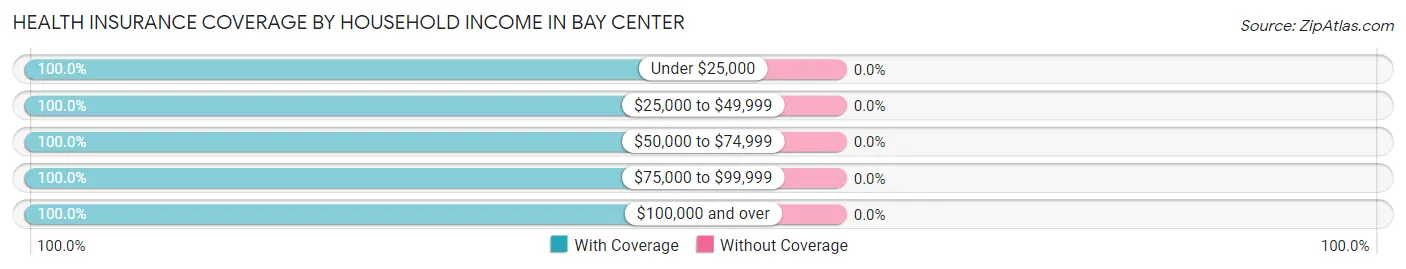
| Household Income | With Coverage | Without Coverage |
| Under $25,000 | 22 (100.0%) | 0 (0.0%) |
| $25,000 to $49,999 | 31 (100.0%) | 0 (0.0%) |
| $50,000 to $74,999 | 21 (100.0%) | 0 (0.0%) |
| $75,000 to $99,999 | 40 (100.0%) | 0 (0.0%) |
| $100,000 and over | 66 (100.0%) | 0 (0.0%) |
Public vs Private Health Insurance Coverage by Age in Bay Center
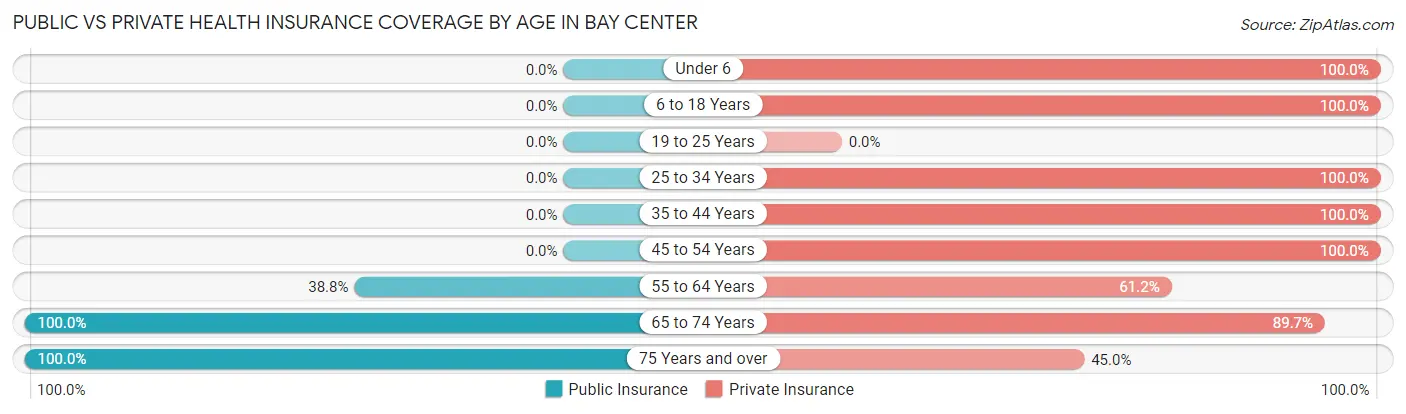
| Age Bracket | Public Insurance | Private Insurance |
| Under 6 | 0 (0.0%) | 4 (100.0%) |
| 6 to 18 Years | 0 (0.0%) | 4 (100.0%) |
| 19 to 25 Years | 0 (0.0%) | 0 (0.0%) |
| 25 to 34 Years | 0 (0.0%) | 7 (100.0%) |
| 35 to 44 Years | 0 (0.0%) | 6 (100.0%) |
| 45 to 54 Years | 0 (0.0%) | 43 (100.0%) |
| 55 to 64 Years | 26 (38.8%) | 41 (61.2%) |
| 65 to 74 Years | 29 (100.0%) | 26 (89.7%) |
| 75 Years and over | 20 (100.0%) | 9 (45.0%) |
| Total | 75 (41.7%) | 140 (77.8%) |
Disability Status by Sex by Age in Bay Center

| Age Bracket | Male | Female |
| Under 5 Years | 0 (0.0%) | 0 (0.0%) |
| 5 to 17 Years | 0 (0.0%) | 0 (0.0%) |
| 18 to 34 Years | 0 (0.0%) | 0 (0.0%) |
| 35 to 64 Years | 30 (61.2%) | 0 (0.0%) |
| 65 to 74 Years | 15 (62.5%) | 5 (100.0%) |
| 75 Years and over | 5 (100.0%) | 4 (26.7%) |
Disability Class by Sex by Age in Bay Center
Disability Class: Hearing Difficulty
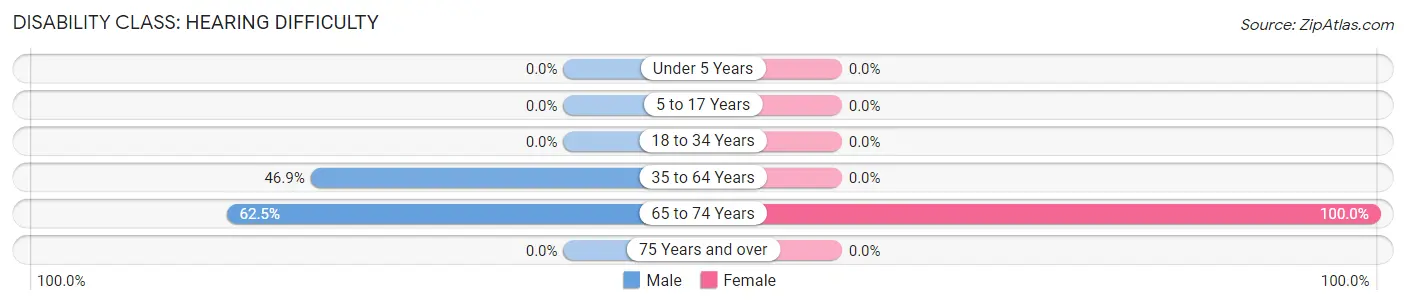
| Age Bracket | Male | Female |
| Under 5 Years | 0 (0.0%) | 0 (0.0%) |
| 5 to 17 Years | 0 (0.0%) | 0 (0.0%) |
| 18 to 34 Years | 0 (0.0%) | 0 (0.0%) |
| 35 to 64 Years | 23 (46.9%) | 0 (0.0%) |
| 65 to 74 Years | 15 (62.5%) | 5 (100.0%) |
| 75 Years and over | 0 (0.0%) | 0 (0.0%) |
Disability Class: Vision Difficulty
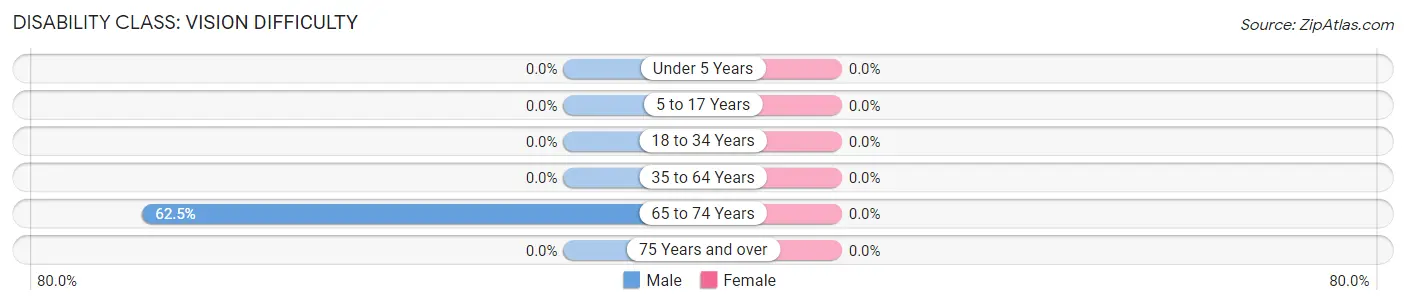
| Age Bracket | Male | Female |
| Under 5 Years | 0 (0.0%) | 0 (0.0%) |
| 5 to 17 Years | 0 (0.0%) | 0 (0.0%) |
| 18 to 34 Years | 0 (0.0%) | 0 (0.0%) |
| 35 to 64 Years | 0 (0.0%) | 0 (0.0%) |
| 65 to 74 Years | 15 (62.5%) | 0 (0.0%) |
| 75 Years and over | 0 (0.0%) | 0 (0.0%) |
Disability Class: Cognitive Difficulty
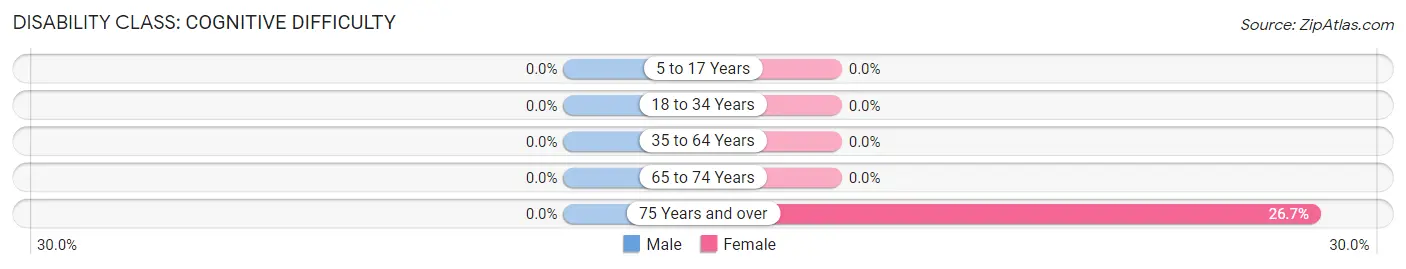
| Age Bracket | Male | Female |
| 5 to 17 Years | 0 (0.0%) | 0 (0.0%) |
| 18 to 34 Years | 0 (0.0%) | 0 (0.0%) |
| 35 to 64 Years | 0 (0.0%) | 0 (0.0%) |
| 65 to 74 Years | 0 (0.0%) | 0 (0.0%) |
| 75 Years and over | 0 (0.0%) | 4 (26.7%) |
Disability Class: Ambulatory Difficulty
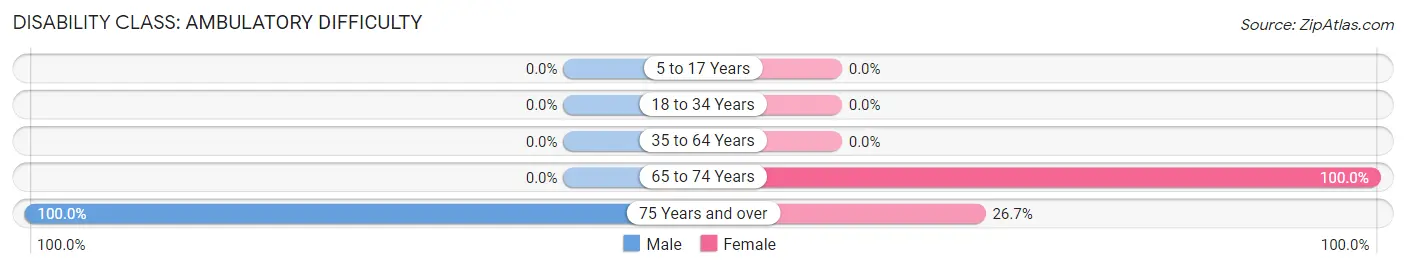
| Age Bracket | Male | Female |
| 5 to 17 Years | 0 (0.0%) | 0 (0.0%) |
| 18 to 34 Years | 0 (0.0%) | 0 (0.0%) |
| 35 to 64 Years | 0 (0.0%) | 0 (0.0%) |
| 65 to 74 Years | 0 (0.0%) | 5 (100.0%) |
| 75 Years and over | 5 (100.0%) | 4 (26.7%) |
Disability Class: Self-Care Difficulty
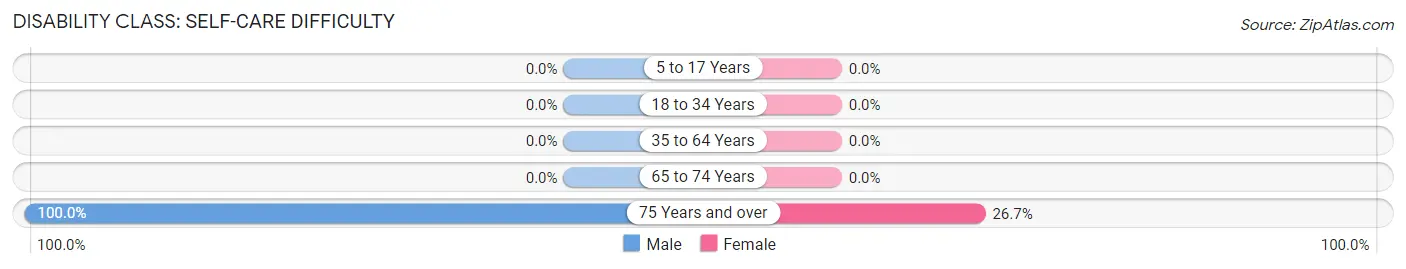
| Age Bracket | Male | Female |
| 5 to 17 Years | 0 (0.0%) | 0 (0.0%) |
| 18 to 34 Years | 0 (0.0%) | 0 (0.0%) |
| 35 to 64 Years | 0 (0.0%) | 0 (0.0%) |
| 65 to 74 Years | 0 (0.0%) | 0 (0.0%) |
| 75 Years and over | 5 (100.0%) | 4 (26.7%) |
Technology Access in Bay Center
Computing Device Access in Bay Center
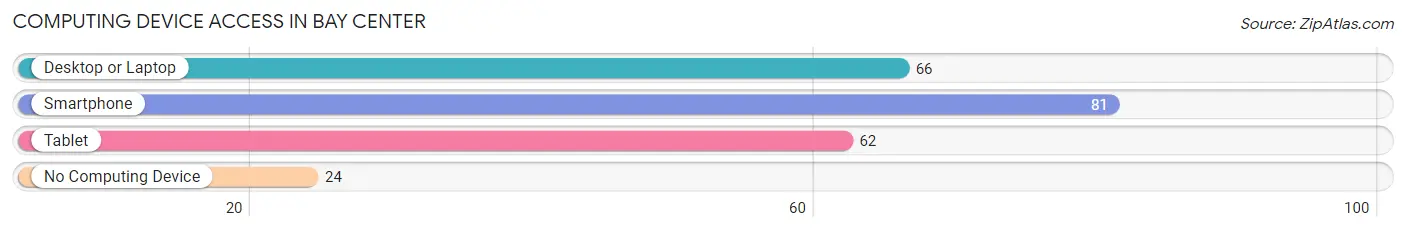
| Device Type | # Households | % Households |
| Desktop or Laptop | 66 | 62.9% |
| Smartphone | 81 | 77.1% |
| Tablet | 62 | 59.1% |
| No Computing Device | 24 | 22.9% |
| Total | 105 | 100.0% |
Internet Access in Bay Center
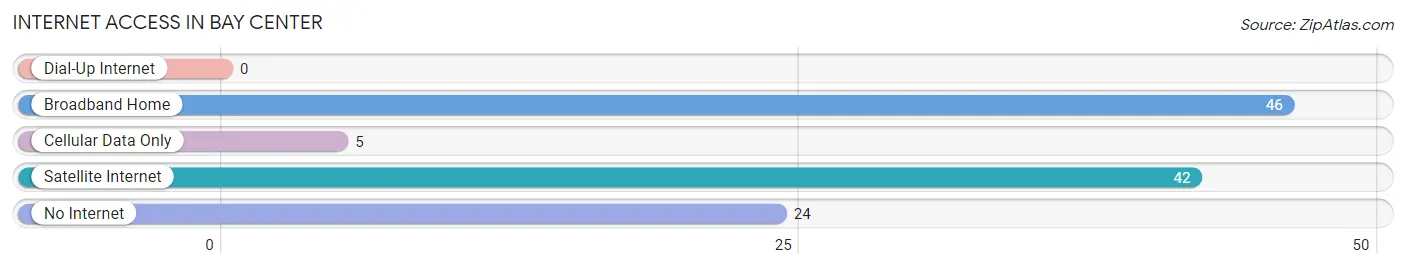
| Internet Type | # Households | % Households |
| Dial-Up Internet | 0 | 0.0% |
| Broadband Home | 46 | 43.8% |
| Cellular Data Only | 5 | 4.8% |
| Satellite Internet | 42 | 40.0% |
| No Internet | 24 | 22.9% |
| Total | 105 | 100.0% |
Bay Center Summary
Bay Center is a small unincorporated community located in Pacific County, Washington, United States. It is situated on Willapa Bay, a large estuary of the Pacific Ocean. The population of Bay Center was estimated to be around 500 in 2020.
History
The area around Bay Center was first inhabited by the Chinook people, who lived in the area for thousands of years before the arrival of European settlers. The first European settlers arrived in the area in the late 19th century, and the town of Bay Center was officially established in 1891. The town was named after the nearby Willapa Bay, which was named by explorer George Vancouver in 1792.
The town of Bay Center was initially a fishing and logging community, and the local economy was largely based on these industries. In the early 20th century, the town began to develop a tourism industry, and it became a popular destination for visitors from Seattle and other nearby cities.
Geography
Bay Center is located in Pacific County, Washington, on the western shore of Willapa Bay. The town is situated at an elevation of approximately 10 feet (3 meters) above sea level. The town is surrounded by forests and wetlands, and the nearby Willapa Bay is a popular destination for fishing, boating, and other recreational activities.
The climate in Bay Center is mild and temperate, with warm summers and cool winters. The average annual temperature is around 50°F (10°C), and the average annual precipitation is around 40 inches (102 cm).
Economy
The economy of Bay Center is largely based on tourism and fishing. The town is a popular destination for visitors from Seattle and other nearby cities, and it is home to several restaurants, hotels, and other tourist attractions. The local fishing industry is also an important part of the economy, and the town is home to several seafood processing plants.
Demographics
The population of Bay Center was estimated to be around 500 in 2020. The town is predominantly white, with a small minority population. The median household income in Bay Center is around $45,000, and the median home value is around $200,000. The town has a high rate of homeownership, with around 75% of residents owning their own homes.
Common Questions
What is Per Capita Income in Bay Center?
Per Capita income in Bay Center is $79,339.
What is the Median Household income in Bay Center?
Median Household Income in Bay Center is $66,250.
What is Inequality or Gini Index in Bay Center?
Inequality or Gini Index in Bay Center is 0.59.
What is the Total Population of Bay Center?
Total Population of Bay Center is 180.
What is the Total Male Population of Bay Center?
Total Male Population of Bay Center is 86.
What is the Total Female Population of Bay Center?
Total Female Population of Bay Center is 94.
What is the Ratio of Males per 100 Females in Bay Center?
There are 91.49 Males per 100 Females in Bay Center.
What is the Ratio of Females per 100 Males in Bay Center?
There are 109.30 Females per 100 Males in Bay Center.
What is the Median Population Age in Bay Center?
Median Population Age in Bay Center is 61.3 Years.
What is the Average Family Size in Bay Center
Average Family Size in Bay Center is 2.3 People.
What is the Average Household Size in Bay Center
Average Household Size in Bay Center is 1.7 People.
How Large is the Labor Force in Bay Center?
There are 76 People in the Labor Forcein in Bay Center.
What is the Percentage of People in the Labor Force in Bay Center?
44.2% of People are in the Labor Force in Bay Center.
What is the Unemployment Rate in Bay Center?
Unemployment Rate in Bay Center is 9.2%.