Syrian vs Immigrants from Bosnia and Herzegovina 4 or more Vehicles in Household
COMPARE
Syrian
Immigrants from Bosnia and Herzegovina
4 or more Vehicles in Household
4 or more Vehicles in Household Comparison
Syrians
Immigrants from Bosnia and Herzegovina
6.3%
4 OR MORE VEHICLES IN HOUSEHOLD
42.0/ 100
METRIC RATING
180th/ 347
METRIC RANK
5.3%
4 OR MORE VEHICLES IN HOUSEHOLD
0.2/ 100
METRIC RATING
289th/ 347
METRIC RANK
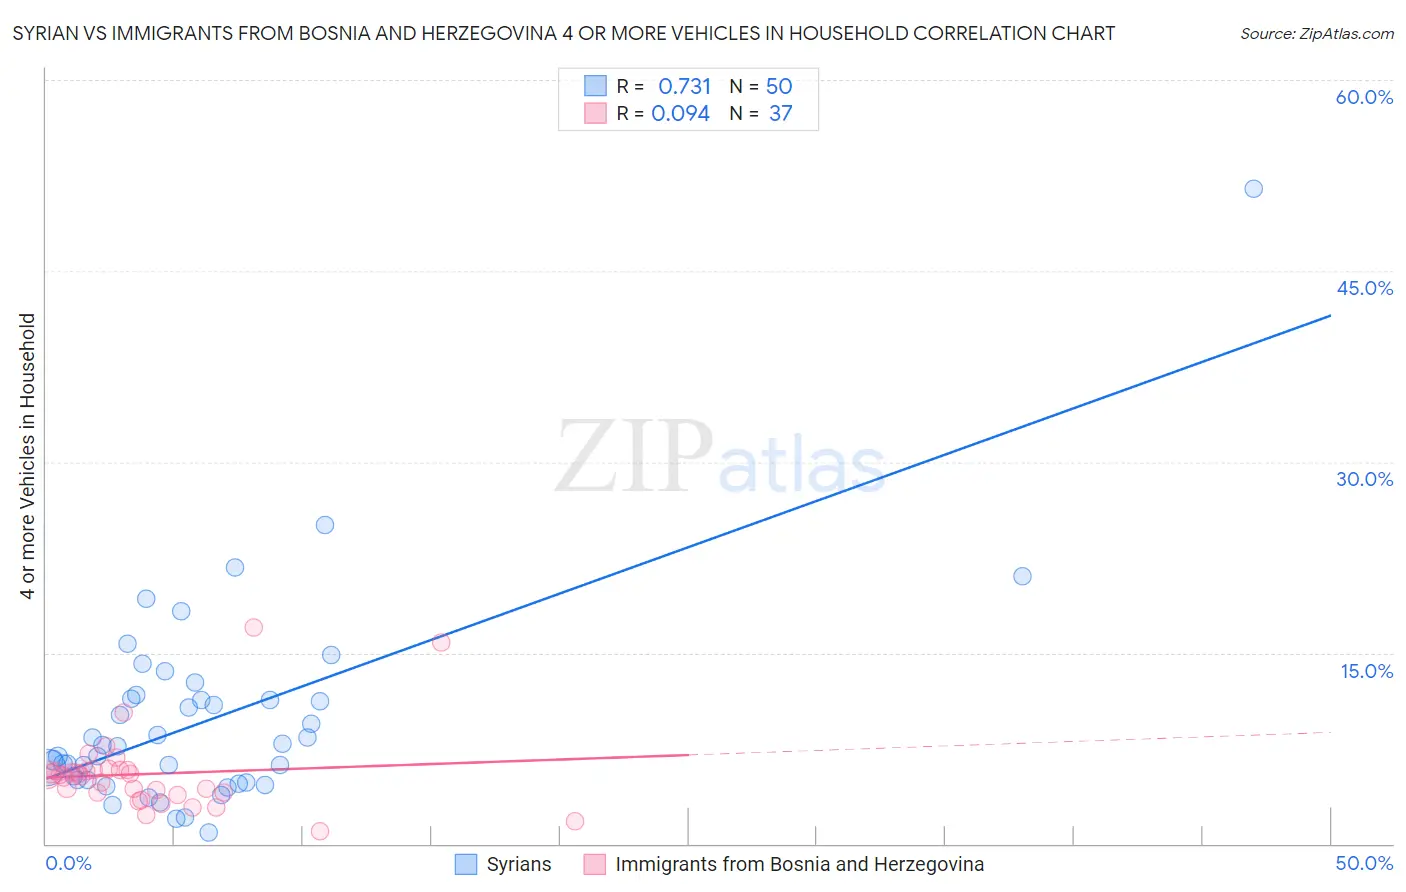
Syrian vs Immigrants from Bosnia and Herzegovina 4 or more Vehicles in Household Correlation Chart
The statistical analysis conducted on geographies consisting of 265,313,464 people shows a strong positive correlation between the proportion of Syrians and percentage of households with 4 or more vehicles available in the United States with a correlation coefficient (R) of 0.731 and weighted average of 6.3%. Similarly, the statistical analysis conducted on geographies consisting of 156,484,341 people shows a slight positive correlation between the proportion of Immigrants from Bosnia and Herzegovina and percentage of households with 4 or more vehicles available in the United States with a correlation coefficient (R) of 0.094 and weighted average of 5.3%, a difference of 17.6%.
4 or more Vehicles in Household Correlation Summary
| Measurement | Syrian | Immigrants from Bosnia and Herzegovina |
| Minimum | 0.87% | 0.96% |
| Maximum | 51.4% | 17.0% |
| Range | 50.6% | 16.0% |
| Mean | 9.8% | 5.5% |
| Median | 7.7% | 5.4% |
| Interquartile 25% (IQ1) | 5.0% | 3.9% |
| Interquartile 75% (IQ3) | 11.4% | 5.8% |
| Interquartile Range (IQR) | 6.4% | 1.9% |
| Standard Deviation (Sample) | 8.1% | 3.2% |
| Standard Deviation (Population) | 8.0% | 3.1% |
Similar Demographics by 4 or more Vehicles in Household
Demographics Similar to Syrians by 4 or more Vehicles in Household
In terms of 4 or more vehicles in household, the demographic groups most similar to Syrians are Yugoslavian (6.3%, a difference of 0.090%), Immigrants from Japan (6.3%, a difference of 0.11%), South American Indian (6.3%, a difference of 0.14%), Belizean (6.3%, a difference of 0.27%), and Immigrants from Burma/Myanmar (6.2%, a difference of 0.48%).
| Demographics | Rating | Rank | 4 or more Vehicles in Household |
| Slovenes | 51.1 /100 | #173 | Average 6.3% |
| Lithuanians | 50.0 /100 | #174 | Average 6.3% |
| Immigrants | Western Europe | 48.8 /100 | #175 | Average 6.3% |
| Ukrainians | 47.6 /100 | #176 | Average 6.3% |
| Slovaks | 46.9 /100 | #177 | Average 6.3% |
| Belizeans | 44.5 /100 | #178 | Average 6.3% |
| Immigrants | Japan | 43.1 /100 | #179 | Average 6.3% |
| Syrians | 42.0 /100 | #180 | Average 6.3% |
| Yugoslavians | 41.1 /100 | #181 | Average 6.3% |
| South American Indians | 40.7 /100 | #182 | Average 6.3% |
| Immigrants | Burma/Myanmar | 37.5 /100 | #183 | Fair 6.2% |
| Iraqis | 37.3 /100 | #184 | Fair 6.2% |
| Thais | 36.9 /100 | #185 | Fair 6.2% |
| Immigrants | Northern Europe | 36.8 /100 | #186 | Fair 6.2% |
| Immigrants | South Africa | 35.4 /100 | #187 | Fair 6.2% |
Demographics Similar to Immigrants from Bosnia and Herzegovina by 4 or more Vehicles in Household
In terms of 4 or more vehicles in household, the demographic groups most similar to Immigrants from Bosnia and Herzegovina are Venezuelan (5.3%, a difference of 0.14%), Immigrants from Russia (5.3%, a difference of 0.30%), Immigrants from Croatia (5.4%, a difference of 0.33%), Immigrants from Colombia (5.4%, a difference of 0.42%), and Immigrants from Liberia (5.4%, a difference of 0.46%).
| Demographics | Rating | Rank | 4 or more Vehicles in Household |
| Immigrants | Spain | 0.3 /100 | #282 | Tragic 5.4% |
| Immigrants | Ireland | 0.3 /100 | #283 | Tragic 5.4% |
| Brazilians | 0.3 /100 | #284 | Tragic 5.4% |
| Immigrants | Liberia | 0.2 /100 | #285 | Tragic 5.4% |
| Immigrants | Colombia | 0.2 /100 | #286 | Tragic 5.4% |
| Immigrants | Croatia | 0.2 /100 | #287 | Tragic 5.4% |
| Venezuelans | 0.2 /100 | #288 | Tragic 5.3% |
| Immigrants | Bosnia and Herzegovina | 0.2 /100 | #289 | Tragic 5.3% |
| Immigrants | Russia | 0.2 /100 | #290 | Tragic 5.3% |
| Immigrants | Bahamas | 0.1 /100 | #291 | Tragic 5.3% |
| Liberians | 0.1 /100 | #292 | Tragic 5.3% |
| Immigrants | Congo | 0.1 /100 | #293 | Tragic 5.2% |
| Ghanaians | 0.1 /100 | #294 | Tragic 5.2% |
| Immigrants | Brazil | 0.1 /100 | #295 | Tragic 5.2% |
| Israelis | 0.1 /100 | #296 | Tragic 5.2% |