South African vs Honduran 1 or more Vehicles in Household
COMPARE
South African
Honduran
1 or more Vehicles in Household
1 or more Vehicles in Household Comparison
South Africans
Hondurans
90.0%
1 OR MORE VEHICLES IN HOUSEHOLD
69.7/ 100
METRIC RATING
159th/ 347
METRIC RANK
88.1%
1 OR MORE VEHICLES IN HOUSEHOLD
1.0/ 100
METRIC RATING
253rd/ 347
METRIC RANK
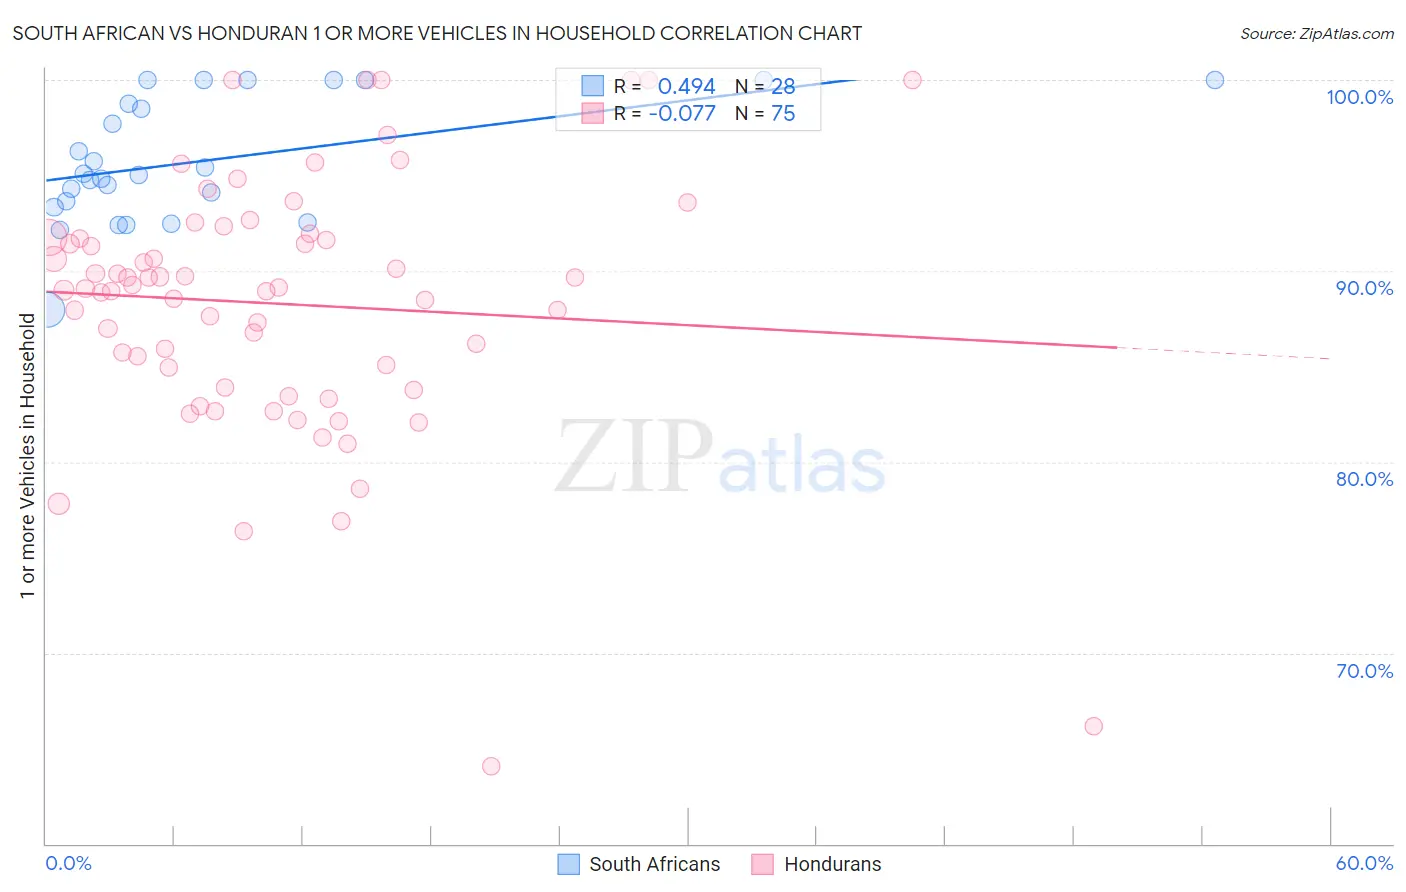
South African vs Honduran 1 or more Vehicles in Household Correlation Chart
The statistical analysis conducted on geographies consisting of 182,559,953 people shows a moderate positive correlation between the proportion of South Africans and percentage of households with 1 or more vehicles available in the United States with a correlation coefficient (R) of 0.494 and weighted average of 90.0%. Similarly, the statistical analysis conducted on geographies consisting of 357,633,161 people shows a slight negative correlation between the proportion of Hondurans and percentage of households with 1 or more vehicles available in the United States with a correlation coefficient (R) of -0.077 and weighted average of 88.1%, a difference of 2.2%.
1 or more Vehicles in Household Correlation Summary
| Measurement | South African | Honduran |
| Minimum | 88.0% | 64.1% |
| Maximum | 100.0% | 100.0% |
| Range | 12.0% | 35.9% |
| Mean | 95.8% | 88.3% |
| Median | 95.1% | 89.1% |
| Interquartile 25% (IQ1) | 93.5% | 83.9% |
| Interquartile 75% (IQ3) | 99.4% | 91.7% |
| Interquartile Range (IQR) | 5.9% | 7.8% |
| Standard Deviation (Sample) | 3.2% | 6.8% |
| Standard Deviation (Population) | 3.2% | 6.7% |
Similar Demographics by 1 or more Vehicles in Household
Demographics Similar to South Africans by 1 or more Vehicles in Household
In terms of 1 or more vehicles in household, the demographic groups most similar to South Africans are Brazilian (90.0%, a difference of 0.020%), Immigrants from Indonesia (90.0%, a difference of 0.020%), Salvadoran (90.0%, a difference of 0.020%), Immigrants from Congo (90.0%, a difference of 0.030%), and Australian (90.0%, a difference of 0.050%).
| Demographics | Rating | Rank | 1 or more Vehicles in Household |
| Tlingit-Haida | 74.3 /100 | #152 | Good 90.1% |
| New Zealanders | 73.8 /100 | #153 | Good 90.1% |
| Immigrants | Uganda | 73.8 /100 | #154 | Good 90.1% |
| Immigrants | Immigrants | 73.6 /100 | #155 | Good 90.1% |
| Australians | 72.4 /100 | #156 | Good 90.0% |
| Immigrants | Congo | 71.2 /100 | #157 | Good 90.0% |
| Brazilians | 71.0 /100 | #158 | Good 90.0% |
| South Africans | 69.7 /100 | #159 | Good 90.0% |
| Immigrants | Indonesia | 68.8 /100 | #160 | Good 90.0% |
| Salvadorans | 68.7 /100 | #161 | Good 90.0% |
| Spanish American Indians | 67.0 /100 | #162 | Good 89.9% |
| Immigrants | Austria | 65.5 /100 | #163 | Good 89.9% |
| Comanche | 63.4 /100 | #164 | Good 89.9% |
| Immigrants | Saudi Arabia | 62.6 /100 | #165 | Good 89.9% |
| Immigrants | Middle Africa | 62.2 /100 | #166 | Good 89.9% |
Demographics Similar to Hondurans by 1 or more Vehicles in Household
In terms of 1 or more vehicles in household, the demographic groups most similar to Hondurans are Haitian (88.1%, a difference of 0.010%), Immigrants from Uruguay (88.1%, a difference of 0.030%), Immigrants from Latvia (88.1%, a difference of 0.030%), Colombian (88.0%, a difference of 0.040%), and Liberian (88.0%, a difference of 0.040%).
| Demographics | Rating | Rank | 1 or more Vehicles in Household |
| Menominee | 1.9 /100 | #246 | Tragic 88.3% |
| Immigrants | Honduras | 1.7 /100 | #247 | Tragic 88.3% |
| Immigrants | Nigeria | 1.5 /100 | #248 | Tragic 88.2% |
| Blacks/African Americans | 1.4 /100 | #249 | Tragic 88.2% |
| Egyptians | 1.2 /100 | #250 | Tragic 88.2% |
| Immigrants | Serbia | 1.2 /100 | #251 | Tragic 88.2% |
| Immigrants | Uruguay | 1.1 /100 | #252 | Tragic 88.1% |
| Hondurans | 1.0 /100 | #253 | Tragic 88.1% |
| Haitians | 0.9 /100 | #254 | Tragic 88.1% |
| Immigrants | Latvia | 0.9 /100 | #255 | Tragic 88.1% |
| Colombians | 0.9 /100 | #256 | Tragic 88.0% |
| Liberians | 0.9 /100 | #257 | Tragic 88.0% |
| South American Indians | 0.9 /100 | #258 | Tragic 88.0% |
| Nigerians | 0.8 /100 | #259 | Tragic 88.0% |
| Macedonians | 0.6 /100 | #260 | Tragic 87.9% |