Norwegian vs Chickasaw 1 or more Vehicles in Household

COMPARE

Norwegian
Race
Ancestry
AfghanAfricanAlaska NativeAlaskan AthabascanAlbanianAleutAlsatianAmericanApacheArabArapahoArgentineanArmenianAssyrian/Chaldean/SyriacAustralianAustrianBahamianBangladeshiBarbadianBasqueBelgianBelizeanBermudanBhutaneseBlackfeetBolivianBrazilianBritishBritish West IndianBulgarianBurmeseCajunCambodianCanadianCape VerdeanCarpatho RusynCelticCentral AmericanCentral American IndianCherokeeCheyenneChileanChineseChippewaChoctawColombianColvilleComancheCosta RicanCreeCreekCroatianCrowCubanCypriotCzechCzechoslovakianDanishDelawareDominicanDutchDutch West IndianEastern EuropeanEcuadorianEgyptianEnglishEstonianEthiopianEuropeanFijianFilipinoFinnishFrenchFrench American IndianFrench CanadianGermanGerman RussianGhanaianGreekGuamanian/ChamorroGuatemalanGuyaneseHaitianHmongHonduranHopiHoumaHungarianIcelanderIndian (Asian)IndonesianInupiatIranianIraqiIrishIroquoisIsraeliItalianJamaicanJapaneseJordanianKenyanKiowaKoreanLaotianLatvianLebaneseLiberianLithuanianLumbeeLuxembourgerMacedonianMalaysianMalteseMarshalleseMenomineeMexicanMexican American IndianMongolianMoroccanNative HawaiianNavajoNepaleseNew ZealanderNicaraguanNigerianNorthern EuropeanNorwegianOkinawanOsageOttawaPaiutePakistaniPalestinianPanamanianParaguayanPennsylvania GermanPeruvianPimaPolishPortuguesePotawatomiPuebloPuerto RicanPuget Sound SalishRomanianRussianSalvadoranSamoanScandinavianScotch-IrishScottishSeminoleSenegaleseSerbianShoshoneSierra LeoneanSiouxSlavicSlovakSloveneSomaliSouth AfricanSouth AmericanSouth American IndianSoviet UnionSpaniardSpanishSpanish AmericanSpanish American IndianSri LankanSubsaharan AfricanSudaneseSwedishSwissSyrianTaiwaneseThaiTlingit-HaidaTohono O'OdhamTonganTrinidadian and TobagonianTsimshianTurkishU.S. Virgin IslanderUgandanUkrainianUruguayanUteVenezuelanVietnameseWelshWest IndianYakamaYaquiYugoslavianYumanYup'ikZimbabwean
Immigration
NonimmigrantsImmigrantsAfghanistanAfricaAlbaniaArgentinaArmeniaAsiaAustraliaAustriaBahamasBangladeshBarbadosBelarusBelgiumBelizeBoliviaBosnia and HerzegovinaBrazilBulgariaBurma/MyanmarCabo VerdeCambodiaCameroonCanadaCaribbeanCentral AmericaChileChinaColombiaCongoCosta RicaCroatiaCubaCzechoslovakiaDenmarkDominicaDominican RepublicEastern AfricaEastern AsiaEastern EuropeEcuadorEgyptEl SalvadorEnglandEritreaEthiopiaEuropeFijiFranceGermanyGhanaGreeceGrenadaGuatemalaGuyanaHaitiHondurasHong KongHungaryIndiaIndonesiaIranIraqIrelandIsraelItalyJamaicaJapanJordanKazakhstanKenyaKoreaKuwaitLaosLatin AmericaLatviaLebanonLiberiaLithuaniaMalaysiaMexicoMicronesiaMiddle AfricaMoldovaMoroccoNepalNetherlandsNicaraguaNigeriaNorth AmericaNorth MacedoniaNorthern AfricaNorthern EuropeNorwayOceaniaPakistanPanamaPeruPhilippinesPolandPortugalRomaniaRussiaSaudi ArabiaScotlandSenegalSerbiaSierra LeoneSingaporeSomaliaSouth AfricaSouth AmericaSouth Central AsiaSouth Eastern AsiaSouthern EuropeSpainSri LankaSt. Vincent and the GrenadinesSudanSwedenSwitzerlandSyriaTaiwanThailandTrinidad and TobagoTurkeyUgandaUkraineUruguayUzbekistanVenezuelaVietnamWest IndiesWestern AfricaWestern AsiaWestern EuropeYemenZaireZimbabweAzores
Chickasaw
Race
Ancestry
AfghanAfricanAlaska NativeAlaskan AthabascanAlbanianAleutAlsatianAmericanApacheArabArapahoArgentineanArmenianAssyrian/Chaldean/SyriacAustralianAustrianBahamianBangladeshiBarbadianBasqueBelgianBelizeanBermudanBhutaneseBlackfeetBolivianBrazilianBritishBritish West IndianBulgarianBurmeseCajunCambodianCanadianCape VerdeanCarpatho RusynCelticCentral AmericanCentral American IndianCherokeeCheyenneChickasawChileanChineseChippewaChoctawColombianColvilleComancheCosta RicanCreeCreekCroatianCrowCubanCypriotCzechCzechoslovakianDanishDelawareDominicanDutchDutch West IndianEastern EuropeanEcuadorianEgyptianEnglishEstonianEthiopianEuropeanFijianFilipinoFinnishFrenchFrench American IndianFrench CanadianGermanGerman RussianGhanaianGreekGuamanian/ChamorroGuatemalanGuyaneseHaitianHmongHonduranHopiHoumaHungarianIcelanderIndian (Asian)IndonesianInupiatIranianIraqiIrishIroquoisIsraeliItalianJamaicanJapaneseJordanianKenyanKiowaKoreanLaotianLatvianLebaneseLiberianLithuanianLumbeeLuxembourgerMacedonianMalaysianMalteseMarshalleseMenomineeMexicanMexican American IndianMongolianMoroccanNative HawaiianNavajoNepaleseNew ZealanderNicaraguanNigerianNorthern EuropeanOkinawanOsageOttawaPaiutePakistaniPalestinianPanamanianParaguayanPennsylvania GermanPeruvianPimaPolishPortuguesePotawatomiPuebloPuerto RicanPuget Sound SalishRomanianRussianSalvadoranSamoanScandinavianScotch-IrishScottishSeminoleSenegaleseSerbianShoshoneSierra LeoneanSiouxSlavicSlovakSloveneSomaliSouth AfricanSouth AmericanSouth American IndianSoviet UnionSpaniardSpanishSpanish AmericanSpanish American IndianSri LankanSubsaharan AfricanSudaneseSwedishSwissSyrianTaiwaneseThaiTlingit-HaidaTohono O'OdhamTonganTrinidadian and TobagonianTsimshianTurkishU.S. Virgin IslanderUgandanUkrainianUruguayanUteVenezuelanVietnameseWelshWest IndianYakamaYaquiYugoslavianYumanYup'ikZimbabwean
Immigration
NonimmigrantsImmigrantsAfghanistanAfricaAlbaniaArgentinaArmeniaAsiaAustraliaAustriaBahamasBangladeshBarbadosBelarusBelgiumBelizeBoliviaBosnia and HerzegovinaBrazilBulgariaBurma/MyanmarCabo VerdeCambodiaCameroonCanadaCaribbeanCentral AmericaChileChinaColombiaCongoCosta RicaCroatiaCubaCzechoslovakiaDenmarkDominicaDominican RepublicEastern AfricaEastern AsiaEastern EuropeEcuadorEgyptEl SalvadorEnglandEritreaEthiopiaEuropeFijiFranceGermanyGhanaGreeceGrenadaGuatemalaGuyanaHaitiHondurasHong KongHungaryIndiaIndonesiaIranIraqIrelandIsraelItalyJamaicaJapanJordanKazakhstanKenyaKoreaKuwaitLaosLatin AmericaLatviaLebanonLiberiaLithuaniaMalaysiaMexicoMicronesiaMiddle AfricaMoldovaMoroccoNepalNetherlandsNicaraguaNigeriaNorth AmericaNorth MacedoniaNorthern AfricaNorthern EuropeNorwayOceaniaPakistanPanamaPeruPhilippinesPolandPortugalRomaniaRussiaSaudi ArabiaScotlandSenegalSerbiaSierra LeoneSingaporeSomaliaSouth AfricaSouth AmericaSouth Central AsiaSouth Eastern AsiaSouthern EuropeSpainSri LankaSt. Vincent and the GrenadinesSudanSwedenSwitzerlandSyriaTaiwanThailandTrinidad and TobagoTurkeyUgandaUkraineUruguayUzbekistanVenezuelaVietnamWest IndiesWestern AfricaWestern AsiaWestern EuropeYemenZaireZimbabweAzores
1 or more Vehicles in Household
Income
Poverty
Unemployment
Labor Participation
Family Structure
Vehicle Availability
Education Level
Disability

1 or more Vehicles in Household Comparison

Norwegians

Chickasaw

Exceptional
Exceptional
93.7%
1 OR MORE VEHICLES IN HOUSEHOLD
100.0/ 100
METRIC RATING
3rd/ 347
METRIC RANK
92.3%
1 OR MORE VEHICLES IN HOUSEHOLD
99.9/ 100
METRIC RATING
42nd/ 347
METRIC RANK

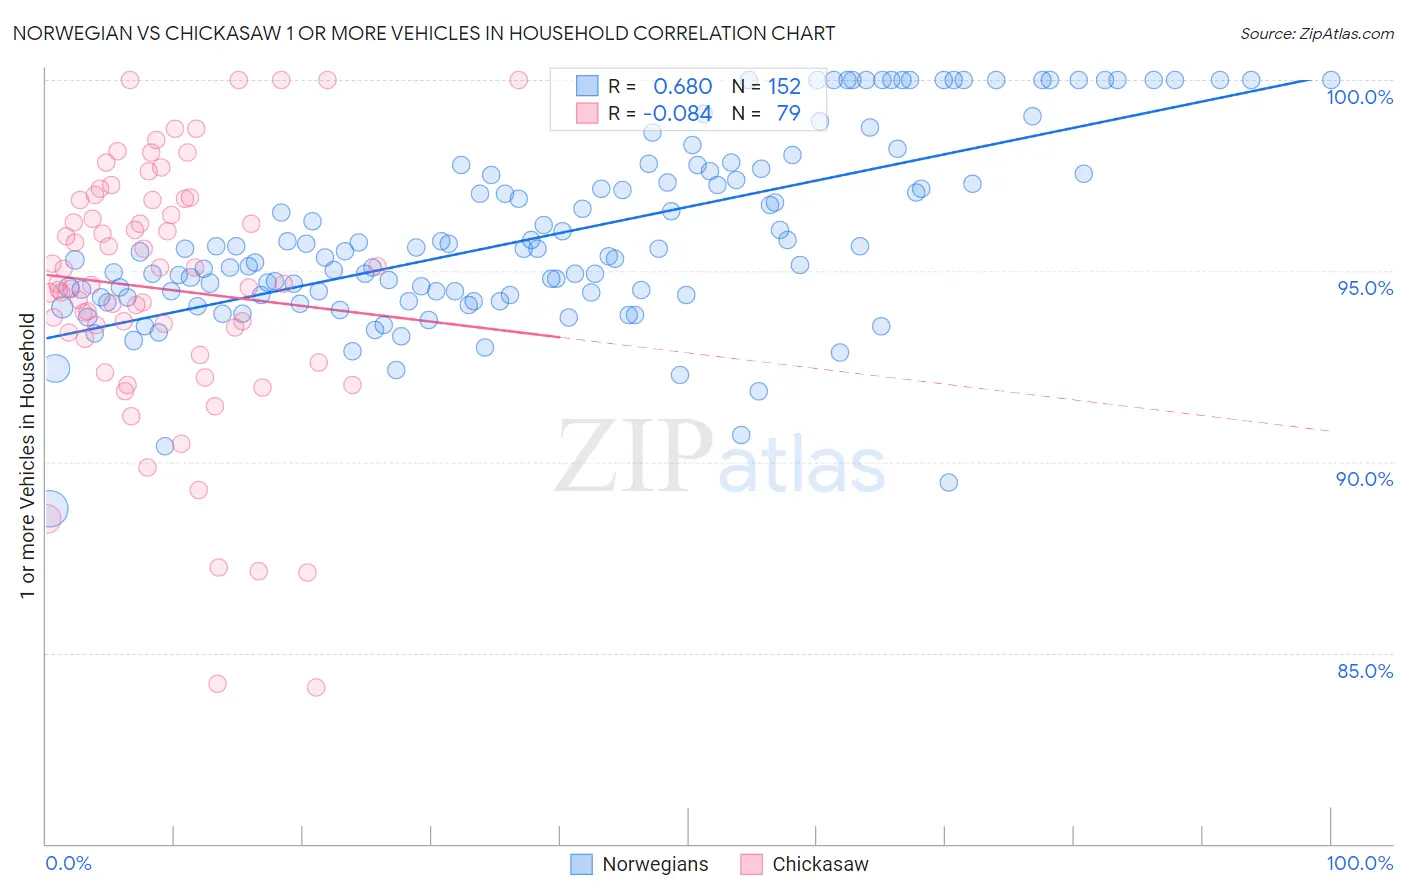
Norwegian vs Chickasaw 1 or more Vehicles in Household Correlation Chart

The statistical analysis conducted on geographies consisting of 532,998,902 people shows a significant positive correlation between the proportion of Norwegians and percentage of households with 1 or more vehicles available in the United States with a correlation coefficient (R) of 0.680 and weighted average of 93.7%. Similarly, the statistical analysis conducted on geographies consisting of 147,674,268 people shows a slight negative correlation between the proportion of Chickasaw and percentage of households with 1 or more vehicles available in the United States with a correlation coefficient (R) of -0.084 and weighted average of 92.3%, a difference of 1.5%.
Norwegian vs Chickasaw 1 or more Vehicles in Household

1 or more Vehicles in Household Correlation Summary

MeasurementNorwegianChickasaw
Minimum88.8%84.1%
Maximum100.0%100.0%
Range11.2%15.9%
Mean95.9%94.5%
Median95.5%94.7%
Interquartile 25% (IQ1)94.4%93.2%
Interquartile 75% (IQ3)97.6%96.8%
Interquartile Range (IQR)3.2%3.6%
Standard Deviation (Sample)2.4%3.4%
Standard Deviation (Population)2.4%3.4%

Similar Demographics by 1 or more Vehicles in Household

Demographics Similar to Norwegians by 1 or more Vehicles in Household

In terms of 1 or more vehicles in household, the demographic groups most similar to Norwegians are German (93.6%, a difference of 0.050%), English (93.8%, a difference of 0.13%), Yakama (93.6%, a difference of 0.14%), Danish (93.5%, a difference of 0.16%), and Scottish (93.4%, a difference of 0.35%).
DemographicsRating | Rank1 or more Vehicles in Household
Luxembourgers
100.0
/100
|
#1
Exceptional
94.8%
English
100.0
/100
|
#2
Exceptional
93.8%
Norwegians
100.0
/100
|
#3
Exceptional
93.7%
Germans
100.0
/100
|
#4
Exceptional
93.6%
Yakama
100.0
/100
|
#5
Exceptional
93.6%
Danes
100.0
/100
|
#6
Exceptional
93.5%
Scottish
100.0
/100
|
#7
Exceptional
93.4%
Swedes
100.0
/100
|
#8
Exceptional
93.3%
Scotch-Irish
100.0
/100
|
#9
Exceptional
93.3%
Dutch
100.0
/100
|
#10
Exceptional
93.3%
Czechs
100.0
/100
|
#11
Exceptional
93.3%
Scandinavians
100.0
/100
|
#12
Exceptional
93.1%
Whites/Caucasians
100.0
/100
|
#13
Exceptional
93.1%
Irish
100.0
/100
|
#14
Exceptional
93.1%
Mexicans
100.0
/100
|
#15
Exceptional
93.0%

Demographics Similar to Chickasaw by 1 or more Vehicles in Household

In terms of 1 or more vehicles in household, the demographic groups most similar to Chickasaw are Spanish (92.3%, a difference of 0.0%), Immigrants from Taiwan (92.3%, a difference of 0.010%), Choctaw (92.2%, a difference of 0.020%), Swiss (92.3%, a difference of 0.030%), and Creek (92.3%, a difference of 0.030%).
DemographicsRating | Rank1 or more Vehicles in Household
Czechoslovakians
99.9
/100
|
#35
Exceptional
92.3%
Malaysians
99.9
/100
|
#36
Exceptional
92.3%
French Canadians
99.9
/100
|
#37
Exceptional
92.3%
Immigrants | Vietnam
99.9
/100
|
#38
Exceptional
92.3%
Swiss
99.9
/100
|
#39
Exceptional
92.3%
Creek
99.9
/100
|
#40
Exceptional
92.3%
Immigrants | Taiwan
99.9
/100
|
#41
Exceptional
92.3%
Chickasaw
99.9
/100
|
#42
Exceptional
92.3%
Spanish
99.9
/100
|
#43
Exceptional
92.3%
Choctaw
99.9
/100
|
#44
Exceptional
92.2%
Immigrants | Nonimmigrants
99.9
/100
|
#45
Exceptional
92.2%
Immigrants | Fiji
99.9
/100
|
#46
Exceptional
92.2%
Northern Europeans
99.9
/100
|
#47
Exceptional
92.2%
Belgians
99.9
/100
|
#48
Exceptional
92.1%
Afghans
99.9
/100
|
#49
Exceptional
92.1%