Israeli vs Immigrants from Cambodia 4 or more Vehicles in Household

COMPARE

Israeli
Race
Ancestry
AfghanAfricanAlaska NativeAlaskan AthabascanAlbanianAleutAlsatianAmericanApacheArabArapahoArgentineanArmenianAssyrian/Chaldean/SyriacAustralianAustrianBahamianBangladeshiBarbadianBasqueBelgianBelizeanBermudanBhutaneseBlackfeetBolivianBrazilianBritishBritish West IndianBulgarianBurmeseCajunCambodianCanadianCape VerdeanCarpatho RusynCelticCentral AmericanCentral American IndianCherokeeCheyenneChickasawChileanChineseChippewaChoctawColombianColvilleComancheCosta RicanCreeCreekCroatianCrowCubanCypriotCzechCzechoslovakianDanishDelawareDominicanDutchDutch West IndianEastern EuropeanEcuadorianEgyptianEnglishEstonianEthiopianEuropeanFijianFilipinoFinnishFrenchFrench American IndianFrench CanadianGermanGerman RussianGhanaianGreekGuamanian/ChamorroGuatemalanGuyaneseHaitianHmongHonduranHopiHoumaHungarianIcelanderIndian (Asian)IndonesianInupiatIranianIraqiIrishIroquoisIsraeliItalianJamaicanJapaneseJordanianKenyanKiowaKoreanLaotianLatvianLebaneseLiberianLithuanianLumbeeLuxembourgerMacedonianMalaysianMalteseMarshalleseMenomineeMexicanMexican American IndianMongolianMoroccanNative HawaiianNavajoNepaleseNew ZealanderNicaraguanNigerianNorthern EuropeanNorwegianOkinawanOsageOttawaPaiutePakistaniPalestinianPanamanianParaguayanPennsylvania GermanPeruvianPimaPolishPortuguesePotawatomiPuebloPuerto RicanPuget Sound SalishRomanianRussianSalvadoranSamoanScandinavianScotch-IrishScottishSeminoleSenegaleseSerbianShoshoneSierra LeoneanSiouxSlavicSlovakSloveneSomaliSouth AfricanSouth AmericanSouth American IndianSoviet UnionSpaniardSpanishSpanish AmericanSpanish American IndianSri LankanSubsaharan AfricanSudaneseSwedishSwissSyrianTaiwaneseThaiTlingit-HaidaTohono O'OdhamTonganTrinidadian and TobagonianTsimshianTurkishU.S. Virgin IslanderUgandanUkrainianUruguayanUteVenezuelanVietnameseWelshWest IndianYakamaYaquiYugoslavianYumanYup'ikZimbabwean
Immigration
NonimmigrantsImmigrantsAfghanistanAfricaAlbaniaArgentinaArmeniaAsiaAustraliaAustriaBahamasBangladeshBarbadosBelarusBelgiumBelizeBoliviaBosnia and HerzegovinaBrazilBulgariaBurma/MyanmarCabo VerdeCameroonCanadaCaribbeanCentral AmericaChileChinaColombiaCongoCosta RicaCroatiaCubaCzechoslovakiaDenmarkDominicaDominican RepublicEastern AfricaEastern AsiaEastern EuropeEcuadorEgyptEl SalvadorEnglandEritreaEthiopiaEuropeFijiFranceGermanyGhanaGreeceGrenadaGuatemalaGuyanaHaitiHondurasHong KongHungaryIndiaIndonesiaIranIraqIrelandIsraelItalyJamaicaJapanJordanKazakhstanKenyaKoreaKuwaitLaosLatin AmericaLatviaLebanonLiberiaLithuaniaMalaysiaMexicoMicronesiaMiddle AfricaMoldovaMoroccoNepalNetherlandsNicaraguaNigeriaNorth AmericaNorth MacedoniaNorthern AfricaNorthern EuropeNorwayOceaniaPakistanPanamaPeruPhilippinesPolandPortugalRomaniaRussiaSaudi ArabiaScotlandSenegalSerbiaSierra LeoneSingaporeSomaliaSouth AfricaSouth AmericaSouth Central AsiaSouth Eastern AsiaSouthern EuropeSpainSri LankaSt. Vincent and the GrenadinesSudanSwedenSwitzerlandSyriaTaiwanThailandTrinidad and TobagoTurkeyUgandaUkraineUruguayUzbekistanVenezuelaVietnamWest IndiesWestern AfricaWestern AsiaWestern EuropeYemenZaireZimbabweAzores
Immigrants from Cambodia
Race
Ancestry
AfghanAfricanAlaska NativeAlaskan AthabascanAlbanianAleutAlsatianAmericanApacheArabArapahoArgentineanArmenianAssyrian/Chaldean/SyriacAustralianAustrianBahamianBangladeshiBarbadianBasqueBelgianBelizeanBermudanBhutaneseBlackfeetBolivianBrazilianBritishBritish West IndianBulgarianBurmeseCajunCambodianCanadianCape VerdeanCarpatho RusynCelticCentral AmericanCentral American IndianCherokeeCheyenneChickasawChileanChineseChippewaChoctawColombianColvilleComancheCosta RicanCreeCreekCroatianCrowCubanCypriotCzechCzechoslovakianDanishDelawareDominicanDutchDutch West IndianEastern EuropeanEcuadorianEgyptianEnglishEstonianEthiopianEuropeanFijianFilipinoFinnishFrenchFrench American IndianFrench CanadianGermanGerman RussianGhanaianGreekGuamanian/ChamorroGuatemalanGuyaneseHaitianHmongHonduranHopiHoumaHungarianIcelanderIndian (Asian)IndonesianInupiatIranianIraqiIrishIroquoisItalianJamaicanJapaneseJordanianKenyanKiowaKoreanLaotianLatvianLebaneseLiberianLithuanianLumbeeLuxembourgerMacedonianMalaysianMalteseMarshalleseMenomineeMexicanMexican American IndianMongolianMoroccanNative HawaiianNavajoNepaleseNew ZealanderNicaraguanNigerianNorthern EuropeanNorwegianOkinawanOsageOttawaPaiutePakistaniPalestinianPanamanianParaguayanPennsylvania GermanPeruvianPimaPolishPortuguesePotawatomiPuebloPuerto RicanPuget Sound SalishRomanianRussianSalvadoranSamoanScandinavianScotch-IrishScottishSeminoleSenegaleseSerbianShoshoneSierra LeoneanSiouxSlavicSlovakSloveneSomaliSouth AfricanSouth AmericanSouth American IndianSoviet UnionSpaniardSpanishSpanish AmericanSpanish American IndianSri LankanSubsaharan AfricanSudaneseSwedishSwissSyrianTaiwaneseThaiTlingit-HaidaTohono O'OdhamTonganTrinidadian and TobagonianTsimshianTurkishU.S. Virgin IslanderUgandanUkrainianUruguayanUteVenezuelanVietnameseWelshWest IndianYakamaYaquiYugoslavianYumanYup'ikZimbabwean
Immigration
NonimmigrantsImmigrantsAfghanistanAfricaAlbaniaArgentinaArmeniaAsiaAustraliaAustriaBahamasBangladeshBarbadosBelarusBelgiumBelizeBoliviaBosnia and HerzegovinaBrazilBulgariaBurma/MyanmarCabo VerdeCambodiaCameroonCanadaCaribbeanCentral AmericaChileChinaColombiaCongoCosta RicaCroatiaCubaCzechoslovakiaDenmarkDominicaDominican RepublicEastern AfricaEastern AsiaEastern EuropeEcuadorEgyptEl SalvadorEnglandEritreaEthiopiaEuropeFijiFranceGermanyGhanaGreeceGrenadaGuatemalaGuyanaHaitiHondurasHong KongHungaryIndiaIndonesiaIranIraqIrelandIsraelItalyJamaicaJapanJordanKazakhstanKenyaKoreaKuwaitLaosLatin AmericaLatviaLebanonLiberiaLithuaniaMalaysiaMexicoMicronesiaMiddle AfricaMoldovaMoroccoNepalNetherlandsNicaraguaNigeriaNorth AmericaNorth MacedoniaNorthern AfricaNorthern EuropeNorwayOceaniaPakistanPanamaPeruPhilippinesPolandPortugalRomaniaRussiaSaudi ArabiaScotlandSenegalSerbiaSierra LeoneSingaporeSomaliaSouth AfricaSouth AmericaSouth Central AsiaSouth Eastern AsiaSouthern EuropeSpainSri LankaSt. Vincent and the GrenadinesSudanSwedenSwitzerlandSyriaTaiwanThailandTrinidad and TobagoTurkeyUgandaUkraineUruguayUzbekistanVenezuelaVietnamWest IndiesWestern AfricaWestern AsiaWestern EuropeYemenZaireZimbabweAzores
4 or more Vehicles in Household
Income
Poverty
Unemployment
Labor Participation
Family Structure
Vehicle Availability
Education Level
Disability

4 or more Vehicles in Household Comparison

Israelis

Immigrants from Cambodia

Tragic
Exceptional
5.2%
4 OR MORE VEHICLES IN HOUSEHOLD
0.1/ 100
METRIC RATING
296th/ 347
METRIC RANK
7.4%
4 OR MORE VEHICLES IN HOUSEHOLD
99.9/ 100
METRIC RATING
75th/ 347
METRIC RANK

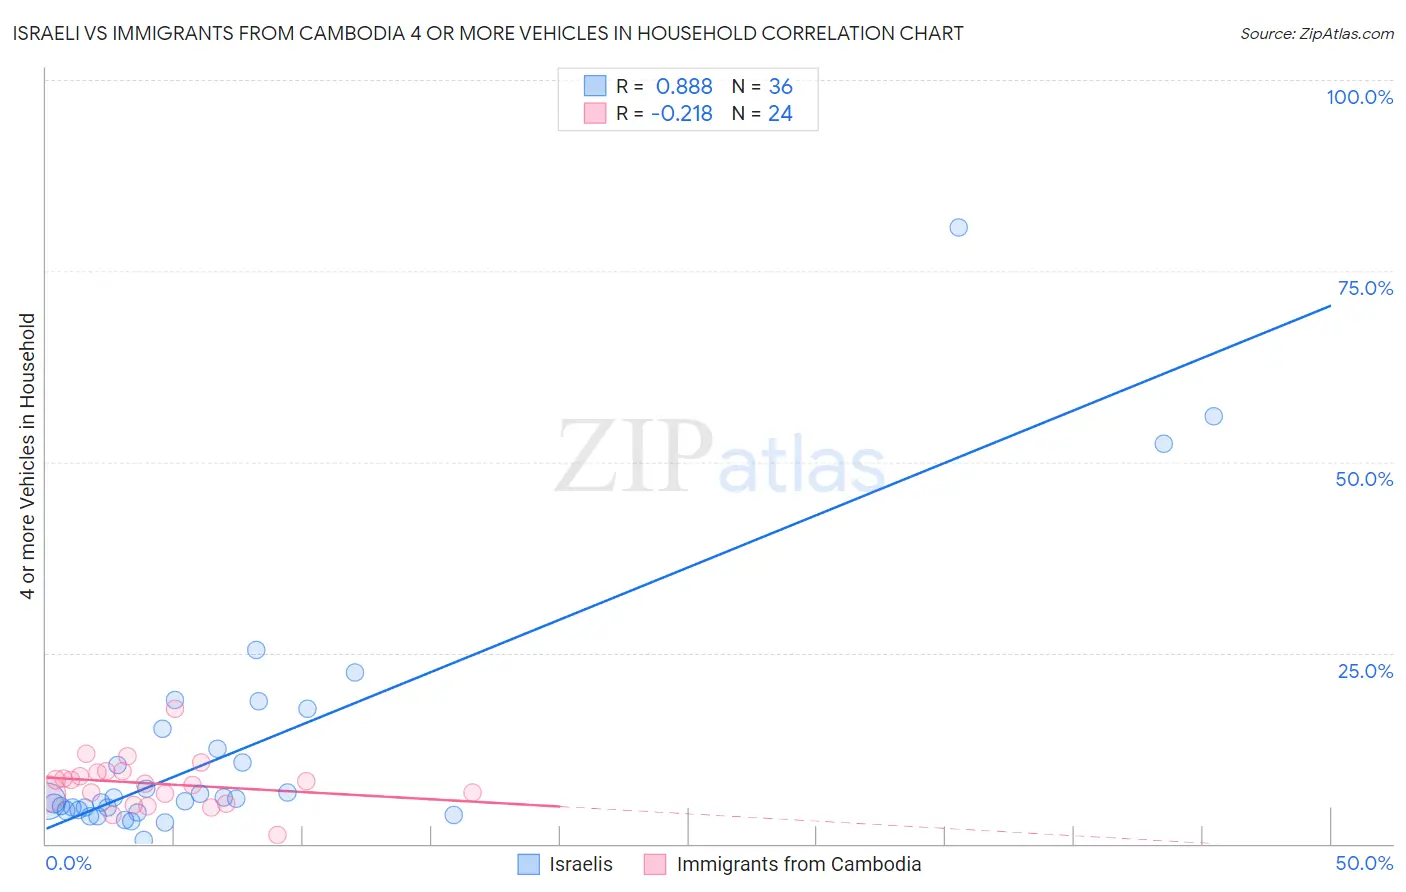
Israeli vs Immigrants from Cambodia 4 or more Vehicles in Household Correlation Chart

The statistical analysis conducted on geographies consisting of 209,765,898 people shows a very strong positive correlation between the proportion of Israelis and percentage of households with 4 or more vehicles available in the United States with a correlation coefficient (R) of 0.888 and weighted average of 5.2%. Similarly, the statistical analysis conducted on geographies consisting of 205,078,675 people shows a weak negative correlation between the proportion of Immigrants from Cambodia and percentage of households with 4 or more vehicles available in the United States with a correlation coefficient (R) of -0.218 and weighted average of 7.4%, a difference of 41.2%.
Israeli vs Immigrants from Cambodia 4 or more Vehicles in Household

4 or more Vehicles in Household Correlation Summary

MeasurementIsraeliImmigrants from Cambodia
Minimum0.51%1.1%
Maximum80.8%17.7%
Range80.3%16.6%
Mean12.6%7.9%
Median5.7%8.0%
Interquartile 25% (IQ1)4.4%5.9%
Interquartile 75% (IQ3)13.7%9.4%
Interquartile Range (IQR)9.3%3.6%
Standard Deviation (Sample)16.9%3.3%
Standard Deviation (Population)16.7%3.2%

Similar Demographics by 4 or more Vehicles in Household

Demographics Similar to Israelis by 4 or more Vehicles in Household

In terms of 4 or more vehicles in household, the demographic groups most similar to Israelis are Immigrants from Brazil (5.2%, a difference of 0.18%), Ghanaian (5.2%, a difference of 0.29%), Immigrants from Venezuela (5.2%, a difference of 0.29%), Immigrants from Congo (5.2%, a difference of 0.35%), and Liberian (5.3%, a difference of 0.38%).
DemographicsRating | Rank4 or more Vehicles in Household
Immigrants | Bosnia and Herzegovina
0.2
/100
|
#289
Tragic
5.3%
Immigrants | Russia
0.2
/100
|
#290
Tragic
5.3%
Immigrants | Bahamas
0.1
/100
|
#291
Tragic
5.3%
Liberians
0.1
/100
|
#292
Tragic
5.3%
Immigrants | Congo
0.1
/100
|
#293
Tragic
5.2%
Ghanaians
0.1
/100
|
#294
Tragic
5.2%
Immigrants | Brazil
0.1
/100
|
#295
Tragic
5.2%
Israelis
0.1
/100
|
#296
Tragic
5.2%
Immigrants | Venezuela
0.1
/100
|
#297
Tragic
5.2%
Immigrants | South America
0.1
/100
|
#298
Tragic
5.2%
Immigrants | Ghana
0.1
/100
|
#299
Tragic
5.2%
Immigrants | Morocco
0.0
/100
|
#300
Tragic
5.1%
Immigrants | Zaire
0.0
/100
|
#301
Tragic
5.1%
Bahamians
0.0
/100
|
#302
Tragic
5.1%
Immigrants | Greece
0.0
/100
|
#303
Tragic
5.1%

Demographics Similar to Immigrants from Cambodia by 4 or more Vehicles in Household

In terms of 4 or more vehicles in household, the demographic groups most similar to Immigrants from Cambodia are Icelander (7.4%, a difference of 0.0%), Laotian (7.4%, a difference of 0.050%), Apache (7.4%, a difference of 0.22%), White/Caucasian (7.4%, a difference of 0.28%), and Portuguese (7.4%, a difference of 0.31%).
DemographicsRating | Rank4 or more Vehicles in Household
Welsh
99.9
/100
|
#68
Exceptional
7.5%
Germans
99.9
/100
|
#69
Exceptional
7.5%
Scottish
99.9
/100
|
#70
Exceptional
7.4%
Chickasaw
99.9
/100
|
#71
Exceptional
7.4%
Scotch-Irish
99.9
/100
|
#72
Exceptional
7.4%
Portuguese
99.9
/100
|
#73
Exceptional
7.4%
Icelanders
99.9
/100
|
#74
Exceptional
7.4%
Immigrants | Cambodia
99.9
/100
|
#75
Exceptional
7.4%
Laotians
99.9
/100
|
#76
Exceptional
7.4%
Apache
99.9
/100
|
#77
Exceptional
7.4%
Whites/Caucasians
99.8
/100
|
#78
Exceptional
7.4%
Czechs
99.8
/100
|
#79
Exceptional
7.4%
Alaska Natives
99.8
/100
|
#80
Exceptional
7.3%
Finns
99.8
/100
|
#81
Exceptional
7.3%
Northern Europeans
99.8
/100
|
#82
Exceptional
7.3%