Indian (Asian) vs Immigrants from Bosnia and Herzegovina 2 or more Vehicles in Household
COMPARE
Indian (Asian)
Immigrants from Bosnia and Herzegovina
2 or more Vehicles in Household
2 or more Vehicles in Household Comparison
Indians (Asian)
Immigrants from Bosnia and Herzegovina
53.1%
2 OR MORE VEHICLES IN HOUSEHOLD
1.7/ 100
METRIC RATING
244th/ 347
METRIC RANK
53.8%
2 OR MORE VEHICLES IN HOUSEHOLD
5.5/ 100
METRIC RATING
223rd/ 347
METRIC RANK
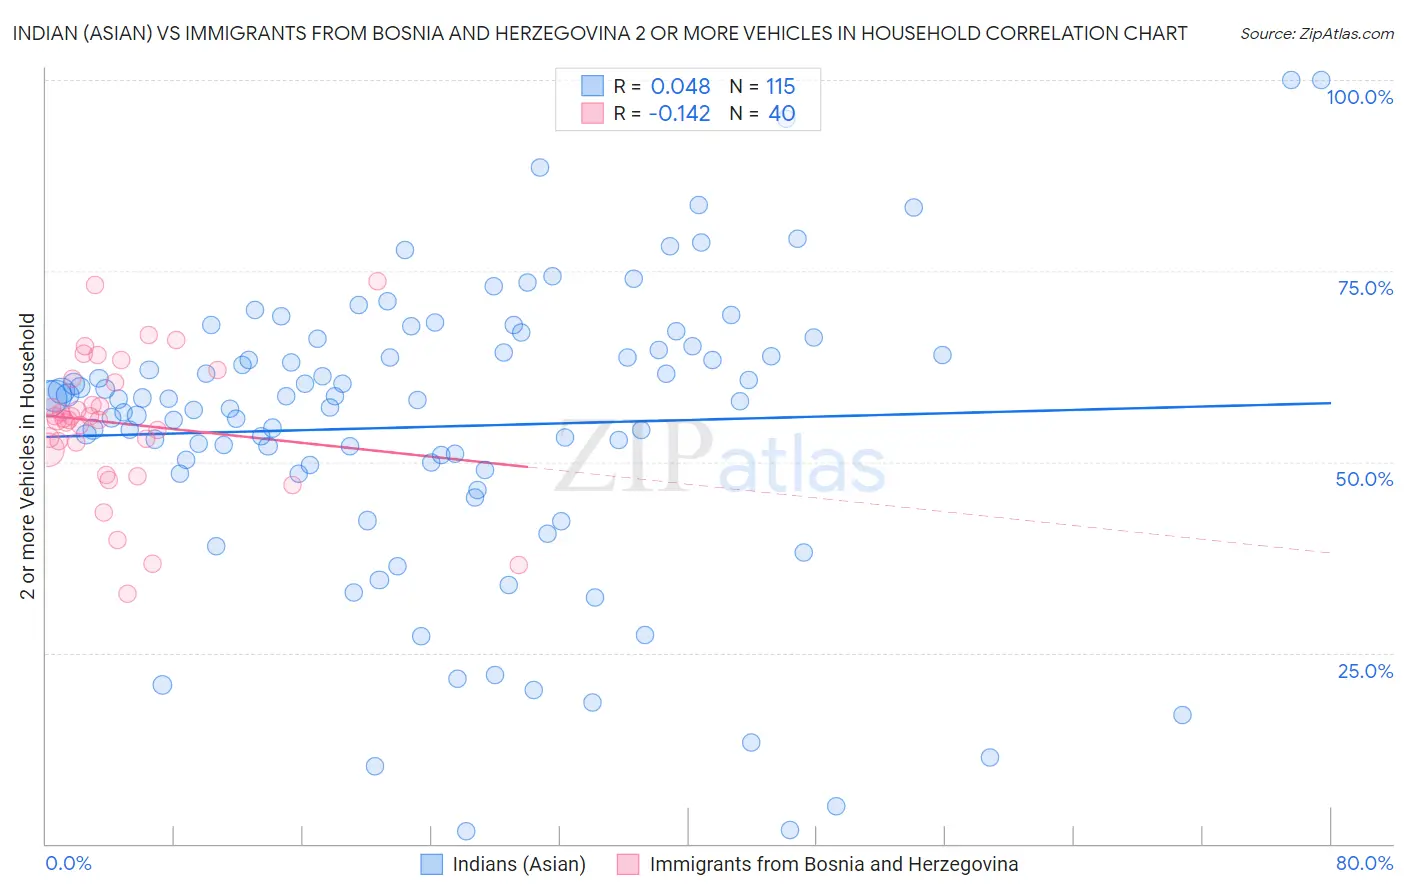
Indian (Asian) vs Immigrants from Bosnia and Herzegovina 2 or more Vehicles in Household Correlation Chart
The statistical analysis conducted on geographies consisting of 494,844,203 people shows no correlation between the proportion of Indians (Asian) and percentage of households with 2 or more vehicles available in the United States with a correlation coefficient (R) of 0.048 and weighted average of 53.1%. Similarly, the statistical analysis conducted on geographies consisting of 156,805,510 people shows a poor negative correlation between the proportion of Immigrants from Bosnia and Herzegovina and percentage of households with 2 or more vehicles available in the United States with a correlation coefficient (R) of -0.142 and weighted average of 53.8%, a difference of 1.3%.
2 or more Vehicles in Household Correlation Summary
| Measurement | Indian (Asian) | Immigrants from Bosnia and Herzegovina |
| Minimum | 1.7% | 32.7% |
| Maximum | 100.0% | 73.7% |
| Range | 98.3% | 41.0% |
| Mean | 54.6% | 55.0% |
| Median | 58.2% | 55.6% |
| Interquartile 25% (IQ1) | 49.0% | 52.1% |
| Interquartile 75% (IQ3) | 64.6% | 60.6% |
| Interquartile Range (IQR) | 15.6% | 8.5% |
| Standard Deviation (Sample) | 19.2% | 9.0% |
| Standard Deviation (Population) | 19.2% | 8.9% |
Similar Demographics by 2 or more Vehicles in Household
Demographics Similar to Indians (Asian) by 2 or more Vehicles in Household
In terms of 2 or more vehicles in household, the demographic groups most similar to Indians (Asian) are Ethiopian (53.1%, a difference of 0.040%), Immigrants from Ethiopia (53.0%, a difference of 0.12%), Immigrants from Eastern Asia (53.2%, a difference of 0.23%), Immigrants from Sierra Leone (53.2%, a difference of 0.24%), and Immigrants from Europe (53.2%, a difference of 0.26%).
| Demographics | Rating | Rank | 2 or more Vehicles in Household |
| Macedonians | 2.4 /100 | #237 | Tragic 53.3% |
| Immigrants | Armenia | 2.3 /100 | #238 | Tragic 53.3% |
| Cambodians | 2.3 /100 | #239 | Tragic 53.3% |
| Immigrants | Europe | 2.1 /100 | #240 | Tragic 53.2% |
| Immigrants | Sierra Leone | 2.1 /100 | #241 | Tragic 53.2% |
| Immigrants | Eastern Asia | 2.1 /100 | #242 | Tragic 53.2% |
| Ethiopians | 1.7 /100 | #243 | Tragic 53.1% |
| Indians (Asian) | 1.7 /100 | #244 | Tragic 53.1% |
| Immigrants | Ethiopia | 1.5 /100 | #245 | Tragic 53.0% |
| Immigrants | Nigeria | 1.2 /100 | #246 | Tragic 52.9% |
| Sierra Leoneans | 1.2 /100 | #247 | Tragic 52.9% |
| Colombians | 1.1 /100 | #248 | Tragic 52.9% |
| Immigrants | Brazil | 1.0 /100 | #249 | Tragic 52.8% |
| Mongolians | 1.0 /100 | #250 | Tragic 52.8% |
| Immigrants | Sudan | 1.0 /100 | #251 | Tragic 52.8% |
Demographics Similar to Immigrants from Bosnia and Herzegovina by 2 or more Vehicles in Household
In terms of 2 or more vehicles in household, the demographic groups most similar to Immigrants from Bosnia and Herzegovina are Brazilian (53.8%, a difference of 0.040%), Immigrants from Egypt (53.8%, a difference of 0.050%), Immigrants from Eastern Africa (53.7%, a difference of 0.070%), Kiowa (53.9%, a difference of 0.13%), and Immigrants from Singapore (53.9%, a difference of 0.15%).
| Demographics | Rating | Rank | 2 or more Vehicles in Household |
| Immigrants | Western Asia | 9.3 /100 | #216 | Tragic 54.1% |
| Immigrants | Burma/Myanmar | 7.1 /100 | #217 | Tragic 53.9% |
| Immigrants | Argentina | 6.8 /100 | #218 | Tragic 53.9% |
| South American Indians | 6.5 /100 | #219 | Tragic 53.9% |
| Taiwanese | 6.3 /100 | #220 | Tragic 53.9% |
| Immigrants | Singapore | 6.3 /100 | #221 | Tragic 53.9% |
| Kiowa | 6.2 /100 | #222 | Tragic 53.9% |
| Immigrants | Bosnia and Herzegovina | 5.5 /100 | #223 | Tragic 53.8% |
| Brazilians | 5.3 /100 | #224 | Tragic 53.8% |
| Immigrants | Egypt | 5.2 /100 | #225 | Tragic 53.8% |
| Immigrants | Eastern Africa | 5.1 /100 | #226 | Tragic 53.7% |
| Sudanese | 4.1 /100 | #227 | Tragic 53.6% |
| Alaska Natives | 3.9 /100 | #228 | Tragic 53.6% |
| Immigrants | Turkey | 3.8 /100 | #229 | Tragic 53.6% |
| Immigrants | Nepal | 3.6 /100 | #230 | Tragic 53.5% |