Indian (Asian) vs Immigrants from Bosnia and Herzegovina No Schooling Completed
COMPARE
Indian (Asian)
Immigrants from Bosnia and Herzegovina
No Schooling Completed
No Schooling Completed Comparison
Indians (Asian)
Immigrants from Bosnia and Herzegovina
2.5%
NO SCHOOLING COMPLETED
0.4/ 100
METRIC RATING
264th/ 347
METRIC RANK
2.1%
NO SCHOOLING COMPLETED
38.6/ 100
METRIC RATING
186th/ 347
METRIC RANK
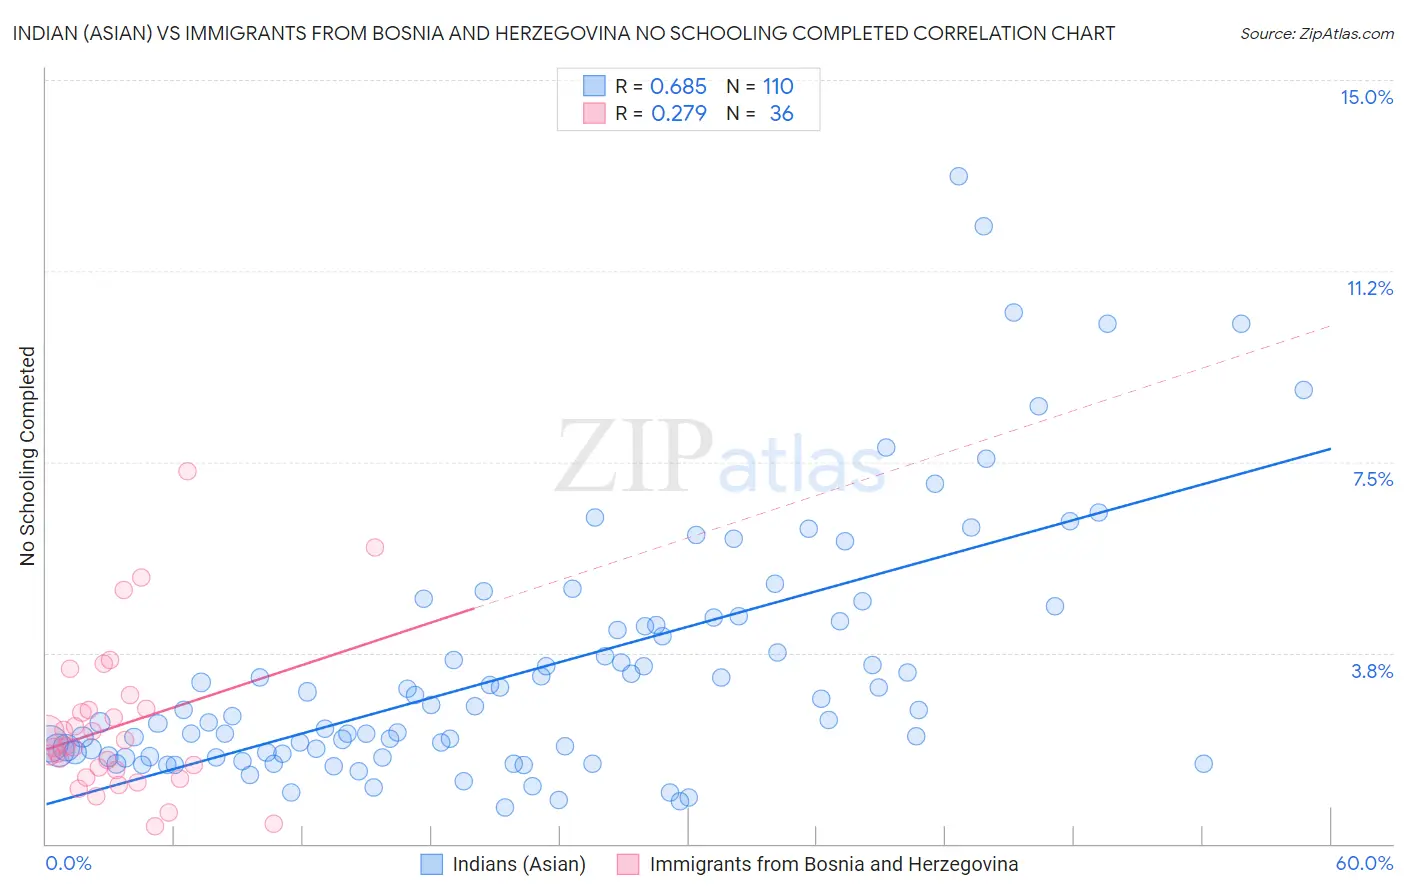
Indian (Asian) vs Immigrants from Bosnia and Herzegovina No Schooling Completed Correlation Chart
The statistical analysis conducted on geographies consisting of 487,020,053 people shows a significant positive correlation between the proportion of Indians (Asian) and percentage of population with no schooling in the United States with a correlation coefficient (R) of 0.685 and weighted average of 2.5%. Similarly, the statistical analysis conducted on geographies consisting of 156,377,328 people shows a weak positive correlation between the proportion of Immigrants from Bosnia and Herzegovina and percentage of population with no schooling in the United States with a correlation coefficient (R) of 0.279 and weighted average of 2.1%, a difference of 16.5%.
No Schooling Completed Correlation Summary
| Measurement | Indian (Asian) | Immigrants from Bosnia and Herzegovina |
| Minimum | 0.70% | 0.34% |
| Maximum | 13.1% | 7.3% |
| Range | 12.4% | 7.0% |
| Mean | 3.4% | 2.3% |
| Median | 2.6% | 1.9% |
| Interquartile 25% (IQ1) | 1.8% | 1.4% |
| Interquartile 75% (IQ3) | 4.3% | 2.6% |
| Interquartile Range (IQR) | 2.5% | 1.3% |
| Standard Deviation (Sample) | 2.5% | 1.5% |
| Standard Deviation (Population) | 2.5% | 1.5% |
Similar Demographics by No Schooling Completed
Demographics Similar to Indians (Asian) by No Schooling Completed
In terms of no schooling completed, the demographic groups most similar to Indians (Asian) are Immigrants from Liberia (2.5%, a difference of 0.13%), West Indian (2.5%, a difference of 0.18%), Fijian (2.5%, a difference of 0.26%), Immigrants from Sierra Leone (2.5%, a difference of 0.30%), and Yuman (2.5%, a difference of 0.43%).
| Demographics | Rating | Rank | No Schooling Completed |
| Immigrants | South America | 0.6 /100 | #257 | Tragic 2.5% |
| Assyrians/Chaldeans/Syriacs | 0.6 /100 | #258 | Tragic 2.5% |
| Immigrants | Jamaica | 0.6 /100 | #259 | Tragic 2.5% |
| Immigrants | Ethiopia | 0.6 /100 | #260 | Tragic 2.5% |
| Armenians | 0.5 /100 | #261 | Tragic 2.5% |
| Immigrants | Sierra Leone | 0.5 /100 | #262 | Tragic 2.5% |
| Immigrants | Liberia | 0.4 /100 | #263 | Tragic 2.5% |
| Indians (Asian) | 0.4 /100 | #264 | Tragic 2.5% |
| West Indians | 0.4 /100 | #265 | Tragic 2.5% |
| Fijians | 0.4 /100 | #266 | Tragic 2.5% |
| Yuman | 0.4 /100 | #267 | Tragic 2.5% |
| Taiwanese | 0.3 /100 | #268 | Tragic 2.5% |
| Immigrants | Nigeria | 0.2 /100 | #269 | Tragic 2.5% |
| Immigrants | Peru | 0.2 /100 | #270 | Tragic 2.5% |
| Cubans | 0.2 /100 | #271 | Tragic 2.5% |
Demographics Similar to Immigrants from Bosnia and Herzegovina by No Schooling Completed
In terms of no schooling completed, the demographic groups most similar to Immigrants from Bosnia and Herzegovina are Mongolian (2.1%, a difference of 0.30%), Navajo (2.1%, a difference of 0.30%), Immigrants from Kenya (2.1%, a difference of 0.35%), Immigrants from Egypt (2.1%, a difference of 0.36%), and Pima (2.1%, a difference of 0.37%).
| Demographics | Rating | Rank | No Schooling Completed |
| Immigrants | Kazakhstan | 44.3 /100 | #179 | Average 2.1% |
| Portuguese | 43.9 /100 | #180 | Average 2.1% |
| Immigrants | Taiwan | 42.6 /100 | #181 | Average 2.1% |
| French American Indians | 42.2 /100 | #182 | Average 2.1% |
| Blacks/African Americans | 41.4 /100 | #183 | Average 2.1% |
| Pima | 41.3 /100 | #184 | Average 2.1% |
| Mongolians | 40.8 /100 | #185 | Average 2.1% |
| Immigrants | Bosnia and Herzegovina | 38.6 /100 | #186 | Fair 2.1% |
| Navajo | 36.5 /100 | #187 | Fair 2.1% |
| Immigrants | Kenya | 36.2 /100 | #188 | Fair 2.1% |
| Immigrants | Egypt | 36.1 /100 | #189 | Fair 2.1% |
| Spanish Americans | 32.6 /100 | #190 | Fair 2.1% |
| Bermudans | 30.7 /100 | #191 | Fair 2.1% |
| Guamanians/Chamorros | 29.8 /100 | #192 | Fair 2.2% |
| Paraguayans | 29.3 /100 | #193 | Fair 2.2% |