Immigrants from Panama vs Sudanese 3 or more Vehicles in Household
COMPARE
Immigrants from Panama
Sudanese
3 or more Vehicles in Household
3 or more Vehicles in Household Comparison
Immigrants from Panama
Sudanese
17.7%
3 OR MORE VEHICLES IN HOUSEHOLD
0.8/ 100
METRIC RATING
265th/ 347
METRIC RANK
17.8%
3 OR MORE VEHICLES IN HOUSEHOLD
1.1/ 100
METRIC RATING
258th/ 347
METRIC RANK
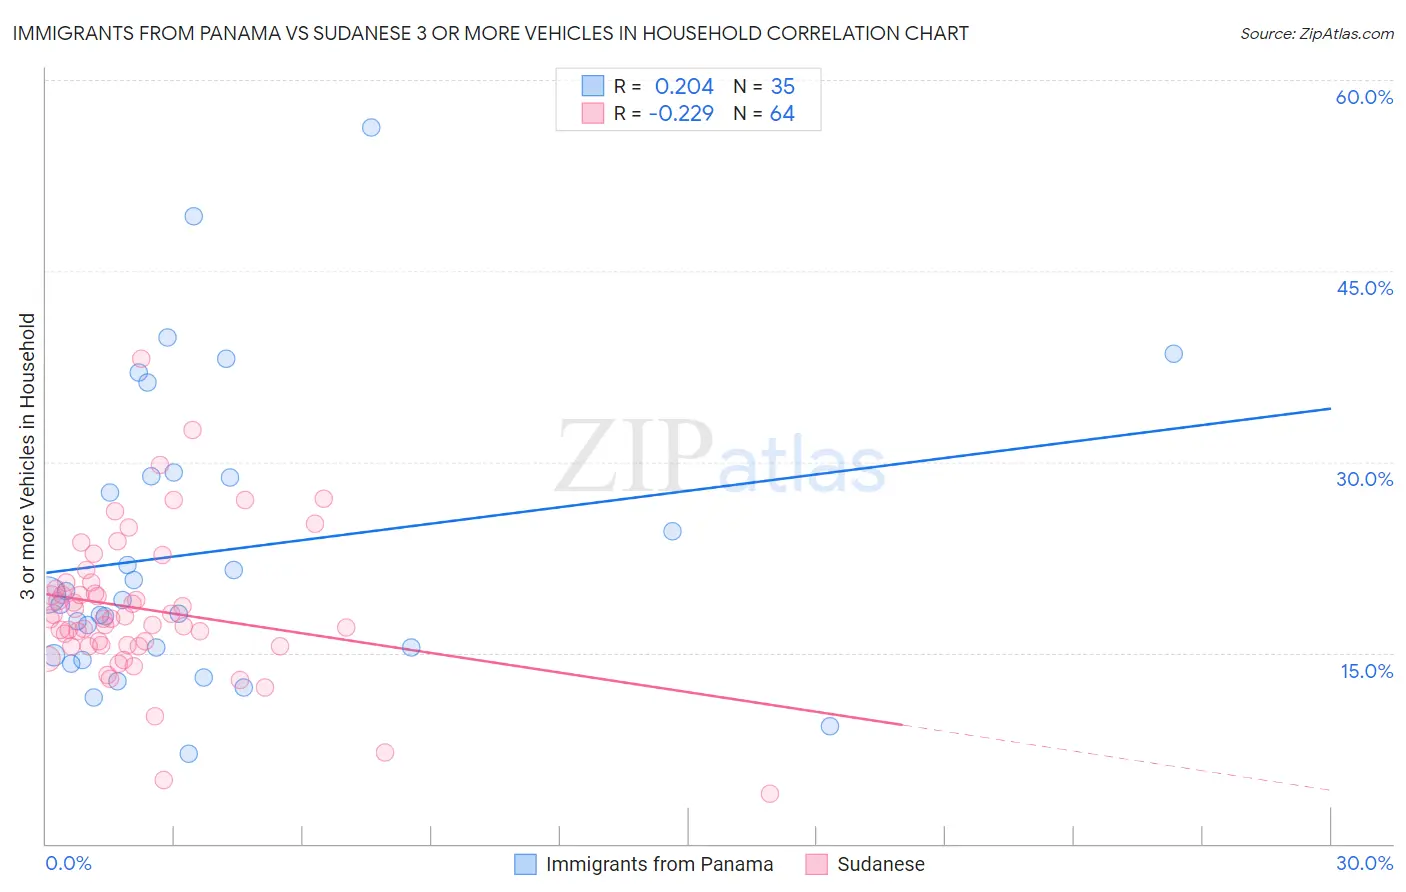
Immigrants from Panama vs Sudanese 3 or more Vehicles in Household Correlation Chart
The statistical analysis conducted on geographies consisting of 221,149,487 people shows a weak positive correlation between the proportion of Immigrants from Panama and percentage of households with 3 or more vehicles available in the United States with a correlation coefficient (R) of 0.204 and weighted average of 17.7%. Similarly, the statistical analysis conducted on geographies consisting of 110,082,640 people shows a weak negative correlation between the proportion of Sudanese and percentage of households with 3 or more vehicles available in the United States with a correlation coefficient (R) of -0.229 and weighted average of 17.8%, a difference of 0.68%.
3 or more Vehicles in Household Correlation Summary
| Measurement | Immigrants from Panama | Sudanese |
| Minimum | 7.1% | 3.9% |
| Maximum | 56.2% | 38.1% |
| Range | 49.1% | 34.2% |
| Mean | 23.0% | 18.4% |
| Median | 19.1% | 17.7% |
| Interquartile 25% (IQ1) | 14.8% | 15.6% |
| Interquartile 75% (IQ3) | 28.9% | 20.3% |
| Interquartile Range (IQR) | 14.1% | 4.7% |
| Standard Deviation (Sample) | 11.5% | 5.7% |
| Standard Deviation (Population) | 11.3% | 5.7% |
Demographics Similar to Immigrants from Panama and Sudanese by 3 or more Vehicles in Household
In terms of 3 or more vehicles in household, the demographic groups most similar to Immigrants from Panama are Macedonian (17.7%, a difference of 0.020%), Immigrants from Venezuela (17.7%, a difference of 0.080%), Immigrants from Bulgaria (17.7%, a difference of 0.090%), Cambodian (17.8%, a difference of 0.14%), and Bermudan (17.8%, a difference of 0.16%). Similarly, the demographic groups most similar to Sudanese are Immigrants from Eritrea (17.8%, a difference of 0.0%), Subsaharan African (17.9%, a difference of 0.050%), Immigrants from Turkey (17.9%, a difference of 0.20%), Uruguayan (17.8%, a difference of 0.22%), and Immigrants from Ethiopia (17.9%, a difference of 0.23%).
| Demographics | Rating | Rank | 3 or more Vehicles in Household |
| Alsatians | 1.5 /100 | #251 | Tragic 18.0% |
| Immigrants | Southern Europe | 1.4 /100 | #252 | Tragic 17.9% |
| Immigrants | Ethiopia | 1.3 /100 | #253 | Tragic 17.9% |
| Ethiopians | 1.2 /100 | #254 | Tragic 17.9% |
| Immigrants | Turkey | 1.2 /100 | #255 | Tragic 17.9% |
| Sub-Saharan Africans | 1.1 /100 | #256 | Tragic 17.9% |
| Immigrants | Eritrea | 1.1 /100 | #257 | Tragic 17.8% |
| Sudanese | 1.1 /100 | #258 | Tragic 17.8% |
| Uruguayans | 1.0 /100 | #259 | Tragic 17.8% |
| Ugandans | 0.9 /100 | #260 | Tragic 17.8% |
| Immigrants | Northern Africa | 0.9 /100 | #261 | Tragic 17.8% |
| Colombians | 0.9 /100 | #262 | Tragic 17.8% |
| Bermudans | 0.9 /100 | #263 | Tragic 17.8% |
| Cambodians | 0.9 /100 | #264 | Tragic 17.8% |
| Immigrants | Panama | 0.8 /100 | #265 | Tragic 17.7% |
| Macedonians | 0.8 /100 | #266 | Tragic 17.7% |
| Immigrants | Venezuela | 0.8 /100 | #267 | Tragic 17.7% |
| Immigrants | Bulgaria | 0.8 /100 | #268 | Tragic 17.7% |
| Immigrants | France | 0.6 /100 | #269 | Tragic 17.6% |
| Immigrants | Nepal | 0.6 /100 | #270 | Tragic 17.6% |
| South Americans | 0.6 /100 | #271 | Tragic 17.6% |