Immigrants from Dominican Republic vs Immigrants from Oceania 1 or more Vehicles in Household

COMPARE

Immigrants from Dominican Republic
Race
Ancestry
AfghanAfricanAlaska NativeAlaskan AthabascanAlbanianAleutAlsatianAmericanApacheArabArapahoArgentineanArmenianAssyrian/Chaldean/SyriacAustralianAustrianBahamianBangladeshiBarbadianBasqueBelgianBelizeanBermudanBhutaneseBlackfeetBolivianBrazilianBritishBritish West IndianBulgarianBurmeseCajunCambodianCanadianCape VerdeanCarpatho RusynCelticCentral AmericanCentral American IndianCherokeeCheyenneChickasawChileanChineseChippewaChoctawColombianColvilleComancheCosta RicanCreeCreekCroatianCrowCubanCypriotCzechCzechoslovakianDanishDelawareDominicanDutchDutch West IndianEastern EuropeanEcuadorianEgyptianEnglishEstonianEthiopianEuropeanFijianFilipinoFinnishFrenchFrench American IndianFrench CanadianGermanGerman RussianGhanaianGreekGuamanian/ChamorroGuatemalanGuyaneseHaitianHmongHonduranHopiHoumaHungarianIcelanderIndian (Asian)IndonesianInupiatIranianIraqiIrishIroquoisIsraeliItalianJamaicanJapaneseJordanianKenyanKiowaKoreanLaotianLatvianLebaneseLiberianLithuanianLumbeeLuxembourgerMacedonianMalaysianMalteseMarshalleseMenomineeMexicanMexican American IndianMongolianMoroccanNative HawaiianNavajoNepaleseNew ZealanderNicaraguanNigerianNorthern EuropeanNorwegianOkinawanOsageOttawaPaiutePakistaniPalestinianPanamanianParaguayanPennsylvania GermanPeruvianPimaPolishPortuguesePotawatomiPuebloPuerto RicanPuget Sound SalishRomanianRussianSalvadoranSamoanScandinavianScotch-IrishScottishSeminoleSenegaleseSerbianShoshoneSierra LeoneanSiouxSlavicSlovakSloveneSomaliSouth AfricanSouth AmericanSouth American IndianSoviet UnionSpaniardSpanishSpanish AmericanSpanish American IndianSri LankanSubsaharan AfricanSudaneseSwedishSwissSyrianTaiwaneseThaiTlingit-HaidaTohono O'OdhamTonganTrinidadian and TobagonianTsimshianTurkishU.S. Virgin IslanderUgandanUkrainianUruguayanUteVenezuelanVietnameseWelshWest IndianYakamaYaquiYugoslavianYumanYup'ikZimbabwean
Immigration
NonimmigrantsImmigrantsAfghanistanAfricaAlbaniaArgentinaArmeniaAsiaAustraliaAustriaBahamasBangladeshBarbadosBelarusBelgiumBelizeBoliviaBosnia and HerzegovinaBrazilBulgariaBurma/MyanmarCabo VerdeCambodiaCameroonCanadaCaribbeanCentral AmericaChileChinaColombiaCongoCosta RicaCroatiaCubaCzechoslovakiaDenmarkDominicaDominican RepublicEastern AfricaEastern AsiaEastern EuropeEcuadorEgyptEl SalvadorEnglandEritreaEthiopiaEuropeFijiFranceGermanyGhanaGreeceGrenadaGuatemalaGuyanaHaitiHondurasHong KongHungaryIndiaIndonesiaIranIraqIrelandIsraelItalyJamaicaJapanJordanKazakhstanKenyaKoreaKuwaitLaosLatin AmericaLatviaLebanonLiberiaLithuaniaMalaysiaMexicoMicronesiaMiddle AfricaMoldovaMoroccoNepalNetherlandsNicaraguaNigeriaNorth AmericaNorth MacedoniaNorthern AfricaNorthern EuropeNorwayPakistanPanamaPeruPhilippinesPolandPortugalRomaniaRussiaSaudi ArabiaScotlandSenegalSerbiaSierra LeoneSingaporeSomaliaSouth AfricaSouth AmericaSouth Central AsiaSouth Eastern AsiaSouthern EuropeSpainSri LankaSt. Vincent and the GrenadinesSudanSwedenSwitzerlandSyriaTaiwanThailandTrinidad and TobagoTurkeyUgandaUkraineUruguayUzbekistanVenezuelaVietnamWest IndiesWestern AfricaWestern AsiaWestern EuropeYemenZaireZimbabweAzores
Immigrants from Oceania
Race
Ancestry
AfghanAfricanAlaska NativeAlaskan AthabascanAlbanianAleutAlsatianAmericanApacheArabArapahoArgentineanArmenianAssyrian/Chaldean/SyriacAustralianAustrianBahamianBangladeshiBarbadianBasqueBelgianBelizeanBermudanBhutaneseBlackfeetBolivianBrazilianBritishBritish West IndianBulgarianBurmeseCajunCambodianCanadianCape VerdeanCarpatho RusynCelticCentral AmericanCentral American IndianCherokeeCheyenneChickasawChileanChineseChippewaChoctawColombianColvilleComancheCosta RicanCreeCreekCroatianCrowCubanCypriotCzechCzechoslovakianDanishDelawareDominicanDutchDutch West IndianEastern EuropeanEcuadorianEgyptianEnglishEstonianEthiopianEuropeanFijianFilipinoFinnishFrenchFrench American IndianFrench CanadianGermanGerman RussianGhanaianGreekGuamanian/ChamorroGuatemalanGuyaneseHaitianHmongHonduranHopiHoumaHungarianIcelanderIndian (Asian)IndonesianInupiatIranianIraqiIrishIroquoisIsraeliItalianJamaicanJapaneseJordanianKenyanKiowaKoreanLaotianLatvianLebaneseLiberianLithuanianLumbeeLuxembourgerMacedonianMalaysianMalteseMarshalleseMenomineeMexicanMexican American IndianMongolianMoroccanNative HawaiianNavajoNepaleseNew ZealanderNicaraguanNigerianNorthern EuropeanNorwegianOkinawanOsageOttawaPaiutePakistaniPalestinianPanamanianParaguayanPennsylvania GermanPeruvianPimaPolishPortuguesePotawatomiPuebloPuerto RicanPuget Sound SalishRomanianRussianSalvadoranSamoanScandinavianScotch-IrishScottishSeminoleSenegaleseSerbianShoshoneSierra LeoneanSiouxSlavicSlovakSloveneSomaliSouth AfricanSouth AmericanSouth American IndianSoviet UnionSpaniardSpanishSpanish AmericanSpanish American IndianSri LankanSubsaharan AfricanSudaneseSwedishSwissSyrianTaiwaneseThaiTlingit-HaidaTohono O'OdhamTonganTrinidadian and TobagonianTsimshianTurkishU.S. Virgin IslanderUgandanUkrainianUruguayanUteVenezuelanVietnameseWelshWest IndianYakamaYaquiYugoslavianYumanYup'ikZimbabwean
Immigration
NonimmigrantsImmigrantsAfghanistanAfricaAlbaniaArgentinaArmeniaAsiaAustraliaAustriaBahamasBangladeshBarbadosBelarusBelgiumBelizeBoliviaBosnia and HerzegovinaBrazilBulgariaBurma/MyanmarCabo VerdeCambodiaCameroonCanadaCaribbeanCentral AmericaChileChinaColombiaCongoCosta RicaCroatiaCubaCzechoslovakiaDenmarkDominicaEastern AfricaEastern AsiaEastern EuropeEcuadorEgyptEl SalvadorEnglandEritreaEthiopiaEuropeFijiFranceGermanyGhanaGreeceGrenadaGuatemalaGuyanaHaitiHondurasHong KongHungaryIndiaIndonesiaIranIraqIrelandIsraelItalyJamaicaJapanJordanKazakhstanKenyaKoreaKuwaitLaosLatin AmericaLatviaLebanonLiberiaLithuaniaMalaysiaMexicoMicronesiaMiddle AfricaMoldovaMoroccoNepalNetherlandsNicaraguaNigeriaNorth AmericaNorth MacedoniaNorthern AfricaNorthern EuropeNorwayOceaniaPakistanPanamaPeruPhilippinesPolandPortugalRomaniaRussiaSaudi ArabiaScotlandSenegalSerbiaSierra LeoneSingaporeSomaliaSouth AfricaSouth AmericaSouth Central AsiaSouth Eastern AsiaSouthern EuropeSpainSri LankaSt. Vincent and the GrenadinesSudanSwedenSwitzerlandSyriaTaiwanThailandTrinidad and TobagoTurkeyUgandaUkraineUruguayUzbekistanVenezuelaVietnamWest IndiesWestern AfricaWestern AsiaWestern EuropeYemenZaireZimbabweAzores
1 or more Vehicles in Household
Income
Poverty
Unemployment
Labor Participation
Family Structure
Vehicle Availability
Education Level
Disability

1 or more Vehicles in Household Comparison

Immigrants from Dominican Republic

Immigrants from Oceania

Tragic
Excellent
68.6%
1 OR MORE VEHICLES IN HOUSEHOLD
0.0/ 100
METRIC RATING
344th/ 347
METRIC RANK
90.4%
1 OR MORE VEHICLES IN HOUSEHOLD
86.9/ 100
METRIC RATING
135th/ 347
METRIC RANK

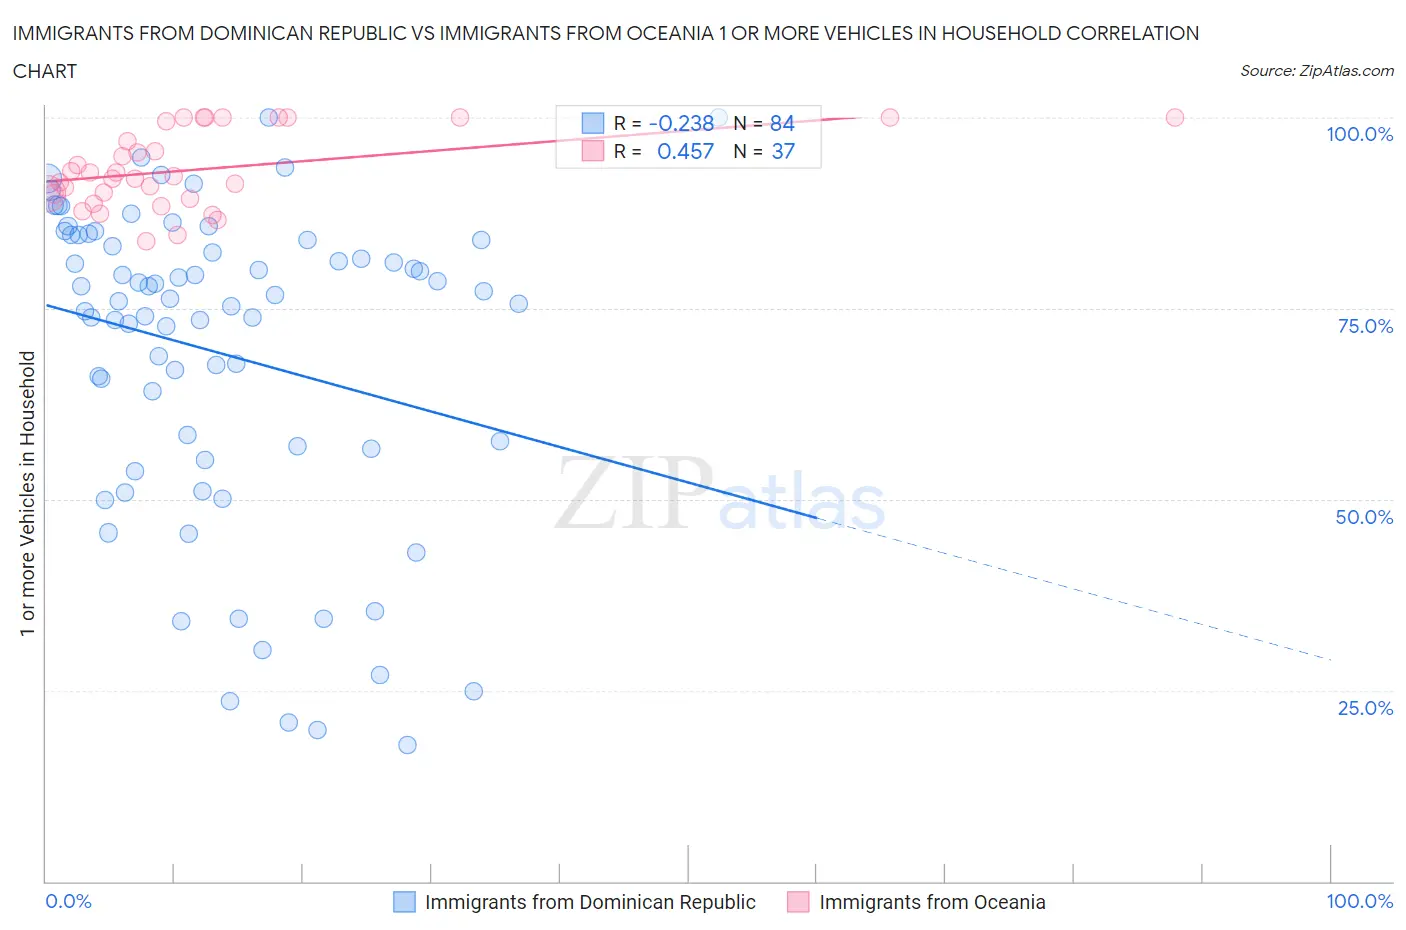
Immigrants from Dominican Republic vs Immigrants from Oceania 1 or more Vehicles in Household Correlation Chart

The statistical analysis conducted on geographies consisting of 274,977,350 people shows a weak negative correlation between the proportion of Immigrants from Dominican Republic and percentage of households with 1 or more vehicles available in the United States with a correlation coefficient (R) of -0.238 and weighted average of 68.6%. Similarly, the statistical analysis conducted on geographies consisting of 305,395,029 people shows a moderate positive correlation between the proportion of Immigrants from Oceania and percentage of households with 1 or more vehicles available in the United States with a correlation coefficient (R) of 0.457 and weighted average of 90.4%, a difference of 31.7%.
Immigrants from Dominican Republic vs Immigrants from Oceania 1 or more Vehicles in Household

1 or more Vehicles in Household Correlation Summary

MeasurementImmigrants from Dominican RepublicImmigrants from Oceania
Minimum17.9%83.8%
Maximum100.0%100.0%
Range82.1%16.2%
Mean69.1%93.2%
Median76.1%92.4%
Interquartile 25% (IQ1)56.8%89.6%
Interquartile 75% (IQ3)84.0%99.8%
Interquartile Range (IQR)27.2%10.2%
Standard Deviation (Sample)20.6%5.0%
Standard Deviation (Population)20.5%4.9%

Similar Demographics by 1 or more Vehicles in Household

Demographics Similar to Immigrants from Dominican Republic by 1 or more Vehicles in Household

In terms of 1 or more vehicles in household, the demographic groups most similar to Immigrants from Dominican Republic are British West Indian (70.4%, a difference of 2.5%), Immigrants from Guyana (70.6%, a difference of 2.8%), Immigrants from Barbados (70.6%, a difference of 2.8%), Dominican (70.7%, a difference of 3.0%), and Guyanese (70.8%, a difference of 3.2%).
DemographicsRating | Rank1 or more Vehicles in Household
Immigrants | Ecuador
0.0
/100
|
#333
Tragic
76.2%
Immigrants | Bangladesh
0.0
/100
|
#334
Tragic
74.3%
Barbadians
0.0
/100
|
#335
Tragic
74.0%
Vietnamese
0.0
/100
|
#336
Tragic
73.8%
Immigrants | Uzbekistan
0.0
/100
|
#337
Tragic
73.4%
Inupiat
0.0
/100
|
#338
Tragic
71.5%
Guyanese
0.0
/100
|
#339
Tragic
70.8%
Dominicans
0.0
/100
|
#340
Tragic
70.7%
Immigrants | Barbados
0.0
/100
|
#341
Tragic
70.6%
Immigrants | Guyana
0.0
/100
|
#342
Tragic
70.6%
British West Indians
0.0
/100
|
#343
Tragic
70.4%
Immigrants | Dominican Republic
0.0
/100
|
#344
Tragic
68.6%
Immigrants | St. Vincent and the Grenadines
0.0
/100
|
#345
Tragic
64.7%
Immigrants | Grenada
0.0
/100
|
#346
Tragic
62.7%
Yup'ik
0.0
/100
|
#347
Tragic
58.4%

Demographics Similar to Immigrants from Oceania by 1 or more Vehicles in Household

In terms of 1 or more vehicles in household, the demographic groups most similar to Immigrants from Oceania are Kenyan (90.4%, a difference of 0.0%), Immigrants from Syria (90.4%, a difference of 0.020%), Hungarian (90.3%, a difference of 0.020%), Latvian (90.3%, a difference of 0.020%), and Syrian (90.3%, a difference of 0.020%).
DemographicsRating | Rank1 or more Vehicles in Household
Burmese
89.0
/100
|
#128
Excellent
90.4%
Marshallese
88.9
/100
|
#129
Excellent
90.4%
Nicaraguans
88.8
/100
|
#130
Excellent
90.4%
Immigrants | Kenya
88.5
/100
|
#131
Excellent
90.4%
Immigrants | South Africa
88.1
/100
|
#132
Excellent
90.4%
Immigrants | Syria
87.5
/100
|
#133
Excellent
90.4%
Kenyans
87.0
/100
|
#134
Excellent
90.4%
Immigrants | Oceania
86.9
/100
|
#135
Excellent
90.4%
Hungarians
86.5
/100
|
#136
Excellent
90.3%
Latvians
86.3
/100
|
#137
Excellent
90.3%
Syrians
86.3
/100
|
#138
Excellent
90.3%
Estonians
85.6
/100
|
#139
Excellent
90.3%
Sudanese
85.2
/100
|
#140
Excellent
90.3%
Immigrants | Moldova
83.1
/100
|
#141
Excellent
90.2%
Immigrants | Lithuania
83.0
/100
|
#142
Excellent
90.2%