Immigrants from Cabo Verde vs New Zealander 4 or more Vehicles in Household

COMPARE

Immigrants from Cabo Verde
Race
Ancestry
AfghanAfricanAlaska NativeAlaskan AthabascanAlbanianAleutAlsatianAmericanApacheArabArapahoArgentineanArmenianAssyrian/Chaldean/SyriacAustralianAustrianBahamianBangladeshiBarbadianBasqueBelgianBelizeanBermudanBhutaneseBlackfeetBolivianBrazilianBritishBritish West IndianBulgarianBurmeseCajunCambodianCanadianCape VerdeanCarpatho RusynCelticCentral AmericanCentral American IndianCherokeeCheyenneChickasawChileanChineseChippewaChoctawColombianColvilleComancheCosta RicanCreeCreekCroatianCrowCubanCypriotCzechCzechoslovakianDanishDelawareDominicanDutchDutch West IndianEastern EuropeanEcuadorianEgyptianEnglishEstonianEthiopianEuropeanFijianFilipinoFinnishFrenchFrench American IndianFrench CanadianGermanGerman RussianGhanaianGreekGuamanian/ChamorroGuatemalanGuyaneseHaitianHmongHonduranHopiHoumaHungarianIcelanderIndian (Asian)IndonesianInupiatIranianIraqiIrishIroquoisIsraeliItalianJamaicanJapaneseJordanianKenyanKiowaKoreanLaotianLatvianLebaneseLiberianLithuanianLumbeeLuxembourgerMacedonianMalaysianMalteseMarshalleseMenomineeMexicanMexican American IndianMongolianMoroccanNative HawaiianNavajoNepaleseNicaraguanNigerianNorthern EuropeanNorwegianOkinawanOsageOttawaPaiutePakistaniPalestinianPanamanianParaguayanPennsylvania GermanPeruvianPimaPolishPortuguesePotawatomiPuebloPuerto RicanPuget Sound SalishRomanianRussianSalvadoranSamoanScandinavianScotch-IrishScottishSeminoleSenegaleseSerbianShoshoneSierra LeoneanSiouxSlavicSlovakSloveneSomaliSouth AfricanSouth AmericanSouth American IndianSoviet UnionSpaniardSpanishSpanish AmericanSpanish American IndianSri LankanSubsaharan AfricanSudaneseSwedishSwissSyrianTaiwaneseThaiTlingit-HaidaTohono O'OdhamTonganTrinidadian and TobagonianTsimshianTurkishU.S. Virgin IslanderUgandanUkrainianUruguayanUteVenezuelanVietnameseWelshWest IndianYakamaYaquiYugoslavianYumanYup'ikZimbabwean
Immigration
NonimmigrantsImmigrantsAfghanistanAfricaAlbaniaArgentinaArmeniaAsiaAustraliaAustriaBahamasBangladeshBarbadosBelarusBelgiumBelizeBoliviaBosnia and HerzegovinaBrazilBulgariaBurma/MyanmarCabo VerdeCambodiaCameroonCanadaCaribbeanCentral AmericaChileChinaColombiaCongoCosta RicaCroatiaCubaCzechoslovakiaDenmarkDominicaDominican RepublicEastern AfricaEastern AsiaEastern EuropeEcuadorEgyptEl SalvadorEnglandEritreaEthiopiaEuropeFijiFranceGermanyGhanaGreeceGrenadaGuatemalaGuyanaHaitiHondurasHong KongHungaryIndiaIndonesiaIranIraqIrelandIsraelItalyJamaicaJapanJordanKazakhstanKenyaKoreaKuwaitLaosLatin AmericaLatviaLebanonLiberiaLithuaniaMalaysiaMexicoMicronesiaMiddle AfricaMoldovaMoroccoNepalNetherlandsNicaraguaNigeriaNorth AmericaNorth MacedoniaNorthern AfricaNorthern EuropeNorwayOceaniaPakistanPanamaPeruPhilippinesPolandPortugalRomaniaRussiaSaudi ArabiaScotlandSenegalSerbiaSierra LeoneSingaporeSomaliaSouth AfricaSouth AmericaSouth Central AsiaSouth Eastern AsiaSouthern EuropeSpainSri LankaSt. Vincent and the GrenadinesSudanSwedenSwitzerlandSyriaTaiwanThailandTrinidad and TobagoTurkeyUgandaUkraineUruguayUzbekistanVenezuelaVietnamWest IndiesWestern AfricaWestern AsiaWestern EuropeYemenZaireZimbabweAzores
New Zealander
Race
Ancestry
AfghanAfricanAlaska NativeAlaskan AthabascanAlbanianAleutAlsatianAmericanApacheArabArapahoArgentineanArmenianAssyrian/Chaldean/SyriacAustralianAustrianBahamianBangladeshiBarbadianBasqueBelgianBelizeanBermudanBhutaneseBlackfeetBolivianBrazilianBritishBritish West IndianBulgarianBurmeseCajunCambodianCanadianCape VerdeanCarpatho RusynCelticCentral AmericanCentral American IndianCherokeeCheyenneChickasawChileanChineseChippewaChoctawColombianColvilleComancheCosta RicanCreeCreekCroatianCrowCubanCypriotCzechCzechoslovakianDanishDelawareDominicanDutchDutch West IndianEastern EuropeanEcuadorianEgyptianEnglishEstonianEthiopianEuropeanFijianFilipinoFinnishFrenchFrench American IndianFrench CanadianGermanGerman RussianGhanaianGreekGuamanian/ChamorroGuatemalanGuyaneseHaitianHmongHonduranHopiHoumaHungarianIcelanderIndian (Asian)IndonesianInupiatIranianIraqiIrishIroquoisIsraeliItalianJamaicanJapaneseJordanianKenyanKiowaKoreanLaotianLatvianLebaneseLiberianLithuanianLumbeeLuxembourgerMacedonianMalaysianMalteseMarshalleseMenomineeMexicanMexican American IndianMongolianMoroccanNative HawaiianNavajoNepaleseNew ZealanderNicaraguanNigerianNorthern EuropeanNorwegianOkinawanOsageOttawaPaiutePakistaniPalestinianPanamanianParaguayanPennsylvania GermanPeruvianPimaPolishPortuguesePotawatomiPuebloPuerto RicanPuget Sound SalishRomanianRussianSalvadoranSamoanScandinavianScotch-IrishScottishSeminoleSenegaleseSerbianShoshoneSierra LeoneanSiouxSlavicSlovakSloveneSomaliSouth AfricanSouth AmericanSouth American IndianSoviet UnionSpaniardSpanishSpanish AmericanSpanish American IndianSri LankanSubsaharan AfricanSudaneseSwedishSwissSyrianTaiwaneseThaiTlingit-HaidaTohono O'OdhamTonganTrinidadian and TobagonianTsimshianTurkishU.S. Virgin IslanderUgandanUkrainianUruguayanUteVenezuelanVietnameseWelshWest IndianYakamaYaquiYugoslavianYumanYup'ikZimbabwean
Immigration
NonimmigrantsImmigrantsAfghanistanAfricaAlbaniaArgentinaArmeniaAsiaAustraliaAustriaBahamasBangladeshBarbadosBelarusBelgiumBelizeBoliviaBosnia and HerzegovinaBrazilBulgariaBurma/MyanmarCambodiaCameroonCanadaCaribbeanCentral AmericaChileChinaColombiaCongoCosta RicaCroatiaCubaCzechoslovakiaDenmarkDominicaDominican RepublicEastern AfricaEastern AsiaEastern EuropeEcuadorEgyptEl SalvadorEnglandEritreaEthiopiaEuropeFijiFranceGermanyGhanaGreeceGrenadaGuatemalaGuyanaHaitiHondurasHong KongHungaryIndiaIndonesiaIranIraqIrelandIsraelItalyJamaicaJapanJordanKazakhstanKenyaKoreaKuwaitLaosLatin AmericaLatviaLebanonLiberiaLithuaniaMalaysiaMexicoMicronesiaMiddle AfricaMoldovaMoroccoNepalNetherlandsNicaraguaNigeriaNorth AmericaNorth MacedoniaNorthern AfricaNorthern EuropeNorwayOceaniaPakistanPanamaPeruPhilippinesPolandPortugalRomaniaRussiaSaudi ArabiaScotlandSenegalSerbiaSierra LeoneSingaporeSomaliaSouth AfricaSouth AmericaSouth Central AsiaSouth Eastern AsiaSouthern EuropeSpainSri LankaSt. Vincent and the GrenadinesSudanSwedenSwitzerlandSyriaTaiwanThailandTrinidad and TobagoTurkeyUgandaUkraineUruguayUzbekistanVenezuelaVietnamWest IndiesWestern AfricaWestern AsiaWestern EuropeYemenZaireZimbabweAzores
4 or more Vehicles in Household
Income
Poverty
Unemployment
Labor Participation
Family Structure
Vehicle Availability
Education Level
Disability

4 or more Vehicles in Household Comparison

Immigrants from Cabo Verde

New Zealanders

Tragic
Good
3.8%
4 OR MORE VEHICLES IN HOUSEHOLD
0.0/ 100
METRIC RATING
338th/ 347
METRIC RANK
6.5%
4 OR MORE VEHICLES IN HOUSEHOLD
73.3/ 100
METRIC RATING
150th/ 347
METRIC RANK

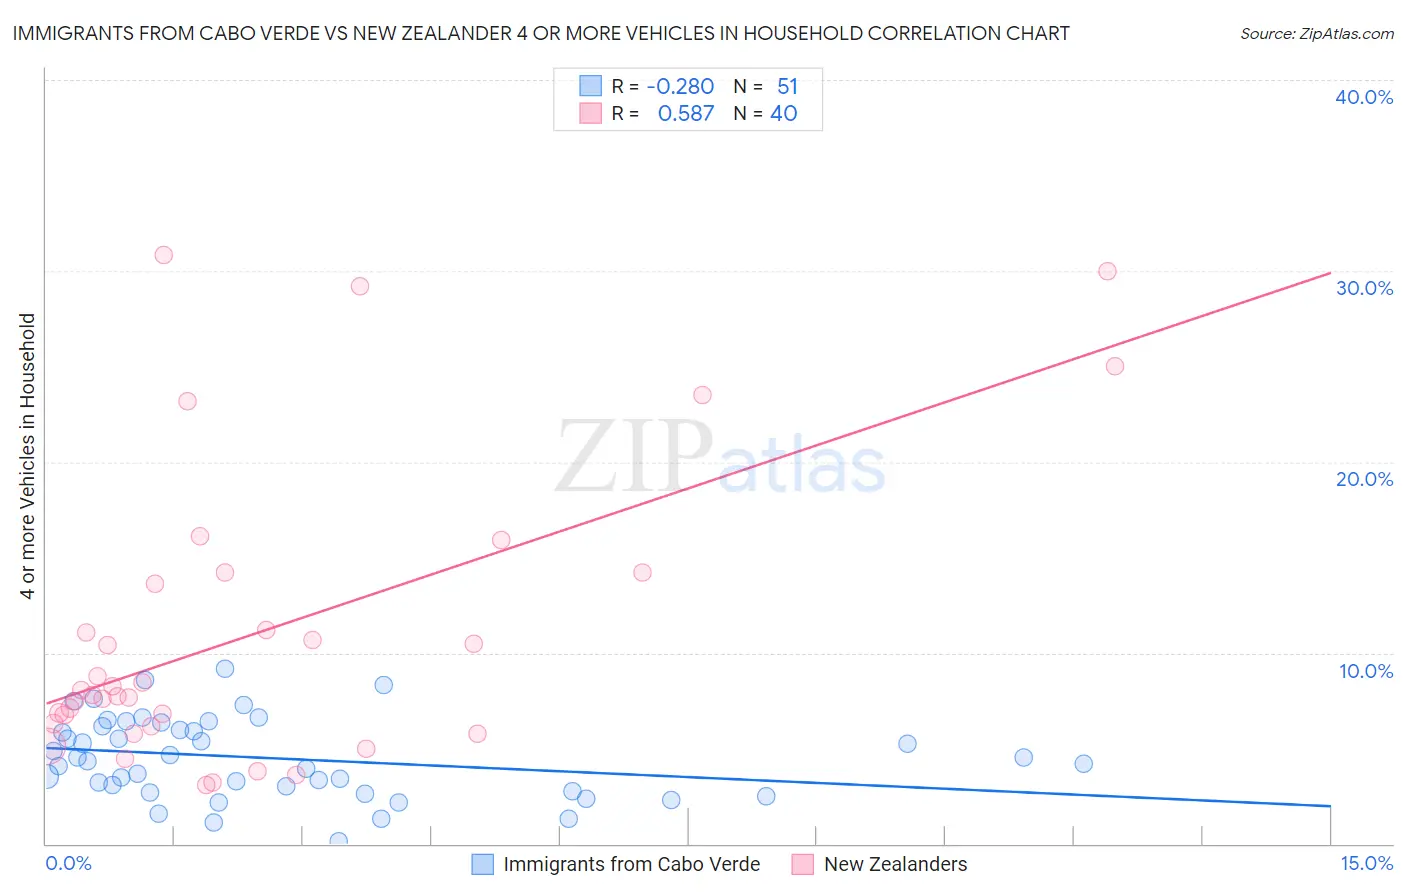
Immigrants from Cabo Verde vs New Zealander 4 or more Vehicles in Household Correlation Chart

The statistical analysis conducted on geographies consisting of 38,088,471 people shows a weak negative correlation between the proportion of Immigrants from Cabo Verde and percentage of households with 4 or more vehicles available in the United States with a correlation coefficient (R) of -0.280 and weighted average of 3.8%. Similarly, the statistical analysis conducted on geographies consisting of 106,639,386 people shows a substantial positive correlation between the proportion of New Zealanders and percentage of households with 4 or more vehicles available in the United States with a correlation coefficient (R) of 0.587 and weighted average of 6.5%, a difference of 70.4%.
Immigrants from Cabo Verde vs New Zealander 4 or more Vehicles in Household

4 or more Vehicles in Household Correlation Summary

MeasurementImmigrants from Cabo VerdeNew Zealander
Minimum0.12%3.1%
Maximum9.2%30.9%
Range9.0%27.8%
Mean4.5%11.0%
Median4.3%7.9%
Interquartile 25% (IQ1)2.8%6.2%
Interquartile 75% (IQ3)6.1%13.9%
Interquartile Range (IQR)3.4%7.7%
Standard Deviation (Sample)2.1%7.6%
Standard Deviation (Population)2.1%7.5%

Similar Demographics by 4 or more Vehicles in Household

Demographics Similar to Immigrants from Cabo Verde by 4 or more Vehicles in Household

In terms of 4 or more vehicles in household, the demographic groups most similar to Immigrants from Cabo Verde are Vietnamese (3.9%, a difference of 1.8%), Immigrants from Bangladesh (3.9%, a difference of 2.4%), Barbadian (3.9%, a difference of 2.5%), Immigrants from Uzbekistan (3.6%, a difference of 5.0%), and Immigrants from Barbados (3.6%, a difference of 5.6%).
DemographicsRating | Rank4 or more Vehicles in Household
West Indians
0.0
/100
|
#331
Tragic
4.2%
Immigrants | Dominica
0.0
/100
|
#332
Tragic
4.2%
Immigrants | Albania
0.0
/100
|
#333
Tragic
4.1%
Immigrants | Trinidad and Tobago
0.0
/100
|
#334
Tragic
4.1%
Barbadians
0.0
/100
|
#335
Tragic
3.9%
Immigrants | Bangladesh
0.0
/100
|
#336
Tragic
3.9%
Vietnamese
0.0
/100
|
#337
Tragic
3.9%
Immigrants | Cabo Verde
0.0
/100
|
#338
Tragic
3.8%
Immigrants | Uzbekistan
0.0
/100
|
#339
Tragic
3.6%
Immigrants | Barbados
0.0
/100
|
#340
Tragic
3.6%
Dominicans
0.0
/100
|
#341
Tragic
3.5%
Guyanese
0.0
/100
|
#342
Tragic
3.5%
British West Indians
0.0
/100
|
#343
Tragic
3.5%
Immigrants | Guyana
0.0
/100
|
#344
Tragic
3.4%
Immigrants | Dominican Republic
0.0
/100
|
#345
Tragic
3.3%

Demographics Similar to New Zealanders by 4 or more Vehicles in Household

In terms of 4 or more vehicles in household, the demographic groups most similar to New Zealanders are Immigrants from Jordan (6.5%, a difference of 0.040%), Greek (6.5%, a difference of 0.040%), Immigrants from Iran (6.5%, a difference of 0.080%), Immigrants from Costa Rica (6.5%, a difference of 0.13%), and Immigrants from Hong Kong (6.5%, a difference of 0.14%).
DemographicsRating | Rank4 or more Vehicles in Household
Immigrants | Canada
78.6
/100
|
#143
Good
6.5%
Immigrants | North America
78.5
/100
|
#144
Good
6.5%
Croatians
77.8
/100
|
#145
Good
6.5%
Immigrants | Costa Rica
74.4
/100
|
#146
Good
6.5%
Immigrants | Iran
73.9
/100
|
#147
Good
6.5%
Immigrants | Jordan
73.7
/100
|
#148
Good
6.5%
Greeks
73.6
/100
|
#149
Good
6.5%
New Zealanders
73.3
/100
|
#150
Good
6.5%
Immigrants | Hong Kong
72.2
/100
|
#151
Good
6.5%
Yuman
72.1
/100
|
#152
Good
6.5%
Immigrants | Armenia
71.2
/100
|
#153
Good
6.5%
Central American Indians
71.1
/100
|
#154
Good
6.5%
Iroquois
70.4
/100
|
#155
Good
6.5%
Iranians
69.9
/100
|
#156
Good
6.5%
Peruvians
69.4
/100
|
#157
Good
6.5%