Immigrants from Cabo Verde vs Immigrants from Sweden 4 or more Vehicles in Household

COMPARE

Immigrants from Cabo Verde
Race
Ancestry
AfghanAfricanAlaska NativeAlaskan AthabascanAlbanianAleutAlsatianAmericanApacheArabArapahoArgentineanArmenianAssyrian/Chaldean/SyriacAustralianAustrianBahamianBangladeshiBarbadianBasqueBelgianBelizeanBermudanBhutaneseBlackfeetBolivianBrazilianBritishBritish West IndianBulgarianBurmeseCajunCambodianCanadianCape VerdeanCarpatho RusynCelticCentral AmericanCentral American IndianCherokeeCheyenneChickasawChileanChineseChippewaChoctawColombianColvilleComancheCosta RicanCreeCreekCroatianCrowCubanCypriotCzechCzechoslovakianDanishDelawareDominicanDutchDutch West IndianEastern EuropeanEcuadorianEgyptianEnglishEstonianEthiopianEuropeanFijianFilipinoFinnishFrenchFrench American IndianFrench CanadianGermanGerman RussianGhanaianGreekGuamanian/ChamorroGuatemalanGuyaneseHaitianHmongHonduranHopiHoumaHungarianIcelanderIndian (Asian)IndonesianInupiatIranianIraqiIrishIroquoisIsraeliItalianJamaicanJapaneseJordanianKenyanKiowaKoreanLaotianLatvianLebaneseLiberianLithuanianLumbeeLuxembourgerMacedonianMalaysianMalteseMarshalleseMenomineeMexicanMexican American IndianMongolianMoroccanNative HawaiianNavajoNepaleseNew ZealanderNicaraguanNigerianNorthern EuropeanNorwegianOkinawanOsageOttawaPaiutePakistaniPalestinianPanamanianParaguayanPennsylvania GermanPeruvianPimaPolishPortuguesePotawatomiPuebloPuerto RicanPuget Sound SalishRomanianRussianSalvadoranSamoanScandinavianScotch-IrishScottishSeminoleSenegaleseSerbianShoshoneSierra LeoneanSiouxSlavicSlovakSloveneSomaliSouth AfricanSouth AmericanSouth American IndianSoviet UnionSpaniardSpanishSpanish AmericanSpanish American IndianSri LankanSubsaharan AfricanSudaneseSwedishSwissSyrianTaiwaneseThaiTlingit-HaidaTohono O'OdhamTonganTrinidadian and TobagonianTsimshianTurkishU.S. Virgin IslanderUgandanUkrainianUruguayanUteVenezuelanVietnameseWelshWest IndianYakamaYaquiYugoslavianYumanYup'ikZimbabwean
Immigration
NonimmigrantsImmigrantsAfghanistanAfricaAlbaniaArgentinaArmeniaAsiaAustraliaAustriaBahamasBangladeshBarbadosBelarusBelgiumBelizeBoliviaBosnia and HerzegovinaBrazilBulgariaBurma/MyanmarCabo VerdeCambodiaCameroonCanadaCaribbeanCentral AmericaChileChinaColombiaCongoCosta RicaCroatiaCubaCzechoslovakiaDenmarkDominicaDominican RepublicEastern AfricaEastern AsiaEastern EuropeEcuadorEgyptEl SalvadorEnglandEritreaEthiopiaEuropeFijiFranceGermanyGhanaGreeceGrenadaGuatemalaGuyanaHaitiHondurasHong KongHungaryIndiaIndonesiaIranIraqIrelandIsraelItalyJamaicaJapanJordanKazakhstanKenyaKoreaKuwaitLaosLatin AmericaLatviaLebanonLiberiaLithuaniaMalaysiaMexicoMicronesiaMiddle AfricaMoldovaMoroccoNepalNetherlandsNicaraguaNigeriaNorth AmericaNorth MacedoniaNorthern AfricaNorthern EuropeNorwayOceaniaPakistanPanamaPeruPhilippinesPolandPortugalRomaniaRussiaSaudi ArabiaScotlandSenegalSerbiaSierra LeoneSingaporeSomaliaSouth AfricaSouth AmericaSouth Central AsiaSouth Eastern AsiaSouthern EuropeSpainSri LankaSt. Vincent and the GrenadinesSudanSwitzerlandSyriaTaiwanThailandTrinidad and TobagoTurkeyUgandaUkraineUruguayUzbekistanVenezuelaVietnamWest IndiesWestern AfricaWestern AsiaWestern EuropeYemenZaireZimbabweAzores
Immigrants from Sweden
Race
Ancestry
AfghanAfricanAlaska NativeAlaskan AthabascanAlbanianAleutAlsatianAmericanApacheArabArapahoArgentineanArmenianAssyrian/Chaldean/SyriacAustralianAustrianBahamianBangladeshiBarbadianBasqueBelgianBelizeanBermudanBhutaneseBlackfeetBolivianBrazilianBritishBritish West IndianBulgarianBurmeseCajunCambodianCanadianCape VerdeanCarpatho RusynCelticCentral AmericanCentral American IndianCherokeeCheyenneChickasawChileanChineseChippewaChoctawColombianColvilleComancheCosta RicanCreeCreekCroatianCrowCubanCypriotCzechCzechoslovakianDanishDelawareDominicanDutchDutch West IndianEastern EuropeanEcuadorianEgyptianEnglishEstonianEthiopianEuropeanFijianFilipinoFinnishFrenchFrench American IndianFrench CanadianGermanGerman RussianGhanaianGreekGuamanian/ChamorroGuatemalanGuyaneseHaitianHmongHonduranHopiHoumaHungarianIcelanderIndian (Asian)IndonesianInupiatIranianIraqiIrishIroquoisIsraeliItalianJamaicanJapaneseJordanianKenyanKiowaKoreanLaotianLatvianLebaneseLiberianLithuanianLumbeeLuxembourgerMacedonianMalaysianMalteseMarshalleseMenomineeMexicanMexican American IndianMongolianMoroccanNative HawaiianNavajoNepaleseNew ZealanderNicaraguanNigerianNorthern EuropeanNorwegianOkinawanOsageOttawaPaiutePakistaniPalestinianPanamanianParaguayanPennsylvania GermanPeruvianPimaPolishPortuguesePotawatomiPuebloPuerto RicanPuget Sound SalishRomanianRussianSalvadoranSamoanScandinavianScotch-IrishScottishSeminoleSenegaleseSerbianShoshoneSierra LeoneanSiouxSlavicSlovakSloveneSomaliSouth AfricanSouth AmericanSouth American IndianSoviet UnionSpaniardSpanishSpanish AmericanSpanish American IndianSri LankanSubsaharan AfricanSudaneseSwedishSwissSyrianTaiwaneseThaiTlingit-HaidaTohono O'OdhamTonganTrinidadian and TobagonianTsimshianTurkishU.S. Virgin IslanderUgandanUkrainianUruguayanUteVenezuelanVietnameseWelshWest IndianYakamaYaquiYugoslavianYumanYup'ikZimbabwean
Immigration
NonimmigrantsImmigrantsAfghanistanAfricaAlbaniaArgentinaArmeniaAsiaAustraliaAustriaBahamasBangladeshBarbadosBelarusBelgiumBelizeBoliviaBosnia and HerzegovinaBrazilBulgariaBurma/MyanmarCambodiaCameroonCanadaCaribbeanCentral AmericaChileChinaColombiaCongoCosta RicaCroatiaCubaCzechoslovakiaDenmarkDominicaDominican RepublicEastern AfricaEastern AsiaEastern EuropeEcuadorEgyptEl SalvadorEnglandEritreaEthiopiaEuropeFijiFranceGermanyGhanaGreeceGrenadaGuatemalaGuyanaHaitiHondurasHong KongHungaryIndiaIndonesiaIranIraqIrelandIsraelItalyJamaicaJapanJordanKazakhstanKenyaKoreaKuwaitLaosLatin AmericaLatviaLebanonLiberiaLithuaniaMalaysiaMexicoMicronesiaMiddle AfricaMoldovaMoroccoNepalNetherlandsNicaraguaNigeriaNorth AmericaNorth MacedoniaNorthern AfricaNorthern EuropeNorwayOceaniaPakistanPanamaPeruPhilippinesPolandPortugalRomaniaRussiaSaudi ArabiaScotlandSenegalSerbiaSierra LeoneSingaporeSomaliaSouth AfricaSouth AmericaSouth Central AsiaSouth Eastern AsiaSouthern EuropeSpainSri LankaSt. Vincent and the GrenadinesSudanSwedenSwitzerlandSyriaTaiwanThailandTrinidad and TobagoTurkeyUgandaUkraineUruguayUzbekistanVenezuelaVietnamWest IndiesWestern AfricaWestern AsiaWestern EuropeYemenZaireZimbabweAzores
4 or more Vehicles in Household
Income
Poverty
Unemployment
Labor Participation
Family Structure
Vehicle Availability
Education Level
Disability

4 or more Vehicles in Household Comparison

Immigrants from Cabo Verde

Immigrants from Sweden

Tragic
Fair
3.8%
4 OR MORE VEHICLES IN HOUSEHOLD
0.0/ 100
METRIC RATING
338th/ 347
METRIC RANK
6.2%
4 OR MORE VEHICLES IN HOUSEHOLD
27.0/ 100
METRIC RATING
194th/ 347
METRIC RANK

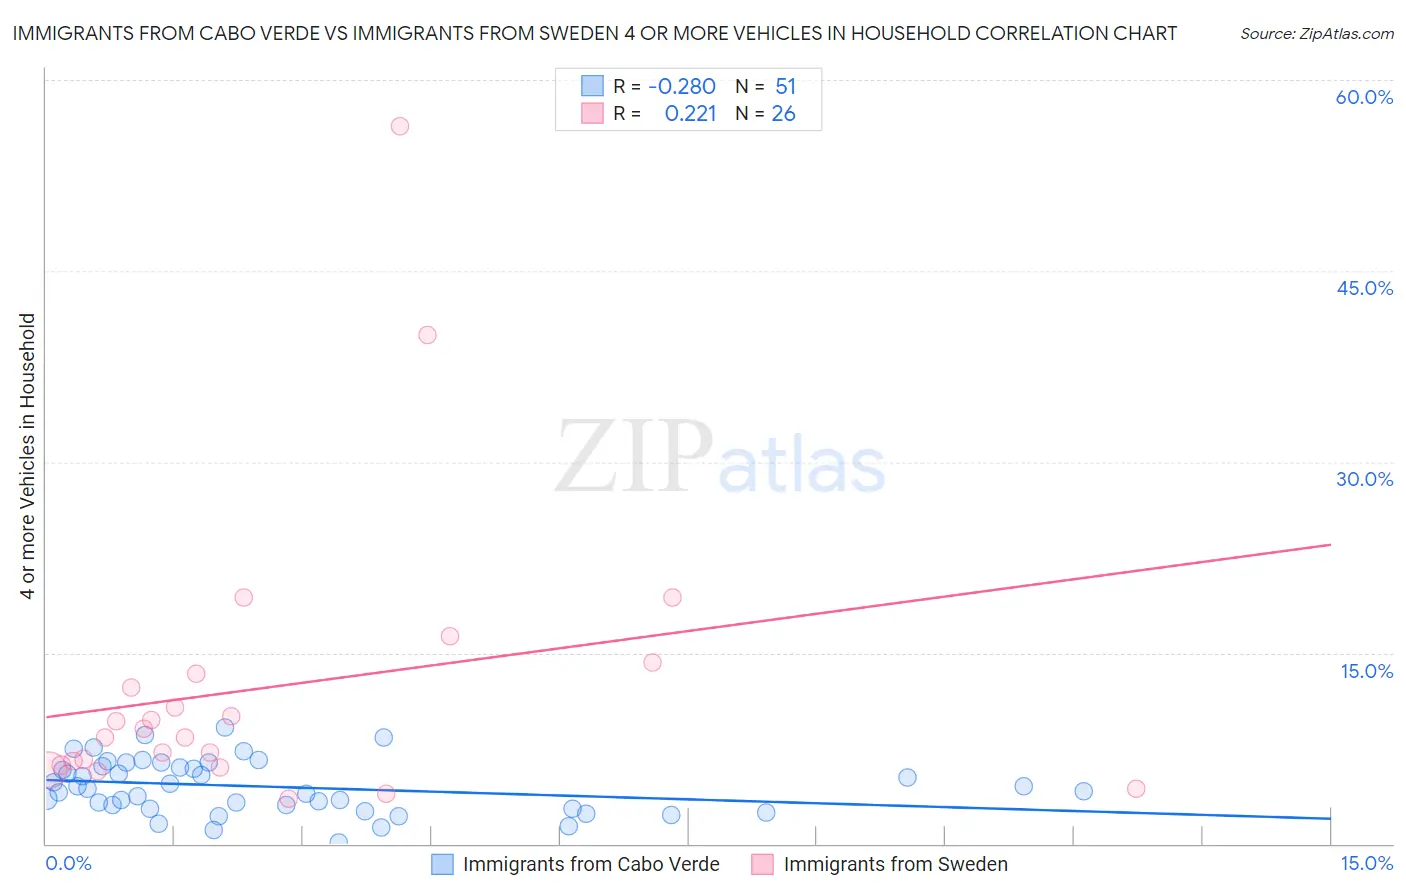
Immigrants from Cabo Verde vs Immigrants from Sweden 4 or more Vehicles in Household Correlation Chart

The statistical analysis conducted on geographies consisting of 38,088,471 people shows a weak negative correlation between the proportion of Immigrants from Cabo Verde and percentage of households with 4 or more vehicles available in the United States with a correlation coefficient (R) of -0.280 and weighted average of 3.8%. Similarly, the statistical analysis conducted on geographies consisting of 163,976,202 people shows a weak positive correlation between the proportion of Immigrants from Sweden and percentage of households with 4 or more vehicles available in the United States with a correlation coefficient (R) of 0.221 and weighted average of 6.2%, a difference of 61.9%.
Immigrants from Cabo Verde vs Immigrants from Sweden 4 or more Vehicles in Household

4 or more Vehicles in Household Correlation Summary

MeasurementImmigrants from Cabo VerdeImmigrants from Sweden
Minimum0.12%3.6%
Maximum9.2%56.4%
Range9.0%52.8%
Mean4.5%12.3%
Median4.3%8.7%
Interquartile 25% (IQ1)2.8%6.2%
Interquartile 75% (IQ3)6.1%13.4%
Interquartile Range (IQR)3.4%7.2%
Standard Deviation (Sample)2.1%11.6%
Standard Deviation (Population)2.1%11.4%

Similar Demographics by 4 or more Vehicles in Household

Demographics Similar to Immigrants from Cabo Verde by 4 or more Vehicles in Household

In terms of 4 or more vehicles in household, the demographic groups most similar to Immigrants from Cabo Verde are Vietnamese (3.9%, a difference of 1.8%), Immigrants from Bangladesh (3.9%, a difference of 2.4%), Barbadian (3.9%, a difference of 2.5%), Immigrants from Uzbekistan (3.6%, a difference of 5.0%), and Immigrants from Barbados (3.6%, a difference of 5.6%).
DemographicsRating | Rank4 or more Vehicles in Household
West Indians
0.0
/100
|
#331
Tragic
4.2%
Immigrants | Dominica
0.0
/100
|
#332
Tragic
4.2%
Immigrants | Albania
0.0
/100
|
#333
Tragic
4.1%
Immigrants | Trinidad and Tobago
0.0
/100
|
#334
Tragic
4.1%
Barbadians
0.0
/100
|
#335
Tragic
3.9%
Immigrants | Bangladesh
0.0
/100
|
#336
Tragic
3.9%
Vietnamese
0.0
/100
|
#337
Tragic
3.9%
Immigrants | Cabo Verde
0.0
/100
|
#338
Tragic
3.8%
Immigrants | Uzbekistan
0.0
/100
|
#339
Tragic
3.6%
Immigrants | Barbados
0.0
/100
|
#340
Tragic
3.6%
Dominicans
0.0
/100
|
#341
Tragic
3.5%
Guyanese
0.0
/100
|
#342
Tragic
3.5%
British West Indians
0.0
/100
|
#343
Tragic
3.5%
Immigrants | Guyana
0.0
/100
|
#344
Tragic
3.4%
Immigrants | Dominican Republic
0.0
/100
|
#345
Tragic
3.3%

Demographics Similar to Immigrants from Sweden by 4 or more Vehicles in Household

In terms of 4 or more vehicles in household, the demographic groups most similar to Immigrants from Sweden are Argentinean (6.2%, a difference of 0.0%), Tsimshian (6.2%, a difference of 0.070%), Immigrants from Kuwait (6.2%, a difference of 0.13%), Immigrants from Sri Lanka (6.1%, a difference of 0.45%), and Romanian (6.2%, a difference of 0.47%).
DemographicsRating | Rank4 or more Vehicles in Household
Immigrants | South Africa
35.4
/100
|
#187
Fair
6.2%
Kiowa
34.7
/100
|
#188
Fair
6.2%
Immigrants | Eastern Asia
33.3
/100
|
#189
Fair
6.2%
South Africans
32.2
/100
|
#190
Fair
6.2%
Inupiat
30.7
/100
|
#191
Fair
6.2%
Romanians
30.7
/100
|
#192
Fair
6.2%
Immigrants | Kuwait
28.0
/100
|
#193
Fair
6.2%
Immigrants | Sweden
27.0
/100
|
#194
Fair
6.2%
Argentineans
27.0
/100
|
#195
Fair
6.2%
Tsimshian
26.4
/100
|
#196
Fair
6.2%
Immigrants | Sri Lanka
23.7
/100
|
#197
Fair
6.1%
Immigrants | Portugal
22.3
/100
|
#198
Fair
6.1%
Immigrants | Norway
21.8
/100
|
#199
Fair
6.1%
Latvians
21.7
/100
|
#200
Fair
6.1%
Egyptians
21.4
/100
|
#201
Fair
6.1%