Immigrants from Belgium vs Vietnamese 1 or more Vehicles in Household

COMPARE

Immigrants from Belgium
Race
Ancestry
AfghanAfricanAlaska NativeAlaskan AthabascanAlbanianAleutAlsatianAmericanApacheArabArapahoArgentineanArmenianAssyrian/Chaldean/SyriacAustralianAustrianBahamianBangladeshiBarbadianBasqueBelgianBelizeanBermudanBhutaneseBlackfeetBolivianBrazilianBritishBritish West IndianBulgarianBurmeseCajunCambodianCanadianCape VerdeanCarpatho RusynCelticCentral AmericanCentral American IndianCherokeeCheyenneChickasawChileanChineseChippewaChoctawColombianColvilleComancheCosta RicanCreeCreekCroatianCrowCubanCypriotCzechCzechoslovakianDanishDelawareDominicanDutchDutch West IndianEastern EuropeanEcuadorianEgyptianEnglishEstonianEthiopianEuropeanFijianFilipinoFinnishFrenchFrench American IndianFrench CanadianGermanGerman RussianGhanaianGreekGuamanian/ChamorroGuatemalanGuyaneseHaitianHmongHonduranHopiHoumaHungarianIcelanderIndian (Asian)IndonesianInupiatIranianIraqiIrishIroquoisIsraeliItalianJamaicanJapaneseJordanianKenyanKiowaKoreanLaotianLatvianLebaneseLiberianLithuanianLumbeeLuxembourgerMacedonianMalaysianMalteseMarshalleseMenomineeMexicanMexican American IndianMongolianMoroccanNative HawaiianNavajoNepaleseNew ZealanderNicaraguanNigerianNorthern EuropeanNorwegianOkinawanOsageOttawaPaiutePakistaniPalestinianPanamanianParaguayanPennsylvania GermanPeruvianPimaPolishPortuguesePotawatomiPuebloPuerto RicanPuget Sound SalishRomanianRussianSalvadoranSamoanScandinavianScotch-IrishScottishSeminoleSenegaleseSerbianShoshoneSierra LeoneanSiouxSlavicSlovakSloveneSomaliSouth AfricanSouth AmericanSouth American IndianSoviet UnionSpaniardSpanishSpanish AmericanSpanish American IndianSri LankanSubsaharan AfricanSudaneseSwedishSwissSyrianTaiwaneseThaiTlingit-HaidaTohono O'OdhamTonganTrinidadian and TobagonianTsimshianTurkishU.S. Virgin IslanderUgandanUkrainianUruguayanUteVenezuelanWelshWest IndianYakamaYaquiYugoslavianYumanYup'ikZimbabwean
Immigration
NonimmigrantsImmigrantsAfghanistanAfricaAlbaniaArgentinaArmeniaAsiaAustraliaAustriaBahamasBangladeshBarbadosBelarusBelgiumBelizeBoliviaBosnia and HerzegovinaBrazilBulgariaBurma/MyanmarCabo VerdeCambodiaCameroonCanadaCaribbeanCentral AmericaChileChinaColombiaCongoCosta RicaCroatiaCubaCzechoslovakiaDenmarkDominicaDominican RepublicEastern AfricaEastern AsiaEastern EuropeEcuadorEgyptEl SalvadorEnglandEritreaEthiopiaEuropeFijiFranceGermanyGhanaGreeceGrenadaGuatemalaGuyanaHaitiHondurasHong KongHungaryIndiaIndonesiaIranIraqIrelandIsraelItalyJamaicaJapanJordanKazakhstanKenyaKoreaKuwaitLaosLatin AmericaLatviaLebanonLiberiaLithuaniaMalaysiaMexicoMicronesiaMiddle AfricaMoldovaMoroccoNepalNetherlandsNicaraguaNigeriaNorth AmericaNorth MacedoniaNorthern AfricaNorthern EuropeNorwayOceaniaPakistanPanamaPeruPhilippinesPolandPortugalRomaniaRussiaSaudi ArabiaScotlandSenegalSerbiaSierra LeoneSingaporeSomaliaSouth AfricaSouth AmericaSouth Central AsiaSouth Eastern AsiaSouthern EuropeSpainSri LankaSt. Vincent and the GrenadinesSudanSwedenSwitzerlandSyriaTaiwanThailandTrinidad and TobagoTurkeyUgandaUkraineUruguayUzbekistanVenezuelaVietnamWest IndiesWestern AfricaWestern AsiaWestern EuropeYemenZaireZimbabweAzores
Vietnamese
Race
Ancestry
AfghanAfricanAlaska NativeAlaskan AthabascanAlbanianAleutAlsatianAmericanApacheArabArapahoArgentineanArmenianAssyrian/Chaldean/SyriacAustralianAustrianBahamianBangladeshiBarbadianBasqueBelgianBelizeanBermudanBhutaneseBlackfeetBolivianBrazilianBritishBritish West IndianBulgarianBurmeseCajunCambodianCanadianCape VerdeanCarpatho RusynCelticCentral AmericanCentral American IndianCherokeeCheyenneChickasawChileanChineseChippewaChoctawColombianColvilleComancheCosta RicanCreeCreekCroatianCrowCubanCypriotCzechCzechoslovakianDanishDelawareDominicanDutchDutch West IndianEastern EuropeanEcuadorianEgyptianEnglishEstonianEthiopianEuropeanFijianFilipinoFinnishFrenchFrench American IndianFrench CanadianGermanGerman RussianGhanaianGreekGuamanian/ChamorroGuatemalanGuyaneseHaitianHmongHonduranHopiHoumaHungarianIcelanderIndian (Asian)IndonesianInupiatIranianIraqiIrishIroquoisIsraeliItalianJamaicanJapaneseJordanianKenyanKiowaKoreanLaotianLatvianLebaneseLiberianLithuanianLumbeeLuxembourgerMacedonianMalaysianMalteseMarshalleseMenomineeMexicanMexican American IndianMongolianMoroccanNative HawaiianNavajoNepaleseNew ZealanderNicaraguanNigerianNorthern EuropeanNorwegianOkinawanOsageOttawaPaiutePakistaniPalestinianPanamanianParaguayanPennsylvania GermanPeruvianPimaPolishPortuguesePotawatomiPuebloPuerto RicanPuget Sound SalishRomanianRussianSalvadoranSamoanScandinavianScotch-IrishScottishSeminoleSenegaleseSerbianShoshoneSierra LeoneanSiouxSlavicSlovakSloveneSomaliSouth AfricanSouth AmericanSouth American IndianSoviet UnionSpaniardSpanishSpanish AmericanSpanish American IndianSri LankanSubsaharan AfricanSudaneseSwedishSwissSyrianTaiwaneseThaiTlingit-HaidaTohono O'OdhamTonganTrinidadian and TobagonianTsimshianTurkishU.S. Virgin IslanderUgandanUkrainianUruguayanUteVenezuelanVietnameseWelshWest IndianYakamaYaquiYugoslavianYumanYup'ikZimbabwean
Immigration
NonimmigrantsImmigrantsAfghanistanAfricaAlbaniaArgentinaArmeniaAsiaAustraliaAustriaBahamasBangladeshBarbadosBelarusBelizeBoliviaBosnia and HerzegovinaBrazilBulgariaBurma/MyanmarCabo VerdeCambodiaCameroonCanadaCaribbeanCentral AmericaChileChinaColombiaCongoCosta RicaCroatiaCubaCzechoslovakiaDenmarkDominicaDominican RepublicEastern AfricaEastern AsiaEastern EuropeEcuadorEgyptEl SalvadorEnglandEritreaEthiopiaEuropeFijiFranceGermanyGhanaGreeceGrenadaGuatemalaGuyanaHaitiHondurasHong KongHungaryIndiaIndonesiaIranIraqIrelandIsraelItalyJamaicaJapanJordanKazakhstanKenyaKoreaKuwaitLaosLatin AmericaLatviaLebanonLiberiaLithuaniaMalaysiaMexicoMicronesiaMiddle AfricaMoldovaMoroccoNepalNetherlandsNicaraguaNigeriaNorth AmericaNorth MacedoniaNorthern AfricaNorthern EuropeNorwayOceaniaPakistanPanamaPeruPhilippinesPolandPortugalRomaniaRussiaSaudi ArabiaScotlandSenegalSerbiaSierra LeoneSingaporeSomaliaSouth AfricaSouth AmericaSouth Central AsiaSouth Eastern AsiaSouthern EuropeSpainSri LankaSt. Vincent and the GrenadinesSudanSwedenSwitzerlandSyriaTaiwanThailandTrinidad and TobagoTurkeyUgandaUkraineUruguayUzbekistanVenezuelaVietnamWest IndiesWestern AfricaWestern AsiaWestern EuropeYemenZaireZimbabweAzores
1 or more Vehicles in Household
Income
Poverty
Unemployment
Labor Participation
Family Structure
Vehicle Availability
Education Level
Disability

1 or more Vehicles in Household Comparison

Immigrants from Belgium

Vietnamese

Tragic
Tragic
88.4%
1 OR MORE VEHICLES IN HOUSEHOLD
2.1/ 100
METRIC RATING
243rd/ 347
METRIC RANK
73.8%
1 OR MORE VEHICLES IN HOUSEHOLD
0.0/ 100
METRIC RATING
336th/ 347
METRIC RANK

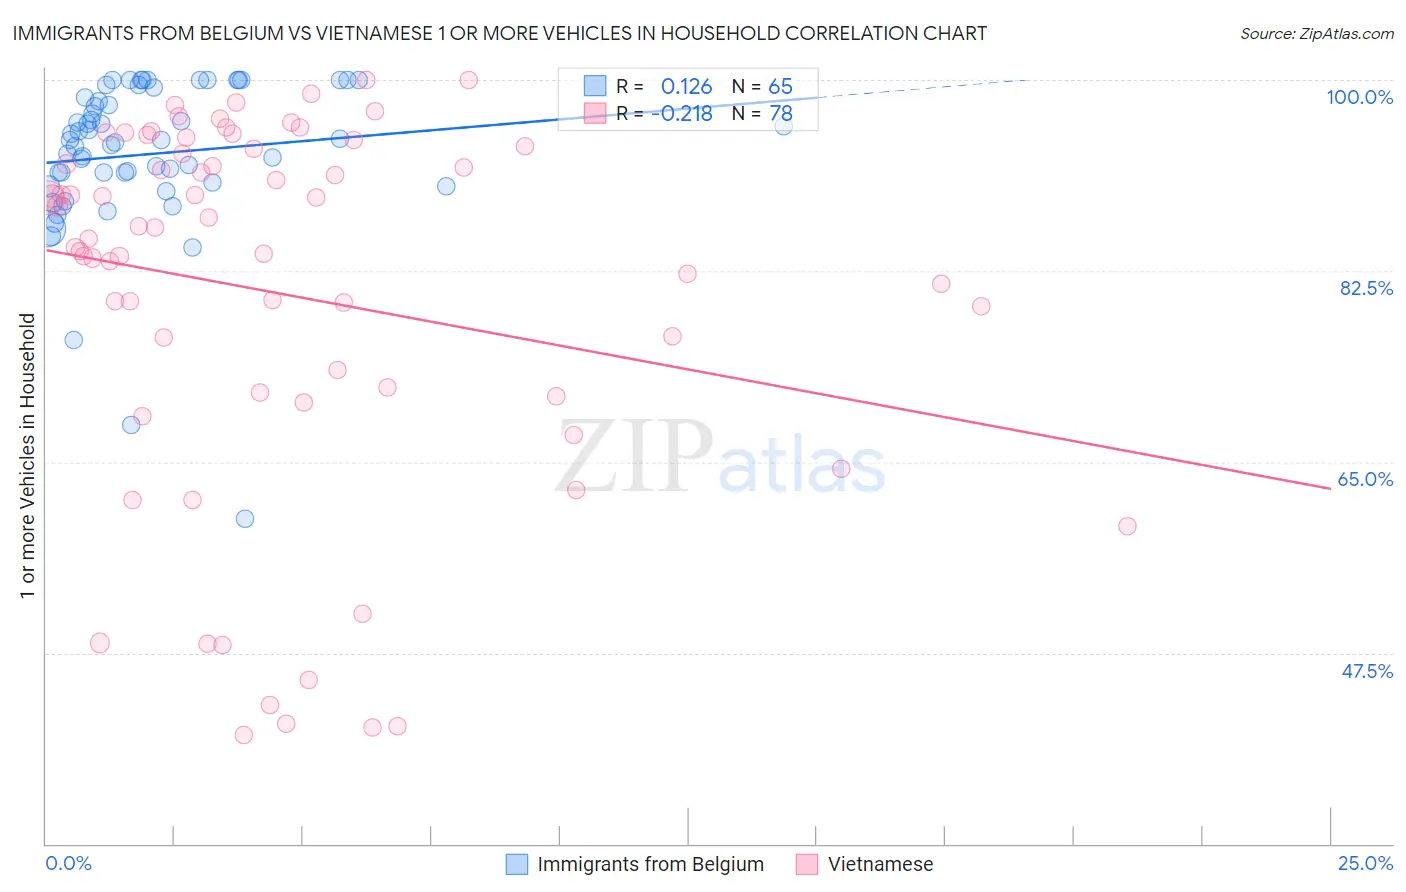
Immigrants from Belgium vs Vietnamese 1 or more Vehicles in Household Correlation Chart

The statistical analysis conducted on geographies consisting of 146,691,899 people shows a poor positive correlation between the proportion of Immigrants from Belgium and percentage of households with 1 or more vehicles available in the United States with a correlation coefficient (R) of 0.126 and weighted average of 88.4%. Similarly, the statistical analysis conducted on geographies consisting of 170,683,703 people shows a weak negative correlation between the proportion of Vietnamese and percentage of households with 1 or more vehicles available in the United States with a correlation coefficient (R) of -0.218 and weighted average of 73.8%, a difference of 19.7%.
Immigrants from Belgium vs Vietnamese 1 or more Vehicles in Household

1 or more Vehicles in Household Correlation Summary

MeasurementImmigrants from BelgiumVietnamese
Minimum59.8%39.9%
Maximum100.0%100.0%
Range40.2%60.1%
Mean93.2%80.4%
Median94.5%86.0%
Interquartile 25% (IQ1)90.5%71.3%
Interquartile 75% (IQ3)98.8%93.7%
Interquartile Range (IQR)8.4%22.4%
Standard Deviation (Sample)7.2%17.1%
Standard Deviation (Population)7.2%17.0%

Similar Demographics by 1 or more Vehicles in Household

Demographics Similar to Immigrants from Belgium by 1 or more Vehicles in Household

In terms of 1 or more vehicles in household, the demographic groups most similar to Immigrants from Belgium are Immigrants from Portugal (88.3%, a difference of 0.020%), Immigrants from Czechoslovakia (88.3%, a difference of 0.040%), Menominee (88.3%, a difference of 0.050%), Turkish (88.4%, a difference of 0.060%), and Immigrants from Honduras (88.3%, a difference of 0.080%).
DemographicsRating | Rank1 or more Vehicles in Household
Immigrants | Pakistan
4.5
/100
|
#236
Tragic
88.6%
Immigrants | Turkey
4.4
/100
|
#237
Tragic
88.6%
Immigrants | Somalia
4.2
/100
|
#238
Tragic
88.6%
Kiowa
3.8
/100
|
#239
Tragic
88.6%
Eastern Europeans
3.0
/100
|
#240
Tragic
88.5%
Taiwanese
2.6
/100
|
#241
Tragic
88.4%
Turks
2.5
/100
|
#242
Tragic
88.4%
Immigrants | Belgium
2.1
/100
|
#243
Tragic
88.4%
Immigrants | Portugal
2.0
/100
|
#244
Tragic
88.3%
Immigrants | Czechoslovakia
1.9
/100
|
#245
Tragic
88.3%
Menominee
1.9
/100
|
#246
Tragic
88.3%
Immigrants | Honduras
1.7
/100
|
#247
Tragic
88.3%
Immigrants | Nigeria
1.5
/100
|
#248
Tragic
88.2%
Blacks/African Americans
1.4
/100
|
#249
Tragic
88.2%
Egyptians
1.2
/100
|
#250
Tragic
88.2%

Demographics Similar to Vietnamese by 1 or more Vehicles in Household

In terms of 1 or more vehicles in household, the demographic groups most similar to Vietnamese are Barbadian (74.0%, a difference of 0.21%), Immigrants from Uzbekistan (73.4%, a difference of 0.62%), Immigrants from Bangladesh (74.3%, a difference of 0.65%), Inupiat (71.5%, a difference of 3.2%), and Immigrants from Ecuador (76.2%, a difference of 3.3%).
DemographicsRating | Rank1 or more Vehicles in Household
Immigrants | Dominica
0.0
/100
|
#329
Tragic
77.8%
Immigrants | Trinidad and Tobago
0.0
/100
|
#330
Tragic
76.8%
West Indians
0.0
/100
|
#331
Tragic
76.4%
Trinidadians and Tobagonians
0.0
/100
|
#332
Tragic
76.3%
Immigrants | Ecuador
0.0
/100
|
#333
Tragic
76.2%
Immigrants | Bangladesh
0.0
/100
|
#334
Tragic
74.3%
Barbadians
0.0
/100
|
#335
Tragic
74.0%
Vietnamese
0.0
/100
|
#336
Tragic
73.8%
Immigrants | Uzbekistan
0.0
/100
|
#337
Tragic
73.4%
Inupiat
0.0
/100
|
#338
Tragic
71.5%
Guyanese
0.0
/100
|
#339
Tragic
70.8%
Dominicans
0.0
/100
|
#340
Tragic
70.7%
Immigrants | Barbados
0.0
/100
|
#341
Tragic
70.6%
Immigrants | Guyana
0.0
/100
|
#342
Tragic
70.6%
British West Indians
0.0
/100
|
#343
Tragic
70.4%