Chinese vs Ukrainian 1 or more Vehicles in Household

COMPARE

Chinese
Race
Ancestry
AfghanAfricanAlaska NativeAlaskan AthabascanAlbanianAleutAlsatianAmericanApacheArabArapahoArgentineanArmenianAssyrian/Chaldean/SyriacAustralianAustrianBahamianBangladeshiBarbadianBasqueBelgianBelizeanBermudanBhutaneseBlackfeetBolivianBrazilianBritishBritish West IndianBulgarianBurmeseCajunCambodianCanadianCape VerdeanCarpatho RusynCelticCentral AmericanCentral American IndianCherokeeCheyenneChickasawChileanChineseChippewaChoctawColombianColvilleComancheCosta RicanCreeCreekCroatianCrowCubanCypriotCzechCzechoslovakianDanishDelawareDominicanDutchDutch West IndianEastern EuropeanEcuadorianEgyptianEnglishEstonianEthiopianEuropeanFijianFilipinoFinnishFrenchFrench American IndianFrench CanadianGermanGerman RussianGhanaianGreekGuamanian/ChamorroGuatemalanGuyaneseHaitianHmongHonduranHopiHoumaHungarianIcelanderIndian (Asian)IndonesianInupiatIranianIraqiIrishIroquoisIsraeliItalianJamaicanJapaneseJordanianKenyanKiowaKoreanLaotianLatvianLebaneseLiberianLithuanianLumbeeLuxembourgerMacedonianMalaysianMalteseMarshalleseMenomineeMexicanMexican American IndianMongolianMoroccanNative HawaiianNavajoNepaleseNew ZealanderNicaraguanNigerianNorthern EuropeanNorwegianOkinawanOsageOttawaPaiutePakistaniPalestinianPanamanianParaguayanPennsylvania GermanPeruvianPimaPolishPortuguesePotawatomiPuebloPuerto RicanPuget Sound SalishRomanianRussianSalvadoranSamoanScandinavianScotch-IrishScottishSeminoleSenegaleseSerbianShoshoneSierra LeoneanSiouxSlavicSlovakSloveneSomaliSouth AfricanSouth AmericanSouth American IndianSoviet UnionSpaniardSpanishSpanish AmericanSpanish American IndianSri LankanSubsaharan AfricanSudaneseSwedishSwissSyrianTaiwaneseThaiTlingit-HaidaTohono O'OdhamTonganTrinidadian and TobagonianTsimshianTurkishU.S. Virgin IslanderUgandanUruguayanUteVenezuelanVietnameseWelshWest IndianYakamaYaquiYugoslavianYumanYup'ikZimbabwean
Immigration
NonimmigrantsImmigrantsAfghanistanAfricaAlbaniaArgentinaArmeniaAsiaAustraliaAustriaBahamasBangladeshBarbadosBelarusBelgiumBelizeBoliviaBosnia and HerzegovinaBrazilBulgariaBurma/MyanmarCabo VerdeCambodiaCameroonCanadaCaribbeanCentral AmericaChileChinaColombiaCongoCosta RicaCroatiaCubaCzechoslovakiaDenmarkDominicaDominican RepublicEastern AfricaEastern AsiaEastern EuropeEcuadorEgyptEl SalvadorEnglandEritreaEthiopiaEuropeFijiFranceGermanyGhanaGreeceGrenadaGuatemalaGuyanaHaitiHondurasHong KongHungaryIndiaIndonesiaIranIraqIrelandIsraelItalyJamaicaJapanJordanKazakhstanKenyaKoreaKuwaitLaosLatin AmericaLatviaLebanonLiberiaLithuaniaMalaysiaMexicoMicronesiaMiddle AfricaMoldovaMoroccoNepalNetherlandsNicaraguaNigeriaNorth AmericaNorth MacedoniaNorthern AfricaNorthern EuropeNorwayOceaniaPakistanPanamaPeruPhilippinesPolandPortugalRomaniaRussiaSaudi ArabiaScotlandSenegalSerbiaSierra LeoneSingaporeSomaliaSouth AfricaSouth AmericaSouth Central AsiaSouth Eastern AsiaSouthern EuropeSpainSri LankaSt. Vincent and the GrenadinesSudanSwedenSwitzerlandSyriaTaiwanThailandTrinidad and TobagoTurkeyUgandaUkraineUruguayUzbekistanVenezuelaVietnamWest IndiesWestern AfricaWestern AsiaWestern EuropeYemenZaireZimbabweAzores
Ukrainian
Race
Ancestry
AfghanAfricanAlaska NativeAlaskan AthabascanAlbanianAleutAlsatianAmericanApacheArabArapahoArgentineanArmenianAssyrian/Chaldean/SyriacAustralianAustrianBahamianBangladeshiBarbadianBasqueBelgianBelizeanBermudanBhutaneseBlackfeetBolivianBrazilianBritishBritish West IndianBulgarianBurmeseCajunCambodianCanadianCape VerdeanCarpatho RusynCelticCentral AmericanCentral American IndianCherokeeCheyenneChickasawChileanChippewaChoctawColombianColvilleComancheCosta RicanCreeCreekCroatianCrowCubanCypriotCzechCzechoslovakianDanishDelawareDominicanDutchDutch West IndianEastern EuropeanEcuadorianEgyptianEnglishEstonianEthiopianEuropeanFijianFilipinoFinnishFrenchFrench American IndianFrench CanadianGermanGerman RussianGhanaianGreekGuamanian/ChamorroGuatemalanGuyaneseHaitianHmongHonduranHopiHoumaHungarianIcelanderIndian (Asian)IndonesianInupiatIranianIraqiIrishIroquoisIsraeliItalianJamaicanJapaneseJordanianKenyanKiowaKoreanLaotianLatvianLebaneseLiberianLithuanianLumbeeLuxembourgerMacedonianMalaysianMalteseMarshalleseMenomineeMexicanMexican American IndianMongolianMoroccanNative HawaiianNavajoNepaleseNew ZealanderNicaraguanNigerianNorthern EuropeanNorwegianOkinawanOsageOttawaPaiutePakistaniPalestinianPanamanianParaguayanPennsylvania GermanPeruvianPimaPolishPortuguesePotawatomiPuebloPuerto RicanPuget Sound SalishRomanianRussianSalvadoranSamoanScandinavianScotch-IrishScottishSeminoleSenegaleseSerbianShoshoneSierra LeoneanSiouxSlavicSlovakSloveneSomaliSouth AfricanSouth AmericanSouth American IndianSoviet UnionSpaniardSpanishSpanish AmericanSpanish American IndianSri LankanSubsaharan AfricanSudaneseSwedishSwissSyrianTaiwaneseThaiTlingit-HaidaTohono O'OdhamTonganTrinidadian and TobagonianTsimshianTurkishU.S. Virgin IslanderUgandanUkrainianUruguayanUteVenezuelanVietnameseWelshWest IndianYakamaYaquiYugoslavianYumanYup'ikZimbabwean
Immigration
NonimmigrantsImmigrantsAfghanistanAfricaAlbaniaArgentinaArmeniaAsiaAustraliaAustriaBahamasBangladeshBarbadosBelarusBelgiumBelizeBoliviaBosnia and HerzegovinaBrazilBulgariaBurma/MyanmarCabo VerdeCambodiaCameroonCanadaCaribbeanCentral AmericaChileChinaColombiaCongoCosta RicaCroatiaCubaCzechoslovakiaDenmarkDominicaDominican RepublicEastern AfricaEastern AsiaEastern EuropeEcuadorEgyptEl SalvadorEnglandEritreaEthiopiaEuropeFijiFranceGermanyGhanaGreeceGrenadaGuatemalaGuyanaHaitiHondurasHong KongHungaryIndiaIndonesiaIranIraqIrelandIsraelItalyJamaicaJapanJordanKazakhstanKenyaKoreaKuwaitLaosLatin AmericaLatviaLebanonLiberiaLithuaniaMalaysiaMexicoMicronesiaMiddle AfricaMoldovaMoroccoNepalNetherlandsNicaraguaNigeriaNorth AmericaNorth MacedoniaNorthern AfricaNorthern EuropeNorwayOceaniaPakistanPanamaPeruPhilippinesPolandPortugalRomaniaRussiaSaudi ArabiaScotlandSenegalSerbiaSierra LeoneSingaporeSomaliaSouth AfricaSouth AmericaSouth Central AsiaSouth Eastern AsiaSouthern EuropeSpainSri LankaSt. Vincent and the GrenadinesSudanSwedenSwitzerlandSyriaTaiwanThailandTrinidad and TobagoTurkeyUgandaUkraineUruguayUzbekistanVenezuelaVietnamWest IndiesWestern AfricaWestern AsiaWestern EuropeYemenZaireZimbabweAzores
1 or more Vehicles in Household
Income
Poverty
Unemployment
Labor Participation
Family Structure
Vehicle Availability
Education Level
Disability

1 or more Vehicles in Household Comparison

Chinese

Ukrainians

Exceptional
Average
91.9%
1 OR MORE VEHICLES IN HOUSEHOLD
99.8/ 100
METRIC RATING
63rd/ 347
METRIC RANK
89.6%
1 OR MORE VEHICLES IN HOUSEHOLD
42.4/ 100
METRIC RATING
182nd/ 347
METRIC RANK

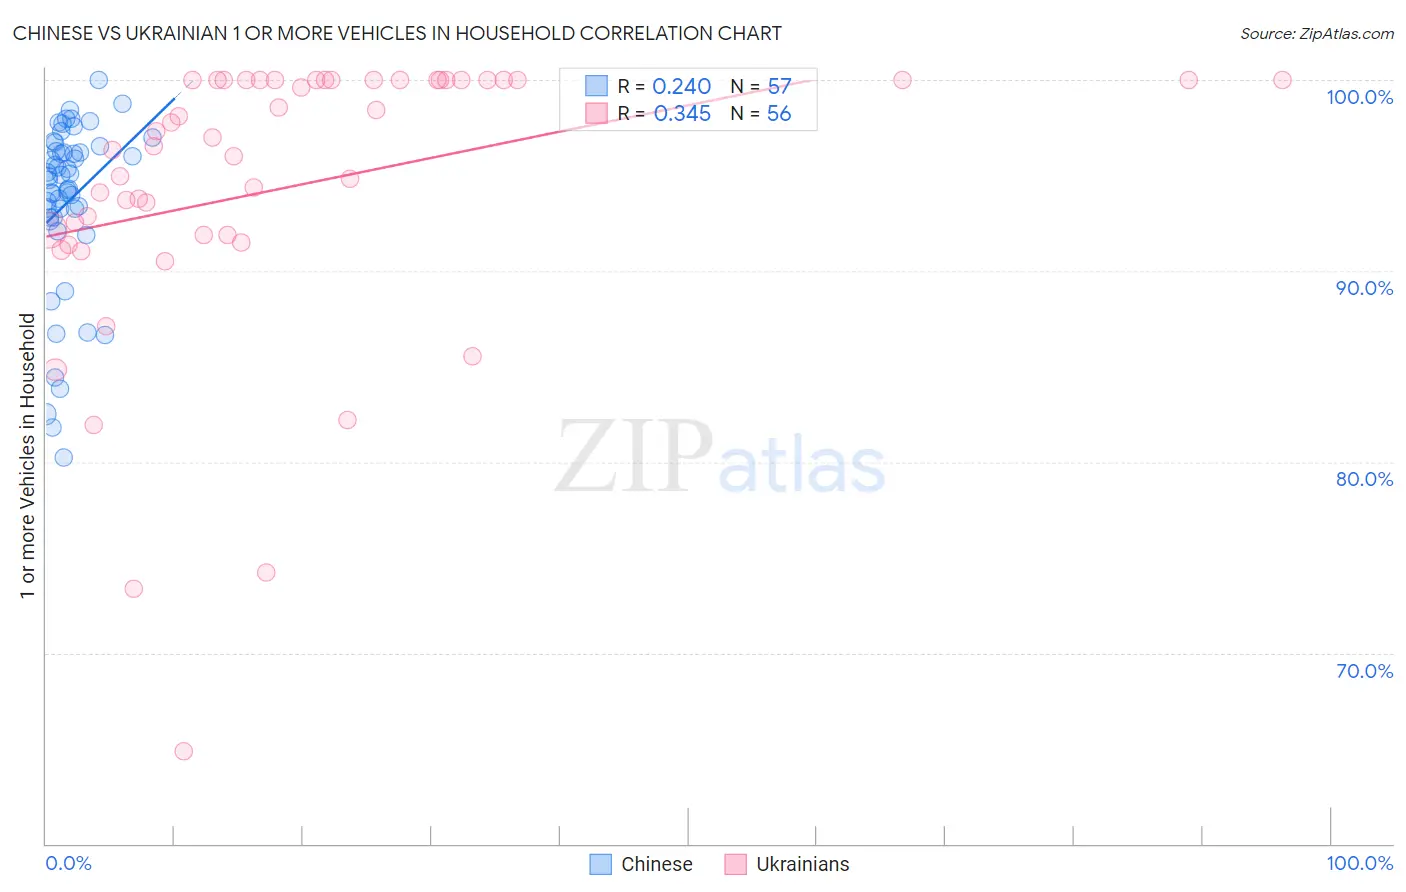
Chinese vs Ukrainian 1 or more Vehicles in Household Correlation Chart

The statistical analysis conducted on geographies consisting of 64,801,742 people shows a weak positive correlation between the proportion of Chinese and percentage of households with 1 or more vehicles available in the United States with a correlation coefficient (R) of 0.240 and weighted average of 91.9%. Similarly, the statistical analysis conducted on geographies consisting of 448,299,681 people shows a mild positive correlation between the proportion of Ukrainians and percentage of households with 1 or more vehicles available in the United States with a correlation coefficient (R) of 0.345 and weighted average of 89.6%, a difference of 2.5%.
Chinese vs Ukrainian 1 or more Vehicles in Household

1 or more Vehicles in Household Correlation Summary

MeasurementChineseUkrainian
Minimum80.2%64.9%
Maximum100.0%100.0%
Range19.8%35.1%
Mean93.6%94.4%
Median94.9%96.8%
Interquartile 25% (IQ1)92.8%91.9%
Interquartile 75% (IQ3)96.4%100.0%
Interquartile Range (IQR)3.6%8.1%
Standard Deviation (Sample)4.5%7.5%
Standard Deviation (Population)4.5%7.4%

Similar Demographics by 1 or more Vehicles in Household

Demographics Similar to Chinese by 1 or more Vehicles in Household

In terms of 1 or more vehicles in household, the demographic groups most similar to Chinese are Croatian (91.9%, a difference of 0.010%), Thai (91.9%, a difference of 0.020%), Immigrants from India (91.9%, a difference of 0.030%), Immigrants from Laos (91.8%, a difference of 0.030%), and Slovak (91.9%, a difference of 0.040%).
DemographicsRating | Rank1 or more Vehicles in Household
Immigrants | Venezuela
99.9
/100
|
#56
Exceptional
92.0%
Iraqis
99.8
/100
|
#57
Exceptional
91.9%
Immigrants | Mexico
99.8
/100
|
#58
Exceptional
91.9%
Venezuelans
99.8
/100
|
#59
Exceptional
91.9%
Slovaks
99.8
/100
|
#60
Exceptional
91.9%
Immigrants | India
99.8
/100
|
#61
Exceptional
91.9%
Thais
99.8
/100
|
#62
Exceptional
91.9%
Chinese
99.8
/100
|
#63
Exceptional
91.9%
Croatians
99.8
/100
|
#64
Exceptional
91.9%
Immigrants | Laos
99.8
/100
|
#65
Exceptional
91.8%
Canadians
99.8
/100
|
#66
Exceptional
91.8%
Spaniards
99.8
/100
|
#67
Exceptional
91.8%
Immigrants | Scotland
99.7
/100
|
#68
Exceptional
91.8%
Palestinians
99.7
/100
|
#69
Exceptional
91.7%
Lithuanians
99.7
/100
|
#70
Exceptional
91.7%

Demographics Similar to Ukrainians by 1 or more Vehicles in Household

In terms of 1 or more vehicles in household, the demographic groups most similar to Ukrainians are Immigrants from Ethiopia (89.6%, a difference of 0.0%), Arab (89.6%, a difference of 0.010%), Ethiopian (89.6%, a difference of 0.020%), Immigrants from El Salvador (89.6%, a difference of 0.030%), and German Russian (89.6%, a difference of 0.030%).
DemographicsRating | Rank1 or more Vehicles in Household
Immigrants | Burma/Myanmar
47.6
/100
|
#175
Average
89.7%
Immigrants | Sudan
47.1
/100
|
#176
Average
89.7%
Hmong
45.8
/100
|
#177
Average
89.6%
Immigrants | El Salvador
44.1
/100
|
#178
Average
89.6%
German Russians
44.0
/100
|
#179
Average
89.6%
Arabs
43.3
/100
|
#180
Average
89.6%
Immigrants | Ethiopia
42.5
/100
|
#181
Average
89.6%
Ukrainians
42.4
/100
|
#182
Average
89.6%
Ethiopians
41.2
/100
|
#183
Average
89.6%
Immigrants | Bulgaria
40.7
/100
|
#184
Average
89.6%
Immigrants | Brazil
40.1
/100
|
#185
Average
89.6%
Pueblo
39.9
/100
|
#186
Fair
89.6%
South Americans
39.6
/100
|
#187
Fair
89.5%
Immigrants | Nepal
38.9
/100
|
#188
Fair
89.5%
Carpatho Rusyns
37.8
/100
|
#189
Fair
89.5%