Zip Codes with the Highest Percentage of Population with a Degree in Liberal Arts and History in Sterling, VA
RELATED REPORTS & OPTIONS
Liberal Arts and History
Sterling
Compare Zip Codes
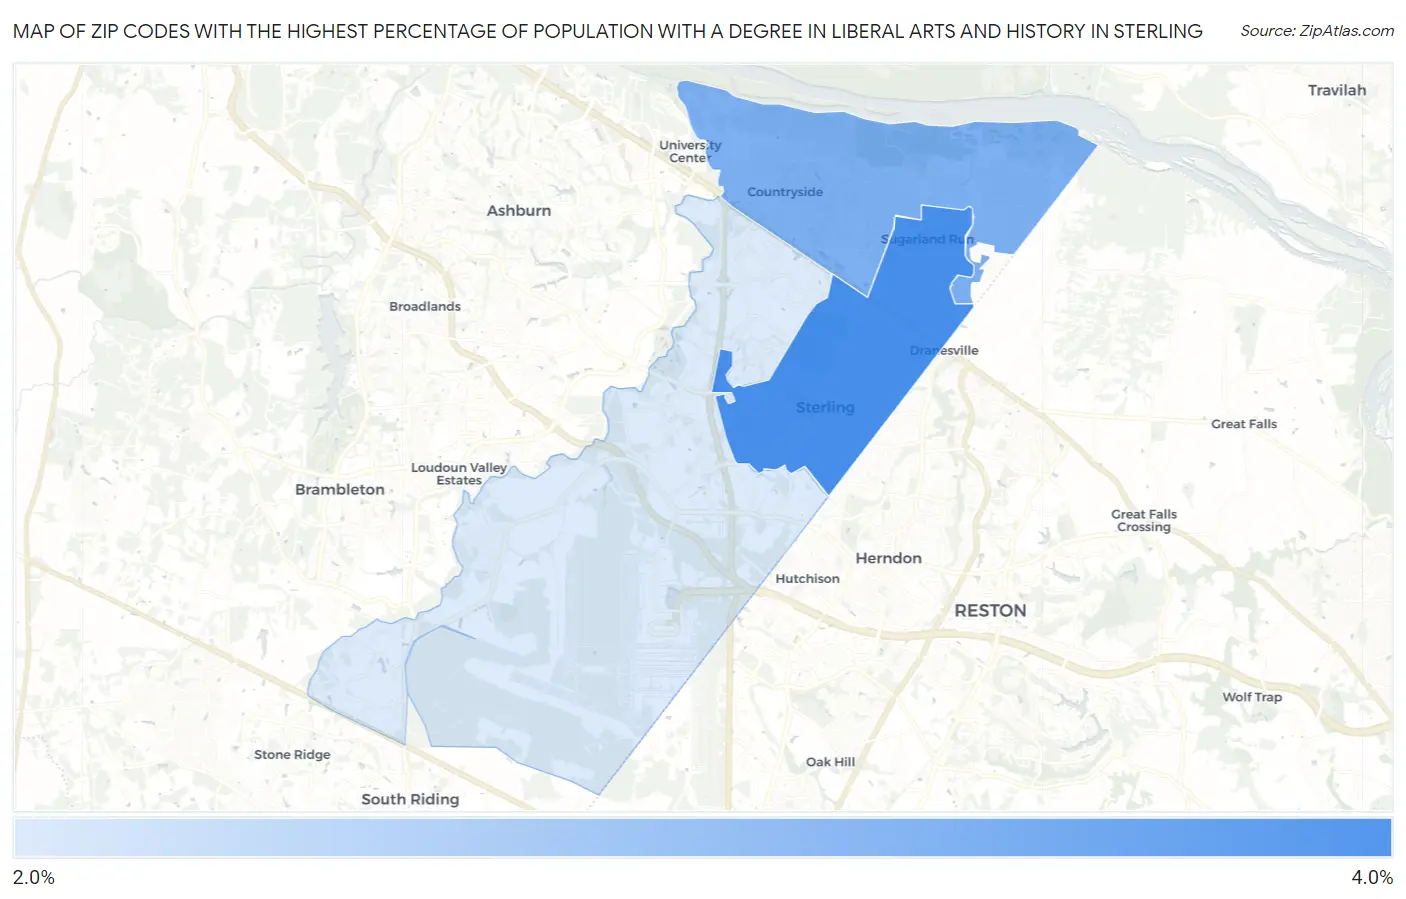
Map of Zip Codes with the Highest Percentage of Population with a Degree in Liberal Arts and History in Sterling
2.6%
4.0%
Zip Codes with the Highest Percentage of Population with a Degree in Liberal Arts and History in Sterling, VA
| Zip Code | % Graduates | vs State | vs National | |
| 1. | 20164 | 4.0% | 5.9%(-1.89)#504 | 4.9%(-0.909)#14,929 |
| 2. | 20165 | 3.5% | 5.9%(-2.38)#534 | 4.9%(-1.39)#16,665 |
| 3. | 20166 | 2.6% | 5.9%(-3.24)#580 | 4.9%(-2.26)#19,621 |
1
Common Questions
What are the Top Zip Codes with the Highest Percentage of Population with a Degree in Liberal Arts and History in Sterling, VA?
Top Zip Codes with the Highest Percentage of Population with a Degree in Liberal Arts and History in Sterling, VA are:
What zip code has the Highest Percentage of Population with a Degree in Liberal Arts and History in Sterling, VA?
20164 has the Highest Percentage of Population with a Degree in Liberal Arts and History in Sterling, VA with 4.0%.
What is the Percentage of Population with a Degree in Liberal Arts and History in Sterling, VA?
Percentage of Population with a Degree in Liberal Arts and History in Sterling is 4.7%.
What is the Percentage of Population with a Degree in Liberal Arts and History in Virginia?
Percentage of Population with a Degree in Liberal Arts and History in Virginia is 5.9%.
What is the Percentage of Population with a Degree in Liberal Arts and History in the United States?
Percentage of Population with a Degree in Liberal Arts and History in the United States is 4.9%.