Zip Codes with the Highest Percentage of Population with a Degree in Liberal Arts and History in Portsmouth, VA
RELATED REPORTS & OPTIONS
Liberal Arts and History
Portsmouth
Compare Zip Codes
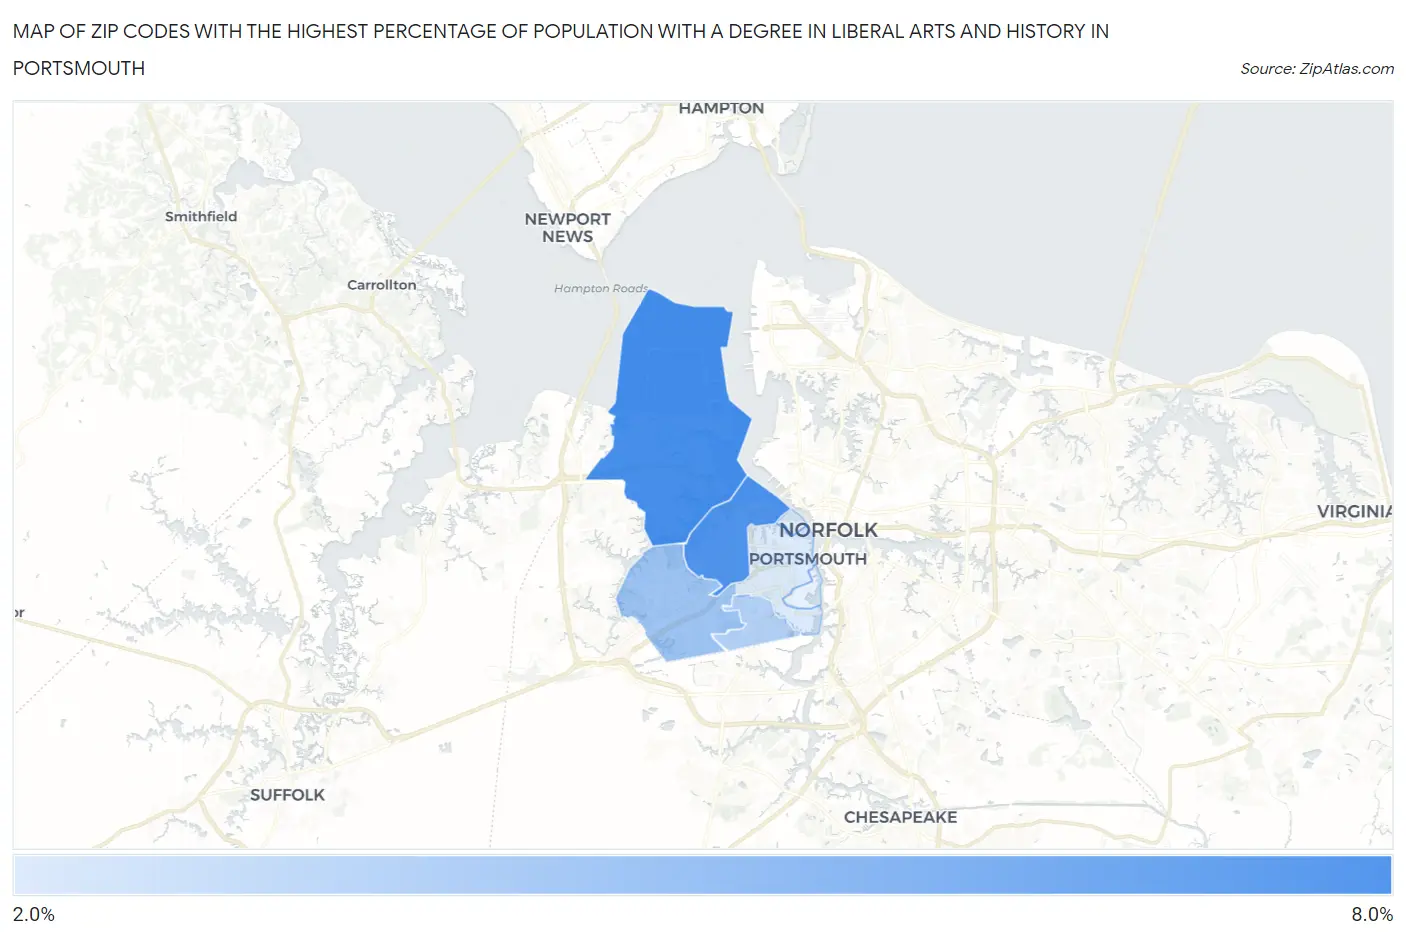
Map of Zip Codes with the Highest Percentage of Population with a Degree in Liberal Arts and History in Portsmouth
3.0%
7.4%
Zip Codes with the Highest Percentage of Population with a Degree in Liberal Arts and History in Portsmouth, VA
| Zip Code | % Graduates | vs State | vs National | |
| 1. | 23703 | 7.4% | 5.9%(+1.58)#240 | 4.9%(+2.56)#5,692 |
| 2. | 23707 | 7.2% | 5.9%(+1.30)#263 | 4.9%(+2.28)#6,125 |
| 3. | 23701 | 4.8% | 5.9%(-1.05)#432 | 4.9%(-0.063)#11,946 |
| 4. | 23702 | 4.2% | 5.9%(-1.67)#485 | 4.9%(-0.686)#14,069 |
| 5. | 23704 | 3.0% | 5.9%(-2.88)#564 | 4.9%(-1.89)#18,433 |
1
Common Questions
What are the Top 5 Zip Codes with the Highest Percentage of Population with a Degree in Liberal Arts and History in Portsmouth, VA?
Top 5 Zip Codes with the Highest Percentage of Population with a Degree in Liberal Arts and History in Portsmouth, VA are:
What zip code has the Highest Percentage of Population with a Degree in Liberal Arts and History in Portsmouth, VA?
23703 has the Highest Percentage of Population with a Degree in Liberal Arts and History in Portsmouth, VA with 7.4%.
What is the Percentage of Population with a Degree in Liberal Arts and History in Portsmouth, VA?
Percentage of Population with a Degree in Liberal Arts and History in Portsmouth is 5.8%.
What is the Percentage of Population with a Degree in Liberal Arts and History in Virginia?
Percentage of Population with a Degree in Liberal Arts and History in Virginia is 5.9%.
What is the Percentage of Population with a Degree in Liberal Arts and History in the United States?
Percentage of Population with a Degree in Liberal Arts and History in the United States is 4.9%.