Zip Codes with the Highest Percentage of Population with a Degree in Liberal Arts and History in Manassas, VA
RELATED REPORTS & OPTIONS
Liberal Arts and History
Manassas
Compare Zip Codes
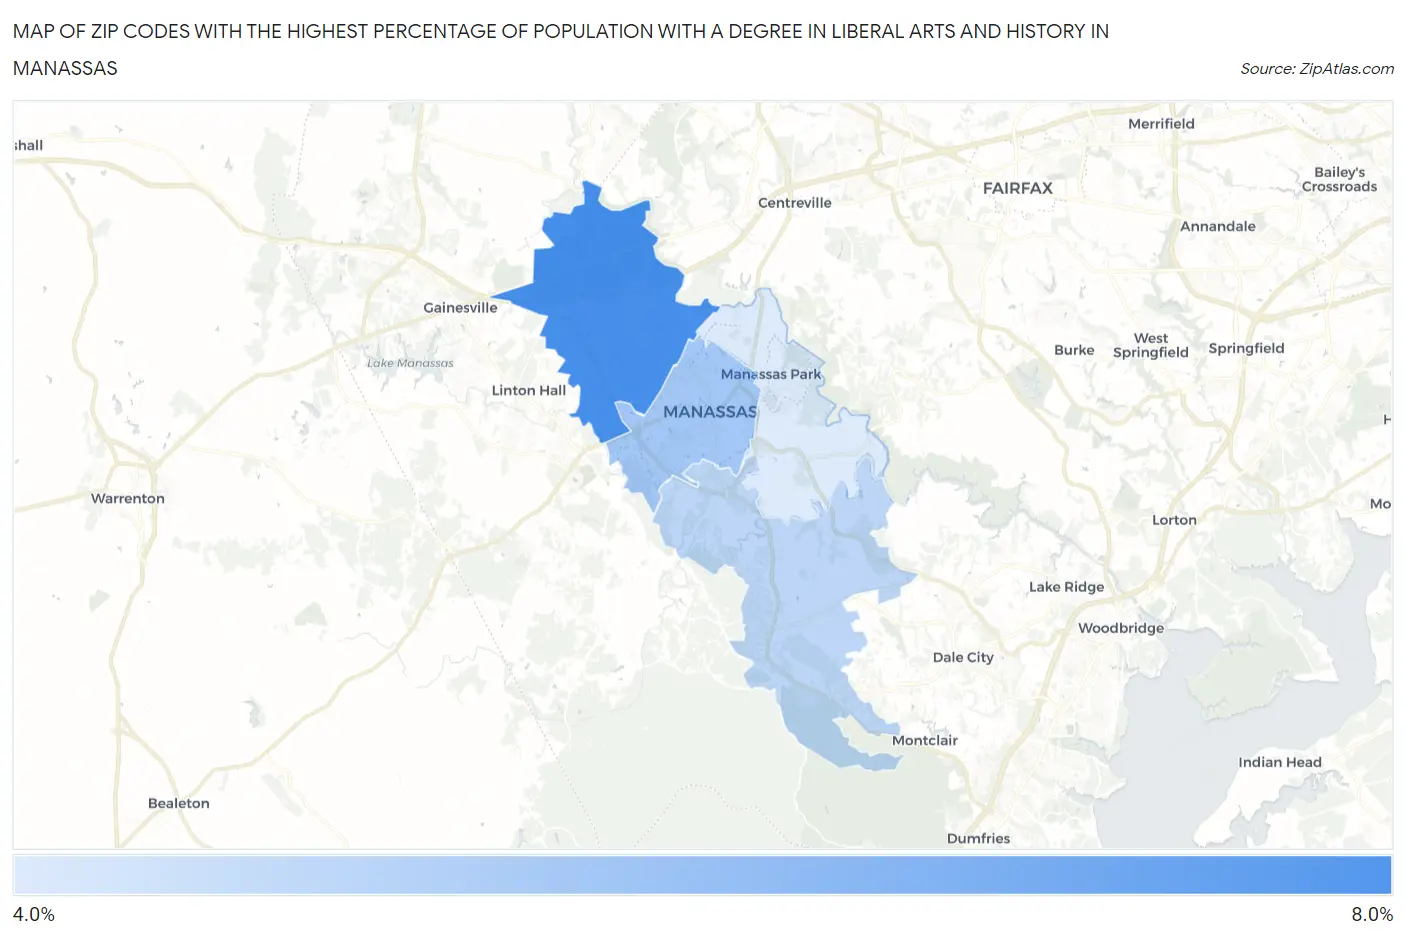
Map of Zip Codes with the Highest Percentage of Population with a Degree in Liberal Arts and History in Manassas
4.5%
7.9%
Zip Codes with the Highest Percentage of Population with a Degree in Liberal Arts and History in Manassas, VA
| Zip Code | % Graduates | vs State | vs National | |
| 1. | 20109 | 7.9% | 5.9%(+2.04)#215 | 4.9%(+3.02)#5,038 |
| 2. | 20110 | 5.8% | 5.9%(-0.075)#354 | 4.9%(+0.908)#9,099 |
| 3. | 20112 | 5.2% | 5.9%(-0.676)#401 | 4.9%(+0.307)#10,784 |
| 4. | 20111 | 4.5% | 5.9%(-1.39)#466 | 4.9%(-0.412)#13,083 |
1
Common Questions
What are the Top 3 Zip Codes with the Highest Percentage of Population with a Degree in Liberal Arts and History in Manassas, VA?
Top 3 Zip Codes with the Highest Percentage of Population with a Degree in Liberal Arts and History in Manassas, VA are:
What zip code has the Highest Percentage of Population with a Degree in Liberal Arts and History in Manassas, VA?
20109 has the Highest Percentage of Population with a Degree in Liberal Arts and History in Manassas, VA with 7.9%.
What is the Percentage of Population with a Degree in Liberal Arts and History in Manassas, VA?
Percentage of Population with a Degree in Liberal Arts and History in Manassas is 5.5%.
What is the Percentage of Population with a Degree in Liberal Arts and History in Virginia?
Percentage of Population with a Degree in Liberal Arts and History in Virginia is 5.9%.
What is the Percentage of Population with a Degree in Liberal Arts and History in the United States?
Percentage of Population with a Degree in Liberal Arts and History in the United States is 4.9%.