Zip Codes with the Highest Percentage of Population Employed in Architecture & Engineering in Roanoke, VA
RELATED REPORTS & OPTIONS
Architecture & Engineering
Roanoke
Compare Zip Codes
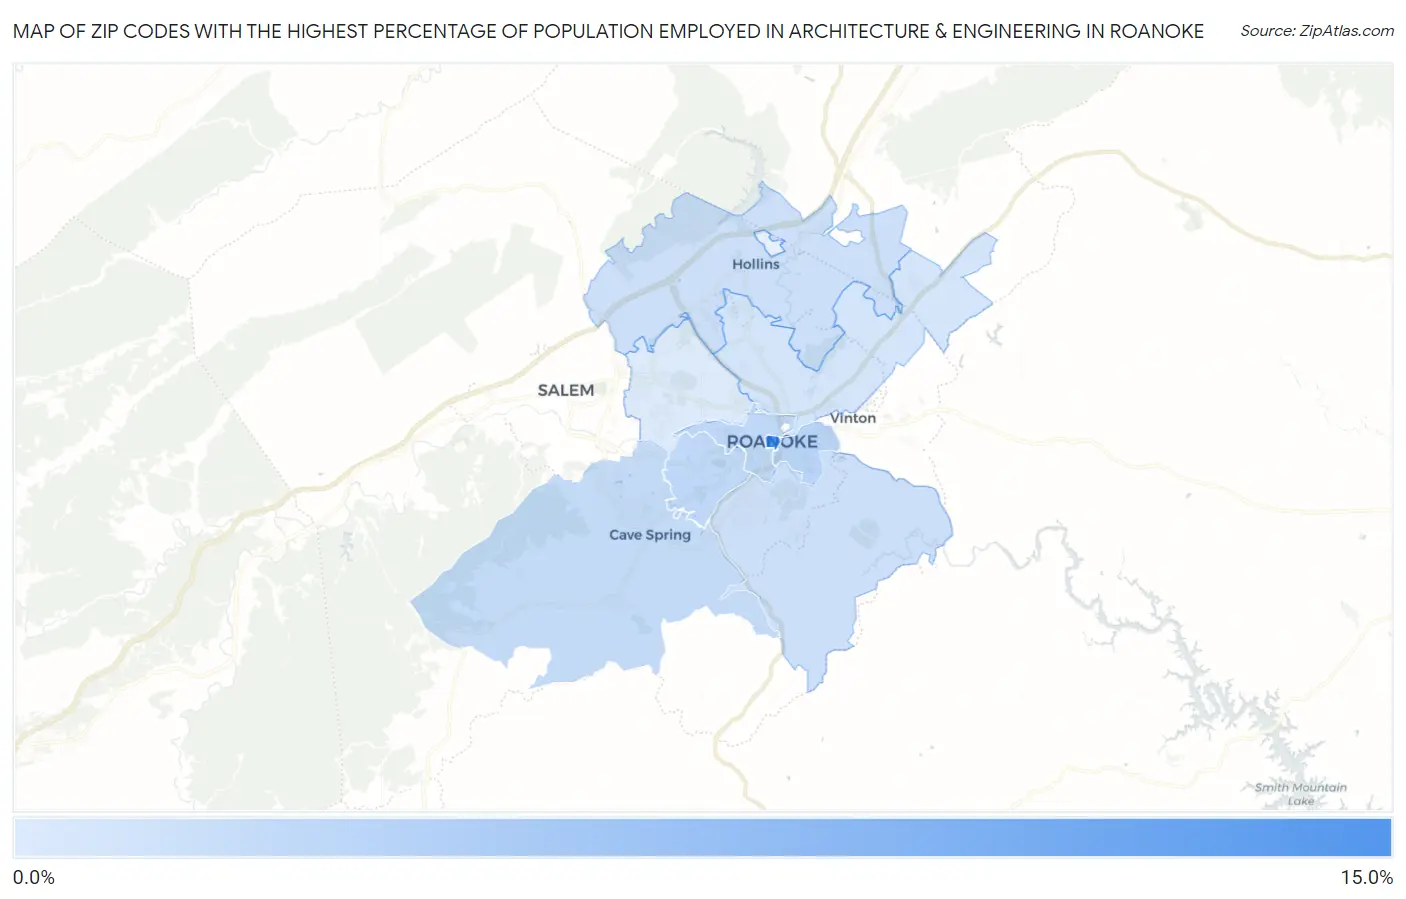
Map of Zip Codes with the Highest Percentage of Population Employed in Architecture & Engineering in Roanoke
0.30%
10.3%
Zip Codes with the Highest Percentage of Population Employed in Architecture & Engineering in Roanoke, VA
| Zip Code | % Employed | vs State | vs National | |
| 1. | 24011 | 10.3% | 2.3%(+7.96)#13 | 2.1%(+8.12)#326 |
| 2. | 24013 | 2.5% | 2.3%(+0.242)#199 | 2.1%(+0.397)#6,804 |
| 3. | 24016 | 2.3% | 2.3%(-0.049)#237 | 2.1%(+0.106)#8,169 |
| 4. | 24015 | 2.2% | 2.3%(-0.154)#251 | 2.1%(+0.002)#8,755 |
| 5. | 24018 | 1.9% | 2.3%(-0.414)#301 | 2.1%(-0.259)#10,307 |
| 6. | 24014 | 1.3% | 2.3%(-1.00)#395 | 2.1%(-0.849)#14,301 |
| 7. | 24019 | 1.3% | 2.3%(-1.01)#396 | 2.1%(-0.854)#14,335 |
| 8. | 24012 | 0.82% | 2.3%(-1.48)#480 | 2.1%(-1.32)#17,955 |
| 9. | 24017 | 0.30% | 2.3%(-2.00)#542 | 2.1%(-1.84)#21,528 |
1
Common Questions
What are the Top 5 Zip Codes with the Highest Percentage of Population Employed in Architecture & Engineering in Roanoke, VA?
Top 5 Zip Codes with the Highest Percentage of Population Employed in Architecture & Engineering in Roanoke, VA are:
What zip code has the Highest Percentage of Population Employed in Architecture & Engineering in Roanoke, VA?
24011 has the Highest Percentage of Population Employed in Architecture & Engineering in Roanoke, VA with 10.3%.
What is the Percentage of Population Employed in Architecture & Engineering in Roanoke, VA?
Percentage of Population Employed in Architecture & Engineering in Roanoke is 1.5%.
What is the Percentage of Population Employed in Architecture & Engineering in Virginia?
Percentage of Population Employed in Architecture & Engineering in Virginia is 2.3%.
What is the Percentage of Population Employed in Architecture & Engineering in the United States?
Percentage of Population Employed in Architecture & Engineering in the United States is 2.1%.