White/Caucasian vs Assyrian/Chaldean/Syriac Unemployment Among Ages 55 to 59 years
COMPARE
White/Caucasian
Assyrian/Chaldean/Syriac
Unemployment Among Ages 55 to 59 years
Unemployment Among Ages 55 to 59 years Comparison
Whites/Caucasians
Assyrians/Chaldeans/Syriacs
4.7%
UNEMPLOYMENT AMONG AGES 55 TO 59 YEARS
90.7/ 100
METRIC RATING
119th/ 347
METRIC RANK
4.5%
UNEMPLOYMENT AMONG AGES 55 TO 59 YEARS
99.9/ 100
METRIC RATING
38th/ 347
METRIC RANK
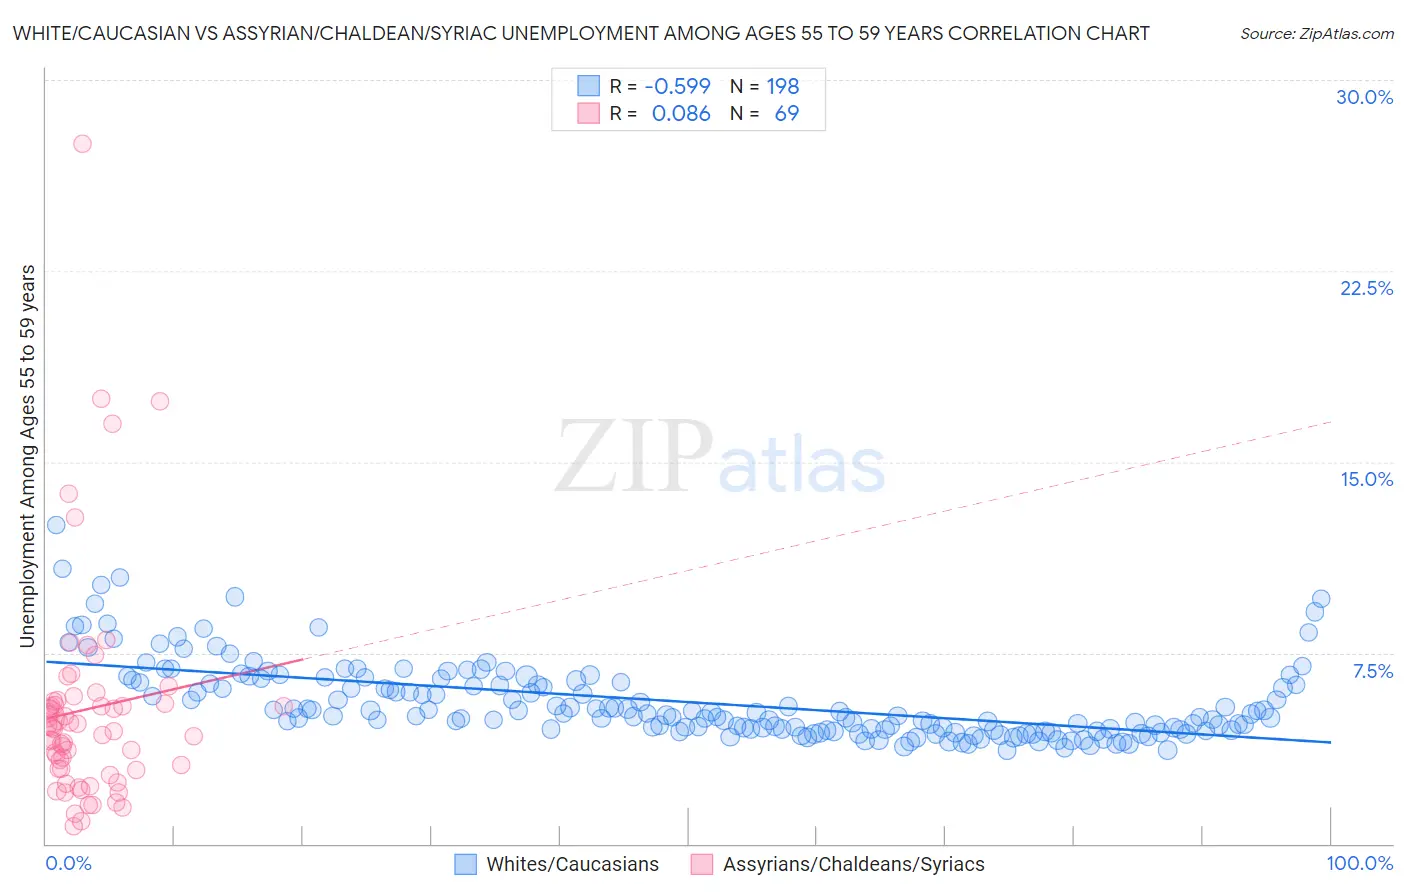
White/Caucasian vs Assyrian/Chaldean/Syriac Unemployment Among Ages 55 to 59 years Correlation Chart
The statistical analysis conducted on geographies consisting of 492,133,782 people shows a substantial negative correlation between the proportion of Whites/Caucasians and unemployment rate among population between the ages 55 and 59 in the United States with a correlation coefficient (R) of -0.599 and weighted average of 4.7%. Similarly, the statistical analysis conducted on geographies consisting of 108,497,216 people shows a slight positive correlation between the proportion of Assyrians/Chaldeans/Syriacs and unemployment rate among population between the ages 55 and 59 in the United States with a correlation coefficient (R) of 0.086 and weighted average of 4.5%, a difference of 4.9%.
Unemployment Among Ages 55 to 59 years Correlation Summary
| Measurement | White/Caucasian | Assyrian/Chaldean/Syriac |
| Minimum | 3.7% | 0.69% |
| Maximum | 12.5% | 27.5% |
| Range | 8.8% | 26.8% |
| Mean | 5.6% | 5.3% |
| Median | 5.1% | 4.5% |
| Interquartile 25% (IQ1) | 4.5% | 2.9% |
| Interquartile 75% (IQ3) | 6.3% | 5.6% |
| Interquartile Range (IQR) | 1.9% | 2.6% |
| Standard Deviation (Sample) | 1.5% | 4.4% |
| Standard Deviation (Population) | 1.5% | 4.4% |
Similar Demographics by Unemployment Among Ages 55 to 59 years
Demographics Similar to Whites/Caucasians by Unemployment Among Ages 55 to 59 years
In terms of unemployment among ages 55 to 59 years, the demographic groups most similar to Whites/Caucasians are Immigrants from Chile (4.7%, a difference of 0.0%), Turkish (4.7%, a difference of 0.020%), Asian (4.7%, a difference of 0.020%), South American Indian (4.7%, a difference of 0.030%), and Bangladeshi (4.7%, a difference of 0.080%).
| Demographics | Rating | Rank | Unemployment Among Ages 55 to 59 years |
| Afghans | 92.1 /100 | #112 | Exceptional 4.7% |
| Immigrants | Spain | 91.4 /100 | #113 | Exceptional 4.7% |
| Bangladeshis | 91.3 /100 | #114 | Exceptional 4.7% |
| South American Indians | 90.9 /100 | #115 | Exceptional 4.7% |
| Turks | 90.9 /100 | #116 | Exceptional 4.7% |
| Asians | 90.8 /100 | #117 | Exceptional 4.7% |
| Immigrants | Chile | 90.7 /100 | #118 | Exceptional 4.7% |
| Whites/Caucasians | 90.7 /100 | #119 | Exceptional 4.7% |
| Immigrants | South Africa | 89.9 /100 | #120 | Excellent 4.7% |
| Pakistanis | 89.7 /100 | #121 | Excellent 4.7% |
| Immigrants | Afghanistan | 89.5 /100 | #122 | Excellent 4.7% |
| Immigrants | Japan | 89.4 /100 | #123 | Excellent 4.7% |
| Lithuanians | 88.8 /100 | #124 | Excellent 4.7% |
| Immigrants | Malaysia | 87.9 /100 | #125 | Excellent 4.7% |
| Immigrants | Serbia | 87.8 /100 | #126 | Excellent 4.7% |
Demographics Similar to Assyrians/Chaldeans/Syriacs by Unemployment Among Ages 55 to 59 years
In terms of unemployment among ages 55 to 59 years, the demographic groups most similar to Assyrians/Chaldeans/Syriacs are Ethiopian (4.5%, a difference of 0.18%), Immigrants from Bulgaria (4.5%, a difference of 0.18%), English (4.5%, a difference of 0.26%), Cypriot (4.5%, a difference of 0.27%), and Thai (4.5%, a difference of 0.29%).
| Demographics | Rating | Rank | Unemployment Among Ages 55 to 59 years |
| Germans | 99.9 /100 | #31 | Exceptional 4.5% |
| Immigrants | Ethiopia | 99.9 /100 | #32 | Exceptional 4.5% |
| Belgians | 99.9 /100 | #33 | Exceptional 4.5% |
| Thais | 99.9 /100 | #34 | Exceptional 4.5% |
| Cypriots | 99.9 /100 | #35 | Exceptional 4.5% |
| Ethiopians | 99.9 /100 | #36 | Exceptional 4.5% |
| Immigrants | Bulgaria | 99.9 /100 | #37 | Exceptional 4.5% |
| Assyrians/Chaldeans/Syriacs | 99.9 /100 | #38 | Exceptional 4.5% |
| English | 99.9 /100 | #39 | Exceptional 4.5% |
| Swiss | 99.8 /100 | #40 | Exceptional 4.5% |
| Luxembourgers | 99.8 /100 | #41 | Exceptional 4.5% |
| Immigrants | Kuwait | 99.8 /100 | #42 | Exceptional 4.5% |
| Immigrants | Korea | 99.8 /100 | #43 | Exceptional 4.5% |
| Europeans | 99.8 /100 | #44 | Exceptional 4.5% |
| British | 99.8 /100 | #45 | Exceptional 4.5% |