White/Caucasian vs Delaware Unemployment Among Ages 55 to 59 years
COMPARE
White/Caucasian
Delaware
Unemployment Among Ages 55 to 59 years
Unemployment Among Ages 55 to 59 years Comparison
Whites/Caucasians
Delaware
4.7%
UNEMPLOYMENT AMONG AGES 55 TO 59 YEARS
90.7/ 100
METRIC RATING
119th/ 347
METRIC RANK
4.7%
UNEMPLOYMENT AMONG AGES 55 TO 59 YEARS
83.6/ 100
METRIC RATING
137th/ 347
METRIC RANK
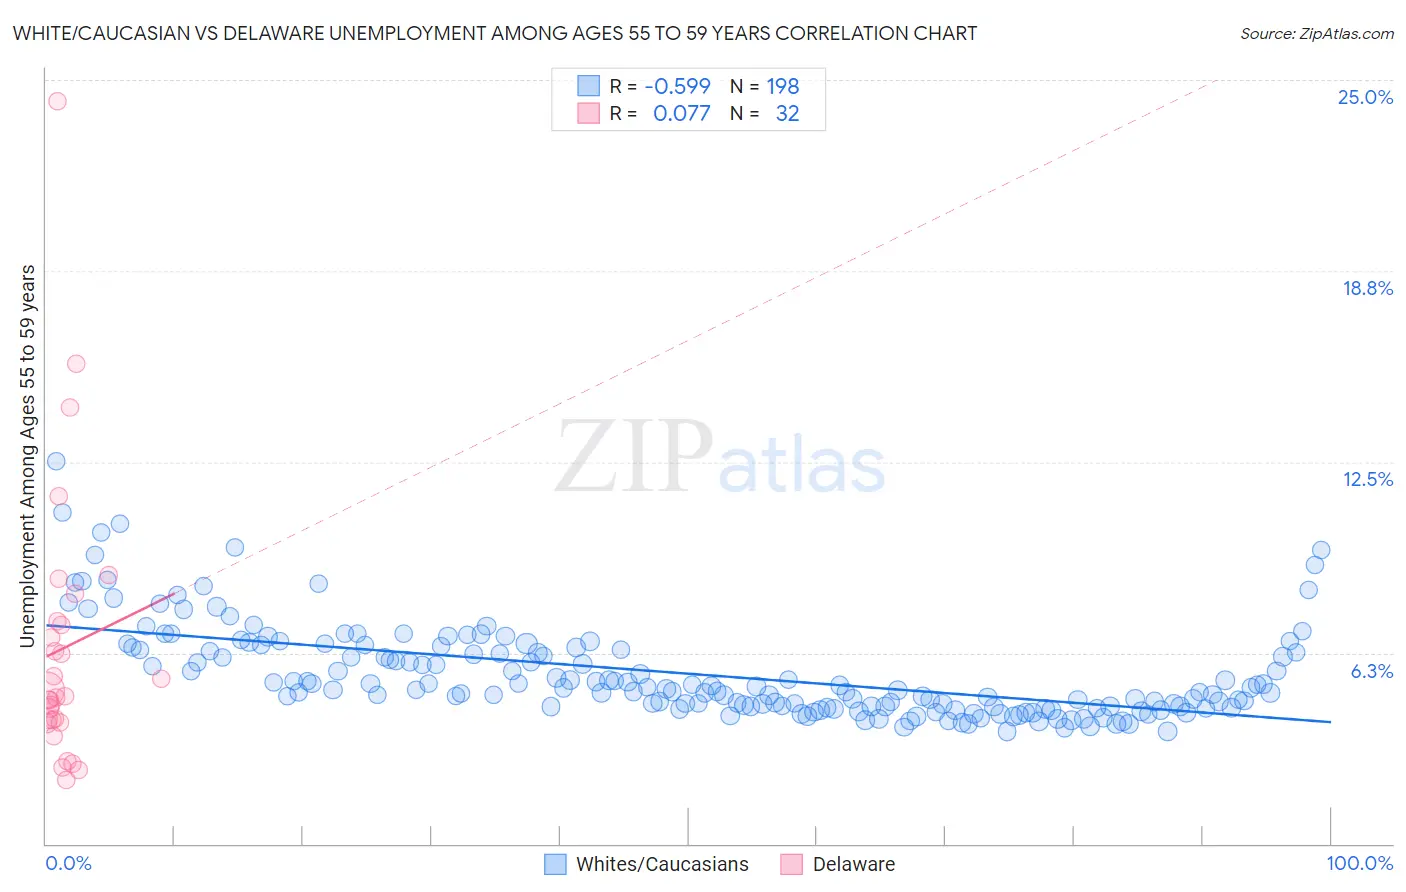
White/Caucasian vs Delaware Unemployment Among Ages 55 to 59 years Correlation Chart
The statistical analysis conducted on geographies consisting of 492,133,782 people shows a substantial negative correlation between the proportion of Whites/Caucasians and unemployment rate among population between the ages 55 and 59 in the United States with a correlation coefficient (R) of -0.599 and weighted average of 4.7%. Similarly, the statistical analysis conducted on geographies consisting of 93,020,993 people shows a slight positive correlation between the proportion of Delaware and unemployment rate among population between the ages 55 and 59 in the United States with a correlation coefficient (R) of 0.077 and weighted average of 4.7%, a difference of 0.68%.
Unemployment Among Ages 55 to 59 years Correlation Summary
| Measurement | White/Caucasian | Delaware |
| Minimum | 3.7% | 2.1% |
| Maximum | 12.5% | 24.3% |
| Range | 8.8% | 22.2% |
| Mean | 5.6% | 6.4% |
| Median | 5.1% | 4.8% |
| Interquartile 25% (IQ1) | 4.5% | 4.0% |
| Interquartile 75% (IQ3) | 6.3% | 7.2% |
| Interquartile Range (IQR) | 1.9% | 3.2% |
| Standard Deviation (Sample) | 1.5% | 4.6% |
| Standard Deviation (Population) | 1.5% | 4.5% |
Demographics Similar to Whites/Caucasians and Delaware by Unemployment Among Ages 55 to 59 years
In terms of unemployment among ages 55 to 59 years, the demographic groups most similar to Whites/Caucasians are Immigrants from Chile (4.7%, a difference of 0.0%), Immigrants from South Africa (4.7%, a difference of 0.10%), Pakistani (4.7%, a difference of 0.12%), Immigrants from Afghanistan (4.7%, a difference of 0.14%), and Immigrants from Japan (4.7%, a difference of 0.15%). Similarly, the demographic groups most similar to Delaware are Colombian (4.7%, a difference of 0.0%), Slavic (4.7%, a difference of 0.010%), Panamanian (4.7%, a difference of 0.040%), Immigrants from Switzerland (4.7%, a difference of 0.050%), and Immigrants from Netherlands (4.7%, a difference of 0.070%).
| Demographics | Rating | Rank | Unemployment Among Ages 55 to 59 years |
| Immigrants | Chile | 90.7 /100 | #118 | Exceptional 4.7% |
| Whites/Caucasians | 90.7 /100 | #119 | Exceptional 4.7% |
| Immigrants | South Africa | 89.9 /100 | #120 | Excellent 4.7% |
| Pakistanis | 89.7 /100 | #121 | Excellent 4.7% |
| Immigrants | Afghanistan | 89.5 /100 | #122 | Excellent 4.7% |
| Immigrants | Japan | 89.4 /100 | #123 | Excellent 4.7% |
| Lithuanians | 88.8 /100 | #124 | Excellent 4.7% |
| Immigrants | Malaysia | 87.9 /100 | #125 | Excellent 4.7% |
| Immigrants | Serbia | 87.8 /100 | #126 | Excellent 4.7% |
| Icelanders | 87.7 /100 | #127 | Excellent 4.7% |
| Pennsylvania Germans | 87.1 /100 | #128 | Excellent 4.7% |
| Immigrants | Sweden | 86.8 /100 | #129 | Excellent 4.7% |
| Greeks | 86.6 /100 | #130 | Excellent 4.7% |
| Immigrants | Thailand | 85.4 /100 | #131 | Excellent 4.7% |
| Immigrants | Romania | 85.3 /100 | #132 | Excellent 4.7% |
| Immigrants | Netherlands | 84.5 /100 | #133 | Excellent 4.7% |
| Panamanians | 84.1 /100 | #134 | Excellent 4.7% |
| Slavs | 83.7 /100 | #135 | Excellent 4.7% |
| Colombians | 83.6 /100 | #136 | Excellent 4.7% |
| Delaware | 83.6 /100 | #137 | Excellent 4.7% |
| Immigrants | Switzerland | 82.9 /100 | #138 | Excellent 4.7% |