White/Caucasian vs Subsaharan African Unemployment Among Ages 16 to 19 years
COMPARE
White/Caucasian
Subsaharan African
Unemployment Among Ages 16 to 19 years
Unemployment Among Ages 16 to 19 years Comparison
Whites/Caucasians
Sub-Saharan Africans
16.8%
UNEMPLOYMENT AMONG AGES 16 TO 19 YEARS
97.5/ 100
METRIC RATING
82nd/ 347
METRIC RANK
18.7%
UNEMPLOYMENT AMONG AGES 16 TO 19 YEARS
0.4/ 100
METRIC RATING
251st/ 347
METRIC RANK
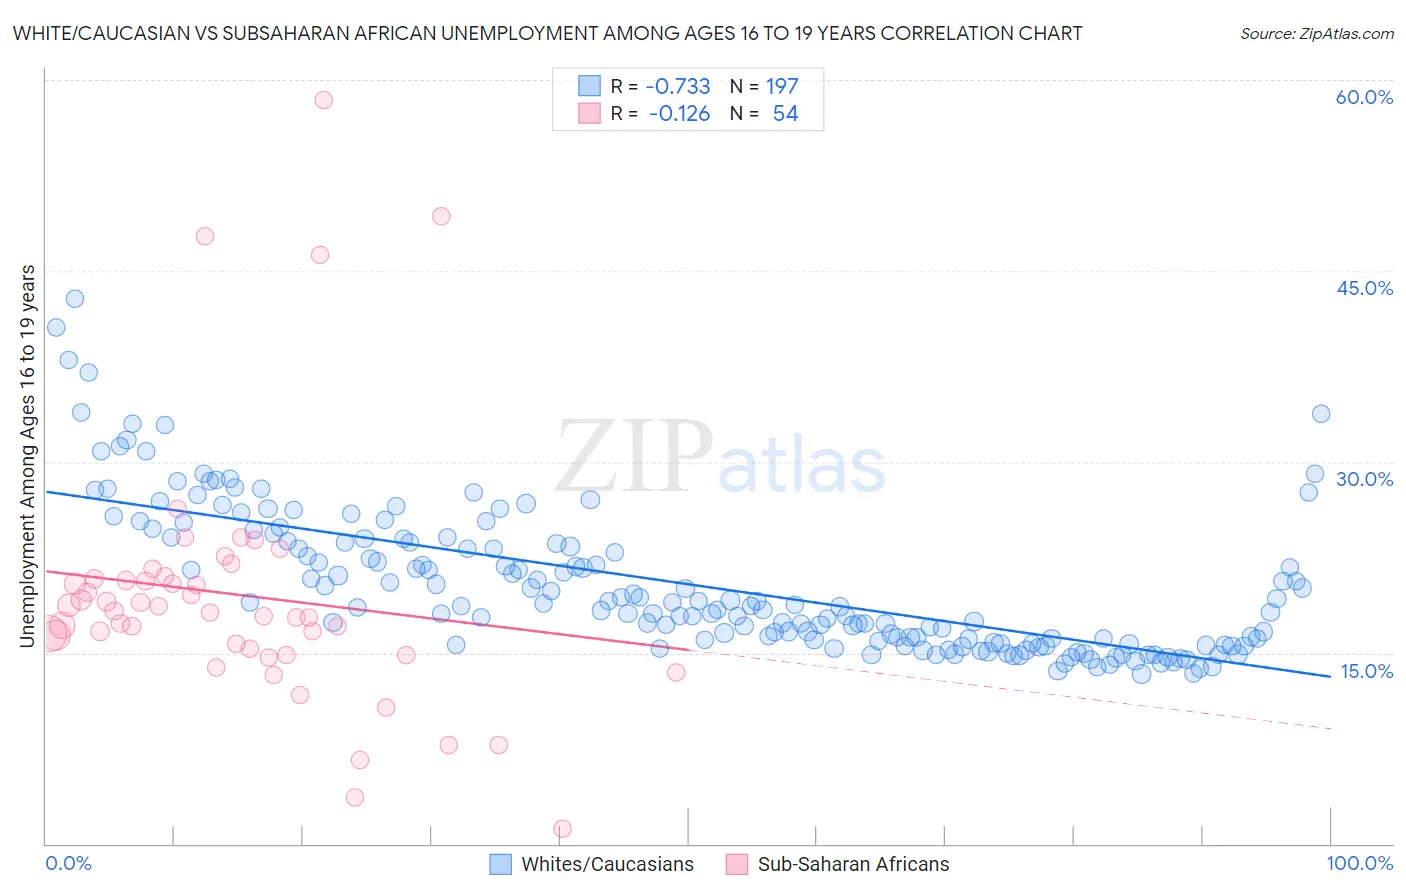
White/Caucasian vs Subsaharan African Unemployment Among Ages 16 to 19 years Correlation Chart
The statistical analysis conducted on geographies consisting of 514,462,178 people shows a strong negative correlation between the proportion of Whites/Caucasians and unemployment rate among population between the ages 16 and 19 in the United States with a correlation coefficient (R) of -0.733 and weighted average of 16.8%. Similarly, the statistical analysis conducted on geographies consisting of 472,169,930 people shows a poor negative correlation between the proportion of Sub-Saharan Africans and unemployment rate among population between the ages 16 and 19 in the United States with a correlation coefficient (R) of -0.126 and weighted average of 18.7%, a difference of 11.4%.
Unemployment Among Ages 16 to 19 years Correlation Summary
| Measurement | White/Caucasian | Subsaharan African |
| Minimum | 13.3% | 1.2% |
| Maximum | 42.8% | 58.4% |
| Range | 29.5% | 57.2% |
| Mean | 20.3% | 19.6% |
| Median | 18.7% | 18.2% |
| Interquartile 25% (IQ1) | 15.8% | 15.3% |
| Interquartile 75% (IQ3) | 23.7% | 20.8% |
| Interquartile Range (IQR) | 7.9% | 5.5% |
| Standard Deviation (Sample) | 5.7% | 10.2% |
| Standard Deviation (Population) | 5.6% | 10.1% |
Similar Demographics by Unemployment Among Ages 16 to 19 years
Demographics Similar to Whites/Caucasians by Unemployment Among Ages 16 to 19 years
In terms of unemployment among ages 16 to 19 years, the demographic groups most similar to Whites/Caucasians are Slovak (16.8%, a difference of 0.010%), French Canadian (16.8%, a difference of 0.010%), Immigrants from Latvia (16.8%, a difference of 0.010%), Ugandan (16.8%, a difference of 0.020%), and French (16.8%, a difference of 0.050%).
| Demographics | Rating | Rank | Unemployment Among Ages 16 to 19 years |
| New Zealanders | 98.0 /100 | #75 | Exceptional 16.8% |
| Immigrants | North America | 97.9 /100 | #76 | Exceptional 16.8% |
| Immigrants | Singapore | 97.8 /100 | #77 | Exceptional 16.8% |
| Soviet Union | 97.8 /100 | #78 | Exceptional 16.8% |
| Slovaks | 97.5 /100 | #79 | Exceptional 16.8% |
| French Canadians | 97.5 /100 | #80 | Exceptional 16.8% |
| Immigrants | Latvia | 97.5 /100 | #81 | Exceptional 16.8% |
| Whites/Caucasians | 97.5 /100 | #82 | Exceptional 16.8% |
| Ugandans | 97.4 /100 | #83 | Exceptional 16.8% |
| French | 97.4 /100 | #84 | Exceptional 16.8% |
| Immigrants | Kuwait | 97.2 /100 | #85 | Exceptional 16.8% |
| Immigrants | Scotland | 97.2 /100 | #86 | Exceptional 16.8% |
| Greeks | 97.0 /100 | #87 | Exceptional 16.9% |
| Immigrants | South Africa | 96.9 /100 | #88 | Exceptional 16.9% |
| Canadians | 96.7 /100 | #89 | Exceptional 16.9% |
Demographics Similar to Sub-Saharan Africans by Unemployment Among Ages 16 to 19 years
In terms of unemployment among ages 16 to 19 years, the demographic groups most similar to Sub-Saharan Africans are Immigrants from Guatemala (18.7%, a difference of 0.030%), Panamanian (18.7%, a difference of 0.11%), Puget Sound Salish (18.7%, a difference of 0.22%), Delaware (18.7%, a difference of 0.28%), and Immigrants from Israel (18.7%, a difference of 0.31%).
| Demographics | Rating | Rank | Unemployment Among Ages 16 to 19 years |
| Guatemalans | 0.8 /100 | #244 | Tragic 18.6% |
| Immigrants | Belarus | 0.8 /100 | #245 | Tragic 18.6% |
| Immigrants | South America | 0.5 /100 | #246 | Tragic 18.7% |
| Immigrants | Israel | 0.5 /100 | #247 | Tragic 18.7% |
| Delaware | 0.5 /100 | #248 | Tragic 18.7% |
| Puget Sound Salish | 0.5 /100 | #249 | Tragic 18.7% |
| Panamanians | 0.4 /100 | #250 | Tragic 18.7% |
| Sub-Saharan Africans | 0.4 /100 | #251 | Tragic 18.7% |
| Immigrants | Guatemala | 0.4 /100 | #252 | Tragic 18.7% |
| Central Americans | 0.3 /100 | #253 | Tragic 18.8% |
| Apache | 0.3 /100 | #254 | Tragic 18.8% |
| Immigrants | Cameroon | 0.3 /100 | #255 | Tragic 18.8% |
| Mexican American Indians | 0.3 /100 | #256 | Tragic 18.8% |
| Immigrants | Nigeria | 0.2 /100 | #257 | Tragic 18.9% |
| Immigrants | Mexico | 0.2 /100 | #258 | Tragic 18.9% |