Sioux vs Subsaharan African Unemployment Among Ages 16 to 19 years
COMPARE
Sioux
Subsaharan African
Unemployment Among Ages 16 to 19 years
Unemployment Among Ages 16 to 19 years Comparison
Sioux
Sub-Saharan Africans
19.7%
UNEMPLOYMENT AMONG AGES 16 TO 19 YEARS
0.0/ 100
METRIC RATING
283rd/ 347
METRIC RANK
18.7%
UNEMPLOYMENT AMONG AGES 16 TO 19 YEARS
0.4/ 100
METRIC RATING
251st/ 347
METRIC RANK
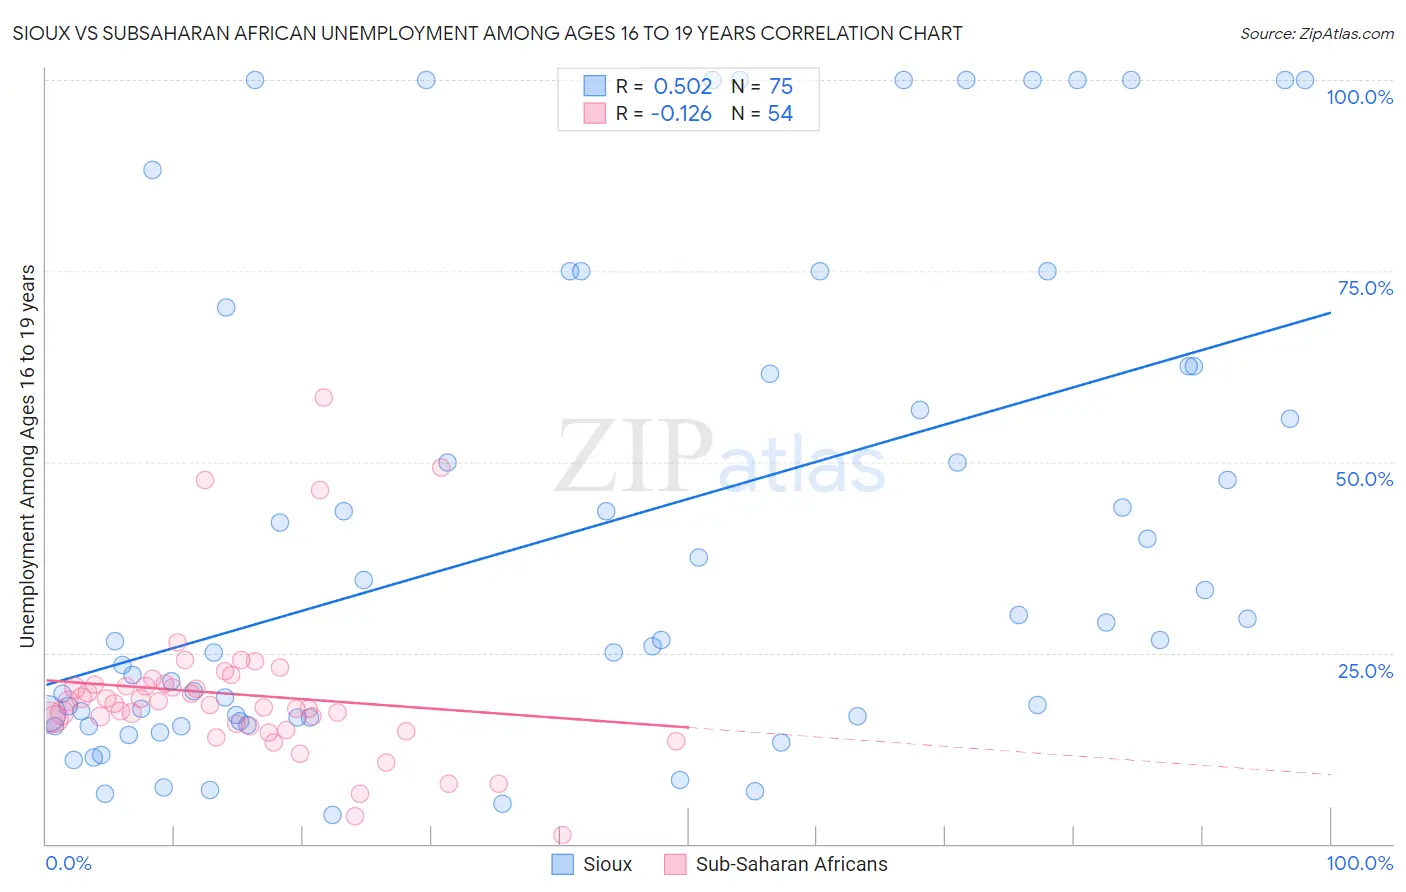
Sioux vs Subsaharan African Unemployment Among Ages 16 to 19 years Correlation Chart
The statistical analysis conducted on geographies consisting of 225,477,906 people shows a substantial positive correlation between the proportion of Sioux and unemployment rate among population between the ages 16 and 19 in the United States with a correlation coefficient (R) of 0.502 and weighted average of 19.7%. Similarly, the statistical analysis conducted on geographies consisting of 472,169,930 people shows a poor negative correlation between the proportion of Sub-Saharan Africans and unemployment rate among population between the ages 16 and 19 in the United States with a correlation coefficient (R) of -0.126 and weighted average of 18.7%, a difference of 5.3%.
Unemployment Among Ages 16 to 19 years Correlation Summary
| Measurement | Sioux | Subsaharan African |
| Minimum | 3.7% | 1.2% |
| Maximum | 100.0% | 58.4% |
| Range | 96.3% | 57.2% |
| Mean | 40.6% | 19.6% |
| Median | 26.6% | 18.2% |
| Interquartile 25% (IQ1) | 16.5% | 15.3% |
| Interquartile 75% (IQ3) | 62.5% | 20.8% |
| Interquartile Range (IQR) | 46.0% | 5.5% |
| Standard Deviation (Sample) | 31.6% | 10.2% |
| Standard Deviation (Population) | 31.4% | 10.1% |
Similar Demographics by Unemployment Among Ages 16 to 19 years
Demographics Similar to Sioux by Unemployment Among Ages 16 to 19 years
In terms of unemployment among ages 16 to 19 years, the demographic groups most similar to Sioux are Sierra Leonean (19.7%, a difference of 0.010%), Dutch West Indian (19.7%, a difference of 0.050%), Ghanaian (19.8%, a difference of 0.19%), Bahamian (19.8%, a difference of 0.31%), and Immigrants from Ghana (19.8%, a difference of 0.38%).
| Demographics | Rating | Rank | Unemployment Among Ages 16 to 19 years |
| Immigrants | Latin America | 0.0 /100 | #276 | Tragic 19.4% |
| Immigrants | Western Africa | 0.0 /100 | #277 | Tragic 19.4% |
| Africans | 0.0 /100 | #278 | Tragic 19.5% |
| Ute | 0.0 /100 | #279 | Tragic 19.6% |
| Cajuns | 0.0 /100 | #280 | Tragic 19.6% |
| Cypriots | 0.0 /100 | #281 | Tragic 19.6% |
| Dutch West Indians | 0.0 /100 | #282 | Tragic 19.7% |
| Sioux | 0.0 /100 | #283 | Tragic 19.7% |
| Sierra Leoneans | 0.0 /100 | #284 | Tragic 19.7% |
| Ghanaians | 0.0 /100 | #285 | Tragic 19.8% |
| Bahamians | 0.0 /100 | #286 | Tragic 19.8% |
| Immigrants | Ghana | 0.0 /100 | #287 | Tragic 19.8% |
| Immigrants | Azores | 0.0 /100 | #288 | Tragic 19.8% |
| Pueblo | 0.0 /100 | #289 | Tragic 19.8% |
| Immigrants | Sierra Leone | 0.0 /100 | #290 | Tragic 20.0% |
Demographics Similar to Sub-Saharan Africans by Unemployment Among Ages 16 to 19 years
In terms of unemployment among ages 16 to 19 years, the demographic groups most similar to Sub-Saharan Africans are Immigrants from Guatemala (18.7%, a difference of 0.030%), Panamanian (18.7%, a difference of 0.11%), Puget Sound Salish (18.7%, a difference of 0.22%), Delaware (18.7%, a difference of 0.28%), and Immigrants from Israel (18.7%, a difference of 0.31%).
| Demographics | Rating | Rank | Unemployment Among Ages 16 to 19 years |
| Guatemalans | 0.8 /100 | #244 | Tragic 18.6% |
| Immigrants | Belarus | 0.8 /100 | #245 | Tragic 18.6% |
| Immigrants | South America | 0.5 /100 | #246 | Tragic 18.7% |
| Immigrants | Israel | 0.5 /100 | #247 | Tragic 18.7% |
| Delaware | 0.5 /100 | #248 | Tragic 18.7% |
| Puget Sound Salish | 0.5 /100 | #249 | Tragic 18.7% |
| Panamanians | 0.4 /100 | #250 | Tragic 18.7% |
| Sub-Saharan Africans | 0.4 /100 | #251 | Tragic 18.7% |
| Immigrants | Guatemala | 0.4 /100 | #252 | Tragic 18.7% |
| Central Americans | 0.3 /100 | #253 | Tragic 18.8% |
| Apache | 0.3 /100 | #254 | Tragic 18.8% |
| Immigrants | Cameroon | 0.3 /100 | #255 | Tragic 18.8% |
| Mexican American Indians | 0.3 /100 | #256 | Tragic 18.8% |
| Immigrants | Nigeria | 0.2 /100 | #257 | Tragic 18.9% |
| Immigrants | Mexico | 0.2 /100 | #258 | Tragic 18.9% |