White/Caucasian vs Immigrants from Pakistan Unemployment Among Ages 16 to 19 years
COMPARE
White/Caucasian
Immigrants from Pakistan
Unemployment Among Ages 16 to 19 years
Unemployment Among Ages 16 to 19 years Comparison
Whites/Caucasians
Immigrants from Pakistan
16.8%
UNEMPLOYMENT AMONG AGES 16 TO 19 YEARS
97.5/ 100
METRIC RATING
82nd/ 347
METRIC RANK
17.0%
UNEMPLOYMENT AMONG AGES 16 TO 19 YEARS
94.6/ 100
METRIC RATING
102nd/ 347
METRIC RANK
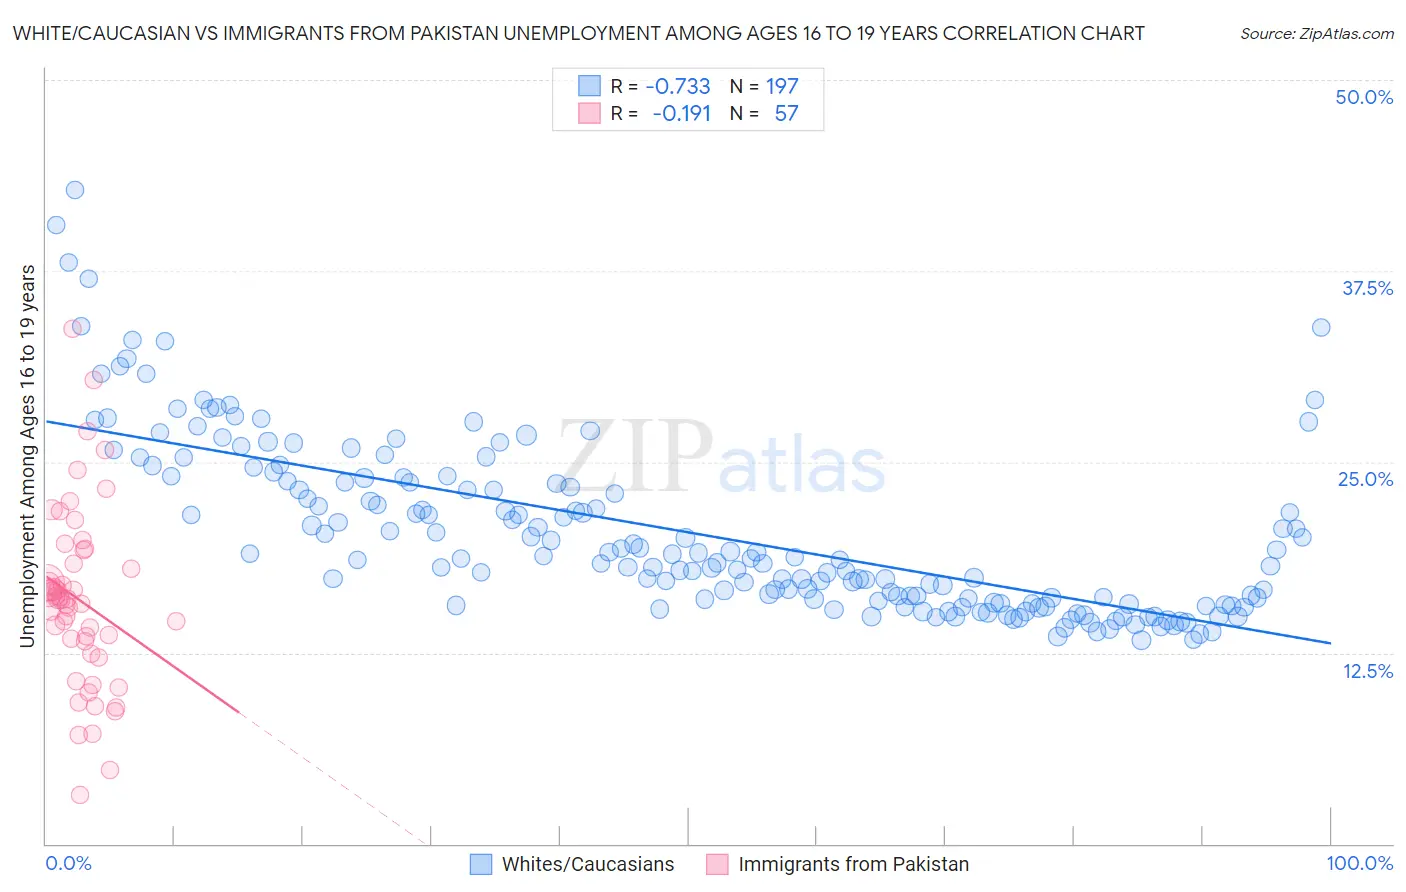
White/Caucasian vs Immigrants from Pakistan Unemployment Among Ages 16 to 19 years Correlation Chart
The statistical analysis conducted on geographies consisting of 514,462,178 people shows a strong negative correlation between the proportion of Whites/Caucasians and unemployment rate among population between the ages 16 and 19 in the United States with a correlation coefficient (R) of -0.733 and weighted average of 16.8%. Similarly, the statistical analysis conducted on geographies consisting of 274,773,140 people shows a poor negative correlation between the proportion of Immigrants from Pakistan and unemployment rate among population between the ages 16 and 19 in the United States with a correlation coefficient (R) of -0.191 and weighted average of 17.0%, a difference of 0.98%.
Unemployment Among Ages 16 to 19 years Correlation Summary
| Measurement | White/Caucasian | Immigrants from Pakistan |
| Minimum | 13.3% | 3.2% |
| Maximum | 42.8% | 33.7% |
| Range | 29.5% | 30.6% |
| Mean | 20.3% | 16.0% |
| Median | 18.7% | 16.0% |
| Interquartile 25% (IQ1) | 15.8% | 12.8% |
| Interquartile 75% (IQ3) | 23.7% | 18.8% |
| Interquartile Range (IQR) | 7.9% | 5.9% |
| Standard Deviation (Sample) | 5.7% | 5.8% |
| Standard Deviation (Population) | 5.6% | 5.8% |
Demographics Similar to Whites/Caucasians and Immigrants from Pakistan by Unemployment Among Ages 16 to 19 years
In terms of unemployment among ages 16 to 19 years, the demographic groups most similar to Whites/Caucasians are Ugandan (16.8%, a difference of 0.020%), French (16.8%, a difference of 0.050%), Immigrants from Kuwait (16.8%, a difference of 0.13%), Immigrants from Scotland (16.8%, a difference of 0.14%), and Greek (16.9%, a difference of 0.20%). Similarly, the demographic groups most similar to Immigrants from Pakistan are Immigrants from Saudi Arabia (17.0%, a difference of 0.020%), Immigrants from Thailand (17.0%, a difference of 0.030%), Immigrants from Lithuania (17.0%, a difference of 0.070%), Burmese (17.0%, a difference of 0.090%), and Immigrants from Venezuela (16.9%, a difference of 0.19%).
| Demographics | Rating | Rank | Unemployment Among Ages 16 to 19 years |
| Whites/Caucasians | 97.5 /100 | #82 | Exceptional 16.8% |
| Ugandans | 97.4 /100 | #83 | Exceptional 16.8% |
| French | 97.4 /100 | #84 | Exceptional 16.8% |
| Immigrants | Kuwait | 97.2 /100 | #85 | Exceptional 16.8% |
| Immigrants | Scotland | 97.2 /100 | #86 | Exceptional 16.8% |
| Greeks | 97.0 /100 | #87 | Exceptional 16.9% |
| Immigrants | South Africa | 96.9 /100 | #88 | Exceptional 16.9% |
| Canadians | 96.7 /100 | #89 | Exceptional 16.9% |
| Asians | 96.6 /100 | #90 | Exceptional 16.9% |
| Cambodians | 96.3 /100 | #91 | Exceptional 16.9% |
| South Africans | 95.9 /100 | #92 | Exceptional 16.9% |
| Cubans | 95.8 /100 | #93 | Exceptional 16.9% |
| Bangladeshis | 95.8 /100 | #94 | Exceptional 16.9% |
| Mongolians | 95.6 /100 | #95 | Exceptional 16.9% |
| Ottawa | 95.4 /100 | #96 | Exceptional 16.9% |
| Immigrants | Venezuela | 95.3 /100 | #97 | Exceptional 16.9% |
| Burmese | 95.0 /100 | #98 | Exceptional 17.0% |
| Immigrants | Lithuania | 94.9 /100 | #99 | Exceptional 17.0% |
| Immigrants | Thailand | 94.7 /100 | #100 | Exceptional 17.0% |
| Immigrants | Saudi Arabia | 94.7 /100 | #101 | Exceptional 17.0% |
| Immigrants | Pakistan | 94.6 /100 | #102 | Exceptional 17.0% |