White/Caucasian vs Immigrants from Netherlands Unemployment Among Ages 16 to 19 years
COMPARE
White/Caucasian
Immigrants from Netherlands
Unemployment Among Ages 16 to 19 years
Unemployment Among Ages 16 to 19 years Comparison
Whites/Caucasians
Immigrants from Netherlands
16.8%
UNEMPLOYMENT AMONG AGES 16 TO 19 YEARS
97.5/ 100
METRIC RATING
82nd/ 347
METRIC RANK
17.0%
UNEMPLOYMENT AMONG AGES 16 TO 19 YEARS
93.9/ 100
METRIC RATING
110th/ 347
METRIC RANK
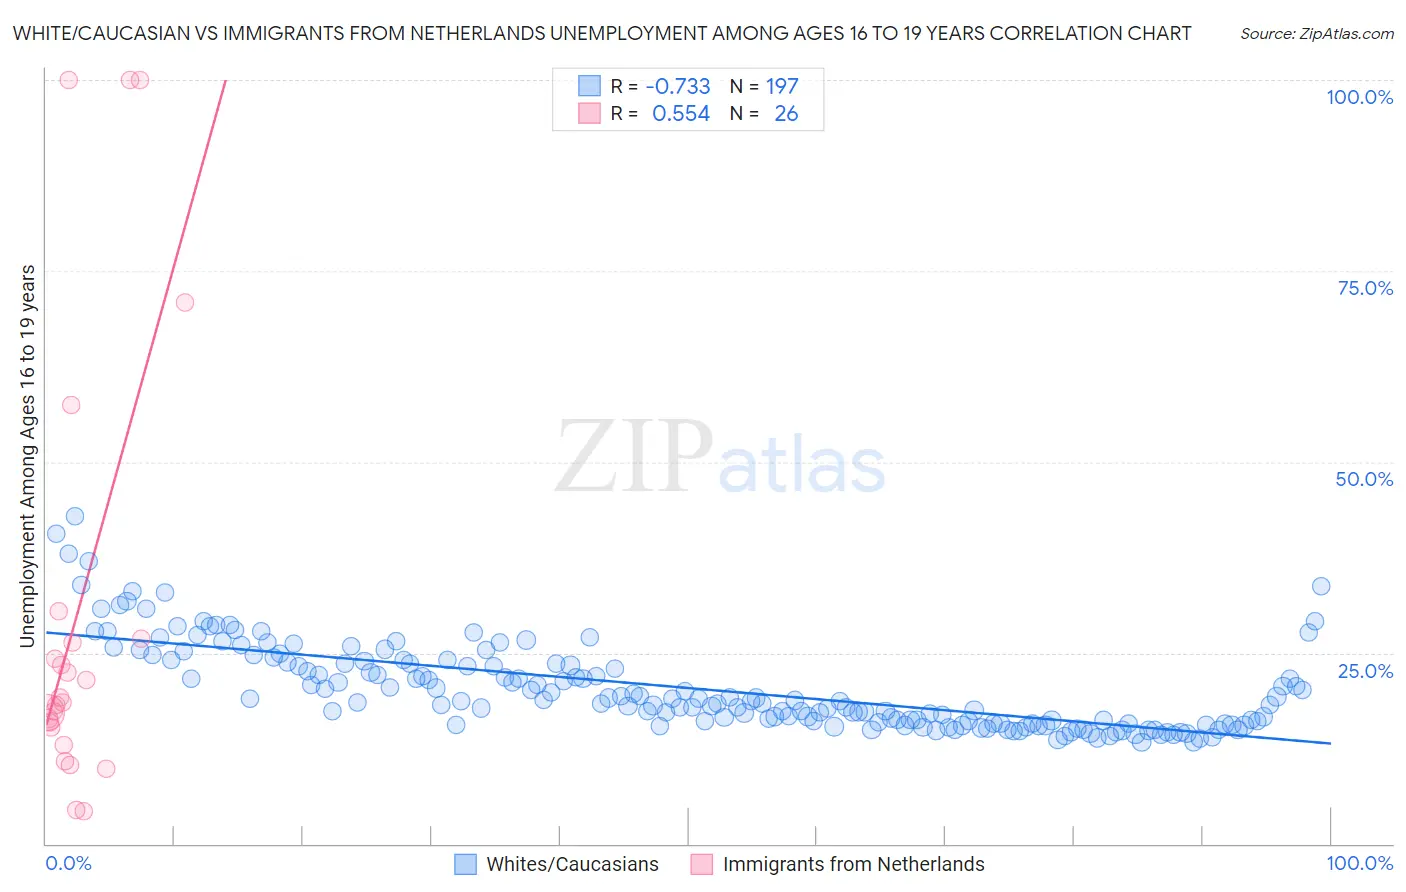
White/Caucasian vs Immigrants from Netherlands Unemployment Among Ages 16 to 19 years Correlation Chart
The statistical analysis conducted on geographies consisting of 514,462,178 people shows a strong negative correlation between the proportion of Whites/Caucasians and unemployment rate among population between the ages 16 and 19 in the United States with a correlation coefficient (R) of -0.733 and weighted average of 16.8%. Similarly, the statistical analysis conducted on geographies consisting of 229,214,071 people shows a substantial positive correlation between the proportion of Immigrants from Netherlands and unemployment rate among population between the ages 16 and 19 in the United States with a correlation coefficient (R) of 0.554 and weighted average of 17.0%, a difference of 1.1%.
Unemployment Among Ages 16 to 19 years Correlation Summary
| Measurement | White/Caucasian | Immigrants from Netherlands |
| Minimum | 13.3% | 4.3% |
| Maximum | 42.8% | 100.0% |
| Range | 29.5% | 95.7% |
| Mean | 20.3% | 30.5% |
| Median | 18.7% | 18.8% |
| Interquartile 25% (IQ1) | 15.8% | 15.2% |
| Interquartile 75% (IQ3) | 23.7% | 26.8% |
| Interquartile Range (IQR) | 7.9% | 11.6% |
| Standard Deviation (Sample) | 5.7% | 29.3% |
| Standard Deviation (Population) | 5.6% | 28.7% |
Similar Demographics by Unemployment Among Ages 16 to 19 years
Demographics Similar to Whites/Caucasians by Unemployment Among Ages 16 to 19 years
In terms of unemployment among ages 16 to 19 years, the demographic groups most similar to Whites/Caucasians are Slovak (16.8%, a difference of 0.010%), French Canadian (16.8%, a difference of 0.010%), Immigrants from Latvia (16.8%, a difference of 0.010%), Ugandan (16.8%, a difference of 0.020%), and French (16.8%, a difference of 0.050%).
| Demographics | Rating | Rank | Unemployment Among Ages 16 to 19 years |
| New Zealanders | 98.0 /100 | #75 | Exceptional 16.8% |
| Immigrants | North America | 97.9 /100 | #76 | Exceptional 16.8% |
| Immigrants | Singapore | 97.8 /100 | #77 | Exceptional 16.8% |
| Soviet Union | 97.8 /100 | #78 | Exceptional 16.8% |
| Slovaks | 97.5 /100 | #79 | Exceptional 16.8% |
| French Canadians | 97.5 /100 | #80 | Exceptional 16.8% |
| Immigrants | Latvia | 97.5 /100 | #81 | Exceptional 16.8% |
| Whites/Caucasians | 97.5 /100 | #82 | Exceptional 16.8% |
| Ugandans | 97.4 /100 | #83 | Exceptional 16.8% |
| French | 97.4 /100 | #84 | Exceptional 16.8% |
| Immigrants | Kuwait | 97.2 /100 | #85 | Exceptional 16.8% |
| Immigrants | Scotland | 97.2 /100 | #86 | Exceptional 16.8% |
| Greeks | 97.0 /100 | #87 | Exceptional 16.9% |
| Immigrants | South Africa | 96.9 /100 | #88 | Exceptional 16.9% |
| Canadians | 96.7 /100 | #89 | Exceptional 16.9% |
Demographics Similar to Immigrants from Netherlands by Unemployment Among Ages 16 to 19 years
In terms of unemployment among ages 16 to 19 years, the demographic groups most similar to Immigrants from Netherlands are Immigrants from Asia (17.0%, a difference of 0.020%), Iranian (17.0%, a difference of 0.040%), Immigrants from Iraq (17.0%, a difference of 0.040%), Malaysian (17.0%, a difference of 0.050%), and Immigrants from Brazil (17.0%, a difference of 0.060%).
| Demographics | Rating | Rank | Unemployment Among Ages 16 to 19 years |
| Palestinians | 94.6 /100 | #103 | Exceptional 17.0% |
| Italians | 94.5 /100 | #104 | Exceptional 17.0% |
| Immigrants | Bulgaria | 94.3 /100 | #105 | Exceptional 17.0% |
| Estonians | 94.3 /100 | #106 | Exceptional 17.0% |
| Immigrants | Brazil | 94.2 /100 | #107 | Exceptional 17.0% |
| Malaysians | 94.2 /100 | #108 | Exceptional 17.0% |
| Iranians | 94.1 /100 | #109 | Exceptional 17.0% |
| Immigrants | Netherlands | 93.9 /100 | #110 | Exceptional 17.0% |
| Immigrants | Asia | 93.9 /100 | #111 | Exceptional 17.0% |
| Immigrants | Iraq | 93.7 /100 | #112 | Exceptional 17.0% |
| Icelanders | 93.4 /100 | #113 | Exceptional 17.0% |
| Immigrants | Poland | 93.1 /100 | #114 | Exceptional 17.0% |
| Brazilians | 92.3 /100 | #115 | Exceptional 17.1% |
| Immigrants | Korea | 92.2 /100 | #116 | Exceptional 17.1% |
| Immigrants | Sri Lanka | 92.0 /100 | #117 | Exceptional 17.1% |