White/Caucasian vs Immigrants from Netherlands Seniors Poverty Over the Age of 75
COMPARE
White/Caucasian
Immigrants from Netherlands
Seniors Poverty Over the Age of 75
Seniors Poverty Over the Age of 75 Comparison
Whites/Caucasians
Immigrants from Netherlands
11.4%
SENIORS POVERTY OVER THE AGE OF 75
95.5/ 100
METRIC RATING
77th/ 347
METRIC RANK
11.2%
SENIORS POVERTY OVER THE AGE OF 75
97.8/ 100
METRIC RATING
59th/ 347
METRIC RANK
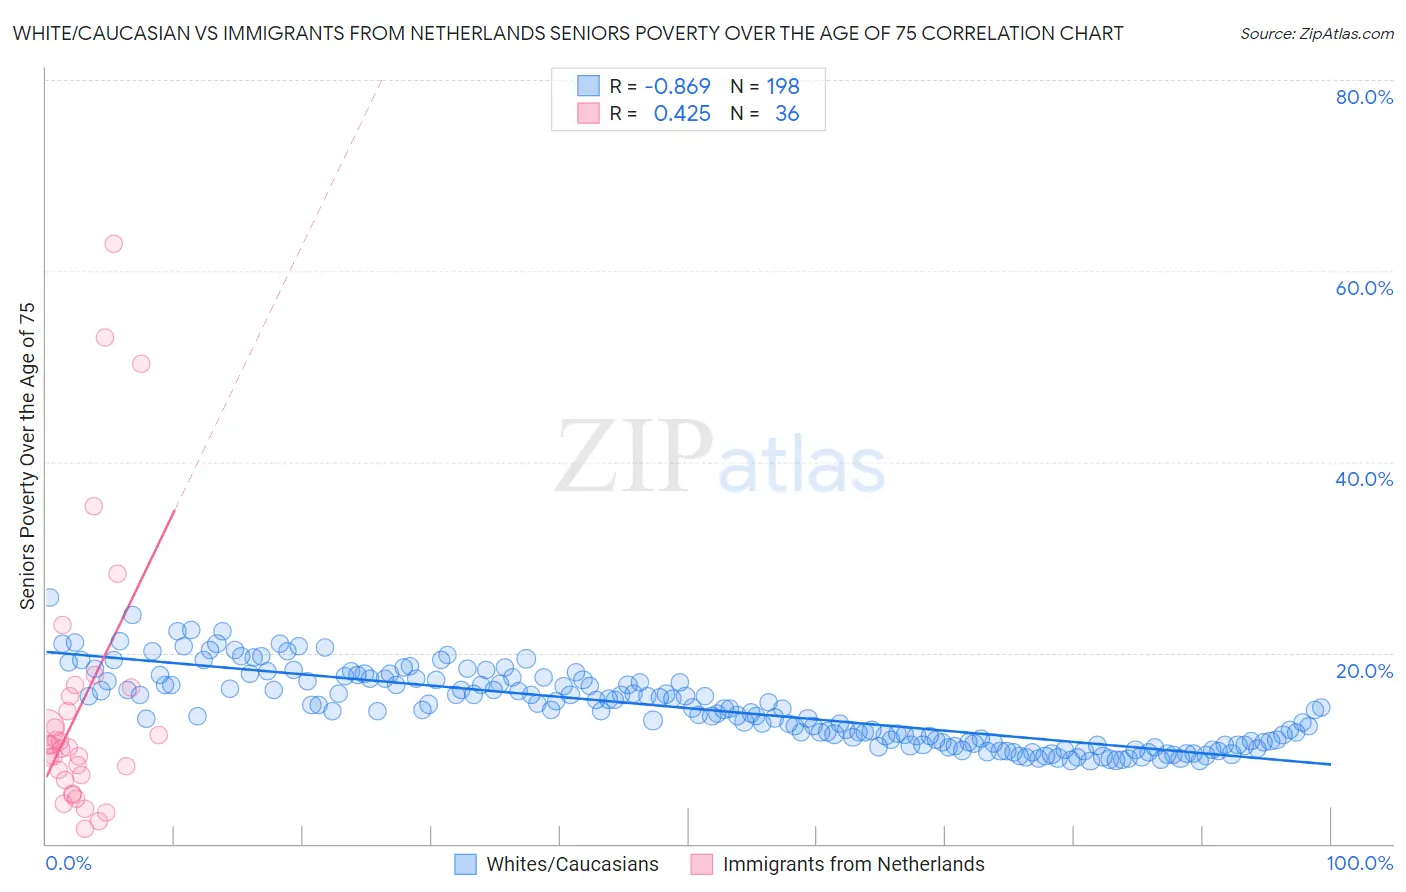
White/Caucasian vs Immigrants from Netherlands Seniors Poverty Over the Age of 75 Correlation Chart
The statistical analysis conducted on geographies consisting of 563,847,839 people shows a very strong negative correlation between the proportion of Whites/Caucasians and poverty level among seniors over the age of 75 in the United States with a correlation coefficient (R) of -0.869 and weighted average of 11.4%. Similarly, the statistical analysis conducted on geographies consisting of 236,522,144 people shows a moderate positive correlation between the proportion of Immigrants from Netherlands and poverty level among seniors over the age of 75 in the United States with a correlation coefficient (R) of 0.425 and weighted average of 11.2%, a difference of 1.6%.
Seniors Poverty Over the Age of 75 Correlation Summary
| Measurement | White/Caucasian | Immigrants from Netherlands |
| Minimum | 8.6% | 1.6% |
| Maximum | 25.8% | 62.8% |
| Range | 17.1% | 61.2% |
| Mean | 14.2% | 14.6% |
| Median | 14.0% | 10.2% |
| Interquartile 25% (IQ1) | 10.6% | 6.9% |
| Interquartile 75% (IQ3) | 17.1% | 15.9% |
| Interquartile Range (IQR) | 6.5% | 9.0% |
| Standard Deviation (Sample) | 3.9% | 14.3% |
| Standard Deviation (Population) | 3.9% | 14.1% |
Demographics Similar to Whites/Caucasians and Immigrants from Netherlands by Seniors Poverty Over the Age of 75
In terms of seniors poverty over the age of 75, the demographic groups most similar to Whites/Caucasians are Macedonian (11.4%, a difference of 0.010%), French Canadian (11.4%, a difference of 0.080%), Palestinian (11.4%, a difference of 0.15%), Delaware (11.4%, a difference of 0.24%), and Immigrants from Micronesia (11.4%, a difference of 0.25%). Similarly, the demographic groups most similar to Immigrants from Netherlands are Yugoslavian (11.2%, a difference of 0.080%), Eastern European (11.3%, a difference of 0.11%), Canadian (11.3%, a difference of 0.15%), Immigrants from North America (11.3%, a difference of 0.25%), and Immigrants from Afghanistan (11.3%, a difference of 0.28%).
| Demographics | Rating | Rank | Seniors Poverty Over the Age of 75 |
| Yugoslavians | 97.9 /100 | #58 | Exceptional 11.2% |
| Immigrants | Netherlands | 97.8 /100 | #59 | Exceptional 11.2% |
| Eastern Europeans | 97.7 /100 | #60 | Exceptional 11.3% |
| Canadians | 97.7 /100 | #61 | Exceptional 11.3% |
| Immigrants | North America | 97.6 /100 | #62 | Exceptional 11.3% |
| Immigrants | Afghanistan | 97.5 /100 | #63 | Exceptional 11.3% |
| Immigrants | Northern Europe | 97.4 /100 | #64 | Exceptional 11.3% |
| Immigrants | Taiwan | 96.7 /100 | #65 | Exceptional 11.4% |
| Estonians | 96.7 /100 | #66 | Exceptional 11.4% |
| Bolivians | 96.5 /100 | #67 | Exceptional 11.4% |
| Immigrants | Austria | 96.5 /100 | #68 | Exceptional 11.4% |
| Ottawa | 96.5 /100 | #69 | Exceptional 11.4% |
| Immigrants | South Central Asia | 96.4 /100 | #70 | Exceptional 11.4% |
| Osage | 96.3 /100 | #71 | Exceptional 11.4% |
| Sierra Leoneans | 96.1 /100 | #72 | Exceptional 11.4% |
| Immigrants | Micronesia | 96.0 /100 | #73 | Exceptional 11.4% |
| Delaware | 96.0 /100 | #74 | Exceptional 11.4% |
| Palestinians | 95.8 /100 | #75 | Exceptional 11.4% |
| French Canadians | 95.7 /100 | #76 | Exceptional 11.4% |
| Whites/Caucasians | 95.5 /100 | #77 | Exceptional 11.4% |
| Macedonians | 95.5 /100 | #78 | Exceptional 11.4% |