Tlingit-Haida vs Belgian Unemployment Among Seniors over 75 years
COMPARE
Tlingit-Haida
Belgian
Unemployment Among Seniors over 75 years
Unemployment Among Seniors over 75 years Comparison
Tlingit-Haida
Belgians
20.7%
UNEMPLOYMENT AMONG SENIORS OVER 75 YEARS
0.0/ 100
METRIC RATING
346th/ 347
METRIC RANK
9.9%
UNEMPLOYMENT AMONG SENIORS OVER 75 YEARS
0.0/ 100
METRIC RATING
299th/ 347
METRIC RANK
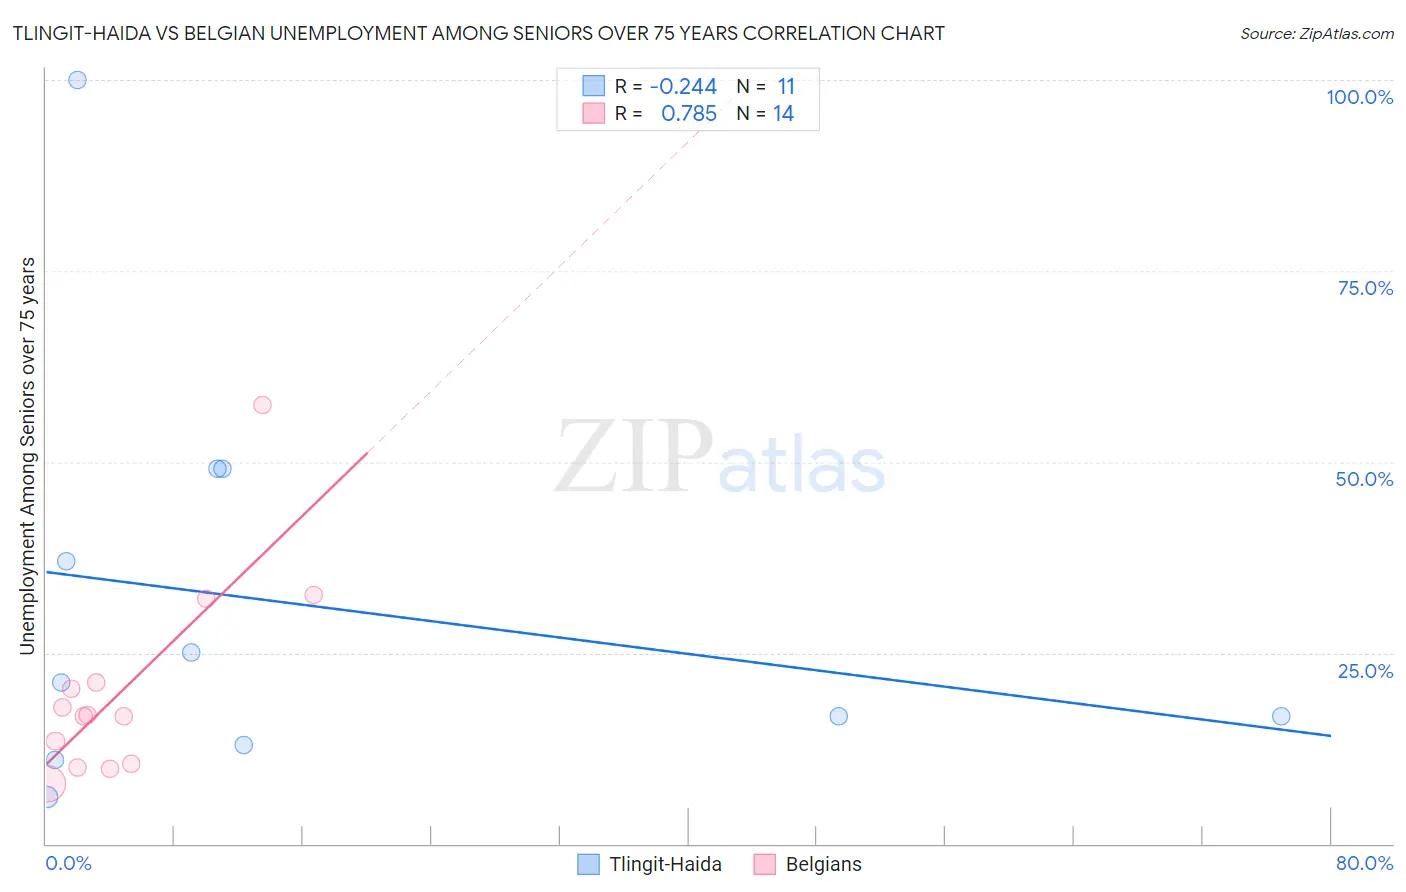
Tlingit-Haida vs Belgian Unemployment Among Seniors over 75 years Correlation Chart
The statistical analysis conducted on geographies consisting of 44,675,055 people shows a weak negative correlation between the proportion of Tlingit-Haida and unemployment rate among seniors over the age of 75 in the United States with a correlation coefficient (R) of -0.244 and weighted average of 20.7%. Similarly, the statistical analysis conducted on geographies consisting of 184,859,103 people shows a strong positive correlation between the proportion of Belgians and unemployment rate among seniors over the age of 75 in the United States with a correlation coefficient (R) of 0.785 and weighted average of 9.9%, a difference of 109.2%.
Unemployment Among Seniors over 75 years Correlation Summary
| Measurement | Tlingit-Haida | Belgian |
| Minimum | 6.1% | 7.8% |
| Maximum | 100.0% | 57.5% |
| Range | 93.9% | 49.7% |
| Mean | 31.3% | 20.2% |
| Median | 21.1% | 16.8% |
| Interquartile 25% (IQ1) | 13.0% | 10.5% |
| Interquartile 75% (IQ3) | 49.1% | 21.0% |
| Interquartile Range (IQR) | 36.1% | 10.5% |
| Standard Deviation (Sample) | 27.1% | 13.1% |
| Standard Deviation (Population) | 25.8% | 12.6% |
Similar Demographics by Unemployment Among Seniors over 75 years
Demographics Similar to Tlingit-Haida by Unemployment Among Seniors over 75 years
In terms of unemployment among seniors over 75 years, the demographic groups most similar to Tlingit-Haida are Yakama (18.4%, a difference of 12.6%), Immigrants from Yemen (16.5%, a difference of 25.8%), Alaska Native (14.7%, a difference of 41.4%), Hmong (13.7%, a difference of 51.0%), and Lumbee (13.5%, a difference of 54.1%).
| Demographics | Rating | Rank | Unemployment Among Seniors over 75 years |
| Alaskan Athabascans | 0.0 /100 | #333 | Tragic 11.0% |
| Assyrians/Chaldeans/Syriacs | 0.0 /100 | #334 | Tragic 11.1% |
| French Canadians | 0.0 /100 | #335 | Tragic 11.2% |
| Immigrants | North Macedonia | 0.0 /100 | #336 | Tragic 11.3% |
| Cape Verdeans | 0.0 /100 | #337 | Tragic 11.4% |
| Immigrants | Cabo Verde | 0.0 /100 | #338 | Tragic 12.3% |
| Cajuns | 0.0 /100 | #339 | Tragic 12.5% |
| Yup'ik | 0.0 /100 | #340 | Tragic 12.8% |
| Lumbee | 0.0 /100 | #341 | Tragic 13.5% |
| Hmong | 0.0 /100 | #342 | Tragic 13.7% |
| Alaska Natives | 0.0 /100 | #343 | Tragic 14.7% |
| Immigrants | Yemen | 0.0 /100 | #344 | Tragic 16.5% |
| Yakama | 0.0 /100 | #345 | Tragic 18.4% |
| Tlingit-Haida | 0.0 /100 | #346 | Tragic 20.7% |
Demographics Similar to Belgians by Unemployment Among Seniors over 75 years
In terms of unemployment among seniors over 75 years, the demographic groups most similar to Belgians are Iraqi (9.9%, a difference of 0.020%), Lithuanian (9.9%, a difference of 0.28%), Welsh (10.0%, a difference of 0.45%), Finnish (10.0%, a difference of 0.55%), and Puget Sound Salish (10.0%, a difference of 0.63%).
| Demographics | Rating | Rank | Unemployment Among Seniors over 75 years |
| Immigrants | Western Africa | 0.0 /100 | #292 | Tragic 9.8% |
| Norwegians | 0.0 /100 | #293 | Tragic 9.8% |
| Immigrants | Dominica | 0.0 /100 | #294 | Tragic 9.8% |
| Immigrants | Nonimmigrants | 0.0 /100 | #295 | Tragic 9.8% |
| Immigrants | St. Vincent and the Grenadines | 0.0 /100 | #296 | Tragic 9.8% |
| Cherokee | 0.0 /100 | #297 | Tragic 9.8% |
| Lithuanians | 0.0 /100 | #298 | Tragic 9.9% |
| Belgians | 0.0 /100 | #299 | Tragic 9.9% |
| Iraqis | 0.0 /100 | #300 | Tragic 9.9% |
| Welsh | 0.0 /100 | #301 | Tragic 10.0% |
| Finns | 0.0 /100 | #302 | Tragic 10.0% |
| Puget Sound Salish | 0.0 /100 | #303 | Tragic 10.0% |
| Scotch-Irish | 0.0 /100 | #304 | Tragic 10.0% |
| Swedes | 0.0 /100 | #305 | Tragic 10.0% |
| Italians | 0.0 /100 | #306 | Tragic 10.0% |