Tlingit-Haida vs Arab Unemployment Among Seniors over 75 years
COMPARE
Tlingit-Haida
Arab
Unemployment Among Seniors over 75 years
Unemployment Among Seniors over 75 years Comparison
Tlingit-Haida
Arabs
20.7%
UNEMPLOYMENT AMONG SENIORS OVER 75 YEARS
0.0/ 100
METRIC RATING
346th/ 347
METRIC RANK
9.5%
UNEMPLOYMENT AMONG SENIORS OVER 75 YEARS
0.2/ 100
METRIC RATING
276th/ 347
METRIC RANK
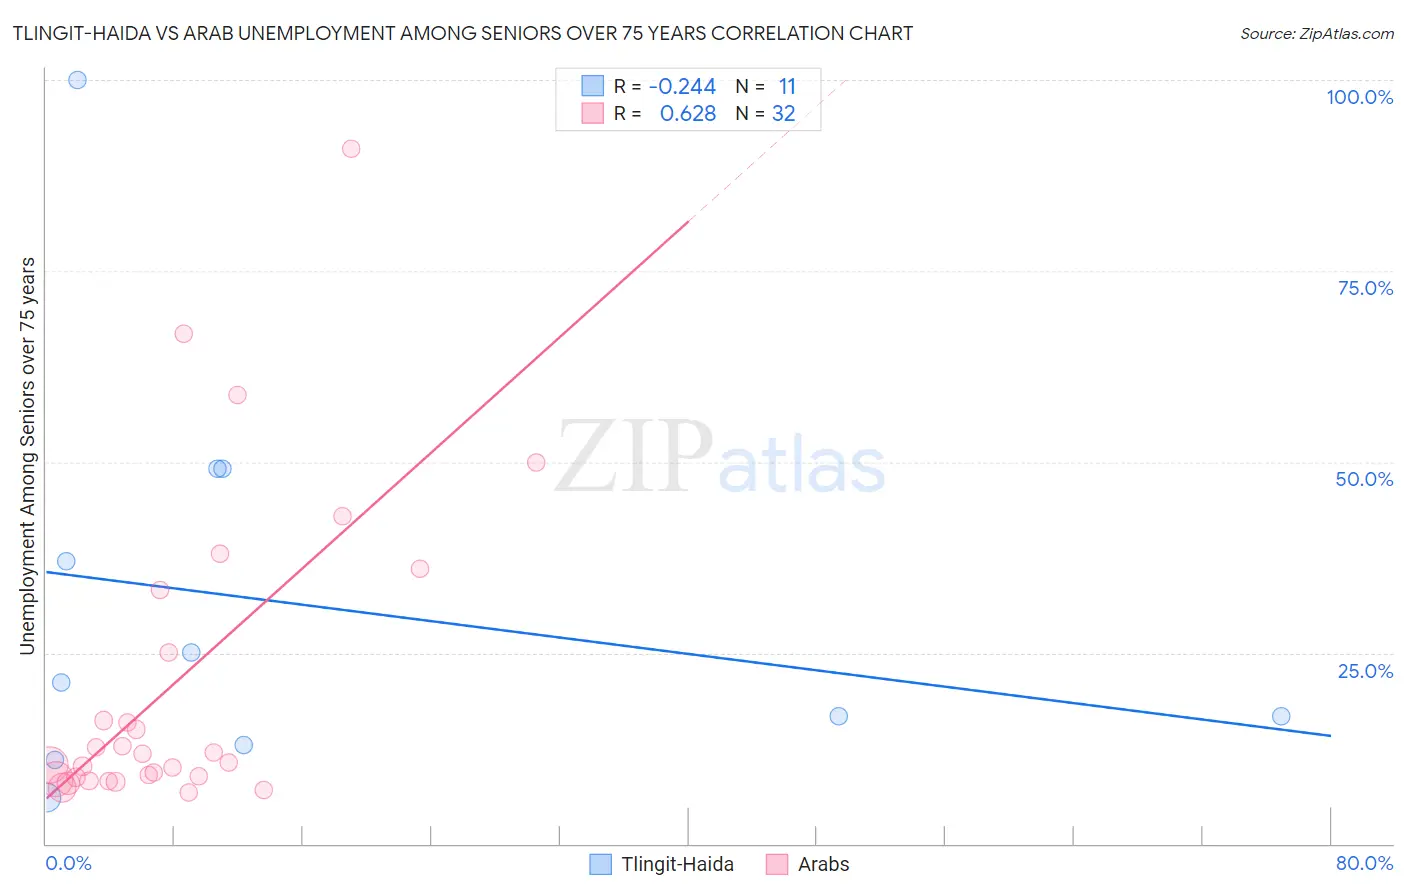
Tlingit-Haida vs Arab Unemployment Among Seniors over 75 years Correlation Chart
The statistical analysis conducted on geographies consisting of 44,675,055 people shows a weak negative correlation between the proportion of Tlingit-Haida and unemployment rate among seniors over the age of 75 in the United States with a correlation coefficient (R) of -0.244 and weighted average of 20.7%. Similarly, the statistical analysis conducted on geographies consisting of 225,172,972 people shows a significant positive correlation between the proportion of Arabs and unemployment rate among seniors over the age of 75 in the United States with a correlation coefficient (R) of 0.628 and weighted average of 9.5%, a difference of 118.7%.
Unemployment Among Seniors over 75 years Correlation Summary
| Measurement | Tlingit-Haida | Arab |
| Minimum | 6.1% | 6.8% |
| Maximum | 100.0% | 91.1% |
| Range | 93.9% | 84.3% |
| Mean | 31.3% | 21.1% |
| Median | 21.1% | 11.2% |
| Interquartile 25% (IQ1) | 13.0% | 8.6% |
| Interquartile 75% (IQ3) | 49.1% | 29.2% |
| Interquartile Range (IQR) | 36.1% | 20.6% |
| Standard Deviation (Sample) | 27.1% | 20.7% |
| Standard Deviation (Population) | 25.8% | 20.4% |
Similar Demographics by Unemployment Among Seniors over 75 years
Demographics Similar to Tlingit-Haida by Unemployment Among Seniors over 75 years
In terms of unemployment among seniors over 75 years, the demographic groups most similar to Tlingit-Haida are Yakama (18.4%, a difference of 12.6%), Immigrants from Yemen (16.5%, a difference of 25.8%), Alaska Native (14.7%, a difference of 41.4%), Hmong (13.7%, a difference of 51.0%), and Lumbee (13.5%, a difference of 54.1%).
| Demographics | Rating | Rank | Unemployment Among Seniors over 75 years |
| Alaskan Athabascans | 0.0 /100 | #333 | Tragic 11.0% |
| Assyrians/Chaldeans/Syriacs | 0.0 /100 | #334 | Tragic 11.1% |
| French Canadians | 0.0 /100 | #335 | Tragic 11.2% |
| Immigrants | North Macedonia | 0.0 /100 | #336 | Tragic 11.3% |
| Cape Verdeans | 0.0 /100 | #337 | Tragic 11.4% |
| Immigrants | Cabo Verde | 0.0 /100 | #338 | Tragic 12.3% |
| Cajuns | 0.0 /100 | #339 | Tragic 12.5% |
| Yup'ik | 0.0 /100 | #340 | Tragic 12.8% |
| Lumbee | 0.0 /100 | #341 | Tragic 13.5% |
| Hmong | 0.0 /100 | #342 | Tragic 13.7% |
| Alaska Natives | 0.0 /100 | #343 | Tragic 14.7% |
| Immigrants | Yemen | 0.0 /100 | #344 | Tragic 16.5% |
| Yakama | 0.0 /100 | #345 | Tragic 18.4% |
| Tlingit-Haida | 0.0 /100 | #346 | Tragic 20.7% |
Demographics Similar to Arabs by Unemployment Among Seniors over 75 years
In terms of unemployment among seniors over 75 years, the demographic groups most similar to Arabs are Senegalese (9.5%, a difference of 0.080%), Jamaican (9.5%, a difference of 0.29%), Czechoslovakian (9.4%, a difference of 0.41%), Swiss (9.5%, a difference of 0.50%), and Immigrants from Iraq (9.4%, a difference of 0.55%).
| Demographics | Rating | Rank | Unemployment Among Seniors over 75 years |
| Puerto Ricans | 0.3 /100 | #269 | Tragic 9.4% |
| Yaqui | 0.3 /100 | #270 | Tragic 9.4% |
| Bulgarians | 0.3 /100 | #271 | Tragic 9.4% |
| Immigrants | Iraq | 0.3 /100 | #272 | Tragic 9.4% |
| Czechoslovakians | 0.3 /100 | #273 | Tragic 9.4% |
| Jamaicans | 0.2 /100 | #274 | Tragic 9.5% |
| Senegalese | 0.2 /100 | #275 | Tragic 9.5% |
| Arabs | 0.2 /100 | #276 | Tragic 9.5% |
| Swiss | 0.1 /100 | #277 | Tragic 9.5% |
| Immigrants | Senegal | 0.1 /100 | #278 | Tragic 9.6% |
| British | 0.1 /100 | #279 | Tragic 9.6% |
| Croatians | 0.1 /100 | #280 | Tragic 9.6% |
| Bangladeshis | 0.1 /100 | #281 | Tragic 9.6% |
| Macedonians | 0.0 /100 | #282 | Tragic 9.6% |
| Immigrants | Nigeria | 0.0 /100 | #283 | Tragic 9.6% |