Somali vs Belgian Unemployment Among Seniors over 75 years
COMPARE
Somali
Belgian
Unemployment Among Seniors over 75 years
Unemployment Among Seniors over 75 years Comparison
Somalis
Belgians
8.8%
UNEMPLOYMENT AMONG SENIORS OVER 75 YEARS
45.3/ 100
METRIC RATING
176th/ 347
METRIC RANK
9.9%
UNEMPLOYMENT AMONG SENIORS OVER 75 YEARS
0.0/ 100
METRIC RATING
299th/ 347
METRIC RANK
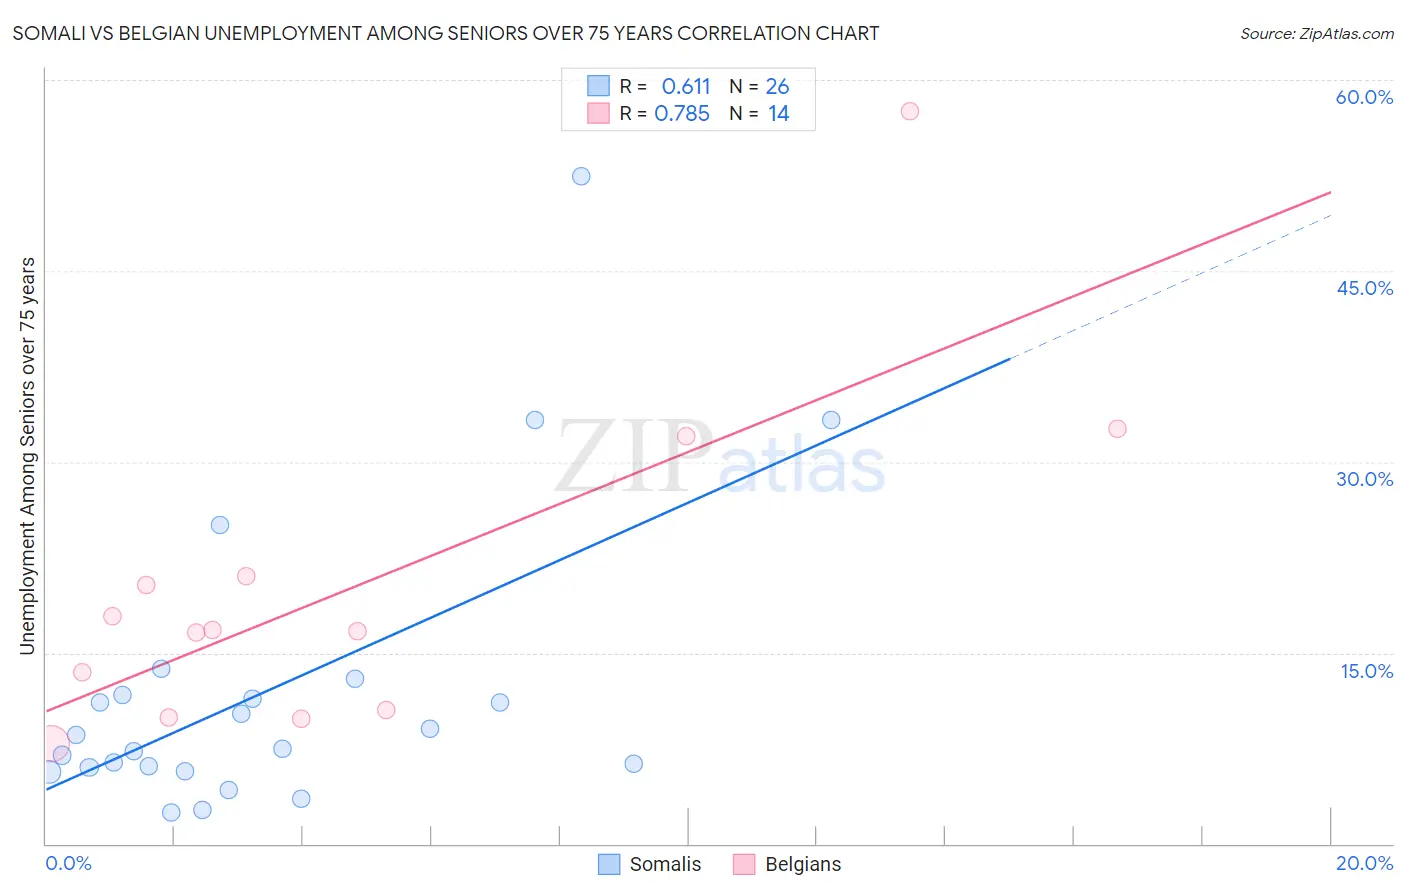
Somali vs Belgian Unemployment Among Seniors over 75 years Correlation Chart
The statistical analysis conducted on geographies consisting of 71,654,664 people shows a significant positive correlation between the proportion of Somalis and unemployment rate among seniors over the age of 75 in the United States with a correlation coefficient (R) of 0.611 and weighted average of 8.8%. Similarly, the statistical analysis conducted on geographies consisting of 184,859,103 people shows a strong positive correlation between the proportion of Belgians and unemployment rate among seniors over the age of 75 in the United States with a correlation coefficient (R) of 0.785 and weighted average of 9.9%, a difference of 13.0%.
Unemployment Among Seniors over 75 years Correlation Summary
| Measurement | Somali | Belgian |
| Minimum | 2.5% | 7.8% |
| Maximum | 52.4% | 57.5% |
| Range | 49.9% | 49.7% |
| Mean | 12.1% | 20.2% |
| Median | 8.0% | 16.8% |
| Interquartile 25% (IQ1) | 6.0% | 10.5% |
| Interquartile 75% (IQ3) | 11.7% | 21.0% |
| Interquartile Range (IQR) | 5.6% | 10.5% |
| Standard Deviation (Sample) | 11.5% | 13.1% |
| Standard Deviation (Population) | 11.3% | 12.6% |
Similar Demographics by Unemployment Among Seniors over 75 years
Demographics Similar to Somalis by Unemployment Among Seniors over 75 years
In terms of unemployment among seniors over 75 years, the demographic groups most similar to Somalis are Central American (8.8%, a difference of 0.11%), West Indian (8.8%, a difference of 0.19%), Immigrants from Italy (8.8%, a difference of 0.20%), Immigrants from Somalia (8.8%, a difference of 0.20%), and Syrian (8.7%, a difference of 0.23%).
| Demographics | Rating | Rank | Unemployment Among Seniors over 75 years |
| Fijians | 56.4 /100 | #169 | Average 8.7% |
| Zimbabweans | 54.1 /100 | #170 | Average 8.7% |
| Dominicans | 51.9 /100 | #171 | Average 8.7% |
| Immigrants | Immigrants | 51.8 /100 | #172 | Average 8.7% |
| Australians | 50.3 /100 | #173 | Average 8.7% |
| Immigrants | El Salvador | 49.7 /100 | #174 | Average 8.7% |
| Syrians | 49.6 /100 | #175 | Average 8.7% |
| Somalis | 45.3 /100 | #176 | Average 8.8% |
| Central Americans | 43.3 /100 | #177 | Average 8.8% |
| West Indians | 41.9 /100 | #178 | Average 8.8% |
| Immigrants | Italy | 41.7 /100 | #179 | Average 8.8% |
| Immigrants | Somalia | 41.7 /100 | #180 | Average 8.8% |
| Immigrants | Thailand | 40.2 /100 | #181 | Average 8.8% |
| Guatemalans | 39.5 /100 | #182 | Fair 8.8% |
| Immigrants | Afghanistan | 38.2 /100 | #183 | Fair 8.8% |
Demographics Similar to Belgians by Unemployment Among Seniors over 75 years
In terms of unemployment among seniors over 75 years, the demographic groups most similar to Belgians are Iraqi (9.9%, a difference of 0.020%), Lithuanian (9.9%, a difference of 0.28%), Welsh (10.0%, a difference of 0.45%), Finnish (10.0%, a difference of 0.55%), and Puget Sound Salish (10.0%, a difference of 0.63%).
| Demographics | Rating | Rank | Unemployment Among Seniors over 75 years |
| Immigrants | Western Africa | 0.0 /100 | #292 | Tragic 9.8% |
| Norwegians | 0.0 /100 | #293 | Tragic 9.8% |
| Immigrants | Dominica | 0.0 /100 | #294 | Tragic 9.8% |
| Immigrants | Nonimmigrants | 0.0 /100 | #295 | Tragic 9.8% |
| Immigrants | St. Vincent and the Grenadines | 0.0 /100 | #296 | Tragic 9.8% |
| Cherokee | 0.0 /100 | #297 | Tragic 9.8% |
| Lithuanians | 0.0 /100 | #298 | Tragic 9.9% |
| Belgians | 0.0 /100 | #299 | Tragic 9.9% |
| Iraqis | 0.0 /100 | #300 | Tragic 9.9% |
| Welsh | 0.0 /100 | #301 | Tragic 10.0% |
| Finns | 0.0 /100 | #302 | Tragic 10.0% |
| Puget Sound Salish | 0.0 /100 | #303 | Tragic 10.0% |
| Scotch-Irish | 0.0 /100 | #304 | Tragic 10.0% |
| Swedes | 0.0 /100 | #305 | Tragic 10.0% |
| Italians | 0.0 /100 | #306 | Tragic 10.0% |