Austrian vs Immigrants from Zaire Male Unemployment
COMPARE
Austrian
Immigrants from Zaire
Male Unemployment
Male Unemployment Comparison
Austrians
Immigrants from Zaire
4.9%
MALE UNEMPLOYMENT
98.9/ 100
METRIC RATING
47th/ 347
METRIC RANK
5.4%
MALE UNEMPLOYMENT
13.7/ 100
METRIC RATING
200th/ 347
METRIC RANK
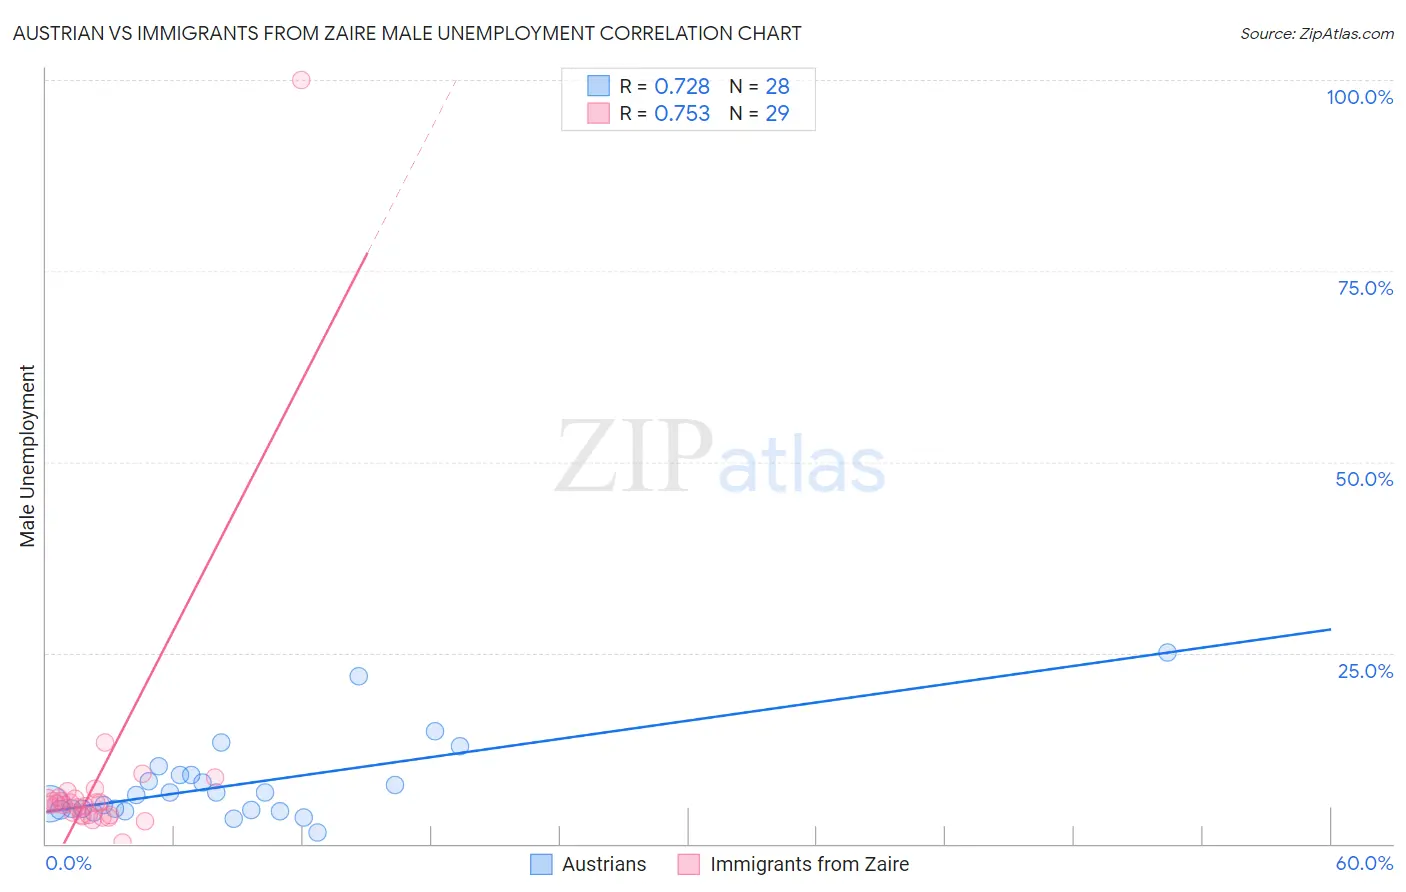
Austrian vs Immigrants from Zaire Male Unemployment Correlation Chart
The statistical analysis conducted on geographies consisting of 448,962,183 people shows a strong positive correlation between the proportion of Austrians and unemployment rate among males in the United States with a correlation coefficient (R) of 0.728 and weighted average of 4.9%. Similarly, the statistical analysis conducted on geographies consisting of 107,173,070 people shows a strong positive correlation between the proportion of Immigrants from Zaire and unemployment rate among males in the United States with a correlation coefficient (R) of 0.753 and weighted average of 5.4%, a difference of 9.9%.
Male Unemployment Correlation Summary
| Measurement | Austrian | Immigrants from Zaire |
| Minimum | 1.5% | 0.20% |
| Maximum | 25.0% | 100.0% |
| Range | 23.5% | 99.8% |
| Mean | 7.8% | 8.5% |
| Median | 6.6% | 5.3% |
| Interquartile 25% (IQ1) | 4.4% | 3.7% |
| Interquartile 75% (IQ3) | 9.0% | 6.0% |
| Interquartile Range (IQR) | 4.6% | 2.3% |
| Standard Deviation (Sample) | 5.4% | 17.7% |
| Standard Deviation (Population) | 5.3% | 17.4% |
Similar Demographics by Male Unemployment
Demographics Similar to Austrians by Male Unemployment
In terms of male unemployment, the demographic groups most similar to Austrians are Immigrants from Scotland (4.9%, a difference of 0.020%), Polish (4.9%, a difference of 0.030%), Croatian (4.9%, a difference of 0.040%), Bhutanese (4.9%, a difference of 0.070%), and Slovene (5.0%, a difference of 0.070%).
| Demographics | Rating | Rank | Male Unemployment |
| Northern Europeans | 99.3 /100 | #40 | Exceptional 4.9% |
| Chinese | 99.3 /100 | #41 | Exceptional 4.9% |
| Immigrants | Belgium | 99.2 /100 | #42 | Exceptional 4.9% |
| Immigrants | Japan | 99.2 /100 | #43 | Exceptional 4.9% |
| Immigrants | Korea | 99.1 /100 | #44 | Exceptional 4.9% |
| Immigrants | Zimbabwe | 99.0 /100 | #45 | Exceptional 4.9% |
| Bhutanese | 98.9 /100 | #46 | Exceptional 4.9% |
| Austrians | 98.9 /100 | #47 | Exceptional 4.9% |
| Immigrants | Scotland | 98.9 /100 | #48 | Exceptional 4.9% |
| Poles | 98.9 /100 | #49 | Exceptional 4.9% |
| Croatians | 98.9 /100 | #50 | Exceptional 4.9% |
| Slovenes | 98.8 /100 | #51 | Exceptional 5.0% |
| Irish | 98.8 /100 | #52 | Exceptional 5.0% |
| Jordanians | 98.8 /100 | #53 | Exceptional 5.0% |
| Yugoslavians | 98.7 /100 | #54 | Exceptional 5.0% |
Demographics Similar to Immigrants from Zaire by Male Unemployment
In terms of male unemployment, the demographic groups most similar to Immigrants from Zaire are Immigrants from Philippines (5.4%, a difference of 0.020%), Nonimmigrants (5.4%, a difference of 0.070%), Immigrants from Laos (5.4%, a difference of 0.080%), Immigrants from Greece (5.4%, a difference of 0.10%), and Immigrants from Thailand (5.4%, a difference of 0.12%).
| Demographics | Rating | Rank | Male Unemployment |
| Immigrants | Israel | 25.2 /100 | #193 | Fair 5.4% |
| Spanish | 19.7 /100 | #194 | Poor 5.4% |
| Immigrants | Southern Europe | 17.7 /100 | #195 | Poor 5.4% |
| Albanians | 17.3 /100 | #196 | Poor 5.4% |
| Alsatians | 16.7 /100 | #197 | Poor 5.4% |
| Immigrants | Thailand | 14.7 /100 | #198 | Poor 5.4% |
| Immigrants | Greece | 14.5 /100 | #199 | Poor 5.4% |
| Immigrants | Zaire | 13.7 /100 | #200 | Poor 5.4% |
| Immigrants | Philippines | 13.5 /100 | #201 | Poor 5.4% |
| Immigrants | Nonimmigrants | 13.1 /100 | #202 | Poor 5.4% |
| Immigrants | Laos | 13.0 /100 | #203 | Poor 5.4% |
| Guamanians/Chamorros | 12.3 /100 | #204 | Poor 5.4% |
| Immigrants | Costa Rica | 11.4 /100 | #205 | Poor 5.5% |
| Immigrants | Ukraine | 9.9 /100 | #206 | Tragic 5.5% |
| Immigrants | Syria | 9.3 /100 | #207 | Tragic 5.5% |