Subsaharan African vs Immigrants from Burma/Myanmar Unemployment Among Ages 16 to 19 years
COMPARE
Subsaharan African
Immigrants from Burma/Myanmar
Unemployment Among Ages 16 to 19 years
Unemployment Among Ages 16 to 19 years Comparison
Sub-Saharan Africans
Immigrants from Burma/Myanmar
18.7%
UNEMPLOYMENT AMONG AGES 16 TO 19 YEARS
0.4/ 100
METRIC RATING
251st/ 347
METRIC RANK
15.6%
UNEMPLOYMENT AMONG AGES 16 TO 19 YEARS
100.0/ 100
METRIC RATING
13th/ 347
METRIC RANK
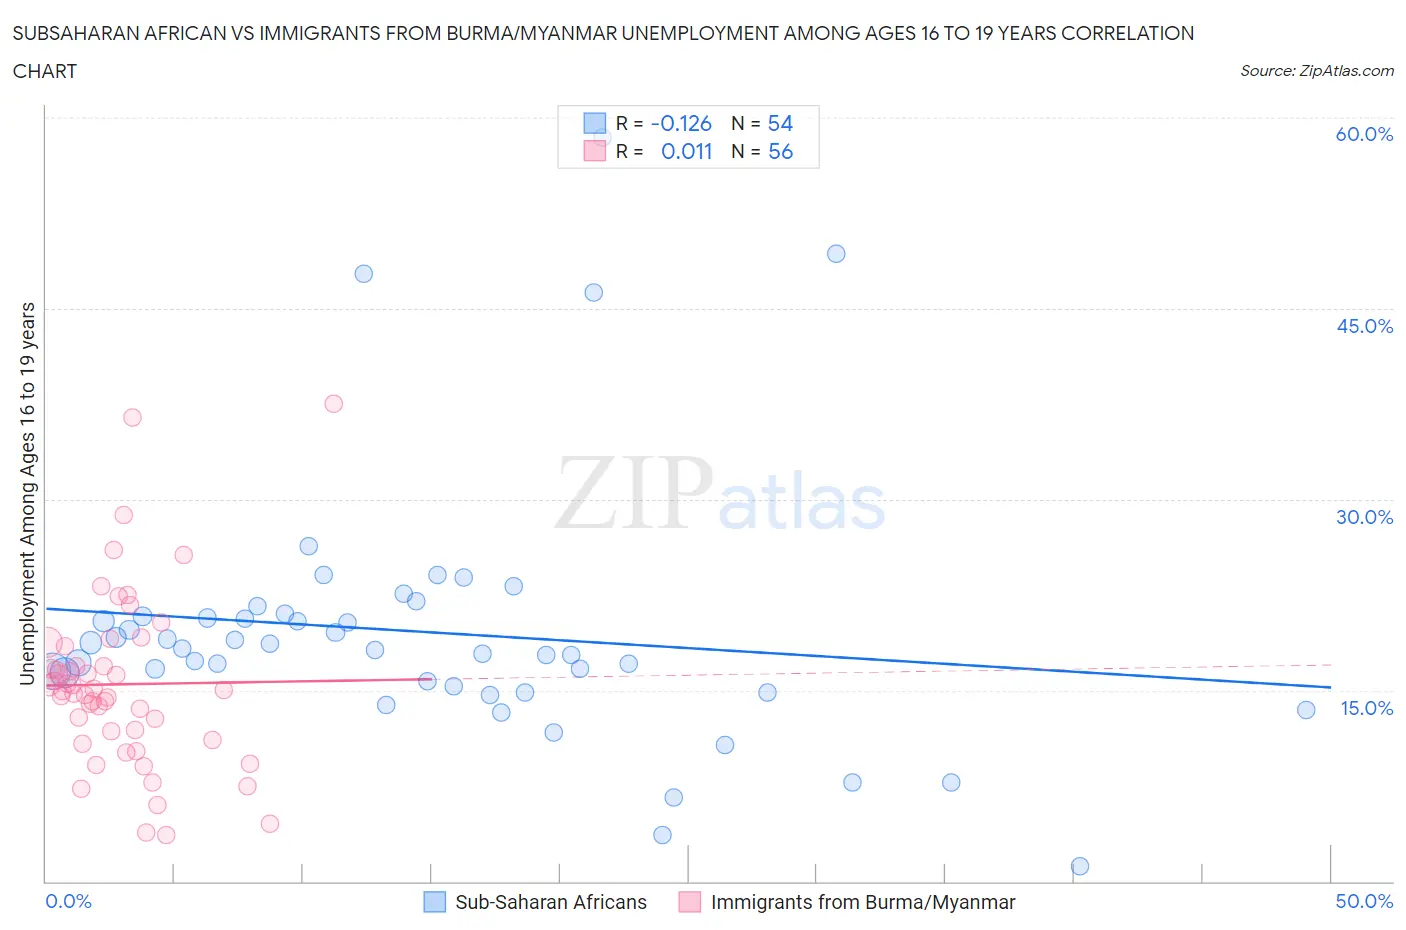
Subsaharan African vs Immigrants from Burma/Myanmar Unemployment Among Ages 16 to 19 years Correlation Chart
The statistical analysis conducted on geographies consisting of 472,169,930 people shows a poor negative correlation between the proportion of Sub-Saharan Africans and unemployment rate among population between the ages 16 and 19 in the United States with a correlation coefficient (R) of -0.126 and weighted average of 18.7%. Similarly, the statistical analysis conducted on geographies consisting of 168,780,503 people shows no correlation between the proportion of Immigrants from Burma/Myanmar and unemployment rate among population between the ages 16 and 19 in the United States with a correlation coefficient (R) of 0.011 and weighted average of 15.6%, a difference of 20.1%.
Unemployment Among Ages 16 to 19 years Correlation Summary
| Measurement | Subsaharan African | Immigrants from Burma/Myanmar |
| Minimum | 1.2% | 3.6% |
| Maximum | 58.4% | 37.5% |
| Range | 57.2% | 33.9% |
| Mean | 19.6% | 15.5% |
| Median | 18.2% | 15.0% |
| Interquartile 25% (IQ1) | 15.3% | 11.5% |
| Interquartile 75% (IQ3) | 20.8% | 17.7% |
| Interquartile Range (IQR) | 5.5% | 6.3% |
| Standard Deviation (Sample) | 10.2% | 6.8% |
| Standard Deviation (Population) | 10.1% | 6.7% |
Similar Demographics by Unemployment Among Ages 16 to 19 years
Demographics Similar to Sub-Saharan Africans by Unemployment Among Ages 16 to 19 years
In terms of unemployment among ages 16 to 19 years, the demographic groups most similar to Sub-Saharan Africans are Immigrants from Guatemala (18.7%, a difference of 0.030%), Panamanian (18.7%, a difference of 0.11%), Puget Sound Salish (18.7%, a difference of 0.22%), Delaware (18.7%, a difference of 0.28%), and Immigrants from Israel (18.7%, a difference of 0.31%).
| Demographics | Rating | Rank | Unemployment Among Ages 16 to 19 years |
| Guatemalans | 0.8 /100 | #244 | Tragic 18.6% |
| Immigrants | Belarus | 0.8 /100 | #245 | Tragic 18.6% |
| Immigrants | South America | 0.5 /100 | #246 | Tragic 18.7% |
| Immigrants | Israel | 0.5 /100 | #247 | Tragic 18.7% |
| Delaware | 0.5 /100 | #248 | Tragic 18.7% |
| Puget Sound Salish | 0.5 /100 | #249 | Tragic 18.7% |
| Panamanians | 0.4 /100 | #250 | Tragic 18.7% |
| Sub-Saharan Africans | 0.4 /100 | #251 | Tragic 18.7% |
| Immigrants | Guatemala | 0.4 /100 | #252 | Tragic 18.7% |
| Central Americans | 0.3 /100 | #253 | Tragic 18.8% |
| Apache | 0.3 /100 | #254 | Tragic 18.8% |
| Immigrants | Cameroon | 0.3 /100 | #255 | Tragic 18.8% |
| Mexican American Indians | 0.3 /100 | #256 | Tragic 18.8% |
| Immigrants | Nigeria | 0.2 /100 | #257 | Tragic 18.9% |
| Immigrants | Mexico | 0.2 /100 | #258 | Tragic 18.9% |
Demographics Similar to Immigrants from Burma/Myanmar by Unemployment Among Ages 16 to 19 years
In terms of unemployment among ages 16 to 19 years, the demographic groups most similar to Immigrants from Burma/Myanmar are Immigrants from Zaire (15.6%, a difference of 0.14%), Yugoslavian (15.6%, a difference of 0.20%), Taiwanese (15.5%, a difference of 0.43%), German (15.7%, a difference of 0.49%), and Indonesian (15.5%, a difference of 0.53%).
| Demographics | Rating | Rank | Unemployment Among Ages 16 to 19 years |
| Swedes | 100.0 /100 | #6 | Exceptional 15.3% |
| Immigrants | Bosnia and Herzegovina | 100.0 /100 | #7 | Exceptional 15.3% |
| Czechs | 100.0 /100 | #8 | Exceptional 15.4% |
| Scandinavians | 100.0 /100 | #9 | Exceptional 15.4% |
| Zimbabweans | 100.0 /100 | #10 | Exceptional 15.4% |
| Indonesians | 100.0 /100 | #11 | Exceptional 15.5% |
| Taiwanese | 100.0 /100 | #12 | Exceptional 15.5% |
| Immigrants | Burma/Myanmar | 100.0 /100 | #13 | Exceptional 15.6% |
| Immigrants | Zaire | 100.0 /100 | #14 | Exceptional 15.6% |
| Yugoslavians | 100.0 /100 | #15 | Exceptional 15.6% |
| Germans | 100.0 /100 | #16 | Exceptional 15.7% |
| Somalis | 100.0 /100 | #17 | Exceptional 15.7% |
| Thais | 100.0 /100 | #18 | Exceptional 15.7% |
| Swiss | 100.0 /100 | #19 | Exceptional 15.8% |
| Sudanese | 100.0 /100 | #20 | Exceptional 15.8% |